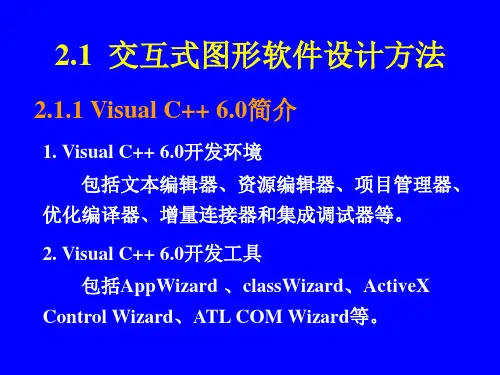
第二章 交互式绘图软件开发与设计
- 格式:ppt
- 大小:121.00 KB
- 文档页数:19


计算机软件使用教程之网页设计与交互第一章:网页设计基础知识在进行网页设计与交互之前,我们首先需要了解一些网页设计的基础知识。
网页设计是一个综合性的学科,涉及到色彩搭配、排版、图像处理等多个方面。
首先我们来了解一下几个常用的设计软件。
1. Adobe PhotoshopAdobe Photoshop是一款功能强大的图像处理软件,常用于网页设计中的图片处理与编辑。
通过Photoshop,我们可以对网页中的图片进行裁剪、调整大小、色彩修正等操作,以满足我们对于图片的需求。
此外,Photoshop还有一个重要的功能就是切片,即将整个页面切分成多个小块,这样可以使得页面的加载速度更快,提高用户体验。
2. Adobe IllustratorAdobe Illustrator是一款矢量图形编辑软件,常用于网页设计中的图标、标志等元素的设计。
相比于位图,矢量图形可以无限放大而不失真,因此在网页中使用矢量图形可以保证图形的清晰度和质量。
3. SketchSketch是一款专业的界面设计软件,被广泛应用于网页和移动应用的设计。
与Adobe系列软件相比,Sketch更加轻量级,功能简洁实用,适合进行快速原型设计和交互设计。
同时,Sketch还可以与其他设计工具相互配合,例如Zeplin、InVision等,提高工作效率。
第二章:网页设计常用的交互元素网页设计中的交互元素是指用户与网页进行交互的一些功能组件,例如导航菜单、按钮、表单等。
合理的交互元素设计可以提升用户的使用体验,下面我们来了解一些常用的交互元素。
1. 导航菜单导航菜单是网页设计中最基本的交互元素之一,它可以帮助用户快速定位到所需的信息。
在设计导航菜单时,需考虑菜单的位置、样式、交互效果等要素,以保证用户能够轻松找到所需的页面。
2. 按钮按钮是网页中常用的交互元素,它可以帮助用户完成特定的操作,例如提交表单、下载文件等。
在设计按钮时,需要注意按钮的样式、颜色、大小等,以及鼠标悬停和点击等交互效果,以增加用户的操作可感知性。
用VB开发交互式cad系统摘要本次毕业设计的任务是利用VB开发交互式cad系统中的图形的编辑部分。
设计具有交互绘图的功能。
能实现鼠标绘图、图元选择和编辑,具备图形输出功能。
实现交互式绘图过程涉及到图元的数学模型,数据管理、数据编辑等方面的知识和技巧。
图元的选择编辑的重点放在了图元的平移和旋转。
此外还设计了的启动窗口和窗口的显示。
交互式cad技术在办公、绘图平面设计、工业设计等方面都有很多应用。
关键字:交互式cad 图形的编辑窗口AbstractThis graduation project duty is develops in the interactive cad system the graph edition part. The design has the alternately cartography the function. Can realize the mouse cartography, a chart Yuan choice and the edition, has the graphical output function. Realizes the interactive cartography process to involve to the chart Yuan mathematical model, aspect the and so on data management, data edition knowledge and the skill. The chart Yuan choice edition key point has placed a chart Yuan translation and revolves. In addition also has designed start window and window demonstration. The interactive cad technology in aspect and so on work, cartography plane design, industrial design all has applies very much.Key words: Interactive cad graph edition Window目录第1章绪论 (5)第2章可行性研究 (6)2.1 问题定义2.2 可行性分析第3章总体设计 (7)3.1 总体规划3.2 开发环境和工具3.3 软件介绍3.4系统实现和设计主要分以下几个步骤第4章具体设计 (8)4.1具体设计的详细说明图 (9)4.2 图元的编辑 (10)4.3 图元的拾取与选择 (15)4.4 窗体的显示控制 (19)第5章心得体会 (20)参考资料 (21)第一章绪论对于大多数人而言,“交互式cad技术”是一个熟悉而陌生的概念,为什么这么说呢?因为您可能经常在使用这种技术,却没有意识到。


浅谈软件的交互式设计交互式设计是指通过人机交互,让软件界面变得更加人性化、易用、简洁,增强用户体验。
它是软件设计中至关重要的一部分,一个好的交互设计可以提高用户的满意度,降低用户的学习成本和使用成本,还可以让功能更加清晰明了,促进用户的沟通与互动。
但是,要想做一个好的交互设计,需要有一定的原则和技巧。
一、理解用户需求首先,要做好交互设计,就必须充分理解用户需求。
只有真正了解用户的习惯、行为和心理状态,才能更好地为用户设计出合适的界面。
因此,在交互设计的初期,必须要对用户进行详细地调查和研究,包括用户群的年龄、性别、文化水平等方面。
同时,也要关注用户日常工作和使用的场景,把握用户的使用习惯和行为特点,为用户提供更加便捷、易用的交互设计。
例如,针对老年人、残障人士等特殊人群,需要提供更加简单易懂、易于操作的界面设计;而对于年轻人来说,可以更加注重交互设计的时髦性、创新性等方面。
二、清晰简洁一个好的交互设计应该是清晰简洁的,让用户一眼就能看到自己需要的信息和功能。
在设计过程中,应尽可能减少界面元素的数量,注重设计中重点部分的凸显,这样不仅能让用户更加方便地找到所需要的信息,也能减少用户使用时的学习曲线。
此外,在交互界面设计过程中,还需要注意导航的简洁性和直观性。
在设计导航时,应尽可能减少分类,严格控制标签的数量和层次,让用户更加直观地找到自己需要的信息和功能。
三、符合习惯好的交互设计,要符合用户的使用习惯和认知规律,以降低用户的学习成本。
在设计时,应充分考虑用户在不同情境下的操作习惯,例如浏览网页时,使用者往往先看左上方的 logo;在输入框中搜索时,更喜欢搜索栏处于页面中央的设计。
与此相对应的是,交互界面的设计要尽可能减少用户的差错风险。
例如,在编写表单时,应该充分考虑用户的使用习惯和操作困难点,避免让用户填写复杂的信息,不仅增加用户的烦恼,还会对数据的准确性产生负面影响。
四、好的交互反馈好的交互设计,应该提供即时、直接的反馈,让用户在使用软件时获得即时的反馈信息。
Matlab交互式界面设计与开发方法导言:Matlab是一种功能强大的编程语言和数值计算环境,用于科学计算、数据可视化和算法开发。
在日常的工程和科学研究中,经常需要使用Matlab来进行数据处理、算法实现等任务。
然而,对于非专业的编程人员来说,Matlab的命令行界面可能并不直观和易于使用。
因此,我们需要设计和开发交互式界面,以便更方便地使用Matlab进行数据处理和算法实现。
一、Matlab的GUI开发工具Matlab提供了一些强大的GUI(图形用户界面)开发工具,使得用户可以轻松设计和开发各种交互式界面。
其中最重要的工具是GUIDE(Graphical User Interface Development Environment),它使用户能够通过可视化方式设计和布局界面元素,而无需编写代码。
二、使用GUIDE进行界面设计使用GUIDE进行界面设计非常简单,只需按照以下步骤操作即可:1. 打开Matlab并进入GUIDE工具;2. 选择创建新的GUI,然后选择基础布局(如单个面板、网格布局等);3. 在界面上添加所需的UI元素,如按钮、文本框、下拉菜单等;4. 设置每个元素的位置、大小和其他属性;5. 通过拖拽和调整元素之间的连接线来确定它们之间的交互关系;6. 编辑每个UI元素的回调函数,以实现用户与界面的交互。
三、Matlab的UI编程语言除了使用可视化界面设计工具,Matlab还提供了一种专门的UI编程语言,称为句柄图形(Handle Graphics)。
通过使用这个语言,用户可以更精细地控制界面元素的属性和行为。
四、处理用户输入在交互式界面设计中,处理用户输入是至关重要的。
Matlab提供了各种方式来处理用户输入,其中最常用的是回调函数。
回调函数是一种特殊的函数,当用户与界面交互时会自动触发执行。
用户可以在回调函数中编写相应的代码,以响应用户的输入。
五、界面美化和优化一个好的交互式界面不仅要具备良好的功能性,还应具备良好的视觉效果。
交互式数据可视化工具的设计与开发Chapter 1: Introduction to Interactive Data Visualization ToolsInteractive data visualization tools have revolutionized the way we analyze and present data. These tools provide users with the ability to explore data, discover patterns, and draw meaningful insights through visual representations. In this article, we will delve into the design and development of interactive data visualization tools, exploring their importance, key features, and the process involved in creating such tools.Chapter 2: Importance of Interactive Data Visualization ToolsInteractive data visualization tools play a crucial role in aiding decision-making processes by enabling users to comprehend complex data sets at a glance. These tools allow users to manipulate and interact with data in real-time, empowering them to make data-driven decisions effectively. In addition, interactive visualization helps in identifying trends, outliers, and correlations in the data, which might not be apparent with traditional static visualizations.Chapter 3: Key Features of Interactive Data Visualization Tools1. Dynamic and Real-time Updates: Interactive data visualization tools should provide real-time updates as users manipulate the data. This allows users to observe the effects of their actions immediately and gain instant insights.2. Filter and Drill-Down Options: Users should be able to filter data based on various parameters and drill down to specific subsets of data. This feature helps in exploring data from multiple dimensions and allows users to focus on particular aspects of interest.3. Interactivity and Exploration: Interactive data visualization tools should provide a range of interaction options, such as zooming, panning, and linking multiple visualizations. This encourages users to explore data from different perspectives, facilitating a deeper understanding of the underlying patterns.4. Customization and Personalization: Users should have the flexibility to customize visualizations based on their preferences and requirements. This includes the ability to change color schemes, chart types, and axis labels, among other visual elements.Chapter 4: Designing Interactive Data Visualization ToolsDesigning interactive data visualization tools involves considering several aspects, including data preparation, selecting appropriate visualizations, and creating an intuitive user interface.1. Data Preparation: Before designing a visualization tool, it is important to preprocess and clean the data to ensure accuracy and reliability. This may involve data cleaning, transformation, and aggregation to make it suitable for visualization.2. Choosing Visualizations: Based on the nature of the data and the insights to be derived, the most appropriate visualizations need to beselected. This could include charts, graphs, maps, or more complex visualizations like 3D representations or heatmaps.3. User Interface Design: The user interface should be intuitive and user-friendly, enabling users to easily interact with the data. Consideration should be given to the layout, navigation, and placement of interactive elements to provide a seamless experience for users.Chapter 5: Development of Interactive Data Visualization ToolsThe development phase involves implementing the design and functionalities outlined in the previous chapters. This requires proficiency in programming languages and libraries specifically designed for data visualization, such as D3.js, Tableau, or Plotly. Here are some key steps involved in the development process:1. Data Integration: The visualization tool needs to be able to connect with different data sources, whether it be databases, APIs, or local files. Integration capabilities should be developed to retrieve and update data seamlessly.2. Implementing Data Interaction: The selected visualizations should respond to user interactions, such as filtering, sorting, or zooming. This requires programming the tool to capture user actions and update the visualization accordingly.3. Testing and Optimization: Rigorous testing should be conducted to ensure the tool functions correctly across different browsers andplatforms. Performance optimization techniques may be applied to enhance the tool's responsiveness and scalability.Chapter 6: Case Studies and Success StoriesIn this chapter, we will explore successful examples of interactive data visualization tools. From financial analysis dashboards to healthcare analytics platforms, these case studies demonstrate the impact and effectiveness of interactive data visualization in various domains.Chapter 7: ConclusionInteractive data visualization tools have proven to be invaluable in helping users analyze and interpret complex data sets. By facilitating exploration, customization, and real-time updates, these tools empower users to make data-driven decisions effectively. The design and development of such tools require a deep understanding of data visualization principles, user interface design, and programming expertise. As technology evolves, the potential for interactive data visualization tools continues to expand, opening new avenues for data exploration and decision-making.。
软件开发实习中的用户界面设计和交互用户界面设计和交互在软件开发实习中扮演着重要的角色。
一个好的用户界面可以提高用户体验、吸引用户,并且对于软件的成功与否至关重要。
本文将介绍软件开发实习中用户界面设计和交互的重要性,并提供一些实用的技巧和建议。
一、用户界面设计的重要性用户界面是用户与软件之间的桥梁,它直接影响着用户对软件的使用体验和满意度。
一个好的用户界面能够提供直观、简洁、友好的操作方式,减少用户的学习成本和使用困惑,并且能够有效地引导用户完成所需的操作。
良好的用户界面设计还能够提高软件的可用性和易用性。
通过合理的布局、明确的标识和操作指导,用户可以更加方便地找到所需功能,完成操作,并且减少错误的发生。
这不仅可以减轻用户的压力,提高工作效率,还能够增加用户对软件的信任和满意度。
二、用户界面设计的原则1. 满足用户需求:用户界面设计应该基于对用户需求的深入理解。
开发人员应该积极与用户沟通,了解用户的工作流程和使用习惯,以便设计出更加贴合用户需求的界面。
2. 简单明了:界面应该尽量简洁明了,避免过多的功能和视觉混乱。
通过合理的布局、分类和标识,使用户能够迅速找到所需功能,并进行操作。
3. 一致性:界面设计应该保持一致性,即相同的操作在不同的情境中应该保持相同的方式,减少用户的学习成本和疑惑。
4. 反馈和引导:系统应该能够及时给予用户操作的反馈信息,告知用户操作是否成功。
在用户进行关键操作时,应该给予适当的引导和警示,避免用户出现错误操作。
5. 可访问性:用户界面设计应该考虑到不同用户的特殊需求,如视力障碍或运动障碍等。
合理的设计能够提高软件的可访问性,使得更多的人能够使用该软件。
三、用户交互设计的重要性用户交互设计是用户界面设计的核心内容之一,它关注用户与软件之间的双向交流和互动。
良好的用户交互设计能够提高用户体验,并且能够更好地满足用户的需求。
1. 任务导向:用户交互设计应该以任务为导向,关注用户在软件中需要完成的具体任务,提供直观的交互方式,减少用户进行无效操作的可能性。