测温监控系统软件说明书
- 格式:doc
- 大小:1.77 MB
- 文档页数:9
冰箱、冰柜温度无线监控系统软件使用手册唐山众智科技开发有限公司地址:河北省唐山市高新技术开发区大庆道86号电话:************************传真:************网址:邮编:063020E-mail:*************冰箱、冰柜温度无线监控系统软件使用手册一.安装1.1安装环境A:硬件环境:●计算机采用工业控制计算机或服务器;●必须安装声卡、音箱;●最低需求采用P4以上级别CPU、512M内存、40G以上硬盘,推荐 CUP主频1.8GHz以上、1G以上内存;●显示器分辨率为1024×768的显示模式。
B:软件环境:●操作系统:Window2000\XP\2003;●系统软件:IIS信息服务管理系统 5.0及以上版本(网络版需求),.netFramework2.0,SQL SRVER2000、SQL SERVER2005数据库,默认使用SQL SERVER 2005 EXPRESS;1.2安装步骤1.2.1安装.NET、SQL Server及冷链无线温度监控系统软件本安装程序会自动将.net软件以及SQL Server数据库自动安装到系统中。
运行安装盘中“setup.exe”文件根据提示安装应用软件。
点击图标,安装程序弹出如下窗口:图1.2.1-1 .net安装窗口点击按钮,弹出SQL Server安装窗口,如下图:图1.2.1-2 SQL Server安装窗口点击按钮,系统开始安装,NET及SQL Server软件,这个过程需要一段时间,请耐心等候。
.NET及SQL Server软件安装完成后,安装程序会继续安装冷链无线温度监控系统,如下图:图1.2.1-3 冷链无线温度监控系统点击按钮,选择安装程序的路径,如图图1.2.1-4 选择路径窗口点击按钮,弹出确认安装窗口,继续点击按钮,安装程序安装完成,如图1.2.1-6所示:图1.2.1-5 确认安装窗口图1.2.1-6 安装完成窗口安装软件后需要确保数据库操作用户具有安装目录的写入权限,否则运行程序时,可能不能正确附加数据库。
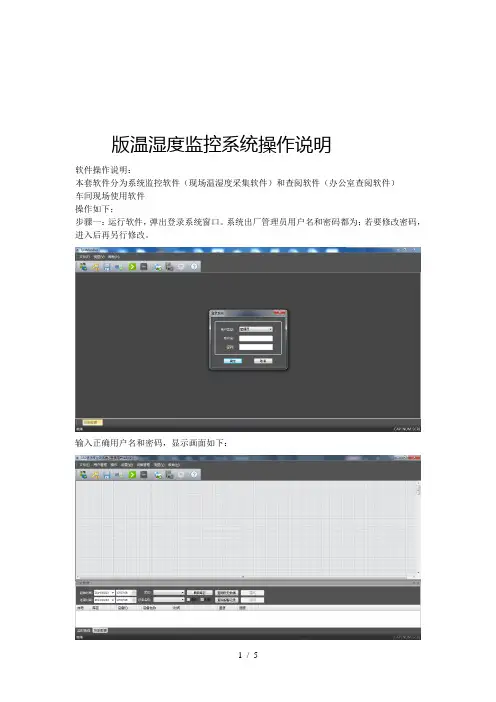
版温湿度监控系统操作说明软件操作说明:本套软件分为系统监控软件(现场温湿度采集软件)和查阅软件(办公室查阅软件)车间现场使用软件操作如下;步骤一:运行软件,弹出登录系统窗口。
系统出厂管理员用户名和密码都为;若要修改密码,进入后再另行修改。
输入正确用户名和密码,显示画面如下:在软件格子条纹框内,右键→新建设备,跳出如下设备属性输入框;注意事项:设备每个设备都不一样。
车间内如果有个探头,那么探头对应的应该为号。
每个部门的设备都是从号开始。
设备不可重复,依次新建设备。
设备类型(贵司类型均为)设备名称自行修改(对应探头地方) 显示在设备显示屏左上角第二个数字单通道设备全部设置为探头 不用输入双击设备,弹出下列属性框。
白色部分为可修改:保存间隔;设置成为,所有数据则是半个小时保存一次。
从开始采集开始算。
如果是中午:开始采集,数据就会:保存一组,:保存一组,一直到软件停止运行。
属性框设置温湿度上下限,超出范围,大屏上数值变红色,并一直显示超限设备数值。
按照各个库请自行设定好温湿度上下限。
修改好之后,请点击保存。
以上设置好之后,请点击保存配置文档,否则,下次打开软件,要重新输入设置通讯设置红色部分为,无线数据接收器接入端口,波特率为(固定为)蓝色部分为,数据备份到指定文件夹,可以选择,软件采集后,数据自动会存到文件夹中,电脑断电,数据会自动保存,不会丢失。
以上设置结束,点击开始采集。
打印数据步骤:视图→点击历史数据→选择起始时间和结束时间→刷新库区→库区选择所有库区→所有设备→点击列表→查询历史数据,点击打印,打印之前可以预览下,点数多,可以分纵向和横向打印;打印标题自行修改。
以上,如有疑问,联系说明归深圳市拓普瑞电子所有。


非制冷焦平面热像仪DM60_Client用户手册浙江大立科技股份有限公司© 2007 DALI TECHNOLOGY声明浙江大立科技股份有限公司版权所有,保留一切权利。
内容如有改动,恕不另行通知!目录1.软件应用范围 (1)1.1软件应用对象 (1)1.2计算机及软件配置要求 (1)2.软件操作说明 (1)2.1软件启动 (1)2.2软件说明 (2)2.2.1软件连接步骤 (2)2.2.2快捷键及操作说明 (4)2.2.3按键及操作说明 (5)2.3系统设置 (8)2.4监控录像回放软件 (11)3.故障分析与排除 (13)4.公司联系方式 (14)1.软件应用范围1.1 软件应用对象DM60_Client为DM60-S仪器网络通讯(RJ45)配套演示软件,仅供客户通过计算机网络使用DM60-S仪器。
1.2 计算机及软件配置要求硬件配置1、Pentium II 以上的微型计算机2、内存128M以上3、硬盘50M以上4、Direct 3D声卡3、支持DirectX的独立显卡(32M以上)4、网卡(10/100M)软件配置1、支持Microsoft的Windows 2000/XP/2003操作系统2、安装DirectX 8 以上2.软件操作说明2.1软件启动确认系统连接正确后,接通仪器端电源,双击启动软件,界面如图2.1:图2.12.2软件说明2.2.1软件连接步骤图2.2213界面操作区间共有4个,也就是说可以同时连接四个设备,并对当前选中的一个界面进行操作。
选取其中一个界面,双击,界面便放大为只有一个设备的画面出现在软件上面。
下面以左上角的区间1作为演示说明。
第一步:选取监控区域。
鼠标左键选取监控区域1,然后点击右键。
如图2.3:图2.3第二步:在弹出的菜单中,选择“系统设置”。
即可设置当前窗口的各种参数,如IP地址、图像数据存储路径以及报警设置和比辐射率等,详见下面“系统设置”说明。
电力温度在线监测系统说明书 YGWT-2008第一部分公司简介保定市屹高电气有限公司位于保定市国家高新技术产业开发区, 是专业从事电力系统产品研发、生产和销售的高技术企业。
企业从创建开始,就一直坚持服务电力行业、满足客户需求和技术创新的原则,秉承“真诚服务,创造价值”的经营理念,不断致力于电力系统自动化领域的开拓及发展。
公司崇尚以市场为导向, 以科技求发展、以服务做保障的宗旨, 在通过深入了解客户需求的基础上, 以不断进行创新的产品适应国家飞速发展的电力工业; 同时在产品的生产过程中, 恪守质量是企业生命的观念, 以完善的质量管理体系严把产品质量关, 公司现有产品经国家权威部门检验, 各项技术指标均达到标准要求。
企业始终贯彻为客户创造最大价值的服务方针, 并以科学严格的管理、严谨求实的作风、先进实用的技术来服务电力系统用户。
我们在售前、售中、售后三个方面向用户郑重承诺, 保证以最快捷、最周到的服务来满足客户需求。
技术特色1. 技术成熟、运行可靠,专利产品,并通过电科院相关检测。
2. 设备已经成功运行在上百座 500KV~35KV变电站达四年以上,为电力系统成功发现多处隐患, 取得良好的经济效益和社会效益, 为状态检修提供直接依据, 助力智能电网建设。
3. 温度传感器与测温主机采用分体设计,测温主机距离发热源 30cm 以上,测温主机与母排之间有 2mm 以上缝隙,确保主机工作在 85度一下,提高设备可靠性。
4. 测温终端独特设计的半球形以及环形结构,不影响电场分布,不影响绝缘性能。
5. 信号远距离传输, 穿透能力强。
典型应用距离 800米以上, 满足常见 500KV 变电站站内通讯要求。
信号能够穿透高压开关柜、箱式变、金属门屏蔽等。
6. 测温终端独特设计的半球形以及环形结构,不影响电场分布,不影响绝缘性能。
7. 防护等级满足 IP68,能满足户外全天候运行,测量精度可达±0.5℃。
8. 采用接收装置和无线测温终端 1:N 模式,配置灵活,施工方便无需布线。
温湿度监控系统操作使用说明一、系统简介温湿度监控系统是一种用来实时监测和记录环境温度和相对湿度变化的系统。
该系统通过传感器检测环境温湿度,并将数据传输到监控中心进行实时显示和记录。
系统具有高精度、高稳定性、易操作等特点,适用于各种场所和环境。
二、系统组成1.传感器:用于检测环境的温度和湿度。
2.集控器:接收传感器数据并传输到监控中心。
3.监控中心:显示和记录传感器数据,提供报警功能等。
三、系统安装1.传感器安装:选择合适的位置安装传感器,注意避免阳光直射、水汽等影响温湿度测量的因素。
传感器应固定牢固,避免震动和干扰。
2.集控器安装:将集控器与传感器通过正确的接口连接起来,确保连接稳定。
集控器应安装在通风良好、温度适宜的地方。
3.监控中心安装:安装监控中心软件并按照说明进行设置,确保能够与集控器通信。
四、系统操作1.开机操作:按照监控中心软件的指引启动系统,确保传感器和集控器正常连接,并显示传感器的温湿度数据。
2.数据监测:监控中心会实时显示传感器采集到的温湿度数据,包括当前数值、最高值、最低值等信息。
可以通过图表等形式进行查看和分析。
3.数据记录:系统会将传感器数据保存到数据库中,用户可通过查看历史数据来了解温湿度变化的趋势。
可以根据需要设置保存的时间间隔和记录的数量。
4.报警功能:监控中心可以设置温湿度的报警阈值,当传感器检测到温湿度超出设定的范围时会自动报警,提醒用户进行处理。
报警方式可以通过声音、弹窗、短信等形式进行设置。
5. 数据导出:系统可以将数据导出为Excel或其他格式的文件,方便用户进行数据分析和报表制作。
6.系统设置:监控中心提供一些系统参数的设置选项,用户可以根据需要进行调整,如显示单位、报警阈值、报警方式等。
五、系统维护1.定期校准:传感器的准确度会随着时间的变化而降低,建议定期对传感器进行校准,确保温湿度的测量结果准确可靠。
2.清洁保养:定期清洁传感器和集控器,保持设备的良好状态,避免尘埃或污物的积累对测量结果的影响。

HY-2005B红外智能体温监测系统软件产品使用说明书十分感谢您选择我们的产品,建议您在使用本热像仪前仔细阅读说明书,相信会对您正确使用本产品有很大帮助。
目录第一篇概述 (1)第二篇软件安装说明 (2)2.1 安装运行必备环境 (2)2.2 安装数据库 (2)2.3 安装客户端软件 (3)2.4 安装录像编解码器 (3)第三篇软件功能说明 (5)3.1 显控主界面 (5)3.2 网络配置 (7)3.3 视频调节 (8)3.4 测温参数配准 (9)3.4.1 配置屏蔽区域 (9)3.4.2 配置黑体区域 (11)3.4.3 配置校准区域 (12)3.4.4 配置温度曲线 (13)3.5 高级应用配置 (15)3.6 历史记录浏览 (16)第一篇概述HY-2005B红外人体表面温度快速筛检仪是集先进的光电子技术、热成像技术、图像处理技术和控制技术于一体的高科技产品。
该仪器具有测温灵敏度高、热图像直观、探测范围广、速度快、不干扰被测目标、使用安全等特点,该系统核心元件是进口的非制冷焦平面探测器,温度分辨率可达到0.07℃,寿命可达4万小时。
只需被测目标在红外镜头探测器范围内快速经过,仪器立即显示人体热图像和最高体温标度,操作人员即可获得准确的数据。
若遇到可疑发热病人,仪器会立即报警,有效的防止了操作人员与人流的交叉感染。
HY-2005B红外人体表面温度快速筛检仪具有以下系统特点:✧ 快速性。
被测人流经过检测区域,1秒钟就能检测出人体温度。
✧ 非接触式远距离测量。
被检测者在离镜头6-8米处接受体温测量,不易引起被测者的反感和恐慌。
监测者可在更远的操作台,避免交叉感染。
✧ 灵敏性。
该仪器温度分辨率可达0.07℃,适合在人流量大的区域远距离对人群进行搜索和检测,准确找出其中发烧病人。
✧ 隐蔽性。
可在被检测对象完全不知情的情况下进行测温,有利于保证机场、港口、火车站等重要部门正常的工作秩序。
✧ 外围丰富的数字化接口。

GS-HG高速型窑胴体温度计算机实时监测系统软件操作使用说明书目录一、软件应用概述................................... 错误!未定义书签。
二、软件运行环境................................... 错误!未定义书签。
三、软件组成与建库................................. 错误!未定义书签。
四、软件界面配置................................... 错误!未定义书签。
五、软件操作及分析................................. 错误!未定义书签。
六、软件可选功能使用说明........................... 错误!未定义书签。
七、软件网络功能的设置与使用方法................... 错误!未定义书签。
一、软件应用概述回转窑是水泥和冶金等行业物料煅烧的关键工艺设备, 窑内的窑衬是回转窑生产中优质、高产、低消耗和长期安全运转的关键因素, 因温度过高, 热振荡过大会严重损坏窑衬和窑胴体。
窑胴体温度计算机实时监测系统是防止窑衬及窑胴体损坏, 保证回转窑安全可靠的运行, 实现回转窑经济运行的重要监控设备。
经过智能机电一体化的红外测温仪对胴体表面温度进行实时检测, 并将数以万计的温度信息实时输入计算机, 然后经过窑胴体温度计算机实时监测系统进行处理和分析, 最终以图文并茂的形式迅速地揭示由窑胴体表面温度所”携带”的大量的窑内工况信息。
这些信息对设备的正常运转, 稳定工艺工况具有十分重要的意义, 该系统的使用, 能够有效的改进窑的操作, 稳定窑的工况, 从而达到提高运转率, 增加产量, 实现窑经济运行的目的。
二、软件运行环境窑胴体温度监控及在线分析系统采用面向对象程序设计语言Delphi、并在其中嵌入汇编语言编程。
汇编语言主要用于编写与下位机通信程序( 下位机为单片机计算机系统) 、下位机数据采集处理、并对智能机电一体化的红外测温仪运行进行控制; Delphi语言用于编写图形图像处理及在线分析。
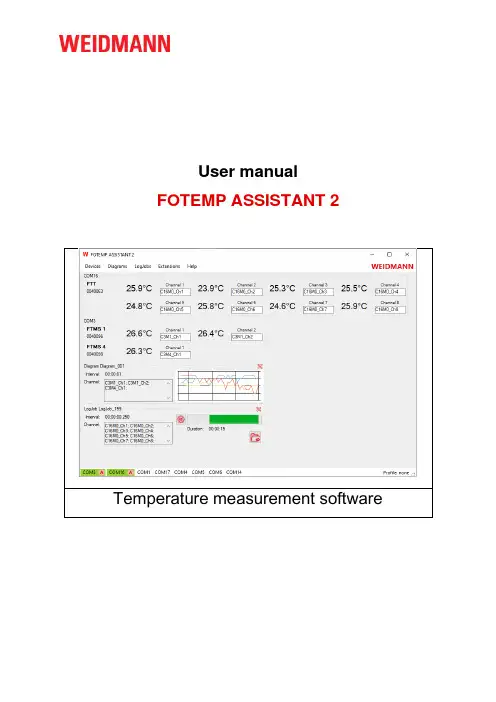
User manualFOTEMP ASSISTANT 2 Temperature measurement softwareContact information and support Global technical supportEmail:****************************Weidmann Technologies Deutschland GmbHWashingtonstrasse 16/16a01139 Dresden, GermanyTD +49 351 843 599 0Copyright © 2022 by Weidmann. All rights reserved.Reproduction without written permission is prohibited.Specifications are subject to change without notice.Version: 1.0.1Revised: Januar 2022Table of contentsTable of contents1Introduction __________________________________________________________________ 41.1Conventions used in this manual ................................... Fehler! Textmarke nicht definiert.1.2Accompanying documentations (4)1.3Warranty (4)2Product description ____________________________________________________________ 52.1Requirements for hardware (5)2.2Functionality (5)3Requirements of software _______________________________________________________ 54Software _____________________________________________________________________ 54.1Main window (5)4.2Menu “Devices” (6)4.3Menu “Diagrams” (7)4.4Menu “LogJobs” (8)4.5Menu “Help” (9)4.5.1Options - System (10)4.5.2Options - Profiles (10)4.5.3Options - Device Search (11)4.5.4Options - Protocol (11)4.6Add-Ons (12)4.6.1Add-In “Calibration” (13)4.6.2Add-In “Spectrum” (13)Introduction1 IntroductionThank you for using a FOTEMP temperature measurement system. In combination with the TS temper-ature sensors, FOTEMP and InsuLogix® T offers reliable and proven online temperature monitoring. For safe and proper use, carefully read the user manual and all accompanying documentation and keep instructions for further reference.Further information can be found on our website https:///1.1 Accompanying documentationsThe following accompanying documentation is also relevant to using the FOTEMP ASSISTANT 2 in addition to this user manual:•Cleaning tool instruction manual (provided together with the cleaning tool if ordered)•Handling instruction for fiber optic cables and sensors (provided together with the cable or sensor) •Power supply instructions (provided together with power supply)1.2 WarrantyWeidmann makes no warranty concerning the software, since the software and the communication pro-tocol is available for free. The warranty is void in the event of abuse, e.g. failure to follow recommended operation procedures or failure by the customer to perform as specified in the instruction manual.Product description2 Product description2.1 Requirements for hardwareTo unpack and inspect your InsuLogix® T temperature measurement system, perform the following steps:1. Carefully unpack all components.2. Store the packing material until you have inspected all components.3. Check if you received all items listed on the enclosed packing list.4. Inspect the items for damage.5. If you note any damage or suspect damage, immediately contact Weidmann.2.2 FunctionalityMain product featuresLoggingDiagramSettingDisplay3 Requirements of softwareThe download package contains an installer for Windows. Prerequisites are Windows® 7 and 4.6. Admin rights are needed for installation only.4 Software4.1 Main windowFigure 1: Sample screen with explanation of software elementsFigure 2: Sample screen with explanation of software elementsThe main window operates as a display for the measurement channels of connected the FOTEM devices. It also shows diagrams and logging information if logging is enabled. Also the connection status of active devices can be checked during runtime.From the main window the configuration dialog of connected devices can be started. Scans for de-vices can be started, single channels can be activated or deactivated. Diagrams or logging can be paused, restarted or deleted.The main window also allows to store or reload the user settings in profiles.Nr Element Description1 Navigation Main menu of the program2 Progress bar Displays the progress while searching for new devices3 COM ports Holds all available COM ports and display their status and used protocol 4ProfileShows the actual profile4.2 Menu “Devices ”SymbolEntryDescriptionSearch• Single Port Search• Search for Ascii Devices • Search for Modbus DevicesDifferent options to search for new devicesSettings Control center for FOTEMP devicesHidden List the hidden devices.Profiles• Load • SaveLoad or Save your preferred Profile settings.SymbolEntryDescriptionAdvanced•Modbus Broadcasto Intercom Ono Intercom Off Advanced functions for FOTEMP device con-trol.The menu “Devices” allows to execute device searches.A “Single Port Search” can search FOTEMP devices on a specific user-given COM port. A possible result are one to 255 devices listed in the main window.“Search for Ascii Devices” iterates through all existing COM ports of the PC. On each COM port it is tested if a modular FOTEMP system (e.g. “FTMS”) or a non-modular device (“OEM”, “OEM-PLUS”, “FT-MINI”, “FOTEMP-T2”) is answering.“Search for Modbus Devices” iterates through all PC’s COM ports asking via Modbus protocol for avail-able devices.Especially for the Modbus protoc ol, the menu item “Modbus Br o adcast” was introduced. In the special case of the FOTEMP T2 in its 9-16 channel version:This FOTEMP device contains two Modbus devices in one housing. Device one contains channels 1-8 and device two contains channels 9-16. Both internal devices talk to eachother to show all temperature values on one display. To use FOTEMP Assistant with this device, the internal communication must be switched off. So the command “Modbus Broadcast –Intercom Off” must be executed. After succes sful execution, the device’s display shows “REMOTE” on channels 9-16. For setting the device back to standalone mode (measuring on all channels without software interaction) execute the command “Mod-bus Broadcast –Intercom On”.In general, if an answer was received in an appropriate time (see Options dialog), the measurement channels of the device will be listed in the main window.4.3 Menu “Diagrams”Symbol Entry DescriptionNew Diagram…Opens a menu to setup a new diagram.Load Diagram Open a window to display stored data.Figure 3: Sample screen with explanation of software elementsThe menu entry “New Diagram” wants to measure and show measured values. Therefore it needs to know the desired channels. The user is asked via the dialog in Figure 8, which channels shall be shown in the diagram. Choose multiple channels holding shift key and use the One-Arrow icon to transfer the list entries from the left to the right box. Enter a name, an interval into the textboxes and press the “Apply” button. If channels are selected (single channel with the One-Arrow icon, all channels with the Two-Arrow icon), the diagram is added to the main window. Here the user has the chance kill the dia-gram or to double-click on the box to open a separate window.The separate window shows current measurement values as time-series and has two menu icons. The most left icon let the user create an additional time-series for calculated values (adding, substract-ing, … channels). The right most icon let the user save the diagram as PNG picture or CSV.Attention :Initially the diagram is used to show measured values. It does not store the values somewhere but in internal memory. The save command in the separate diagram window stores existing already drawn values only.4.4 Menu “LogJobs ”SymbolEntryDescriptionNew LogJob …Opens a menu to setup a new LogJob.Figure 4: Sample screen with explanation of software elements“LogJobs” are tasks which have another priority than diagrams. Use them if the measurement is fixed and there is a need to prove something to be working. Instead of drawing and maybe storing the meas-ured data, the LogJob stores the values with higher priority in the given file. Additionally a diagram can be set up to also watch the values during logging.LogJobs can measure as fast as the device and the PC allows when the option “Contious (250ms)” is chosen. Any parallel diagram will then slow down the sampling. Otherwise a period can be set up. When overnight or defined periods are to be logged, the Option “Duration” can be setup accordingly.4.5 Menu “Help ”The Help menu contains the software options for loggin and hardware interfaces.SymbolEntryDescriptionOptionsParameters of the software.About4.5.1 Options - SystemFigure 5: Sample screen with explanation of software elementsThe Option menu command allows access to parameters for the software system.For files in CSV format, the separator and the default file location can be setup. “Ask before closure” defines, if running Diagrams or LogJobs are closed automatically if the user closes the software or if a warning will appear. When a new LogJob is started, option “Clear Logs Automatically” defines the status of previous data.4.5.2 Options - ProfilesFigure 6: Sample screen with explanation of software elementsProfiles contains active COM ports (hardware setup) and hardware’s serial number. They can be stored as XML files for later use or reuse in repeated measurements in the desired directory. They can auto-matically loaded for saving the initial scan process.4.5.3 Options - Device SearchFigure 7: Sample screen with explanation of software elementsThe “Device Search” optio ns allow to enable or disable time consuming search for addressable FTMS devices. Also the maximum available address can be defined to restrict the searching address space from 1-255 down to the more appropriate range of 10 or less.If “Automated Device Search is “Activated”, the COM ports of the PC are scanned each 5 seconds for new devices. During running measurements, this can be a bad option for timing accuracy.4.5.4 Options - ProtocolFigure 1: Sample screen with explanation of software elementsThe options of “Protocol” allow to adjust the search process for retrying scans or changing the search timeouts.4.6 Device ConfigurationFigure 9: Device settingsEach connected device speaking ASCII protocol can be set up by the user as Figure 9 shows. After a connected device is chosen in the “Device” combobox, system values like Serial Number, Firmware version, analog output interface or logging information are r ead. The sections “Output” and “Logging” are only shown, if a device supports these features. Otherwise these spaces are blank.For each channel of the chosen device the following values are read out and shown. If analog output and relay features are given by the device, their switching border levels are shown too. The channels can be enabled or disabled. The state that all channels of a device are switched off is invalid and the software will automatically re-enable channel 1.A green backcolor of a textbox shows that the value is the same as in the device memory.4.7 Add-OnsIn November 2021 version 2.3 of “FOTEMP Assistant 2” was released with two Add-Ins for manimulat-ing the calibration table stored in a device and another one checking the spectrum of a sensor signal. Both releases are in Alpha stage of the development. Using them to manipulate the calibration data voids the warranty.4.7.1 Add-In “Calibration”Figure 9: Add-In “Calibration”For using add-In “Calibration” one has to choose the connected device in the upper Combobox, there-fore no diagram nor LogJob may run. If the desired device is chosen, the window presents serial number, firmware version and the used sensor data of the device. It reads the channels calibration table of the channel shown in the right upper textbox “Channel”. The background color must be green to show validity of data. 16 data pairs can be stores in the device. Changing the values in the table and pressing the write button will store the table values (all at once) in the device memory (upper left red icon). Read-ing the values from the device again will be done pressing the upper right red button. Storing and reading data from/to disk happens by using the lower red icons (left: store table to disk, right: read table from disk).4.7.2 Add-In “Spectrum”Figure 10: Add-In “Spectrum”When chosen the intended device and after that the channel, this add-in allows to see the reflected input signal of the spectrometer switched to the chosen channel. Using a reference lamp, the appropriate wavelength could be found for the given CCD-sensor’s pixel indices.This add-in can be used to self-calibrate a device by reusing the here measured “Edge” value in the calibration add-in.Make sure to use the checkbox “Automated Integration Time” and “Integration Time” accordingly. Another use case of this Add-In is, to see the quality of the sensor. Therefore the “Automated Integration Time” shall be noted for a specific testing temperature. Comparing current timing value after a few months with the initially noted value pair gives a “figure-of-merit” for cleanup or recalibration. A recali-bration shall be done if the value is 200% of the initial one for keeping accuracy as bought. Each con-nection change of a fiber optical connector my influence this value.The add-in allows to log the spectra periodically with the icons on the lower left side. Input elements of the lower right side allow to change part of this process.Readout speed shall not below 500ms.EoD。

精英血液资源平台温度管理系统贵州精英企业科技发展有限公司http://www。
gzjyqy。
com一、概述。
随着“信息时代”的到来,作为获取信息的手段——传感器技术得到了显著的进步,其应用领域越来越广泛,对其要求越来越高,需求越来越迫切。
传感器技术已成为衡量一个国家科学技术发展水平的重要标志之一。
传感器的被测信号来自于各个应用领域,每个领域都为了改革生产力、提高工效和时效,各自都在开发研制适合应用的传感器,于是种类繁多的新型传感器及传感器系统不断涌现。
温度传感器是其中重要的一类传感器。
其发展速度之快,以及其应用之广,并且还有很大潜力。
面对如此巨大的发展空间,精英公司针对于各地方血站,医院等相关医疗部门设计开发了温度监控系统,一套系统可达到32路温度检测对象(如冰箱)的同时监控,很好的解决了由人工抄写温度数据带来的繁琐以及不准确的问题。
1、系统总体功能●32路温度检测对象的同时监控。
●24小时实时温度采集。
●温度超标预警。
●温度统计查询,报表。
●温度数据的共享。
(卫生厅等上级部门能实时监控各单位的温度情况)●温度超标短信通知。
2、运行环境(1) 软件环境Windows 操作系统:●Windows 9X/ME。
●Windows 2000/XP(推荐)。
(2) 硬件环境建议配置:CPU:奔腾III 800 以上内存:128 MB以上显卡:标准 VGA,24 位真彩色其它:光驱、鼠标3、接线说明注意:上图中的红线和黑线分别接485转换器的D+/A,D-/B,具体接法在传感器的线上贴的有标签。
按照标签提示连接即可。
可以在该线和485接口间接延长线。
二、具体模块介绍1、参数配置:打开温度程序,在主菜单系统配置--- 参数配置如下图:说明:串口选择:代表485转换口接计算机的COM口编号,一般计算机为COM1或COM2口。
(以用户接入的口为准)。
温度保存间隔时间:代表系统每次采集温度的时间,即每次采集入库时间,方便后面的查询。
地源热泵温度场远程在线监测系统一、地源热泵温度监控系统原理论述1、地源热泵温度监控系统/地源热泵测温摘要:简述地源热泵垂直埋管方式的选择原理,通过埋管井中,双U管运行时冷却水进出口水温、管内水流速计算出管内外换热热量,同时将土壤近似为半无限大空间,对管内各点与无限远处的土壤同水平点间进行传热量计算,对比数据的准确性。
运用已经确定的导热量,计算出管与管壁导热后管外壁点的温度,与热泵系统运行时,温度探测器测量到的地埋管在不同深度、不同时间段时各点的温度,对两组数据进行整理与分析,来探讨地源热泵地埋管系统运行时温度场的变化规律。
2、地源热泵温度监控系统/地源热泵测温关键词:地源热泵垂直埋管 U型管土壤温度场3、地源热泵温度监控系统/地源热泵测温引言:热泵技术在现代社会已经是一项实用且普遍的建筑制冷取暖技术,其中的土壤源热泵是利用地下浅层地热资源进行供热和制冷的高效节能的新型能源利用技术。
它利用卡诺循环和逆卡诺循环原理实现与大地土壤进行冷热交换的目的。
地源热泵系统由于其具有节能效果好、利用可再生资源、环保效益显著、使用寿命长等优点,现在越来越被广泛运用。
4、地源热泵温度监控系统/地源热泵测温正文:热泵是能够在夏天提供制冷的同时也提供冬天供暖的一种系统,从能量的角度来看,热泵系统是通过高品位电能驱动压缩机促使制冷剂工质相变循环与强制循环的土壤或者空气进行传热。
在夏季的时候将室内的高温传入介质中,同时通过冷却水的循环将建筑物内部达到适宜的温度;冬季时则吸取介质中的热量,通过一定的处理之后输送给建筑物内部进行取暖。
5、地源热泵温度监控系统/地源热泵测温理论计算公式地下换热器的目的在于让管内的流体与地下土壤间进行热交换,所以地面温度场是研究地下换热器的基础数据,首先对土壤的地温特性进行描述。
受地面空气和太阳对地表面辐射作用以及地温梯度的影响,地表层温度发生着日间的变化,其温度变化规律可用公式(1)关系式来描述:(1)式中:t(z.τ):地下岩土在深为z,时刻为T时的温度℃;tep: 地表面某一时间周期的平均温度℃;A0:地表面温度的一阶谐量振幅℃;a:地下岩土的导温系数,a=λ/ρc p㎡ /s ;ω:圆频率,ω=2π/T0 1/s:T0:温度变化周期,日周期为To=24hZ: 距地面的距离 mτ:时刻s1/30:地温梯度℃/m2009年9月30日温度变化可近似用公式(2)表示,可算出地面对应时间的地面温度:Y(t)=-4.5cos(π/12)t+24.5(2)已知冷却出水水温Tf1、冷却回水Tf2及流速Q,水在双U管内的循环流动过程,将双U管视为左右完全对称,参考文献,可将水温看做线性变化,水温度随管长变化见公式(3),可计算出相应时间点对应深度的管内流体温度:T=(Tf2-Tf1)/202+Tf1(3)土壤为半无限大非稳态温度场,无限远处温度t(z.τ)稳定,流体在双U管内流动过程可以看做为管内流体与无限远处进行导热的过程。
红外热成像测温系统V1.0应用配置手册版权声明红外热成像测温系统是由海康威视自主开发的专用视频监控系统,其版权受中华人民共和国版权法保护。
海康威视拥有本文的全部版权,未经本公司许可,任何单位及个人不得对本文中的任何部分进行转印、影印或复印。
信息反馈海康威视尽最大的努力保证本手册的准确性和完整性。
如果您在使用中发现问题,希望及时将情况反馈给我们以完善产品,我们将非常感谢您的支持。
目录版权声明 (1)目录 (3)第1章运行环境要求 (4)1.1硬件环境 (4)1.2软件环境 (4)1.2.1操作系统环境 (4)1.2.2 Java运行环境 (4)1.2.3应用服务器环境 (4)1.2.4数据库环境 (4)1.2.5浏览器环境 (4)第2章平台首页 (5)2.19800系统配置 (5)2.2平台登录 (6)2.3插件安装 (7)2.4版本信息 (8)2.5用户信息 (9)第3章配置管理 (9)3.1服务管理 (9)3.1.1网域配置 (10)3.1.2服务配置 (10)3.2资源管理 (13)3.2.1资源管理配置 (13)3.3巡检计划 (18)3.3.1巡检计划配置 (18)3.4日志查询 (21)3.4.1日志查询过滤 (22)第4章CS客户端使用说明 (22)4.1运行和使用 (23)4.2实时预览 (25)4.2.1组织资源实时预览 (26)4.2.2巡检计划实时预览 (28)4.2.3云台控制 (29)4.3录像回放 (30)4.4巡检结果 (30)4.5告警中心 (31)第1章运行环境要求1.1硬件环境平台运行环境为主流配置的服务器,根据公司现有产品情况,可分为以下几类:1.2软件环境1.2.1操作系统环境支持Windows Server 2008R2(x64);1.2.2Java运行环境支持JDK1.8.0_45运行环境;兼容Java5、Java6、Java7运行环境;1.2.3应用服务器环境支持tomcat7.0.59;兼容tomcat6等;1.2.4数据库环境支持PostgreSQL 9.2;兼容Oracle 10g/11g、MySql 5.1、SQLServer2008/2012;1.2.5浏览器环境支持IE8;兼容IE11;显示:1024*768分辨率或更高,硬件支持DirectX9.0c或更高版本所有浏览器必须使用管理员身份运行。
testo EasyClimate 软件说明书21目录1 目录1 目录 (3)1.1. 文档说明 (5)2 规范 (6)2.1. 用途 (6)2.2. 系统要求 (6)3 初始步骤 (7)3.1. 安装软件/驱动程序 (7)3.2. 启动软件 (7)4 使用本产品 (8)4.1. 初始页面菜单 (8)4.2. "设置"菜单 (10)4.2.1. 配置 (10)4.2.1.1. 程序选项卡 (10)4.2.1.2. 单位选项卡 (11)4.2.1.3. 自有数据选项卡 (11)4.2.1.4. 数据备份选项卡 (11)4.2.2. 系统信息 (12)4.2.3. 版权 (13)4.3. 仪器菜单 (13)4.3.1. 连接管理器 (13)4.3.2. 配置 (15)4.3.2.1. 仪器选项卡 (15)4.3.2.2. 电源管理选项卡 (16)4.3.2.3. 显示语言选项卡 (16)4.3.2.4. 密码安全选项卡 (16)4.3.2.5. 探头选项卡 (17)4.3.2 .6. 打印选项卡 (17)4.3.3. 联机测量 (17)4.3.3.1. 测量值选项卡 (18)4.3.3.2. 显示选项卡 (19)4.3.3.3. 表格选项卡 (19)4.3.3.4. 显示顺序选项卡 (19)31目录4 4.4. 归档菜单 (20)4.4.1. 资源管理器 (20)4.4.1.1. 添加文件夹 (21)4.4.1.2. 添加测量位置 (21)4.4.1.3. 添加测量点 (21)4.4.1.4. 添加测量程序 (21)4.4.1.5. 复制文件夹/测量值 (22)4.4.1.6. 更多功能 (22)4.4.2. 显示测量值 (23)4.4.2.1. 信息选项卡 (23)4.4.2.2. 表格选项卡 (24)4.4.2.3. 测量值选项卡 (24)4.4.2.4. 报表模板选项卡 (25)4.4.2.5. 报表选项卡 (25)4.4.2.6. 报表设计器选项卡 (26)1目录51.1. 文档说明使用说明>在使用本产品之前,请仔细阅读本文档,并熟悉本产品。
数据表AXIS Q2901-E Temperature Alarm Camera用于远程温度监控室外专用的子弹型AXIS Q2901-E提供336x256分辨率的热成像。
AXIS Q2901-E支持多达六个可用于触发警报的测温报警区域。
它提供两类由温度偏差触发的警报:如果温度超出设定限制,或者温度升高太快。
区域测温功能用于查看特定区域的温度。
等温调色板在图像中突出显示温度-范围,让它方便热点可视化以识别过热的设备或区域。
>测温报警>等温调色板>点温度读取>高性能智能视频AXIS Q2901-E Temperature Alarm Camera型号AXIS Q2901Q2901--E9毫米AXIS Q2901Q2901--E19毫米摄像机图像传感器非致冷微测辐射热计336x256像素,像素大小17微米,光谱范围:8-14微米镜头9毫米:F1.25,水平视野:35°,最小焦距:2.1米(78.7英寸)19毫米:F1.25,水平视野:17°视图,最小焦距:9.5米(354.3英寸)侦测范围建议被监视对象的大小至少覆盖10x10像素(336x256)。
灵敏度NETD<50mK热像法目标温度范围-40°C至550°C(-40°F至1022°F)温度精度低于100°C(212°F):+/-5°C(+/-9°F)精度低于150°C(302°F):+/-5%精度高于150°C(302°F):+/-20%精度视频视频压缩H.264(MPEG-4Part10/AVC)Main和Baseline格式Motion JPEG分辨率传感器为336x256。
图像可放大至720x576帧速高达8.3fps视频流3个单独的视频流a H.264和Motion JPEG格式的视频流设置单个调色板:单独配置的同步流,最大分辨率为8.3fps可控制的帧速和带宽VBR/MBR H.264图像设置锐度、自动增益控制、曝光区域、增益、旋转、等温调色板、压缩、成像、文本与图像叠加及隐私遮罩Axis走廊模式音频音频流双向音频编码AAC-LC8/16kHz、G.711PCM8kHz、G.726ADPCM 8kHz、可配置的比特率音频输入/输出外部麦克风输入或线路输入、线路输出网络安全性密码保护、IP地址过滤、HTTPS b加密、IEEE802.1X b网络访问控制、摘要式身份验证、用户访问日志、集中式证书管理支持的协议IPv4、IPv6USGv6、HTTP、HTTPS b、SSL/TLS b、QoS Layer3DiffServ、FTP、CIFS/SMB、SMTP、Bonjour、UPnP TM、SNMP v1/v2c/v3(MIB-II)、DNS、DynDNS、NTP、RTSP、RTP、TCP、UDP、IGMPv1/v2/v3、RTCP、ICMP、DHCP、ARP、SOCKS、SSH系统集成应用编程接口用于进行软件集成的开放API,包括VAPIX®和AXIS Camera Application Platform;规格请参见一键云连接ONVIF Profile S和ONVIF Profile G,规格请参见分析AXIS Video Motion Detection4、主动篡改报警支持AXIS Camera Application Platform,能够安装第三方应用,请参见/acap事件触发器分析、温度侦测(6个报警区域)、硬件温度、前端存储事件、冲击侦测、计划时间、移动侦测、已访问实时流音频侦测事件操作文件上传:FTP、SFTP、HTTP、HTTPS网络共享和电子邮件通知:电子邮件、HTTP、HTTPS和TCP状态LED、文本叠加、SNMP、报警前和报警后视频缓冲、录制视频至前端存储、网络共享内置安装辅助工具像素计算器数据流事件数据一般外壳IP66、IP67和NEMA4X级金属外壳(铝制),带有集成除湿膜和锗窗片颜色:白色NCS S1002-B。
无线温湿度智能监测系统软件使用说明书(V1.1)目录1系统概述 (1)1.1系统组成 (1)1.2节点概述 (1)2 软件运行环境 (2)2.1 软件环境 (2)2.2 硬件环境 (2)3 系统软件使用和操作 (3)3.1 安装QF03-A103总控端驱动驱动 (3)3.2 安装监测软件 (5)3.4卸载监测软件 (6)3.3 运行监测软件 (6)4注意事项 (10)5保管存放 (11)1系统概述1.1系统组成无线温湿度智能监测系统采用低功耗设计,具有体积小、节能、安全、安装简单、工作稳定等优点,是一个低成本、高性能、可常年不间断运行的无线传感网络系统,维护简单,使用方便。
无线温湿度采集终端能够任意安装在所需监测的地方,适合应用于需监测的军事区域、仓库、血液中心血库、厂房、机房、孵房、温室等对环境温湿度要求高的场合。
无线温湿度智能监测系统由若干无线温湿度采集终端、无线路由节点、一个总控端和监测中心监测管理软件组成。
系统总体结构如图1所示。
图1 无线温湿度智能监测系统拓扑结构1.2节点概述(1) 无线温湿度采集终端采集终端是两节1.5V普通干电池供电的低功耗的传感器节点,置于所测环境中进行温湿度数据的采集和预处理,并将数据上传给路由节点或总控端,呈星形拓扑结构排列,安装实施相对简单,可以节省费用,控制成本,具有很大的环境适应性。
用电池供电,能够工作一年以上。
任何采集终端在网络覆盖范围内可以自动加入或退出网络,且无需设置自动入网。
安装使用:安装方式,根据现场实际可以采用摆放、螺丝固定等方式。
采集终端要布置在无线路由或者总控端周围通信距离可视范围之内,采集终端周围应避免有大面积金属遮挡物。
在监测特别重要和密集的区域可以多放置几个采集终端。
(2) 路由节点路由节点负责整个网络的数据中继、覆盖延伸功能。
路由节点之间呈Mesh网状网络拓扑结构,其路由可自动建立和维护,具有强大的功能;网络可以通过“多级跳”的方式通信;组成极为复杂的网络;具备自组织、自愈功能。
固定式红外线性化温度传感器 技术及使用说明书2003年8月 Ver 03.08目录概述 (2)一、技术参数 (3)二、安装 (4)三、使用与操作 (6)四、输出选择 (10)五、附件 (12)六、保养 (13)概 述CIT系列红外测温仪是把国防(如原子弹、氢弹、火箭燃气测温等)红外探测技术用于工业领域的高科技产品。
CIT系列红外测温仪具备有单波段高温型,中温型、低温型和比色型四大类,能在-20~3500℃范围内(分段)满足用户的不同需要。
尤其适合于对运动物体,带电导体,真空或其它特殊环境下的目标进行非接触温度检测。
检测对原有温度场无任何影响。
产品分类 : 单波段:○ SCIT系列分离式红外测温仪(探头与显示仪表分离);○ CIT系列红外线性化温度传感器○ CIT系列便携式红外测温仪;双波段:○ CIT比色在线式红外测温仪;○ CIT比色式光纤红外测温仪;○ CIT比色便携式红外测温仪;应用:十七年来,本系列产品已广泛用于科学研究、热处理、钢铁、冶金、炉窑、化工、橡胶、造纸、塑料、线材生产,焦化,热压烧结等行业,不但为国内知名研究机构,名牌大学提供了高精度科研设备,同时为众多的生产企业、设备制造商提供了大量的高可靠产品;并且出口到美国,加拿大,韩国,泰国,香港等地区。
资质:CIT型系列红外测温仪曾获中国科学院科技进步奖和北京首届国际博览会银奖。
并取得国家计量器具制造许可证(京制00000398号-1)。
同时本公司已获得ISO9001(2000)质量管理体系认证。
服务: 本公司对产品质量全面负责, 长期保修并可为用户定期检定。
第一年(符合有限担保条件的)免费维修。
并提供下述技术支持:○红外测温技术及选型咨询;○可按用户要求设计和定制生产(指定测程,超小目标测量[小至0.2mm],设备配用特殊测头、光纤测头等)。
○承接红外测控工程设计。
一、技术参数测温参数温度范围标准型宽程型CIT-2M CIT-1M CIT-2MK CIT-1MK300~1200℃□600~2000℃□300~1700℃□400~2000℃□600~2800℃□900~3300℃□测温精度 ±1%FS,重复精度±2‰测温分辨率1℃发射率 0.10~1.00,设置置修改步长0.01测温方式 瞬时值、最大值、平均值测量操作与显示MOD ▼ ▲三键操作;4位LED数码显示,5个LED提示符 提示温度超限告警指示、非正常测温告警指示、0/4~20mA输出断线告警灯指示光学参数距离系数(光学分辨率)120:1[或250:1]测量距离 0.6~∝米可测最小目标Φ5mm[或Φ2.4mm]电气参数电源 15~24VDC功耗 150mA(最大),[低功耗方式≤40mA]响应时间 20-67ms(用户可定制)输出信号信号输出全隔离任选0/4~20mA、0/1~5V、RS485中的一种环境参数储存温度 -40~85℃工作环境环境温度0~60℃,湿度:0~80%(不结露);加水冷套时环境温度:0~175℃物理参数测头尺寸Φ60×192重量 0.60Kg, 带水冷套吹尘器重量为1.7Kg1.技术特点:●抗烟雾、水蒸气和灰尘能力强●电源接线全保护,输出全隔离●能瞄准,测量小目标●整机结实密封,且带环境温度补偿,适于环境条件恶劣的工业现场中使用。
杭州宇诺电子科技有限公司——在线测温监控系统软件使用说明书
2014年11月23日
1软件概述:
在线测温监控系统,是杭州宇诺电子科技有限公司针对在线测温产品开发的一套专业化系统软件。
该软件具有对测温点的温度数据的监测,采集,处理和分析功能,能够实现对测温点温度变化情况的实时监控和分析。
2系统配置:
本软件可在Windows XP, Window7的各个版本(除家庭版外)的系统下运行。
3计算机的硬件配置
处理器:奔腾I以上 C P U
内存:1GB以上
硬盘空间:500GB
显卡:集成显卡或独立显卡均可。
其他:标准配置
4软件的功能
1、实时数据
显示各个测温节点的温度数据和报警情况,传感器接收状态。
2、历史数据
查看开关柜在指定日期内的所有测温节点或指定节点的历史温度数据。
3、温度曲线
查看开关柜在指定日期内的所以测温节点或指定节点的历史温度曲线。
4、报警记录
显示温度报警,预报警,温升报警,通讯失败等报警信息。
5、日志信息
记录用户的一些日常操作信息。
6、用户管理
查看,添加,修改和删除当前用户的信息。
7、参数设置
查看,添加,修改和删除系统中的设备以及测温节点的相关参数。
8、关于
查看版本信息。
5软件操作说明
1、双击桌面的软件图标,如图5-1所示。
图5-1
2、在登录界面(如图5-2所示)输入用户名和密码点击登录(首次操作我们将提供临时用户名和密
码)
图5-2
3、进入主界面,可查看实时数据(如图:5-3所示)
图5-3
在实时数据查看界面,可以通过对左边树形目录复选框的勾选筛选要查看的实时数据。
通过“区域”和“设备”页面的切换可以分别根据测温位置或设备名称查看实时数据的显示。
4、历史数据的查看,点击顶端工具栏中的“历史数据”,切换到历史数据界面,如图5-4所示。
图5-4
在该界面下方有两个选项:“实时刷新历史数据”,“查看历史数据”在使用过程中,我们通常选择“查看历史数据”。
当需要查看某一日的历史数据时,我们只需在“选择以往历史数据日期”中选择相应的日期,然后在左边的树形目录中选择查看的开关柜,即可看到该开关柜中的当日的全部温度采样数据。
假如查看当日数据则不必选择日期,直接点击开关柜名称即可。
5、温度曲线分析,点击顶端工具栏中的“温度曲线”,切换到温度曲线界面,如图5-5所示。
图5-5
在界面下方有两个选项:“实时刷新温度曲线”,“查看历史曲线”,在使用过程中,我们通常选择“查看历史曲线”。
当我们需要查看分析指定单位在某一日的温度变化情况时,我们可以在“选择历史曲线日期”中选择对应的日期,然后在左边的树形目录中选择相应开关柜,即可查看当日的历史温度曲线的变化情况了。
如果查看当日的曲线,直接点击查看的开关柜即可。
6、报警记录查询,点击顶端工具栏中的“报警记录”,切换到报警记录界面,如图5-6所示。
图5-6
报警记录中详细记录了某一节点位置的温度报警,预报警,温升报警的信息,以及报警开始和报警结束时间。
7、日志信息查看,点击顶端工具栏中的“日志信息”,切换到日志信息界面,如图5-7所示。
图5-7
日志信息中记录了用户对软件的一些日常操作信息,如用户登录,退出信息,添加,修改和删除设备信息。
8、用户管理信息,点击顶端工具栏中的“用户管理”,切换到用户管理界面,如图5-8所示。
图5-8
该界面左边是系统中所有存在的用户信息,右边是用户信息编辑区域,能够添加,修改和删除当前用
户的信息。
当我们需要添加一个新用户时,我们只需编辑该用户的信息后点击“添加用户信息”按钮。
如果我们需要修改用户信息我们要先在左侧选中需要编辑的用户信息,然后在右侧进行修改,修改完成后点击“修改用户信息”按钮。
删除用户信息时,我们先选中左侧的用户信息,在右侧点击“删除用户信息”按钮。
9、参数设置功能,点击顶端工具栏中的“参数设置”,切换到参数设置界面。
图5-9
图5-10
在参数设置界面中有两个页面分别是“变电站参数”(如图5-9所示)和“设备参数”(如图5-10
所示)。
在变电站参数界面中,上方的参数编辑部分,是逐级查看的,选择变电站后出现电压等级,选择电压等级后出现开关柜,以此类推。
在下方是所选的测温节点的一些详细信息。
在设备参数界面中,选中相应的屏,该屏下方的所有的信息就能一目了然的显示出来了。
在参数设置部分用户只需查看,无需编辑,编辑部分由杭州宇诺电子科技有限公司技术人员编辑完成。
10、关于界面,记录杭州宇诺电子科技有限公司网址信息。
如图5-11所示
图5-11
结束语:
该软件是一款集:采集,处理,保存,分析测温数据,设置系统参数于一体的综合性测温监控系统软件。
是杭州宇诺电子科技有限公司专门为测温类产品开发的一套系统软件。