5.12.1+平衡计分卡指标汇总英文
- 格式:xls
- 大小:216.00 KB
- 文档页数:3
Company Performance Indicators: How to Measure the Performanceof a CompanyByProfessor H.S. ShafaBurwell Endowed Chair of Int’l ManagementOklahoma City UniversityFirst International Conference on KPIBeijing, ChinaMay 22nd, 2002Company, Strategy and Performance 公司、战略及其绩效●A Company is an Association of ProductiveAssets (including People) who cometogether to obtain Economic Advantages●Strategy is a Pattern of Asset or ResourceAllocation that enables Companies tomaintain or improve their Performance●Performance of a company can be measuredin different waysDifferent Approaches to MeasuringPerformance衡量绩效的不同方式●Firm’s Survival As a Measure of Performance (Altman’s Z-Score)●Tobin’s Q●Accounting Measures of Performance (Financial Ratios)●Multiple Stakeholders view of Performance ●Balanced Scorecard●Present Value Measures of Performance ●EVA and MVAMost Commonly Used Key Performance Indicators 最常用的关键业绩指标●Financial Indicators 财务指标●Process Indicators 过程指标●Customer Indicators 顾客指标●Learning and Growth Indicators学习与创新指标Financial Ratios represent an attempt to standardize financial information in order to facilitate meaningful comparisons over time (time series) and between firms or firm to industry (cross section).不同的公司之间或不同的时间段内使用规范的财务信息进行有意义的比较。

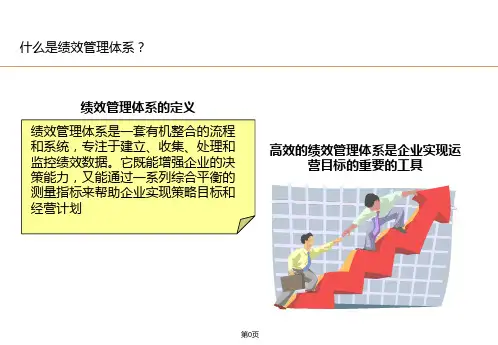

the Balanced Scorecard,简称BSCBSC是由罗伯特〃S 〃卡普兰(哈佛商学院的领导力开发课程教授)和大卫〃P 〃诺顿(复兴全球战略集团创始人兼总裁)对美国12家优秀企业为期一年的研究后创建的一套企业业绩评价体系,后来在实践中扩展为一种战略管理工具。
平衡计分卡是从财务、客户、内部运营、学习与成长四个角度,将组织的战略落实为可操作的衡量指标和目标值的一种新型绩效管理体系。
设计平衡计分卡的目的就是要建立‚实现战略导向‛的绩效管理系统,从而保证企业战略得到有效的执行。
因此,人们通常称平衡计分卡是加强企业战略执行力的最有效的战略管理工具。
平衡记分卡打破了传统的只注重财务指标的业绩管理方法,认为传统的财务会计模式只能衡量过去发生的事情。
在工业时代,注重财务指标的管理方法还是有效的,但在信息社会里,传统的业绩管理方法并不全面。
组织必须通过在客户、员工、组织流程、技术和革新等方面的投资,获得持续发展的动力。
平衡计分卡从四个方面考察组织绩效。
财务维度从财务角度来看:我们在股东眼中应该是怎样的?银行经营的结果是使股东获得财务回报。
因此,财务指标是BSC所有维度的核心。
财务能全面、综合地衡量经营活动的最终成果、衡量企业创造股东价值的能力。
主要包括现有产品的销售能力、新金融产品的销售与盈利水平、费用预算达成率等。
客户维度从客户角度来看:我们在客户眼中应该是怎样的?向客户提供合适的金融产品和服务,满足客户需要,银行才能生存。
提高服务质量、保证服务水平、保障交易安全、提供合理的产品及服务的定价等。
从客户的角度给自己设定目标与评价指标,以保证银行的工作能有所成效。
客户维度的指标主要包括客户满意度、品牌认知度、营销及服务人员的专业化能力、产品与服务的价值等。
内部营运维度从内部营运角度思考:我们需要在哪些流程上表现出色?这些内部运营重视的是对客户满意度和实现企业财务目标影响最大的流程。
一个企业不能样样都是最好,但是它必须在某些方面具有提供满足客户需要产品的机能,在某些方面拥有竞争优势,它才能立足。
平衡计分卡培训课程英文版Balanced Scorecard Training CourseIntroduction:Balanced Scorecard is a strategic management tool, which is used to align business activities to the vision and strategy of an organization. It is a unique approach that helps to measure business performance and improve decision-making. The Balanced Scorecard training course is a comprehensive program that provides participants with an in-depth understanding of the methodology, tools, and techniques involved in implementing and managing a Balanced Scorecard system.Course Objective:The objective of this training course is to help participants gain a thorough understanding of:• The Balanced Scorecard methodology and its importance in strategic management• Setting performance objectives an d measurement frameworks• The various components and perspectives of the Balanced Scorecard• Using the Balanced Scorecard for performance monitoring, forecasting, and decision-making• Identifying key performance indicators (KPIs) and developing scorecards• Aligning strategy execution with business processes and systems• The key success factors for implementing a successful Balanced Scorecard systemCourse Content:The Balanced Scorecard training course is structured to provide the participants with an in-depth understanding of the methodology, tools, and techniques involved in implementing and managing a Balanced Scorecard system. The course content includes the following modules:Module 1: Introduction to Balanced Scorecard• The concept of Balanced S corecard• Fundamentals of strategic management• The Balanced Scorecard approach to strategy execution• The benefits and challenges of implementing a Balanced ScorecardModule 2: Designing a Balanced Scorecard System• Developing a strategy map• Setting objectives and key results• Developing KPIs for each perspective• Aligning measures and targets with business objectivesModule 3: Implementing a Balanced Scorecard System• Integrating the Balanced Scorecard with business processes• Measuring and tracking performance• Analyzing trends and making decisions• Communicating progress and resultsModule 4: Key Success Factors in Implementing a Balanced Scorecard• The role of leadership and culture• Building stakeholder alignment• Ensuring data accur acy and relevance• Continuously improving the Balanced Scorecard systemCourse Delivery:The Balanced Scorecard training course can be delivered in various formats, including classroom training, virtualinstructor-led training, and eLearning. The instructor-led training can be customized to meet the specific needs of an organization. The training materials include comprehensive course manuals, case studies, and exercises. The training can be delivered byexperienced consultants who have extensive knowledge and practical experience in implementing Balanced Scorecard systems across various industries.Target Audience:The Balanced Scorecard training course is designed for business executives, managers, and professionals who are responsible for developing and implementing strategic plans in their organizations. It is also suitable for those who are involved in performance management, quality management, and process improvement initiatives.Conclusion:The Balanced Scorecard training course is a valuable investment for organizations looking to improve their strategic management processes and enhance their performance. By participating in this course, individuals will gain the knowledge and skills needed to design, implement, and manage a successful Balanced Scorecard system that aligns their business activities with their strategic objectives. The course content covers the entire process, from strategy development to performance monitoring, which ensures that individuals acquire a comprehensive understanding of the methodology and its practical application.。

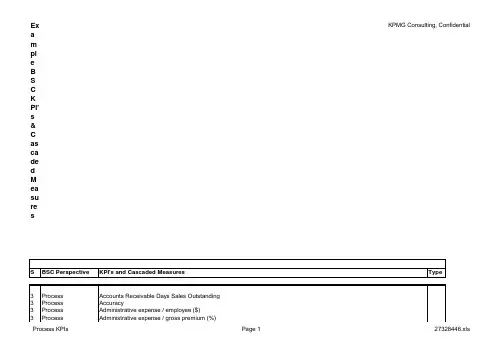
3Process Creativity: # Design Variations3Process Creativity: # Ideas Generated3Process Creativity: # Original Designs3Process Cross Sell Ratio (avg. # products sold to hsld)Lag 3Process Customer feedback - score of customers' satisfaction w/ their shopping experience Lag 3Process Customer Reject Rate on Finished Products (ppm)3Process Customer time / employee attendance (%)3Process Cycle Time3Process Cycle Time3Process Cycle Time: Time in Development Lag 3Process Cycle Time: Claims Processing Cycle Time3Process Dealer acceptance rate of new programs LagLag 3Process Dealer Quality Index (7 dimensions: financial mgmt, service bays, personnel mgmt, car wash operation, convenience stores, gasoline purchasing, better buying experience)3Process Defect rates (ppm)Lag 3Process Defects3Process Delivery3Process Design Reviews3Process Discontinued IT inventory / IT inventory (%)3Process Discounts and Concessions (planned and unplanned)3Process Downtime3Process Efficiency of post sales service processes - cost of resources used Lag 3Process Emergency Workorders3Process Energy Use Alternatives (#)3Process Equipment Mix3Process Equipment Utilization3Process Error Rate, "Sigmas"3Process Errors3Process Expense Ratio Lag 3Process First Pass Yield - % customer requests handled with a single service call rather than multiple calls Lag 3Process First Pass Yield3Process First Pass Yield - Finished Product3Process First Pass Yield - Major Component3Process First Pass Yields (% requiring no rework)Lag 3Process First to market: # of key items in which Kenyon was 1st or 2nd to market Lag3Process Freight Costs3Process Function points / employee month (#)3Process Generous terms under which customers can exchange and return merchandise Lag 3Process Hard Book Closes per Year in Excess of Regulatory/Required Closes3Process Headcount Movement Lead 3Process Hours spent with customers Lead 3Process Hours spent with customers (% )Lead 3Process Innovation3Process Inspections3Process Interest Paid3Process Internal Failure Rate3Process Internal index of customer dissatisfiers Lead 3Process Inventory3Process Inventory - WIP Turns (Annual)3Process Inventory Turnover (Annual Sales / Current Inventory)3Process Inventory Turnover: inventory turns on the selected key items (to balance preceding measure)Lag 3Process Inventory Turns (Annual)3Process Inventory: Finished Goods Inventory3Process Inventory: Obsolete3Process Inventory: Raw Materials Inventory3Process Inventory: Total Inventory3Process Inventory: Work-in-Process Inventory3Process Investment in new product/service development Lag 3Process Investment Profiles3Process IT capacity (CPU & DASD) #3Process IT capacity / employee (#)3Process IT expense / administrative expense (%)3Process IT expense / employee ($)3Process IT performance / employee (#)3Process Key dealer retention Lag 3Process Labor Productivity3Process Labor Productivity (output per hour)3Process Laptops / employee (#)3Process Loss Prevention3Process Loss Ratio Lag3Process Machine Availability Rate (Average)3Process Machine Maintenance Time3Process Machine Uptime3Process Maintenance done by Operators3Process Maintenance Ratio (own and contracted labor, supplies and tools, shop floor space and equipment)3Process Maintenance: Preventive3Process Maintenance: Reactive3Process Managed spending Movement Lead 3Process Manufacturing process capabilities (e.g. chip density on wafer)Lag 3Process Market share in selected categories (e.g. casual pants and jeans)Lag 3Process Material Handling Cost3Process Material Handling Distance3Process Material Handling Time3Process Materials Productivity3Process MCE (manufacturing cycle effectiveness) = processing time / throughput time Lag 3Process Merchandise transferred between stores (%)Lag 3Process Mystery Shopper Rating (facility exterior, service islands, sales area, personnel, restrooms)Lag 3Process Mystery Shopper: A rating along six elements of the perfect shopping experience (see Ch 4)Lag 3Process New accounts opened per year Lag 3Process New product introductions vs competitors (and versus plan)Lag 3Process New Product ROI Lag 3Process New Revenue per Sales Person Lag 3Process Non gasoline revenues (at the dealer)...also benchmark against top operators in the industry Lag 3Process Non gasoline Sales per square foot (at the dealer)Lag 3Process On time (reliable lead time) (%)Lag 3Process On time Delivery3Process On Time Delivery of suppliers, distributors3Process On time delivery to customers3Process Order Fill Rate3Process Order to Ship Lead time for major product standard orders3Process Order to Ship Lead Time Reduction3Process Out of specification purchased materials3Process Output: Baggage Manipulations3Process Output: Beds Made3Process Output: Cars Valet Parked3Process Output: Cases Shipped3Process Output: Checkout Transactions3Process Output: Concierge Inquiries Handled3Process Output: Conventions Hosted3Process Output: Entries Made3Process Output: Guests Accommodated3Process Output: Line Items Charged to a Room3Process Output: Maintenance Transactions Completed3Process Output: Phone Calls Handled3Process Output: Reports Finished3Process Output: Reservations Made3Process Output: Rooms Rented3Process Output: Tons Melted3Process Output: Tons Shipped3Process Output: Units per Hour3Process Output: Units Shipped3Process Output: Weighted Units Produced per Employee Hour3Process Overdue Receivables3Process Parts Standardization3Process Payroll Department Cost per Paycheck3Process Pcs / employee (#)3Process Potential customers arrived first (#)Lag 3Process Potential revenue in sales pipeline Lag 3Process Premises Ratio (floor space, furnishings, utilities, basic office and cleaning supplies, sanitation, security, receptionpersonnel)3Process Process Capability3Process Process Variation3Process Processes under statistical control (%)Lag 3Process Processing time, outpayments (#)3Process Product Development Cycle Time (Months)Lead 3Process Production Schedules Met (% Time)3Process Productivity Ratio (Output Units/Input Hours Worked or Paid)3Process Productivity Ratio (Outputs/Inputs)3Process Productivity Ratio: Batches of Steel Produced per Production Scheduler3Process Productivity Ratio: Square Feet Protected per Security Guard3Process Productivity Ratio: Tons of Steel Produced per Production Scheduler3Process Productivity Ratio: Tons of Steel Produced per Production Worker3Process Productivity Ratio: Visitors Handled per Security Guard3Process Products Developed Internally (%)3Process Products for which the first design completely me the customer's functional specifications (%)Lag 3Process Profit potential per outlet Lag 3Process Profitability in targeted segments Lag 3Process Purchase Price versus Commodity Quotations3Process Purchases from Certified Suppliers3Process Quality Improvement Rate Lag 3Process Quality of Market Share: profitability in targeted market segments (ABC by customer)Lag 3Process Quality Returns: '% items which cannot be offered to customers because of quality related defects Lag 3Process Quality Returns: overall % of quality related returns (and by track vendor)Lag 3Process Quality: Process3Process Quality: Product3Process Rapid response to repair request Lag 3Process Ratio of operating profit to total development cost over a 5yr period (aggregate or individual product)Lag 3Process Recalls3Process Reduction in Lot Sizes3Process Regional Offices (#)3Process Reject Rate Reduction3Process Rejection of Supplies/Materials at Delivery3Process Reliable repair service Lag 3Process Replenish Products3Process Request Fulfillment Time Lag 3Process Request or transaction not fulfilled, financial loss for customer, customer not treated as valued, ineffective communication)Lead 3Process Responsive, friendly, reliable warranty and service work Lag 3Process Revenue from new categories: percentage of sales from items newly introduced in the store Lag 3Process Revenue from new products (%)Lag 3Process Revenue/Person3Process Rework Lag 3Process Rework hours3Process Safe disposal of waste and byproducts from the production process Lag 3Process Safety3Process Safety: OSHA reportables3Process Sales Errors3Process Sales from new products (%)Lag 3Process Sales from proprietary products (%)Lag 3Process Sales Leads3Process Sales Netback (Sales less all variable sales and marketing costs)3Process Sales: Same Store Sales3Process Schedule Fulfillment3Process Score on Quality Assessments3Process Scrap Lag 3Process Scrap/Rework3Process Scrap/rework as % of sales3Process Second Purchase Data3Process Selling Contacts per Sales Person Lead 3Process Service Error Rate Lag 3Process Settlement Cost per Claim3Process Share of market in key geographic areas among its three targeted segments: Road Warriors, True Blues, Generation F3s Lag 3Process Shipping Deadlines Made3Process Speed3Process Speed of response to failures - time from customer request to resolution of problem Lag 3Process Squarefootage Used3Process Standards3Process States Operating In (#)3Process Stock out %: stores out of stock percentage on selected key items Lag 3Process Storage Space3Process Supplier Mix3Process Supplier Performance3Process Supplier Report Cards3Process Supplier Scorecards3Process Suppliers (#)3Process Surprises (#)Lag 3Process Thriftiness: Percentage of Computer Terminals Routinely Used by More than One Person3Process Throughput time = processing + inspection + movement + waiting/storage time Lag 3Process Time Allocated to Tax Time3Process Time from customer order to customer receipt (short lead time length)Lag。
4 平衡计分卡(balanced scorecard)概述平衡计分卡是快速全面了解组织或经营单位绩效的一套衡量方法,从四个方面进行衡量:顾客、企业内部、创新与学习以及财务。
在每一方面中,组织所选择的衡量标准可以反映出组织的经营战略。
组织的每个层面的衡量标准、目标和行动用以支持组织的全局平衡计分。
因此,平衡计分卡允许组织中的每个成员对决定组织成功的最重要因素进行计划和监督。
适用场合对于高级管理层:•制定组织的任务和战略时;•在组织中交流任务和战略时;•为实现组织目标,计划项目时;•之后,定期回顾组织绩效时。
对于组织中的每个成员:•仅当整个组织或经营单位的平衡计分卡已经建立时;•计划改进重点时;•评估现有过程多大程度上满足顾客或组织需求时;•建立改进目标,计划如何达到时;•计划采用什么衡量标准监控改善成果时,既可以在新方法的试验阶段,也可以在标准化以后。
实施步骤建立平衡计分卡的全过程超出了本书的介绍范围,这里只是简要概括一下一般概念。
对于高层管理者:1对组织目标和战略达成共识。
2考虑衡量组织绩效的四个方面:•顾客•企业内部•创新与学习•财务决定是否需要改变这四个方面的名称或者添加其他方面,以适合组织的需要。
3就每一方面,选择不多于五个的衡量标准,来指导过程实现组织的战略目标。
4为每个衡量标准选择目标,当目标实现时,组织向成功就靠近了一步。
在组织的每个层次(小组或个人),过程是类似的:1复审组织以及所属单位的平衡计分卡,明确什么是需要衡量的,以及这些衡量指标是怎样定义组织的重要因素的。
2就每一方面,根据你所在的层次,选择不多于五个衡量标准代表你对组织标准的贡献。
3为衡量标准选择目标,这就是你所在层次的平衡计分卡。
组织中的每个成员将平衡计分卡付诸实施时的步骤:4识别可以实现目标的行动。
针对每个行动,识别哪个衡量指标能够指导行动的成功。
5在衡量指标的改进中建立里程碑,包括何时到达这个里程碑以及量化目标。
6定期复审计分卡,根据需要调整行动、里程碑、目标或者衡量标准或战略。


平衡计分卡(The Balanced ScoreCard,简称BSC)平衡计分卡的出现,使得传统的绩效管理从人员考核和评估的工具转变称为战略实施的工具。
编辑摘要平衡计分卡(The Balanced ScoreCard,简称BSC)∙平衡计分卡的出现,使得传统的绩效管理从人员考核和评估的工具转变称为战略实施的工具。
∙平衡计分卡的出现,使得领导者拥有了全面的统筹战略、人员、流程和执行四个关键因素的管理工具。
∙平衡计分卡的出现,使得领导者可以平衡长期和短期、内部和外部,确保持续发展的管理工具。
∙平衡计分卡因此被誉为近75年来世界上最重要的管理工具和方法。
平衡计分卡(The Balanced ScoreCard,简称BSC),是绩效管理中的一种新思路,适用于对部门的团队考核。
在20世纪90年代初由哈佛商学院的罗伯特·卡普兰(Robert Kaplan)和诺朗诺顿研究所所长、美国复兴全球战略集团创始人兼总裁戴维·诺顿(David Norton)发展出的一种全新的组织绩效管理方法。
平衡计分卡自创立以来,在国际上,特别是在美国和欧洲,很快引起了理论界和客户界的浓厚兴趣与反响。
关于平衡计分卡,它的发明者曾经做过一个很恰切的比喻,把它比作飞机座舱里的标度盘和指示器,因为它可以同时向高级经理提供关于企业的众多方面的详细信息。
平衡计分卡被《哈佛商业评论》评为 75 年来最具影响力的管理学,它打破了传统的单一使用财务指标衡量业绩的方法。
而是在财务指标的基础上加入了未来驱动因素,即客户因素、内部经营管理过程和员工的学习成长。
平衡记分卡的萌芽时期(1987-1989年)在Robert S. Kaplan 和 David P. Norton研究平衡记分卡之前,Analog Device(简称:"ADI")公司最早于1987年就进行了平衡记分卡实践尝试。
ADI是一家半导体公司,主要生产模拟、数字及数模混合信号处理装置,其产品广泛应用于通信、计算机、工业自动化领域。
什么是平衡计分卡哈佛商业评论》在庆祝创刊80周年华诞之际,隆重评选推出了过去80年来最具影响力的十大管理理念,平衡计分卡名列第二。
目前,平衡计分卡作为一个强有力的战略绩效管理的工具在世界500强的大部分企业里得到应用。
什么是平衡计分卡?你对这个名词可能会感到陌生!其实它就实实在在地在我们身边!目前我集团公司导入的绩效管理系统正是运用了平衡计分卡的思想,只是我们一直没有明确提出这个概念而已。
对于平衡计分卡,我们可以这样表述:平衡计分卡的核心思想就是通过财务、客户、内部流程及学习与发展四个方面的指标之间的相互驱动的因果关系展现组织的战略轨迹,实现绩效考核——绩效改进以及战略实施——战略修正的战略目标过程。
它把绩效考核的地位上升到组织的战略层面,使之成为组织战略的实施工具。
首先我们要清楚,平衡计分卡究竟“平衡”什么?之所以称之为“平衡计分卡”,主要因为它是通过财务指标与非财务指标考核方法之间的相互补充“平衡”,同时也是在定量评价与定性评价之间、客观评价与主观评价之间、组织的短期目标与长期目标之间、组织的各部门之间寻求“平衡”的基础上完成的绩效考核与战略实施过程。
以下是对平衡计分卡的四个角度的简单阐述:财务角度:我们怎样满足股东?企业经营的直接目的和结果是创造价值,利润始终是企业所追求的最终目标。
我集团公司的指标如:利润额、开发成本等。
客户角度:客户如何看我们?如何向客户提供所需的产品和服务,从而满足客户需要,提高企业竞争力,已经成为企业能否获得可持续性发展的关键。
客户角度正是从质量、性能、服务等方面,考验企业的表现。
具体如:新客户开发、客户满意度等指标。
内部流程角度:我们必须擅长什么?我们企业是否建立起合适的组织、流程、管理机制,在这些方面存在哪些优势和不足。
内部流程角度应该从以上方面着手,制定考核指标。
如:技术管理、质量管理等指标。
学习与发展角度:我们能否继续提高并创造价值?企业的成长与员工的能力素质和企业竞争力的提高息息相关,而从长远角度来看,企业唯有不断学习与创新,才能实现长远的发展。
Department of Energy Federal Procurement System Balanced Scorecard Performance Measures Information DocumentOffice of Procurementand Assistance ManagementIssued: March 2003Purpose:The purpose of this document is to identify and describe, in one place, the important aspects of each performance measure. The intent is to ensure consistency Department-wide in the generation and reporting of assessment results. For each measure, the following information is provided:1.Identification of the measure in question, along with the associated PerformanceObjective, and BSC Perspective.2.The Definition of the performance measure. The Definition is a “plain English”explanation of what the measure is intended to cover.3.The Data Source for the performance measure. The Data Source is intended to identifythe chief source of data for development of the measurement result.4.The Data Generation for the performance measure. The Data Generation explains themethodology for development of measurement results.5.The Data Verification for the performance measure. The Data Verification identifies theprimary responsibilities relative to accuracy of the data generated and reported under the measure. It also describes data retention and records availability requirements asapplicable.6.The Measurement Formula for the performance measure. The Measurement Formula isa description of exactly how the measurement results are to be derived.7.The Measurement Notes applicable to the performance measure. As needed, this sectionprovides pertinent information concerning the conduct of the assessment under themeasure in question. It is an attempt to provide any relevant information concerning how to do the measurement, what is included in the measure, etc. It is not intended to cover the obvious, but to cover important issues that may not normally be obvious.By providing all of this information in one place, Departmental procurement offices will no longer have to refer to several different documents when determining how to assess performance under a measure, or how to document results. This new document will be a “living” document, modified by ME-62 as needed.2Customer PerspectivePerformance Objective: Customer SatisfactionPerformance Measure: TimelinessDefinition: Measures the extent of customer satisfaction with the timeliness of procurement processing, planning activities, and on-going communications.Data Source: Customer Survey.Data Generation: Accomplished by using standardized survey instrument. Individual survey responses are entered into the Excel Data Reduction Program which calculates results.Data Verification: Procurement Directors are responsible for accuracy of data and retention of Excel Program Reports in accordance with records management requirements. Reports will be made available for compliance and/or HQ reviews.Measurement Formula: Number of customers responding to the survey that are satisfied with timeliness divided by the total number of customers responding to the survey.Measurement Notes: Reporting offices are to use the standardized survey provided by HQ. Reporting offices are encouraged to add additional questions that have significance on the local level, but do not include the responses to these questions in the results reported to HQ.All offices are to survey a representative number of customers. In order to ensure the statistical accuracy of results, offices are to strive for a minimum of 30 survey responses. For most offices, the primary customers are the Procurement Request generators - those programmatic personnel that utilize and benefit from the contractor provided goods and services. If appropriate, offices may also wish to consider including program management, especially if there have been major procurement actions during the reporting period. The customers selected for the survey should be from the universe of customers that utilized the services of the procurement office during the reporting period. In the annual BSC report of assessment results, reporting offices are to describe the methodology used for selection of customers surveyed, and describe the rationale for its use.Survey responses should be anonymous (unless survey responder wishes to identifyhimself/herself), and should allow for the provision of comments.3Customer PerspectivePerformance Objective: Customer SatisfactionPerformance Measure: QualityDefinition: Measures the extent of customer satisfaction with the quality of goods and services delivered.Data Source: Customer Survey.Data Generation: Accomplished by using standardized survey instrument. Individual survey responses are entered into the Excel Data Reduction Program which calculates results.Data Verification: Procurement Directors are responsible for accuracy of data and retention of Excel Program Reports in accordance with records management requirements. Reports will be made available for compliance and/or HQ reviews.Measurement Formula: Number of customers responding to the survey that are satisfied with the quality of goods and services delivered divided by the total number of customers responding to the survey.Measurement Notes: Reporting offices are to use the standardized survey provided by HQ. Reporting offices are encouraged to add additional questions that have significance on the local level, but do not include the responses to these questions in the results reported to HQ.All offices are to survey a representative number of customers. In order to ensure the statistical accuracy of results, offices are to strive for a minimum of 30 survey responses. For most offices, the primary customers are the Procurement Request generators - those programmatic personnel that utilize and benefit from the contractor provided goods and services. If appropriate, offices may also wish to consider including program management, especially if there have been major procurement actions during the reporting period. The customers selected for the survey should be from the universe of customers that utilized the services of the procurement office during the reporting period. In the annual BSC report of assessment results, reporting offices are to describe the methodology used for selection of customers surveyed, and describe the rationale for its use.Survey responses should be anonymous (unless survey responder wishes to identifyhimself/herself), and should allow for the provision of comments.4Customer PerspectivePerformance Objective: Effective Service Partnership Performance Measure: Extent of customer satisfaction with the responsiveness, cooperation, and level of communication with the procurement office.Definition: Measures customer perception of the level of responsiveness, cooperation, and communication with the procurement office.Data Source: Customer Survey.Data Generation: Accomplished by using standardized survey instrument. Individual survey responses are entered into the Excel Data Reduction Program which calculates results.Data Verification: Procurement Directors are responsible for accuracy of data and retention of Excel Program Reports in accordance with records management requirements. Reports will be made available for compliance and/or HQ reviews.Measurement Formula: Number of customers responding to the survey that are satisfied with the responsiveness, cooperation, and level of communication divided by the total number of customers responding to the survey.Measurement Notes: Reporting offices are to use the standardized survey provided by HQ. Reporting offices are encouraged to add additional questions that have significance on the local level, but do not include the responses to these questions in the results reported to HQ.All offices are to survey a representative number of customers. In order to ensure the statistical accuracy of results, offices are to strive for a minimum of 30 survey responses. For most offices, the primary customers are the Procurement Request generators - those programmatic personnel that utilize and benefit from the contractor provided goods and services. If appropriate, offices may also wish to consider including program management, especially if there have been major procurement actions during the reporting period. The customers selected for the survey should be from the universe of customers that utilized the services of the procurement office during the reporting period. In the annual BSC report of assessment results, reporting offices are to describe the methodology used for selection of customers surveyed, and describe the rationale for its use.5Survey responses should be anonymous (unless survey responder wishes to identify himself/herself), and should allow for the provision of comments.6Internal Business PerspectivePerformance Objective: Acquisition Excellence Performance Measure: Extent to which internal quality control systems are effective.Definition: Measures the extent to which quality control systems are effective, particularly with respect to compliance with laws and regulations, vendor selection and performance, contract administration, and subcontractor oversight.Data Source: Procurement Manager’s Self-Assessment Survey, local protest data, compliance review results.Data Generation: Accomplished by using standardized survey instrument.Data Verification: Procurement Directors are responsible for accuracy of data and retention of Excel Program Reports in accordance with records management requirements. Reports will be made available for compliance and/or HQ reviews.Measurement Formula: Procurement Director’s individual assessment of the extent to which internal quality control systems are effective.Measurement Notes: Procurement Directors have flexibility in conducting this survey. For some offices, only the Procurement Director completes the survey. In others, the director and his/her senior staff complete the survey, and the scores are averaged. Either way is acceptable, provided that it is consistently applied over time - in other words, don’t switch back and forth each year. Pick a methodology and stick to it otherwise trend data can be negatively impacted.This survey provides for scoring on a 1 to 5 basis, and allows for assignment of partial points (e.g. 4.5, 3.2, etc). However, it is necessary to convert the survey results into a percentage format before reporting the results to HQ. Therefore, 5 is equivalent to 100%, 4 to 80%, 3 to 60%, 2 to 40%, 1 to 20%. An overall rating of 4.7 would be equivalent to 94% (4.7 divided by 5).When developing an assessment rating under the Procurement Manager’s Self-Assessment Survey, be sure to consider the results of the most recent compliance review conducted of the procurement organization.Procurement Directors are also to identify any sustained protests occurring during the assessment period.Internal Business PerspectivePerformance Objective: Most Effective Use of Contracting Approaches to Maximize Efficiency and Cost Effectiveness - Use of Purchase Cards Performance Measure: Number of purchase card transactions as a percentage of total actions under $25,000.Definition: Measures the number of purchase card actions as a % of actions under $25K. This measure is tracked at the Departmental level only; offices do not have to report on this measure.Data Source: Contracts Under Twenty Five Thousand System (CUTS), Bank of America.Data Generation: Data is tabulated from the listed tracking systems.Data Verification: Procurement Directors are responsible for accurately reporting results in tracking systems and retention of records in accordance with records management requirements. Records will be made available for compliance and/or HQ reviews.Measurement Formula: The number of purchase card transactions under $25K divided by the total number of all transactions under $25K (including purchase cards).Measurement Notes: This measure appears in the OMB sponsored Government-wide Procurement Performance Measurement Program.Internal Business PerspectivePerformance Objective: Most Effective Use of Contracting Approaches to Maximize Efficiency and Cost Effectiveness - Use of Purchase Cards Performance Measure: Total amount of cost avoidance through the use of purchase cards.Definition: Measures the amount of cost avoided by using a purchase card as opposed to a purchase order. This measure is tracked at the Departmental level only; offices do not have to report on this measure.Data Source: Bank of America.Data Generation: Data is tabulated from the listed tracking system.Data Verification: Procurement Directors are responsible for accurately reporting results in tracking systems and retention of records in accordance with records management requirements. Records will be made available for compliance and/or HQ reviews.Measurement Formula: The number of purchase card transactions multiplied by $68 (see Measurement Notes).Measurement Notes: The savings for each action is based on a study conducted by the Procurement Executive’s Association in concert with the Office of Federal Procurement Policy. Their findings indicated that approximately $68 in administrative processing fees is saved by the Government each time that a purchase card is used rather than a standard purchase order. This measure appears in the OMB sponsored Government-wide Procurement Performance Measurement Program.Internal Business PerspectivePerformance Objective: Most Effective Use of Contracting Approaches to Maximize Efficiency and Cost Effectiveness - Use of Electronic Commerce Performance Measure: Percent of purchase and delivery orders issued through electronic commerce as a percentage of simplified acquisition actions.Definition: Measures the percent of purchase and delivery orders issued through electronic commerce as a percentage of total simplified acquisition actions.Data Source: Electronic Purchase and Data Systems, Procurement and Assistance Data System (PADS), CUTS, Industry Interactive Procurement System (IIPS), DOE/C-Web, local tracking systems.Data Generation: Data is tabulated from the listed tracking systems.Data Verification: Procurement Directors are responsible for accurately reporting results and retention of records in accordance with records management requirements. Records will be made available for compliance and/or HQ reviews.Measurement Formula: The number of purchase and delivery orders issued through electronic commerce divided by the total number of simplified acquisition actions.Measurement Notes: Although most electronic commerce actions under this measure are tracked in DOE/C-Web, actions may also include those processed under IIPS, GSA Advantage, reverse auctions, and GSA’s e-commerce web site.When calculating this measure, note that purchase cards do not count as electronic commerce actions. Accordingly, they should not be counted as part of the simplified acquisition base used to derive the results for this measure.Internal Business PerspectivePerformance Objective: Most Effective Use of Contracting Approaches to Maximize Efficiency and Cost Effectiveness - Use of Electronic Commerce Performance Measure: Percent of synopses (for which widespread notice is required) and associated solicitations posted on FEDBIZOPPS.Definition: Measures the percent of synopses that are required to be posted on the Government’s single point of entry, applicable to actions over $25,000 only. This measure is tracked at the Departmental level only; offices do not have to report on this measure.Data Source: Electronic Purchase and Data Systems, PADS, IIPS, DOE/C-Web.Data Generation: Data is tabulated from the listed tracking systems.Data Verification: Procurement Directors are responsible for accuracy of data entered into the listed tracking systems.Measurement Formula: The number of synopses for actions over $25K that are posted on FEDBIZOPPS divided by the total number of synopses for actions over $25K.Measurement Notes: Actions posted on FEDBIZOPPS were previously required to be posted in the Commerce Business Daily. Offices are to utilize electronic methods and procedures (i.e. IIPS) to ensure that the required synopses and notices reach FEDBIZOPPS.Internal Business PerspectivePerformance Objective: Most Effective Use of Contracting Approaches to Maximize Efficiency and Cost Effectiveness- Use of Electronic Commerce Performance Measure: Percent of all new competitive acquisition transactions over $100,000 conducted through electronic commerce.Definition: Measures the percent of competitive acquisition actions valued at over $100,000 that are conducted through electronic means (i.e., both the solicitation (if one is required) and award are conducted electronically). This measure is tracked at the Departmental level only; offices do not have to report on this measure.Data Source: PADS, IIPS.Data Generation: Data is tabulated from the listed tracking systems.Data Verification: Procurement Directors are responsible for accuracy of data entered into the listed tracking systems.Measurement Formula: The number of new competitive acquisition transactions over $100K conducted through electronic commerce divided by the total number of new competitive acquisition transactions over $100K.Measurement Notes: Actions under this measure must be solicited (if required) and awarded through IIPS.Note that this measure tracks acquisition actions only. However, requirements now exist for utilization of IIPS for financial assistance actions. See Financial Assistance Letter 2002-03 issued December 6, 2002 for more information.For delivery orders under GSA schedule that are coded as competitive in PADS, these actions do not normally require any form of “solicitation.” Therefore, they would count under this measure if awarded electronically.Task orders under DOE multiple award contracts DO require solicitation of the selected contractors. Therefore, both the task order solicitation action and resulting award must be done electronically to count under this measure.Internal Business Perspective Performance Objective: Most Effective Use of Contracting Approaches to Maximize Efficiency and Cost Effectiveness- Performance-Based Service ContractsPerformance Measure: PBSCs awarded as a percentage of total eligible new service contract awards (applicable to actions over $100,000).Definition: Measures the number of new Performance-Based Service Contracts awarded as a percentage of total eligible new service contract awards for actions exceeding $100K.Data Source: PADS.Data Generation: Data is tabulated from the listed tracking system.Data Verification: Procurement Directors are responsible for accuracy of data entered into PADS. On a routine basis, HQ will randomly sample pre and post award actions and compare against the FAR PBSC standards.Measurement Formula: The number of new PBSC awards over $100K divided by the total number of eligible new service contract awards over $100K.Measurement Notes: The word “eligible” refers to the fact that certain service contract awards are not considered “eligible” for processing in a performance-based fashion and are therefore excluded. These exclusions are Construction, A&E, and Utilities.This measure includes M&Os, and all task and delivery orders for services over the specified dollar threshold.The focus of the measure is new award actions only.Internal Business Perspective Performance Objective: Most Effective Use of Contracting Approaches to Maximize Efficiency and Cost Effectiveness- Performance-Based Service ContractsPerformance Measure: Percent of total eligible service contract dollars obligated for PBSCs (applicable to all actions over $25,000).Definition: Measures the dollars obligated on performance-based service contracts (with a contract value over $25K) as a percentage of total eligible service contract dollars obligated. This measure is tracked at the Departmental level only; offices do not have to report on this measure.Data Source: PADS.Data Generation: Data is tabulated from the listed tracking system.Data Verification: Procurement Directors are responsible for accuracy of data entered into PADS. On a routine basis, HQ will randomly sample pre and post award actions and compare against the FAR PBSC standards.Measurement Formula: The amount of dollars obligated on PBSC awards whose current contract value is over $25K divided by the total amount of dollars obligated on eligible service contract awards whose current contract value is over $25K.Measurement Notes: The word “eligible” refers to the fact that certain service contract awards are not considered “eligible” for processing in a performance-based fashion and are therefore excluded. These exclusions are Construction, A&E, and Utilities.This measure includes M&Os, and all task and delivery orders for services over the specified dollar threshold.This action applies to any dollars obligated on a performance-based service contract whose current contract dollar value exceeds $25K.This measure appears in the OMB sponsored Government-Wide Procurement Performance Measurement Program, and the action is tracked at the $25K level to be consistent with this program.Internal Business PerspectivePerformance Objective: Most Effective Use of Contracting Approaches to Maximize Efficiency and Cost Effectiveness - Use of Competition Performance Measure: Percent of total dollars obligated on competitive actions over $25,000.Definition: Measures the percent of dollars obligated on competitive acquisition actions over $25K compared to all actions over $25K. This measure is tracked at the Departmental level only; offices do not have to report on this measure.Data Source: PADS.Data Generation: HQ will generate data from PADS.Data Verification: Procurement Directors are responsible for accuracy of data entered into PADS.Measurement Formula: Total dollars of actions in the Individual Procurement Action Report (IPAR) Block 78 A+C divided by the total dollars of actions in Block 78 A+C+D.Measurement Notes: This action applies to any dollars obligated during the fiscal year on a contract that was awarded competitively and whose current contract dollar value exceeds $25K.This measure appears in the OMB sponsored Government-wide Procurement Performance Measurement Program which is responsible for the above formula.Block 78 of the IPAR is entitled “Ext Competed” and contains the following choices:A = Competed actionB = Not available for competitionC = Follow-on to competed actionD = Not competedAs can be seen, actions not available for competition are excluded from consideration. Interagency agreements are also excluded.Internal Business Perspective Performance Objective: Most Effective Use of Contracting Approaches to Maximize Efficiency and Cost Effectiveness - Use of CompetitionPerformance Measure: Percent of actions competed for actions over $25,000.Definition: Measures the percent of new acquisition contract award actions competed for actions over $25K. This measure is tracked at the Departmental level only; offices do not have to report on this measure.Data Source: PADS.Data Generation: HQ will generate data from PADS.Data Verification: Procurement Directors are responsible for accuracy of data entered into PADS.Measurement Formula: The number of actions in the Individual Procurement Action Report (IPAR) Block 78 A+C divided by the number of actions in Block 78 A+C+D.Measurement Notes: This measure appears in the OMB sponsored Government-wide Procurement Performance Measurement Program which is responsible for the above formula.Block 78 of the IPAR is entitled “Ext Competed” and contains the following choices:A = Competed actionB = Not available for competitionC = Follow-on to competed actionD = Not competedAs can be seen, actions not available for competition are excluded from consideration. Interagency agreements are also excluded.Internal Business PerspectivePerformance Objective: Most Effective Use of Contracting Approaches to Maximize Efficiency and Cost Effectiveness - Use of Competition Performance Measure: Percent of total dollars obligated on orders over $25,000 under MACs that were awarded using the fair opportunity process.Definition: Measures the percent of total dollars obligated on orders over $25,000 under Multiple Award Contracts that utilized the fair opportunity process. This measure is tracked at the Departmental level only; offices do not have to report on this measure.Data Source: PADS.Data Generation: HQ will generate data from PADS.Data Verification: Procurement Directors are responsible for accuracy of data entered into PADS.Measurement Formula: The total dollars of actions reported in IPAR Block 44 A divided by the total dollars of actions in Block 44 A through E.Measurement Notes: This measure appears in the OMB sponsored Government-wide Procurement Performance Measurement Program which is responsible for the above formula. Block 44 of the IPAR is entitled “Multiple Award Contract Fair Opportunity” and contains the following choices:A = Fair Opportunity ProcessB = UrgencyC = One/Unique SourceD = Follow-On ContractE = Minimum GuaranteeThe intent of this measure is to track dollars obligated on those orders whose current value is over $25K that were awarded using the “fair opportunity” process as opposed to those that utilize urgency, one/unique source, follow-on contract, or minimum guarantee.Internal Business PerspectivePerformance Objective: Most Effective Use of Contracting Approaches to Maximize Efficiency and Cost Effectiveness - Use of Competition Performance Measure: Percent of actions for orders over $25,000 under MACs that were awarded using the fair opportunity process.Definition: Measures the percent of actions for orders over $25,000 under Multiple Award Contracts that utilized the fair opportunity process. This measure is tracked at the Departmental level only; offices do not have to report on this measure.Data Source: PADS.Data Generation: HQ will generate data from PADS.Data Verification: Procurement Directors are responsible for accuracy of data entered into PADS.Measurement Formula: Number of actions reported in IPAR Block 44 A divided by the total number of actions in Block 44 A through E.Measurement Notes: This measure appears in the OMB sponsored Government-wide Procurement Performance Measurement Program which is responsible for the above formula. Block 44 of the IPAR is entitled “Multiple Award Contract Fair Opportunity” and contains the following choices:A = Fair Opportunity ProcessB = UrgencyC = One/Unique SourceD = Follow-On ContractE = Minimum GuaranteeThe intent of this measure is to track the number of orders over $25K awarded using the “fair opportunity” process as opposed to those that utilize urgency, one/unique source, follow-on contract, or minimum guarantee.Internal Business PerspectivePerformance Objective: Streamlined Processes - Procurement Administrative Lead Time (PALT) for AcquisitionPerformance Measure: For new competitive service awards over $100,000 (except major site and facility management contracts): Determine the average time from receipt of offer (or solicitation closing date if applicable) to date of award for each new award. Calculate the percent of award actions that fall within the target range (include those actions that outperform the range).Definition: Measures the percent of applicable awards that are processed within the specified target lead time range.Data Source: PADS, Procurement and Assistance Tracking System (PATS), local tracking systems.Data Generation: Data is generated from PADS, PATS, and local tracking systems.Data Verification: Procurement Directors are responsible for accurately reporting results and retention of records in accordance with records management requirements. Records will be made available for compliance and/or HQ reviews.Measurement Formula: Number of award actions that fall within the target range (or outperform the range) divided by the total number of actions.Measurement Notes: This measure assesses the percent of awards that are processed within the designated target range, which is expressed in days. Those actions that are awarded faster (sooner) than the target range of days are to count as having met the target.Each action is tracked from the receipt of offer (or solicitation closing date, if applicable) until date of award. Since the vast majority of our competitive acquisition actions have solicitations, you will track from the solicitation closing date. On multiple award solicitations, you will be tracking the PALT on all awards made.。
平衡计分卡的英文定义(7篇)以下是网友分享的关于平衡计分卡的英文定义的资料7篇,希望对您有所帮助,就爱阅读感谢您的支持。
篇一:平衡计分卡的英文定义平衡记分卡(BSC)是一个概念,这个概念使战略的管理适合信息时代的商业需求。
简单地,创建和实施公司战略的过程现在需要:(1)处理公司运作、人力和知识的全球化、差异化、多样化;(2)允许经常评价和更新战略,以对付快速变化的商业环境;(3)认识到诸如知识、关系、或对变化的能力和学习的能力等无形资产的重要性,而不是许多传统的无形资产。
1.1 平衡记分卡(BSC)是如何做的?平衡记分卡(BSC)概念通过以下几个方面构成和扩展了传统战略计划编制和管理:a、提供整个组织运作连接清晰的共同愿景,用结构化的方法去定义取得愿景的运作行动;b、提供一个方法从整个组织中获得相关信息,有效地评估战略的进程和目标的有效性;c、通过扩展管理参数而不是传统的财务量度,战略性地管理无形和有形资产。
1.2 结论平衡记分卡(BSC)概念通过联合组织所有各部门的活动,围绕共同理解的目标,来支持战略计划的编制和实施,并辅助战略的评估和更新。
2.0 什么是平衡记分卡(BSC)?Kaplan 和Norton 在1992年的哈佛商业评论中介绍了平衡记分卡(BSC)的概念,他们的目的是要开发一个增强公司长期战略计划编制的工具. 结果显示:传统的绩效量度聚焦在外部的财务数据,很快会变得陈旧。
在信息时代的企业需要更多有效计划编制的工具。
为了这个目的,Kaplan 和Norton 介绍了4个不同评价公司活动的维度。
这些维度是财务、客户满意度、内部过程、学习和创新。
财务维度的过程与传统绩效量度观点差不多,另外三个维度聚焦在无形资产的管理,因为它们可能决定公司长久运行的成功。
设立平衡记分卡(BSC)的过程,意味者清晰公司的愿景,布置战略到行动计划。
一个仔细准备的平衡记分卡(BSC)是公司战略的描述,它包括了整个组织:在评论平衡记分卡(BSC)草案中,每个人的贡献是重要的。