FluorCam叶绿素荧光成像文献 2012 Arabidopsis BPG2 a phytochromeregulated gene whose protein
- 格式:pdf
- 大小:871.76 KB
- 文档页数:14
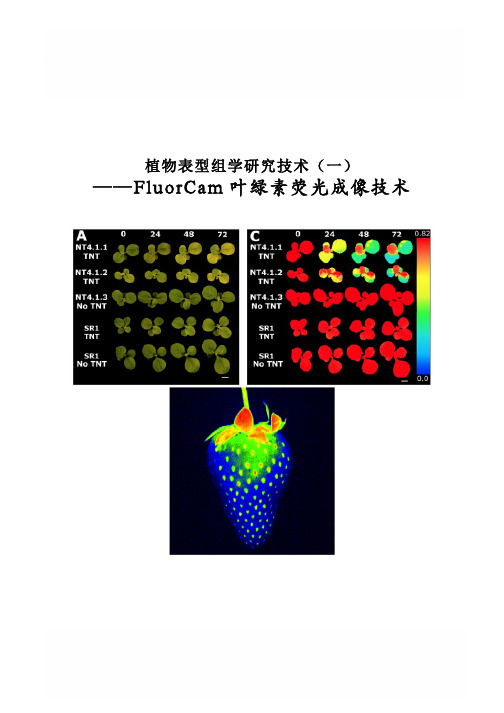
植物表型组学研究技术(一) ——FluorCam叶绿素荧光成像技术FluorCam叶绿素荧光成像技术Rousseau等(High throughput quantitative phenotyping of plant resistance using chlorophyll fluorescence image analysis.Plant Methods, 2013, 9:17),利用FluorCam开放式叶绿素荧光成像系统作为高通量表型分析平台,采用图像阈值分割等分析方法,对植物病原体感染进行了定量分析检测,根据Fv/Fm将感染分为不同阶段/等级,特别是可以将用其它方法难以分辨出来的感染前期加以分辨,并对5个品种的菜豆对普通细菌性疫病的抗性进行了定量分析评价。
PSI公司首席科学家Nedbal教授与公司总裁Trtilek博士等首次将PAM叶绿素荧光技术(Pulse Amplitude Modulated technique——脉冲调制技术)与CCD技术结合在一起,于1996年在世界上成功研制生产出FluorCam叶绿素荧光成像系统(Heck等,1999;Nedbal等,2000;Govindjee and Nedbal, 2000)。
FluorCam叶绿素荧光成像技术成为上世纪90年代叶绿素荧光技术的重要突破,使科学家对光合作用与叶绿素荧光的研究一下子进入二维世界和显微世界,广泛应用于植物生理生态、植物胁迫与抗性监测、作物育种、植物表型分析等。
不同于其它成像分析技术,FluorCam叶绿素荧光成像只对叶绿素荧光波段敏感,可以有效避免环境光的干扰,特异性、高灵敏度反映植物生理生态状况。
主要功能特点如下:1)高灵敏度CCD,时间分辨率可达50帧/秒,有效抓取叶绿素荧光瞬变;可选配高分辨率CCD,分辨率1392x1040像素,用于气孔功能成像分析、稳态荧光如GFP荧光测量等2)具备完备的自动测量程序(protocol),可自由对自动测量程序进行编辑:a)Fv/Fm:测量参数包括Fo,Fm,Fv,QY等b)Kautsky诱导效应:Fo,Fp,Fv,Ft_Lss,QY,Rfd等荧光参数c)荧光淬灭分析:Fo,,Fm,Fp,Fs,Fv,QY,ΦIINPQ,Qp,Rfd,qL等50多个参数d)光响应曲线LC:Fo,Fm,QY,QY_Ln等荧光参数e)PAR吸收f)GFP等静态荧光测量g)OJIP与JIP-test(FKM与封闭式荧光成像系统):Fo,Fj,Fi,P 或Fm,Mo(OJIP曲线初始斜率)、OJIP固定面积、Sm(对关闭所有光反应中心所需能量的量度)、QY、PI等26个参数3)自动重复实验功能,可无人值守自动循环完成选定的实验程序,重复次数及间隔时间客户自定义,成像测量数据自动按时间日期存入计算机4)FluorCam成像分析软件:具在线功能(Live)、实验程序选配功能(Protocols)、成像预处理功能(Pre-processing)及成像分析结果展示报告功能(Result)四大功能模块a)在线功能(live):可对仪器和样品进行在线测试调试、快照、显示实验进度、在线显示荧光瞬变动态视频等b)实验程序选配功能(protocols):可选配不同的实验程序,并可对实验程序进行编辑、设置、储存(以备以后使用同样的实验程序)等c)成像预处理功能:可浏览整个测量视频及任何点、任何区域的荧光动态变化曲线,可进行“选区操作”或“分级操作”(图像阈值分割功能);选区操作可对成像进行自动或手动选区(ROI),还可使用“模具”包括多孔板模具、培养皿模具、桌面模具进行模具选区;分级操作具备荧光强度刻度标尺和四个“游标”,通过移动4个游标可以将成像按不同强度划分成不同的荧光范围组进行分析处理,可设置不同的阈值进行图像阈值分割d)结果展示报告功能:可展示所有选区(ROI)的叶绿素荧光参数值及其图像、每个参数的频率直方图及每个ROI的荧光动态图等,可对原数据(kinetic)、叶绿素荧光参数等导出到excel表,还可对每个参数成像图存储成位图5)数据分析具备“信号计算再平均”模式(算数平均值)和“信号平均再计算模式”两种功能模式,在高信噪比的情况下选用“信号计算再平均”模式,在低信噪比的情况下选择“信号平均再计算”模式以过滤掉噪音带来的误差FluorCam叶绿素荧光参数:参数符号概念描述Size 面积(像素值),经校准可测量实际面积Fo 暗适应后的最小荧光Fo_Dn 暗松弛最小荧光,红外光诱导PSIFo_Ln 光适应后的最小荧光,红外光诱导PSIFo_Lss 光适应后稳态最小荧光,红外光诱导PSIFm 暗适应后最大荧光Fm_Dn 暗松弛最大荧光Fm_Ln 光适应最大荧光Fm_Lss 光适应稳态最大荧光Fp Kautsky诱导效应最大荧光Ft_Dn 暗松弛即时荧光Ft_Ln 光适应即时荧光Ft_Lss 光适应稳态荧光Fv Fm-FoNPQ_Dn 暗松弛非光化荧光淬灭,=(Fm-Fm_Dn)/Fm_DnNPQ_Ln 光适应非光化荧光淬灭,=(Fm-Fm_Ln)/Fm_LnNPQ_Lss 稳态非光化荧光淬灭,=(Fm-Fm_Lss)/Fm_LssqP_Dn 暗松弛光化学荧光淬灭,=(Fm_Dn−Ft_Dn)/Fm_Dn−Fo_DnqP_Ln 光适应光化学淬灭,=(Fm_Ln−Ft_Ln)/(Fm_Ln−Fo_Ln)qP_Lss 稳态光适应光化学淬灭,=(Fm_Lss−Ft_Lss)/(Fm_Lss−Fo_Lss)qL_Ln 基于“Lake”模型的光适应光化学淬灭qL_Lss 基于“Lake”模型的稳态光适应光化学淬灭QY_Dn 暗松弛光量子效率,=(Fm_Dn−Ft_Dn)/Fm_DnQY_Ln或ΔF/Fm 光适应光量子效率,=(Fm_Ln−Ft_Ln)/Fm_LnQY_Lss 稳态光量子效率,=(Fm_Lss−Ft_Lss)/Fm_LssFv/Fm或QY_max 最大光量子效率Fv/Fm_Ln 光适应光量子效率,=(Fm_Ln−Fo_Lss)/Fm_LnFv/Fm_Lss 稳态光量子效率,=(Fm_Lss−Fo_Lss)/Fm_LssRfd_Ln 光适应荧光衰减率,用于评估植物活力,=(Fp−Ft_Ln)/Ft_LnRfd_Lss 稳态荧光衰减率,用于评估植物活力,=(Fp−Ft_Lss)/Ft_Lss除上述叶绿素荧光参数外,还可以成像测量PAR吸收、植物光谱反射指数NDVI等,叶片大小(或植物大小)可以反映植物的生长等。
Genetic Analysis of the Hox Hydrogenase in theCyanobacterium Synechocystis sp.PCC 6803Reveals Subunit Roles in Association,Assembly,Maturation,and Function *□SReceived for publication,June 15,2012,and in revised form,November 7,2012Published,JBC Papers in Press,November 8,2012,DOI 10.1074/jbc.M112.392407Carrie Eckert ‡1,Marko Boehm ‡§,Damian Carrieri ‡,Jianping Yu ‡,Alexandra Dubini ‡,Peter J.Nixon §,and Pin-Ching Maness ‡From the ‡Biosciences Center,National Renewable Energy Laboratory,Golden,Colorado 80401and the §Department of Life Sciences,Imperial College London,South Kensington Campus,London SW72AZ,United KingdomHydrogenases are metalloenzymes that catalyze 2H ؉؉2e ؊7H 2.A multisubunit,bidirectional [NiFe]-hydrogenase has been identified and characterized in a number of bacteria,including cyanobacteria,where it is hypothesized to function as an electron valve,balancing reductant in the cell.In cyanobac-teria,this Hox hydrogenase consists of five proteins in two func-tional moieties:a hydrogenase moiety (HoxYH)with homology to heterodimeric [NiFe]-hydrogenases and a diaphorase moiety (HoxEFU)with homology to NuoEFG of respiratory Complex I,linking NAD(P)H 7NAD(P)؉as a source/sink for electrons.Here,we present an extensive study of Hox hydrogenase in the cyanobacterium Synechocystis sp.PCC 6803.We identify the presence of HoxEFUYH,HoxFUYH,HoxEFU,HoxFU,and HoxYH subcomplexes as well as association of the immature,unprocessed large subunit (HoxH)with other Hox subunits and unidentified factors,providing a basis for understanding Hox maturation and assembly.The analysis of mutants containing individual and combined hox gene deletions in a common parental strain reveals apparent alterations in subunit abun-dance and highlights an essential role for HoxF and HoxU in complex/subcomplex association.In addition,analysis of indi-vidual and combined hox mutant phenotypes in a single strain background provides a clear view of the function of each subunit in hydrogenase activity and presents evidence that its physiolog-ical function is more complicated than previously reported,with no outward defects apparent in growth or photosynthesis under various growth conditions.Hydrogenase enzymes are a unique and diverse family of metalloenzymes widely distributed throughout Archaea,Pro-karyotes,and some unicellular Eukaryotes that catalyze the reduction/oxidation of H ϩ/H 2.These enzymes are classified by their metal-containing active sites and include [Fe]-hydroge-nases,[FeFe]-hydrogenases,and [NiFe]-hydrogenases (1).The [NiFe]-hydrogenases are minimally heterodimeric,consisting of a large catalytic subunit and a small subunit containing at least one [FeS]cluster that functions in electron transfer to and from the large subunit (1).The maturation of [NiFe]-hydroge-nases involves at least six maturation proteins (HypABCDEF)essential for the assembly of the [NiFe]active site.Some [NiFe]-hydrogenases additionally require a specialized protease that cleaves the large subunit’s C terminus,a step required for hydrogenase function (2).Research in Escherichia coli suggests that the hydrogenase small subunit only associates with the large subunit after it is fully processed (3).Among the diverse hydrogenases,the bidirectional [NiFe]-hydrogenase (Hox)in cyanobacteria is of great interest for basic biological study as well as for the development of solar hydrogen production technologies (4–6).NAD(P)-linked Hox hydrogenases have been identified and characterized in cyano-bacteria (4,5),the Gram-positive bacterium Rhodococcus opacus (7,8),the Gram-negative bacterium Ralstonia eutropha (6),and the purple sulfur photosynthetic bacteria Thiocapsa roseopersicina and Allochromatium vinosum (9–12).These Hox hydrogenases are multimeric with at least four related sub-units expressed from a single operon.HoxH and HoxY form the hydrogenase moiety and are homologous to the large and small subunits of prototypical heterodimeric [NiFe]-hydrogenases,respectively (1).The [FeS]cluster-containing subunits HoxF,HoxU,and,in some organisms,HoxE form the diaphorase moi-ety (13,14)that catalyzes the oxidation/reduction of NAD(P)H/NAD(P)ϩ(via FMN and NAD binding sites in HoxF)coupled to the hydrogenase moiety (HoxYH)(10,12–15).The R.eutropha Hox hydrogenase does not contain HoxE and instead harbors an unrelated fifth subunit,HoxI,which functions in linkage to NADPH (16).*This work was supported by the National Renewable Energy Laboratory’sLaboratory Directed Research and Development Program (to P.M.,J.Y.,C.E.,and D.C.),the United States Department of Energy Fuel Cell Technol-ogies Program (contract number DE-AC36-08-GO28308)(to P.M.and J.Y.),the United States Department of Energy Biological and Environmental Research Program (contract KP160103)(to M.B.and A.D.),and Engineer-ing and Physical Sciences Research Council Grant (EP/F002070X/1)(to M.B.and P.N.).□SThis article contains supplemental Table 1and Figs.1–5.1To whom correspondence should be addressed:Biosciences Center,NREL,15013Denver West Pkwy.,Golden,CO 80401.Tel.:303-384-6891;Fax:303-384-7836;E-mail:carrie.eckert@.THE JOURNAL OF BIOLOGICAL CHEMISTRY VOL.287,NO.52,pp.43502–43515,December 21,2012Published in the U.S.A.at NATL RENEWABLE ENERGY, on January 16, 2013 Downloaded from /content/suppl/2012/11/08/M112.392407.DC1.htmlSupplemental Material can be found at:Purification of the Hox hydrogenase has been performed in some of the organisms it has been characterized in with varied results.In R.eutropha,the purified Hox complex is Hox-FUYHI2,although HoxI(not present in other characterized Hox hydrogenases)dissociates easily upon more stringent puri-fication conditions(which is why the complex was initially characterized as HoxFUYH)(16).Other purifications in R.eutropha utilizing gene knockouts and ectopic expression demonstrate that HoxYH and HoxFU subcomplexes can be iso-lated,although these subcomplexes were reportedly unstable (13).In A.vinosum(12)and the cyanobacterium Gleocapsa alpicola CALU743(17),attempted purifications of native com-plex resulted in isolation of only HoxYH,whereas in T.roseop-ersicina(18)and Synechocystis(19,20),intact HoxEFUYH complexes were purified.Purification of the Synechocystis Hox hydrogenase by Schmitz et al.(19)resulted in a dimer of a 1:1:1:1:1HoxE/F/U/Y/H complex via a series of column chro-matography steps,whereas Germer et al.(20)purified a com-plex with a0.2:2:2:1:1HoxE/F/U/Y/H ratio using a StrepII-tagged HoxF,raising questions about Hox complex assembly and association in vivo.The physiological role of Hox hydrogenase varies,depending on the organism in which it is present,but it generally functions in anoxic/micro-oxic conditions due to a reversible inactivationby O2(1).In T.roseopersicina,Hox hydrogenase catalyzes H2production under dark,fermentative conditions and in lightwhen thiosulfate is present and alternatively functions in H2 uptake in light when O2is absent(11).The Hox hydrogenase ofR.eutropha(soluble hydrogenase)functions in H2oxidation linked to the regeneration of NADH in support of carbon fixa-tion(6).In cyanobacteria,Hox hydrogenase is expressed under both anaerobic and aerobic conditions(4,21)but is only active under dark,fermentative conditions and in the transition fromdark to light prior to inhibition by O2generated during photo-synthesis(22–24).Respiration and nitrate assimilation mutantsexhibit increased H2photoevolution rates under low O2condi-tions,whereas defects in photosynthetic reactions/ratios have been reported in Hox hydrogenase mutants(15,22–26).There-fore,it is hypothesized that the Hox hydrogenase functions as an electron valve for cells by H2production/oxidation in response to changes in redox states(25,26).HoxEFU are the only homologs for NuoEFG of respiratory complex I in cyano-bacteria,but there is no evidence to date that these diaphorase subunits play any role in respiration(14,27–30).In this work,we generated a series of Hox hydrogenase mutants in a common parental strain,deleting individual hox genes or combinations of hox genes in the unicellular cyanobac-terium Synechocystis sp.PCC6803.This comprehensive collec-tion of hox mutants enabled us to perform systematic studies of mutation effects on complex/subcomplex formation and com-position,subunit abundance,and hydrogenase activity.In addi-tion,we also provide data for growth,photosynthesis,and fer-mentation in a hox operon deletion mutant compared with wild type(WT),revealing that some previously reported hox mutant phenotypes may have been due to differences in strain back-grounds(31,32).EXPERIMENTAL PROCEDURESStrain Background/Construction—All hox mutants weregenerated in a Synechocystis sp.PCC6803glucose-tolerant strain from Teruo Ogawa,who also provided the whole operon deletion,hoxϪ::hygromycin resistance.The hoxHϪdeletion was constructed in a pSMART LC-Amp vector(Lucigen,Inc.) containing a3.6-kb region spanning hoxY and hoxH cut with SspI(removing816bp of hoxH)to insert the kanamycin resist-ance cassette from pUC4K.All remaining hox deletion strains were created by two-step fusion PCR(33)for open reading frame(ORF)replacement,combiningϳ600-bp5Ј-and3Ј-flanking regions for each hox gene ORF replaced with the fol-lowing antibiotic resistance gene ORFs:hoxEϪ::aac3ia(gen-tamicin resistance),hoxFϪ::ermC(erythromycin resistance), hoxUϪ::aph(kanamycin resistance),and hoxYϪ::dfra17(spec-tinomycin resistance).An slr0168neutral site integration vec-tor containing a plastocyanin(petE)promoter for ectopic gene expression(34)was altered by the addition of a225-bp frag-ment from pETDuet containing the T7terminator into the PpuMI restriction site.PCR primers to amplify HoxYH or HoxH from genomic DNA were constructed with sequence encoding His6/HRV3C protease site at the N terminus and5Ј-and3Ј-specific SapI sites for insertion behind the petE pro-moter following restriction digestion and ligation.The pPSBA2KS vector for the integration behind the psbAII pro-moter(35)was altered by removal of a SalI site via partial digest and blunting to allow for retention of the kanamycin resistance gene.PCR primers were designed for amplification and inser-tion of an N-terminal His6-tagged hoxE gene between NdeI and SalI sites.Transformations were conducted by incubatingϳ1g of linear purified fusion PCR products or targeted integra-tion vectors with200l of cells(adjusted to OD730ϭ2.5fromcell cultures at OD730ϭ0.2–0.5)for6h,followed by the addi-tion of2ml of BG11,24-h outgrowth in culture tubes under standard growth conditions,and plating of200l on BG11 plates with antibiotics as required for selection(200g/ml hygromycin or kanamycin,100g/ml gentamicin,erythromy-cin,spectinomycin,or chloramphenicol).Strain Growth—Cultures were inoculated into BG11medium(ATCC medium616)supplemented with3M NiCl2,20m M TES(unbuffered),100m M NaHCO3,and antibiotics as required(one-half concentrations as used on plates listedabove)at an initial OD730ϭ0.05and were grown by shaking inculture flasks with5%CO2under50microeinsteins2(E)mϪ2 sϪ1continuous light from cool white fluorescent bulbs.Cul-tures were generally grown to logarithmic/linear growth phase(OD730ϭ0.2–0.8)for analysis.FPLC Analysis of Synechocystis sp.PCC6803WT Soluble Extract—Soluble extract was prepared from a WT50-ml liquidculture at an OD730Ͼ1(stationary phase).Cells were har-vested,resuspended,and washed twice in ACA buffer(750m M ⑀-amino caproic acid,50m M BisTris/HCl,pH7.0,0.5m M EDTA).Approximately200l of glass beads(150–212m;2The abbreviations used are:E,microeinsteins;MV,methyl viologen;BN,blue native;PSI and PSII,photosystem I and II,respectively;ETR,electron transport rate;BisTris,2-[bis(2-hydroxyethyl)amino]-2-(hydroxymethyl)propane-1,3-diol.Cyanobacterial Hox Hydrogenase Complex Association and Functionat NATL RENEWABLE ENERGY, on January 16, Downloaded fromSigma-Aldrich)were added to the cell suspension(ϳ500l), and cells were broken using a Disruptor Genie digital multi-place vortexer(Scientific Industries)at4°C for5min,setting 3,000,followed by centrifugation for10min at maximum speed in a microcentrifuge.Subsequently,2l of DNase I(10,000 units/ml,Thermo Scientific)was added,and the sample was spun again in an ultracentrifuge at100,000ϫg for30min at 4°C.For FPLC,the resulting supernatant was normalized toOD650ϭ10(typically,the OD650of a1:20dilution was mea-sured).To solubilize any remaining thylakoid membrane frag-ments,-dodecyl-D-maltoside was added to a final concentra-tion of0.5%(w/v)from a10%(w/v)stock solution.100l of this soluble extract was loaded onto a Superdex20010/300size exclusion column(GE Healthcare)connected to an Akta Puri-fier FPLC system(GE Healthcare).The sample was run at a flow rate of0.5ml minϪ1with50m M Tris,pH7.5,100m M NaCl,and 0.03%(w/v)-dodecyl-D-maltoside as the buffer.0.5-ml frac-tions were collected by a Frac-950fraction collector(GE Healthcare).A high molecular weight marker mix(GE Health-care)was run as a control for relative protein sizes in the frac-tions(supplemental Fig.1).Protein Preparations,Two-dimensional Blue Native/SDS-PAGE,Affinity Purification,and Western Blotting—Soluble extracts for two-dimensional blue native/SDS-PAGE(BN/ SDS-PAGE)were prepared as described for FPLC analysis above for WT and hox mutant strains,and the extracts werenormalized to an A650ϭ0.6.-Dodecyl-D-maltoside was addedto a final concentration of0.5%(w/v),and the same volume ofCoomassie loading solution(750m M⑀-amino caproic acid,5% (w/v)Coomassie-G)was added to the sample.Subsequently,20l of the sample was loaded per lane and run on a12%(w/v) polyacrylamide BN PAGE first dimension gel.The proteincomplexes in the first dimension gel strips were denatured for1h in solubilization buffer(66m M Na2CO3,2%(w/v)SDS,2%(v/v)-mercaptoethanol,and4M urea)prior to being layered on17.5%(w/v)polyacrylamide,6M urea two-dimensional SDS-polyacrylamide gels(36).The resultant two-dimensional gels were either Coomassie-stained,silver-stained(37),or electro-blotted onto nitrocellulose membranes.For WT and hox mutant one-dimensional Western blots and affinity purifications,cells were resuspended in20m M phos-phate buffer,pH7.4,plus protease inhibitors(Fermentas)and broken by bead disruption as described above.Protein concen-trations were determined by Bradford assay(Fermentas),and levels of each sample were adjusted toϳ100g/ml.For purifi-cation of His6-tagged proteins/complexes,Co2ϩbeads(Pierce)were added to cleared lysates and incubated for1h at4°C,and washes were performed using5times bead volume with20m M phosphate buffer,pH7.4,with or without0.5M NaCl through reloadable columns(Pierce).Beads were resuspended in a50% slurry in buffer.To rule out nonspecific binding of Hox proteins to beads,untagged WT samples were also subjected to the same regime,and a lack of Hox proteins in bead samples was verified by Western blot(data not shown).Samples for SDS-PAGE were boiled in1ϫLaemmli sample buffer(Bio-Rad),and10l of each was loaded onto precast TGX Stain-free Any kDa gels (Bio-Rad)and transferred onto a PVDF membrane(Bio-Rad). For Western blotting,the SnapID system(Millipore)was used according to the manufacturer’s instructions.Membranes were blocked in5%BSA,1ϫPBST,and primary and secondary anti-bodies were diluted in1%BSA,1ϫPBST.Polyclonal rabbit primary antibodies developed for this study were generated usingϳ20-amino acid C-terminal peptides(␣-HoxE,-F,-U,-Y,and-H(C-terminal);␣-HoxF and␣-HoxY from these prepara-tions are not shown but were used in quantitation of one-di-mensional Western blots)and a HoxH internal peptide(amino acids300–318)that allows recognition of both processed and unprocessed HoxH(YenZym,San Francisco,CA).␣-HoxY and ␣-HoxF antibodies were also generated in rabbit using full-length E.coli expressed protein(SeqLab).␣-Rps1(Agrisera;notshown)and␣-PsaD antibodies(38)were used as loading con-trols for normalization of band intensities for relative protein level quantitation.Secondary incubation was performed with Clean Blot HRP(Pierce),and Cell Biosciences ChemiWest or Pierce Dura Chemiluminescent reagents were used for signal development.Images and quantitation analysis were processed using a Cell Biosciences FluoroCam Q Gel imaging system. Hydrogenase Assays—Cells grown to similar logarithmicgrowth densities(OD730ϭ0.2–0.8)were concentrated toOD730ϭ2.5,and200l was added to600l of assay mixture containing Triton X-100(0.05%,w/v),phosphate buffer(50 m M,pH7),and either methyl viologen(MV;1m M final)or NADH(1m M final)in2-ml HPLC vials sealed with anaerobic septa.The mixture was sparged with argon for10min,100l of anaerobic sodium dithionite(10m M final)was added,and the mixture was incubated with shaking for30min at37°C.The reaction was stopped by the addition of100l of20%(w/v) trichloroacetic acid,and100l of the1-ml headspace was ana-lyzed using a gas chromatograph(Agilent1100)equipped with a Molecular Sieve5A column,a thermal conductivity detector,and argon as the carrier gas.To measure in vivo H2production,cells were spun down and resuspended to OD730ϭ2.5in2ml of BG11containing5m M glucose,placed in a15-ml culture tube, sealed with anaerobic septum,sparged with argon for30min, and incubated at30°C in the dark for24h.A100-l sample from the13-ml headspace was analyzed using a gas chromato-graph as above.Determination of Doubling Times—Log phase precultures (10ml)of WT and hoxϪstrains were used to inoculate400-ml capacity Photobioreactor culture vessels(FMT400,Photon System Instruments)without the addition of antibiotic to growth medium.Illumination parameters were programmed as listed in Table1.Optical density was measured every1–5min at wavelength maximum680nm and recorded digitally,alongwith pH and O2concentration(not shown).Culture vessels were maintained at30°C and continuously bubbled at a rate of ϳ250ml/min in air or argon supplemented with2%CO2.Opti-cal density values versus time were fitted to a single exponential function to determine doubling times.Fluorescence Measurements—Dark-adapted quantum effi-ciency(Fv/Fm)and effective quantum efficiency under illumi-nation(⌬F/FmЈ)of WT and hoxϪstrain suspensions from log phase cultures were measured in multiwell plates with a closed FluorCam(FC800-C/1010,Photon System Instruments)and used to calculate effective electron transport rates.⌬F/FmЈwas determined for cells under continuous illumination for at leastCyanobacterial Hox Hydrogenase Complex Association and Functionat NATL RENEWABLE ENERGY, on January 16, Downloaded from3min at each light intensity with dark adaption between exper-iments.Cells were dark-adapted for at least 5min prior to measurement and were measured in biological and technical triplicate (minimum number of samples per type ϭ9).RESULTSComposition of Hox Hydrogenase Protein Complexes —Re-ported subunit composition and stoichiometry of purified Hox hydrogenase varies in the literature (12,16–20),raising ques-tions about its in vivo structure.Therefore,we assessed frac-tionation of the Hox hydrogenase complex by performing size exclusion FPLC analysis of Synechocystis WT soluble extracts followed by Western blotting with Hox subunit-specific anti-bodies (Fig.1).As expected,all five subunits,HoxE (18.8kDa),HoxF (57.8kDa),HoxU (26.2kDa),HoxY (20.0kDa),and HoxH (52.9kDa),clearly co-fractionate (fractions 10–14).The band intensities of the diaphorase (HoxEFU)and hydrogenase (HoxYH)subunits fluctuate in a related manner,consistent with HoxYH and HoxEFU subcomplexes observed in purifica-tions of other Hox hydrogenases (12,16,17).The presence of what is probably monomeric HoxE (fractions 20–22)suggests that HoxE may dissociate relatively easily from the complex.Interestingly,unprocessed,immature HoxH co-fractionates with other Hox proteins,including processed HoxH (fractions 10and 16–18),implying association of unprocessed HoxH withother complex subunits prior to maturation and full complex assembly (Fig.1,HoxH (open arrows )and HoxH (C-terminal)blots).In addition,unprocessed HoxH is clearly present in higher molecular weight complexes (fractions 8and 9),reveal-ing its association with other unknown proteins (possibly mat-uration factors)prior to its cleavage.Results from size exclusion FPLC imply the presence of Hox complexes and possible subcomplexes,but co-fractionation does not provide enough evidence to confirm subunit associa-tion.To verify Hox protein complex/subcomplex associations in soluble extracts,we performed two-dimensional BN/SDS-PAGE followed by Western blotting (Fig.2).Using this approach,we were able to identify a complex containing all five Hox subunits,again consistent with the composition of the purified pentameric complex reported in the literature (19,20).The apparent molecular mass of this complex is ϳ160kDa,close to the calculated mass based on the predicted sizes of the individual subunits (175kDa).We note that no dimer of this pentameric hydrogenase protein complex could be reliably detected in our analysis despite previous reports (19).However,we were able to detect the presence of HoxFUYH,HoxEFU,and HoxFU subcomplexes.We also failed to reliably detect a HoxYH subcomplex,yet there was a weak antibody signal for the HoxH subunit with a higher apparent molecular massthanFIGURE 1.FPLC and Western blot analysis of WT Synechocystis sp.PCC 6803Hox hydrogenase.The crude soluble fraction of WT Synechocystis sp.PCC 6803was separated by FPLC,and the resulting fractions were analyzed by Western blotting.A ,silver-stained TGX Any kDa gradient SDS-polyacrylamide gel (Bio-Rad)of starting material (Sol .Extr .)and fractions 1–22(for the chromatogram at A 280and A 420see supplemental Fig.1).B–G ,Western blotting of FPLC fractions with the indicated Hox subunit-specific antibodies.Arrowheads in F indicate the signal for unprocessed HoxH.Cyanobacterial Hox Hydrogenase Complex Association and Functionat NATL RENEWABLE ENERGY, on January 16, 2013 Downloaded fromthat of the free HoxH protein alone (Fig.2G ,asterisk ),suggest-ing the association of HoxH with another protein.Monomeric subunits were also detected in the low molecular mass region of the Western blots,with the HoxE,HoxH,and HoxU subunits all accumulating to significant levels when compared with lev-els of each associated with subcomplexes.We were unable to consistently detect unprocessed HoxH in any of these sub-complexes,suggesting that its possible association may only be transient.Nevertheless,these data reveal for the first time the presence of various subcomplexes of Synechocystis Hox hydrogenase in vivo .Subunit Abundance in Hox Hydrogenase Mutants —The detection of Hox subcomplexes in the WT strain by FPLC and two-dimensional BN/SDS-PAGE analyses prompted us to con-struct mutants of each hox gene alone and in combination in the same parental WT strain (supplemental Fig.2)to further examine any relationship between complex/subcomplex asso-ciations and relative subunit abundance by Western blotting.All of the mutants except for hox Ϫ(whole operon deletion con-structed by T.Ogawa)and hoxH Ϫ(see “Experimental Proce-dures”and supplemental Fig.2)were created by ORF replace-ment with similar size antibiotic resistance genes to avoid changes in operon transcription from additional promoters in antibiotic resistance cassettes or large alterations in sequencesize.As expected,no detectable Western signal for Hox sub-units was apparent when the respective gene was disrupted,confirming full segregation of gene deletions (cyanobacteria carry multiple genome copies)(Fig.3A ).Interestingly,deletion of hoxE ,the first gene in the operon,led to a 2–3-fold increase in the remaining Hox protein subunits (Fig.3B ).The increase in Hox protein levels in this mutant is probably linked to the first 190bp of the hoxE ORF,whose absence results in increased hox transcript levels and possible enhancement in the rate of trans-lation due to a decrease in minimum free energy in the hoxE Ϫmutant mRNA (see “Discussion”and supplemental Fig.3,A–D ).The overexpression of HoxH in the hoxE Ϫmutant leads to a discernible increase in levels of unprocessed HoxH com-pared with WT and other hox mutants (Fig.3A and supplemen-tal Fig.4),consistent with increased unprocessed large subunit when the hydrogenase is overexpressed without additional maturation factors in previous studies (our unpublished results 3for R.eutropha soluble hydrogenase and Refs.13and 20).All other hox mutants exhibited decreased levels of remain-ing complex subunits (Fig.3B ).Levels of HoxH and HoxY are decreased to 20and 10%of WT in the respective hoxY Ϫand hoxH Ϫmutants,whereas HoxE,HoxF,and HoxU levels are less than 5%of WT in hoxF Ϫand hoxU Ϫmutants,highlighting interdependencies for HoxYH and HoxEFU subcomplex pro-tein abundance.In addition,HoxY and HoxH levels are decreased to 15–90%of WT in HoxEFU subcomplex mutants (most notably in hoxU Ϫmutants),and HoxE,HoxF,and HoxU levels are decreased to 25–70%of WT in HoxYH subcomplex mutants,revealing interdependencies in subunit abundance across subcomplexes as well.Hox Subunit Association in Individual Subunit hox Mutants —Although changes in transcription could be responsible for altered subunit abundance observed in hox mutants,the absence of complex subunits could also lead to instability of the remaining subunits because of an inability to form stable Hox complexes/subcomplexes.To assess the association of the remaining Hox subunits when one of the five subunits is absent,we again performed two-dimensional BN/SDS-PAGE and Western blotting of soluble extracts from single-subunit hox mutants (Fig.4).No notable differences in total protein were observed between the WT and hox mutant strains by Coomass-ie-stained one-dimensional BN or silver-stained two-dimen-sional SDS-polyacrylamide gels (data not shown).In the hoxE Ϫstrain,HoxFUYH and HoxFU subcomplexes accumulated (Fig.4A ),consistent with the observation of those subcomplexes in WT (Fig.2).Despite the increased levels of HoxY and HoxH in our hoxE Ϫstrain (Fig.3A ),we still were not able to observe the expected HoxYH subcomplex (Fig.4A ).Interestingly,none of the Hox subcomplexes are detected in hoxF Ϫor hoxU Ϫstrains,with the remaining Hox proteins observed only as unassembled monomers,indicating that HoxF and HoxU are necessary for stable assembly/maintenance of the full Hox complex and Hox subcomplexes (Fig.4,B and C ).In contrast,the diaphorase sub-units are still able to assemble into HoxEFU and HoxFU sub-complexes in hoxY Ϫor hoxH Ϫstrains (Fig.4,D and E ),con-3C.Eckert,J.Yu,and P.-C.Maness,unpublishedresults.FIGURE 2.Two-dimensional BN/SDS-PAGE and Western blot analysis of WT Synechocystis sp.PCC 6803Hox hydrogenase.A ,the soluble fraction of WT Synechocystis sp.PCC 6803was separated on a 12%(w/v)polyacrylamide BN-polyacrylamide gel followed by two-dimensional separation on a 17.5%(w/v)polyacrylamide SDS-polyacrylamide gel (B )and analysis by Western blotting with the indicated Hox subunit-specific antibodies (C–G ).The first dimension BN-polyacrylamide gel was Coomassie-stained,whereas the sec-ond dimension SDS-polyacrylamide gel was silver-stained.Cyanobacterial Hox Hydrogenase Complex Association and Functionat NATL RENEWABLE ENERGY, on January 16, 2013 Downloaded fromfirming that HoxY and HoxH are not required for the stable association of diaphorase subcomplexes.Pull-down Analysis of Hox Subunit Associations in Hox Hydrogenase Subcomplexes —Additional mutant strains were constructed to ectopically express His 6-tagged Hox subunits to further probe subcomplex associations:1)HoxYH,tagged on HoxY (hox ϪϩHis 6-HoxYH);2)HoxEFUYH,tagged on HoxH(hoxH ϪϩHis 6-HoxH);and 3)HoxEFUYH,tagged on HoxE (hoxE ϪϩHis 6-HoxE).Overexpression of HoxH by ectopic expression (Fig.5,A and B )or in the hoxE Ϫstrain background (Fig.5C )results in clear unprocessed and processed HoxH sig-nal (Fig.5,A–C ,upper and lower bands ,respectively,in HoxH blots and in the HoxH (C-terminal)blot),increasing the likeli-hood that we would see unprocessed HoxH in bead fractions ifFIGURE 3.One-dimensional SDS-PAGE and Western blot analysis of Synechocystis sp.PCC 6803hox mutants.A ,whole cell lysates of WT and individual/combined hox mutants were run on TGX Any kDa gradient SDS-polyacrylamide gels (Bio-Rad),transferred to PVDF,and immunoblotted with Hox subunit-specific antibodies and PsaD and/or Rps1(not shown)as loading controls.B ,relative levels of Hox subunits in each mutant,presented as a percentage of WT.Data represent quantitation of multiple Western blot analyses with error bars depicting variation between separate analyses.Cyanobacterial Hox Hydrogenase Complex Association and Functionat NATL RENEWABLE ENERGY, on January 16, 2013 Downloaded from。
Feeding enhances photosynthetic efficiency in the carnivorous pitcher plantNepenthes talangensisAndrej Pavlovicˇ*,Lucia Singerova ´,Viktor Demko and Ja ´n Huda ´k Department of Plant Physiology,Faculty of Natural Sciences,Comenius University,Mlynska´dolina B-2,SK-84215,Bratislava,Slovak RepublicReceived:10March 2009Returned for revision:30March 2009Accepted:2April 2009Published electronically:19May 2009†Background and Aims Cost–benefit models predict that carnivory can increase the rate of photosynthesis (A N )by leaves of carnivorous plants as a result of increased nitrogen absorption from prey.However,the cost of car-nivory includes decreased A N and increased respiration rates (R D )of trapping organs.The principal aim of the present study was to assess the costs and benefits of carnivory in the pitcher plant Nepenthes talangensis ,leaves of which are composed of a lamina and a pitcher trap,in response to feeding with beetle larvae.†Methods Pitchers of Nepenthes grown at 200m mol m 22s 21photosynthetically active radiation (PAR)were fed with insect larvae for 2months,and the effects on the photosynthetic processes were then assessed by simul-taneous measurements of gas exchange and chlorophyll fluorescence of laminae and pitchers,which were corre-lated with nitrogen,carbon and total chlorophyll concentrations.†Key Results A N and maximum (F v /F m )and effective quantum yield of photosystem II (F PSII )were greater in the fed than unfed laminae but not in the fed compared with unfed pitchers.Respiration rate was not significantly affected in fed compared with unfed plants.The unfed plants had greater non-photochemical quenching (NPQ)of chlorophyll fluorescence.Higher NPQ in unfed lamina did not compensate for their lower F PSII ,result-ing in lower photochemical quenching (QP)and thus higher excitation pressure on PSII.Biomass and nitrogen and chlorophyll concentration also increased as a result of feeding.The cost of carnivory was shown by lower A N and F PSII in pitchers than in laminae,but R D depended on whether it was expressed on a dry weight or a surface area basis.Correlation between nitrogen and A N in the pitchers was not found.Cost–benefit analysis showed a large beneficial effect on photosynthesis from feeding as light intensity increased from 200to 1000m mol m 22s 21PAR after which it did not increase further.All fed plants began to flower.†Conclusion Feeding pitchers with insect larvae increases A N of leaf laminae,due to higher nutrient acquisition,with strong correlation with nitrogen concentration,but A N of pitchers does not increase,despite increased nitro-gen concentration in their tissue.Increased A N improves growth and reproduction and is likely to increase the competitive advantage of carnivorous over non-carnivorous plants in nutrient-poor habitats.Key words:carnivorous plants,chlorophyll fluorescence,Nepenthes talangensis ,nitrogen,pitcher plant,photosynthetic rate,photosystem II,respiration rate.INTRODUCTIONCarnivorous pitcher plants of the genus Nepenthes are largely found in south-east Asia,principally Borneo,Sumatra,Java and peninsular Malaysia,with scattered populations in India,Sri Lanka,Australia,New Caledonia,Madagascar and the Seychelles.Nepenthes leaves are differentiated into a photo-synthetically active lamina and a pitcher trap,which has evolved to attract,trap and digest prey.The pitchers usually consist of different structural and functional zones:lid,peri-stome,and upper waxy and lower glandular zones within the pitcher (Clarke,1997,2001).Carnivorous plants grow terrestrially in sunny,nutrient-poor and permanently moist habitats.Cost–benefit models of car-nivory predict that in a well-lit environment the nutritional benefits gained from captured prey exceed the costs of modify-ing leaves into photosynthetically inefficient traps (Givnish et al.,1984).Generally,costs of carnivory include energetic demands for growth of traps and their function:either increased rate of dark respiration (R D )as a result of extraenergy requirements for attracting,capturing and digesting the prey,or decreased photosynthetic rate (A N )as a result of leaf adaptation for carnivory,or both.Three potential benefits resulting from increased mineral absorption from prey have been proposed.First,carnivory may increase a plant’s rate of photosynthesis (A N )through improved nutrient supply,particu-larly nitrogen status,although other nutrients (principally phosphate and potassium)may be important.Second,carniv-ory may results in an increased seed production through improved mineral acquisition;and third,carnivory may replace autotrophy partly by heterotrophy (Givnish et al.,1984).Givnish et al.(1984)considered the second benefit as a part of the first,as increased A N should lead to increased seed production.Several authors have dismissed the third benefit,as experimental findings suggest that carnivorous plants do not obtain substantial amounts of carbon from prey and carnivory could not replace autotrophy at low light inten-sity (Chandler and Anderson,1976).However,Rischer et al.(2002)found that Nepenthes incorporated carbon from carniv-ory into organic substances,which raises a question about the importance of facultative heterotrophy.The growth of some*For correspondence.E-mail pavlovic@fns.uniba.sk#The Author 2009.Published by Oxford University Press on behalf of the Annals of Botany Company.All rights reserved.For Permissions,please email:journals.permissions@Annals of Botany 104:307–314,2009doi:10.1093/aob/mcp121,available online atby guest on March 15, 2012/Downloaded fromspecies of carnivorous plants is partly dependent on organiccarbon uptake from prey,as revealed by increased growth without increasing A N (Adamec,1997,2008).With regard to the costs of carnivory,it has been observed that photosynthetic rates of traps are lower than those ofleaves (Knight,1992;Adamec,2006;Pavlovicˇet al.,2007).With regard to the benefits,around 30studies have tested whether the growth of carnivorous plants is enhanced by carnivory.Ellison (2006)concluded that there is a significant positive effect (P ¼0.02)of adding prey on plant growth among different carnivorous genera,supporting the hypothesis that there is a benefit to carnivory.However,he pointed out that this is only indirect evidence,because the cost–benefit model expresses benefits in terms of photosynthetic rates,not in terms of growth.Only three studies have examined the effect of prey capture on A N of terrestrial carnivorous plants directly,and these gave very different results.Convincing evidence that prey availability increased absolute A N in Sarracenia has been provided by Farnsworth andEllison (2008).However,Me´ndez and Karlsson (1999)and Wakefield et al.(2005)did not find any changes in A N in Pinguicula vulgaris and Sarracenia purpurea in response to the capture of prey.Either of two possible results can be expected from feeding prey to carnivorous plants.First,fed plants will have greater biomass but nitrogen (N)concentration (mg N g 21d.wt)will not be affected,despite total N (mg)per plant increasing.This was observed by Moran and Moran (1998)in Nepenthes rafflesiana .In extreme cases,N concentrations per unit dry matter might even decrease due to dilution by increased growth (Karlsson and Carlsson,1984;Adamec,2008).Because N concentration is positively correlated with A N in carnivorous plants (Ellison and Farnsworth,2005;Pavlovicˇet al.,2007),it can be expected that A N will not be enhanced,as found by Me´ndez and Karlsson (1999)in Pinguicula vulgaris .In this case,the cost–benefit model must be considered in terms of growth rate partly due to direct uptake of organic compounds from prey.The second possibility is that fed plants will have higher leaf N concentrations and,therefore,higher A N as predicted by Givnish et al.(1984).This was found by Farnsworth and Ellison (2008)in Sarracenia .The principal aim of the present study was to assess the costs and benefits of carnivory in Nepenthes ,which provides a good experimental model for the study of the cost–benefit model of carnivory because the leaves are divided into photo-synthetically active laminae and a pitcher trap.We assumed that increased photosynthesis is the most important benefit of carnivory,and tested the hypothesis that prey availability would result in increased A N ,photosystem II (PSII)efficiency,biomass,and nutrient and chlorophyll concentrations and that the cost of carnivory would include increased R D and decreased A N and PSII efficiency in the pitcher sensu stricto according to the Givnish hypothesis (Givnish et al.,1984).Tests were made on the pitcher plant Nepenthes talangensis ,a rare,endemic species from Sumatra.This is the first detailed study of photosynthesis in a carnivorous plant,with and without experimental addition of prey,using simultaneous measurements of gas exchange and chlorophyll fluorescence by the saturation pulse method.MATERIALS AND METHODSPlant material and culture conditionsThe pitcher plant Nepenthes talangensis Nerz and Wistuba (1994)grows in mossy forest and stunted upper mountain forest near the summit of Gunung Talang (1800–2500m alt.)in Sumatra (Nerz and Wistuba,1994;Clarke,2001).Its pitchers are light green to yellow in colour with red spots,lack a waxy zone (glandular region covers entire inner surface)and the pitcher fluid is extremely viscous (Clarke,2001).Five-year-old plants,propagated from seeds,were 20–30cm tall,with three or four pitchers up to 5cm long.During the experiments,ten plants were grown under con-trolled conditions in a growth chamber with a photoperiod of 12h dark/12h light [200m mol m 22s 21photosynthetically active radiation (PAR),day/night temperatures of 25/178C and high humidity (80–100%)].They were grown in a Sphagnum /perlite/bark/moss mixture substrate.To prevent entry of prey into pitchers they were plugged,without dama-ging them,with wads of cotton wool moistened in distilled water.Any newly opened pitchers during experiments were treated in the same way.The wads were removed from five plants after 6months.The remaining five plants served as unfed controls.The fed plants were supplied with one live meal worm (Tenebrio molitor )for each pitcher each week for 8weeks (total 2.46+0.05g f.wt worms per plant over 8weeks,N concentration in worms ¼8.7%,78mg N per plant over 8weeks).Fed plants were also able to catch natural prey,mostly sciarid flies,but the contribution of these to the nutrition of fed plants was negligible (,2%of a worm’s weight).Simultaneous measurement of CO 2assimilation and chlorophyll fluorescenceTo assess whether feeding enhanced photosynthetic effi-ciency,we analysed five youngest fully developed laminae (one per plant)with un-formed pitchers that had developed during the 8-week feeding period (‘young lamina without pitcher’),and five older laminae carrying the pitcher (separ-ated into ‘older lamina with pitcher’and ‘pitcher’),which had developed before the feeding experiment had started.Rates of photosynthesis (A N )and chlorophyll fluorescence were measured simultaneously with a CIRAS-2(PP-Systems,Hitchin,UK)and a fluorcam FC 1000-LC (Photon Systems Instruments,Brno,Czech Republic)attached to an infrared gas analyser.Prior to measurements,the plants were dark-adapted overnight to achieve fully relaxed non-photochemical quenching (NPQ).Thereafter,the middle part of the lamina and the lid in the case of the pitcher (2.5cm 2)were enclosed in the leaf cuvette (PLC6,PP-Systems).Once stabilization (15min)was achieved the respiration rate (R D )was recorded.Then the chlorophyll fluorescence was measured.Minimal fluorescence (F 0)and then maximal fluorescence (F m )were measured using a saturation pulse (4000m mol m 22s 21PAR,800-ms duration):maximal quantum yield of PSII (F v /F m )was calculated as F m –F 0/F m .An induction curve of 15min duration was then obtained by switching on an actinic light of 200m mol m 22s 21PAR.For analysis of the quenching mechanism,ten saturation pulses were triggered.Pavlovicˇet al.—Photosynthetic response to feeding in Nepenthes 308 by guest on March 15, 2012/Downloaded fromSimultaneously,stable A N was recorded at a CO 2concentrationof 360m mol mol 21,leaf temperature 23+18C,relative air humidity 65–70%and water vapour deficit 700–1000Pa.Effective quantum yield of photosystem II (F PSII ),photoche-mical quenching (QP)and NPQ were calculated (Maxwell and Johnson,2000).The saturation irradiance(1200m mol m 22s 21PAR)was applied for 15min to allow adaptation,and light response curves were determined.The light intensity was decreased stepwise with irradiation periods of 3min and subsequent saturation pulses were applied until 40m mol m 22s 21PAR was reached.The appar-ent quantum yield of CO 2fixation (F CO2)was determined as the slope of the light response curve between 40and 150m mol m 22s 21PAR (Farquhar et al.,1980).Light response curves of A N ,F PSII and NPQ were recorded simul-taneously.All measurements were taken between 0900and 1200h.Chlorophyll,nitrogen and carbon determinationThe leaves from five fed and unfed plants were removed.Parts of the leaves were dried at 708C for 5days to determine percentage dry weight.Chlorophyll concentrations were deter-mined on the same types of leaves on which A N had been measured.Samples of leaves from young laminae without pitchers,older laminae carrying pitchers and pitchers them-selves were ground in a mortar and pestle with small amount of sand and extracted with 80%(v/v)chilled acetone with MgCO 3to avoid acidification and phaeophytinization of pig-ments.The samples were centrifuged at 8000g for 5min at 48C.Chlorophyll a þb (chl a þb )in supernatant were deter-mined spectrophotometrically (Jenway 6400,London,UK):chl a at 663.2nm,chl b at 646.8nm.Chlorophyll concen-tration (mg L 21)was calculated according to Lichtenthaler (1987)and re-expressed as mg chl a þb g 21d.wt.Leaf tissues from photosynthetic measurements were dried at 708C for 5days and N and C were determined using an EA 1108CHN analyser (Fisons Instruments,Milan,Italy).Nepenthes pitchers were washed using distilled water before drying and analysing to avoid contamination with nitrogen from prey.After N determination,photosynthetic nitrogen use efficiency (PNUE)was calculated for each type of leaf as:PNUE (m mol CO 2mol N 21s 21)¼A Nmax (m mol CO 2g 21d.wt s 21)/N (mol N g 21d.wt).Statistical analysisPrior to statistical tests,data were analysed for normality and homogeneity of variance.When non-homogeneity was present,a t -test was employed with the appropriate corrected degrees of freedom.To evaluate the significance of the data between fed and unfed plants [leaf dry weight,R D ,A Nmax ,sto-matal conductance (g s ),F v /F m ,F PSII ,F CO2,QP,NPQ,C,N,PNUE,chl a þb ,chl a /b ]a t -test was used.Paired data (com-parison between the lamina and the pitcher within the same old leaf carrying the pitcher)were statistically evaluated by a two-tailed paired t -test.The results are expressed as the mean of five replicated measurements.ANCOV A (StatistiXL ver.1.7for Microsoft Excel)was used to test the homogeneity ofslopes of the relationships between A N and N content for lamina and pitcher.RESULTSFeeding the pitchers of Nepenthes with beetle larvae increased the dark and light reactions of photosynthesis.In the laminae,A N increased almost linearly with increasing irradiance at irra-diances less than about 160m mol photon m 22s 21PAR and reached saturation under an irradiance of about 1000m mol photon m 22s 21PAR (Fig.1A,B).The A N of the young fed lamina without pitcher was significantly higher than the unfed control (Table 1).The A Nmax of laminae from unfed plants was about 50%that of fed lamina at saturating irradi-ance (Fig.1A).Consistent with this,effective quantum yield of PSII (F PSII )and apparent quantum yield of CO 2fixation (F CO2)were also higher in young laminae from plants that had been fed (Table 1).F PSII decreased with increasing irradi-ance (Fig.1D).Fed laminae had F v /F m values of about 0.800,significantly greater than those of laminae from unfed plants.The primary electron acceptor from PSII (plastoquinone A,Q A )was more reduced in unfed plants,based on the higher value of QP in fed plants (Table 1).NPQ increased with increasing irradiance:the higher NPQ in laminae from unfed plants suggests greater heat dissipation via the xanthophyll cycle (Fig.1G).Chlorophyll concentrations and chlorophyll a/b ratios were greater in fed plants than in unfed plants (Tables 1and 2),indicating an increased proportion of light-harvesting complexes (LHC II)to reaction centres (RC II)in PSII in unfed plants.This is consistent with higher values of F 0in unfed plants (data not shown).Lamina dry weight,nitro-gen concentration and PNUE were significantly higher in fed plants.Respiration rate was not significantly different,but there was a trend towards slightly greater R D in fed plants in all tissues studied (Table 1).Differences in measured photosynthetic characteristics between fed and unfed plants in the older laminae carrying the pitcher were similar to those of young laminae except their dry weight (Table 2,Fig.1B,E,H).This is not surprising given that the older laminae were fully developed before the feeding experiment started,whereas the young laminae were developing during the feeding experiment.There were no sig-nificant differences in PNUE between the older laminae of fed and unfed plants.In the pitchers,A N was very low and increased linearly with increasing irradiance at irradiances less than about 50m mol photon m 22s 21PAR and reached saturation only at 100m mol photon m 22s 21(Fig.1C).In contrast to laminae,there were no statistical differences between pitchers of fed and unfed plants in A Nmax ,F v /F m ,F PSII ,F CO2,QP,g s or chlor-ophyll concentration (Table 2).However,unfed pitchers had higher NPQ than fed pitchers and lower nitrogen concen-trations,similar to the pattern in young and old laminae.Almost all photosynthetic parameters were significantly lower in pitchers than in laminae (Table 2).The primary acceptor of PSII,Q A ,was maintained at more than 70%oxi-dized in the lamina,but in the pitcher it was only 25–35%oxidized.NPQ was similar in pitchers and laminae,but was strongly dependent on whether the plants were fed or unfed.However,at higher irradiance,laminae had higher NPQPavlovicˇet al.—Photosynthetic response to feeding in Nepenthes 309by guest on March 15, 2012/Downloaded from(Fig.1H).The NPQ was saturated at 300m mol photon m 22s 21PAR in the pitcher (Fig.1I).Stomatal conductance,PNUE,and nitrogen,carbon and chlorophyll concentrations were also significantly lower in the pitcher.The R D per unit surface area was higher in the lamina.By contrast,R D per unit mass was higher in the pitcher (Table 2).Figure 2summarizes the relationship between nitrogen con-centration and A N in lamina and trap separately.It is obvious that there is a strong correlation between nitrogen concen-tration and A N in laminae (P ,0.01)but not in pitchers (P ¼0.06).Furthermore,the relationships do not have similar slopes (P ¼0.013).One year after the feeding experiment all fed plants,but no unfed plants,had begun to flower.DISCUSSIONThe effects of feeding pitchers with beetle larvae on the photo-synthetic activity of the pitcher plant Nepenthes talangensis was investigated,using simultaneous measurement of gas exchange and chlorophyll fluorescence,and relating them to nitrogen and chlorophyll content of the laminae and pitchers.Nepenthes is a good experimental genus for studying the21034500·10·20·30·40·50·60·7–2–101243567PAR (µmol m –2 s –1)N P QφP S I IA N (µm o l C O 2 m –2 s –1)PAR (µmol m –2 s –1)PAR (µmol m –2 s –1)20004006008001000120002004006008001000120020040060080010001200F IG .1.Rate of net photosynthesis (A N ;A–C),effective quantum yield of PSII (F PSII ;D–F)and non-photochemical quenching (NPQ;G–I)in response to irradiance in young lamina without pitcher (A,D,G),older lamina (B,E,H)and pitcher (C,F,I).Fed and unfed plants as indicated,values are means +s.e.PAR,photosynthetically active radiation.T ABLE 1.Leaf biomass,chlorophyll fluorescence,gas exchange,chlorophyll,nitrogen and carbon concentration,and photosynthetic nitrogen use efficiency in young lamina withoutpitcherParameterUnfed Fed Leaf dry weight (mg)104.5+13.7162.0+12.2*R D (m mol CO 2m 22s 21)1.30+0.161.58+0.15ns R D (nmol CO 2g 21d.wt s 21)8.9+2.211.5+2.2ns A Nmax (m mol CO 2m 22s 21)2.8+0.26.0+0.4**A Nmax (nmol CO 2g 21d.wt s 21)16.9+0.6046.1+7.6**g s (mmol m 22s 21)62.1+4.5152.0+8.2**F v /F m 0.758+0.0110.800+0.003*F PSII0.41+0.020.52+0.01**F CO2(mol CO 2mol quanta 21)0.014+0.0010.023+0.002**QP 0.71+0.010.77+0.01**NPQ1.28+0.130.84+0.06*C (mg g 21d.wt)459.8+2.4468.4+3.1*N (mg g 21d.wt)10.6+1.018.6+2.2*PNUE (m mol CO 2mol N 21s 21)23.7+1.632.5+2.4*Chl a þb (mg g 21d.wt)1.21+0.112.72+0.22**Chl a /b1.91+0.32.15+0.03**See Appendix for definitions.Values shown are means +s.e.,n ¼5.Significantly different values (t -test)are indicated:*P ,0.05,**P ,0.01;ns,non-significant differences.Pavlovicˇet al.—Photosynthetic response to feeding in Nepenthes 310by guest on March 15, 2012/Downloaded fromcost–benefit model of carnivory with leaves composed of photosynthetically active laminae and a pitcher trap.The laminae of fed N.talangensis had a greater N concentration as a result of nitrogen absorption from prey (Tables 1and 2).In their natural environment,Nepenthes species are N-limited,and have evolved the pitcher to assist in their uptake of N (Osunkoya et al.,2007).The average N acquired from insects is high:61.5,53.8and 68.1%of the total for N.mirabilis ,N.rafflesiana and N.albomarginata ,respectively (Schulze et al.,1997;Moran et al.,2001).Chlorophyll concen-tration,A N and maximum and effective quantum yield of PSII were higher in fed plants.Two consequences of this are (1)an increase in biomass of new formed laminae and (2)flowering of plants after feeding (Table 1).Because about 50–80%of foliar N is incorporated in photosynthetic proteins (Evans,1989),we suggest that the lower A N of unfed plants is due to lower N and Rubisco concentrations and thus lower capacity for CO 2fixation.The smaller A N was accompanied by a smaller stomatal conductance (g s )in unfed compared with fed plants but intercellular CO 2concentration (C i )was statisti-cally unchanged (data not shown).This indicates that reduced A N was due to reduced carboxylation efficiency rather than to stomatal limitation.Lower F PSII is a secondary consequence of impaired CO 2assimilation.When carbon fixation is inhib-ited,F PSII is often down-regulated to match the reduced requirement for electrons and to minimize the production of reactive oxygen species (Golding and Johnson,2003).Maximum quantum yield of PSII of dark-adapted leaves,which is proportional to the quantum yield of O 2evolution,was slightly lower in unfed plants,reflecting that potentional quantum yields for photochemistry in PSII were also nega-tively affected in prey-deprived plants (Tables 1and 2).When nutrient stress restricts carboxylation,even moderate light may become excessive and may result in destructive photo-oxidative reactions.In the first line of defence against photo-oxidation,xanthophylls transform excessive excitation energy to heat,measured as NPQ of chlorophyll fluorescence (Krause and Jahns,2004).In laminae,NPQ values were higher in unfed plants as a consequence of less light energy being used in photochemistry and through greater heat dissipa-tion by the xanthophyll cycle.This suggests that increased thermal dissipation by the xanthophyll cycle slightly compen-sates for the lower F PSII in unfed lamina,but probably not sufficiently.The decline of F PSII in unfed laminae was not offset by thermal dissipation,leading to a lower QP and higher excitation pressure on PSII and thus higher susceptibility to photoinhibition in unfed plants.The unfed N.talangensis plants exhibited similar symptoms to plants under nitrogen stress.Huang et al.(2004)found lower A N ,g s ,F v /F m ,F PSII ,QP,chl and chl a /b in nitrogen-deprived rice.012345678N concentration (%)A N (µm o l C O 2 m –2 s –1)F IG photosynthetic rate (A N )in relation to leaf nitrogen concentration in lamina and pitcher,as indicated.The lines have different slopes (P ¼0.013);no relationship was found between A N and N in the pitcher (P ¼0.06)but a significant relationship was found in the lamina (P ,0.01).T ABLE 2.Leaf biomass,chlorophyll fluorescence,gas exchange,chlorophyll,nitrogen and carbon concentration,and photosynthetic nitrogen use efficiency in old lamina carrying the pitcherLaminaPitcherParameterUnfed Fed Unfed FedLeaf dry weight (mg)104.7+15.8120.5+19.6ns 141.3+5.2††199.5+47.8ns ††R D (m mol CO 2m 22s 21)0.97+0.021.15+0.06ns 0.43+0.02††0.60+0.1ns ††R D (nmol CO 2g 21d.wt s 21)5.8+0.57.0+0.21ns 6.5+0.4††9.6+1.7ns ††A Nmax (m mol CO 2m 22s 21)3.1+0.36.0+0.5**0.10+0.04††0.15+0.03ns ††A Nmax (nmol CO 2g 21d.wt s 21)19.4+2.037.8+5.4*2.0+0.9††3.5+1.4ns ††g s (mmol m 22s 21)57.0+6.492.7+4.6**37.7+4.4††31.3+1.6ns ††F v /F m 0.770+0.0100.823+0.011*0.715+0.012†0.740+0.008ns ††F PSII0.41+0.020.59+0.02**0.18+0.01††0.16+0.01ns ††F CO2(mol CO 2mol quanta 21)0.011+0.0020.021+0.001**0.001+0.000††0.001+0.000ns ††QP 0.73+0.020.82+0.01**0.34+0.04††0.25+0.03ns ††NPQ1.64+0.140.79+0.03**1.66+0.14ns 0.68+0.14**ns C (mg g 21d.wt)464.2+1.9477.5+5.8*457.1+0.9††462.2+1.2*††N (mg g 21d.wt)11.3+0.420.0+2.8*7.8+0.2††17.0+1.5**†PNUE (m mol CO 2mol N 21s 21)20.7+1.524.8+4.1ns 4.4+1.2††2.7+0.8ns ††Chl a þb (mg g 21d.wt)1.30+0.012.51+0.34**0.93+0.09††1.02+0.05ns ††Chl a /b1.94+0.022.15+0.06**††0.96+0.041.45+0.07**††See Appendix for definitions.Values shown are means +s.e.,n ¼parisons were made (t -test)between fed and unfed lamina or pitcher at *P ,0.05,**P ,0.01,and between fed pitcher and fed lamina or unfed pitcher and unfed lamina respectively at †P ,0.05,††P ,0.01(paired t-test);ns,non-significant differences.Pavlovic ˇet al.—Photosynthetic response to feeding in Nepenthes 311by guest on March 15, 2012/Downloaded fromAll photosynthetic parameters were significantly lower in pitchers than in laminae (Table 2).Nepenthes pitchers have digestive functions and the absence of a positive correlation between N and A N (Table 2,Figs 1and 2)suggests thatfactors other than N limit A N .Pavlovicˇet al.(2007)suggest high diffusional resistance for CO 2uptake in the Nepenthes pitcher due to very low stomatal density and compact meso-phyll.Low PNUE in the pitchers found in this and in our pre-vious study (Pavlovicˇet al.,2007)indicates either high resistance for CO 2uptake or increased allocation of N to struc-tural materials rather than to photosynthetic machinery (Osunkoya et al.,2007,2008).Lower QP (Table 2)and satur-ation of NPQ at relatively low irradiance in the pitchers (Fig 1I)result in increase excitation pressure on PSII and higher susceptibility to photoinhibition.This may explain the reduced longevity of pitchers relative to laminae,which is well documented (Osunkoya et al.,2008).All the above demonstrate a strong adaptation of pitchers to the carnivorous,but not to the assimilation,function.The only study to date that has quantified the effects of nutrient stress in Nepenthes is that of Moran and Moran (1998),who examined foliar reflectance in nutrient-starved N.rafflesiana .They observed no significant differences in root or leaf N concentration,which is inconsistent with the present results.However,N content (concentration Âbiomass)was lower in their prey-deprived plants.They suggested that increased growth upon feeding is a primary adaptation because under conditions of resource limitation,plants are able to maintain critical foliar nutrient concentrations by a reduction in growth rate.Increased A N after feeding was found by Farnsworth and Ellison (2008)in the genus Sarracenia.The well-fed plants had slightly higher foliar N concentration,chlorophyll content and F v /F m .However,these differences were only found in young unfed Sarracenia leaves that were produced subsequent to feeding.Wakefield et al.(2005)found no changes of A N measured on fed leaves of Sarracenia purpurea .This agrees with the findings of Butler and Ellison (2007),who demonstrated that nutrients captured by older pitchers are rapidly translocated to newly formed leaves.In contrast,we found enhanced A N in older lamina carrying the fed pitcher,although the pitcher itself did not increase in photosynthetic efficiency (Fig.2C,F).The results of Schulze et al.(1997)show that not only young developing leaves carrying closed pitchers obtain a high portion of N from captured prey,but also that older fully developed leaves carrying open pitchers also obtain more than 50%of their nitrogen from prey in Nepenthes .Ellison and Gotelli (2002)showed an increase in A N following addition of inorganic nitrogen to Sarracenia purpurea ,but this response resulted from plants producing non-carnivorous phyllodes,which are more efficient in photosynthesis than the carnivorous pitcher.S.purpurea produces trapless phyllodes only during drought,under shade or with increased nutrient availability.In contrast to Nepenthes ,Sarracenia does not have leaves that are differentiated into a photosynthetically active lamina and a pitcher trap,but usually have only a rosette of pitchers that must function in both photosynthesis and prey capture to achieve positive carbon gain,and their photosynthetic efficiency is closer to Nepenthes lamina than to the Nepenthes pitcher(Pavlovicˇet al.,2007).The rate of photosynthesis was not increased as a result ofprey capture in the carnivorous butterwort Pinguicula vulgaris (Me´ndez and Karlsson,1999).However,supplementary feeding in situ increased both rosette size and reproduction,through an increase in flowering frequency and seed pro-duction (Thore´n and Karlsson,1998).Me ´ndez and Karlsson (1999)also concluded that the benefits from capturing prey are larger in reproductive terms than in terms of photosyn-thesis.We also found accelerated flowering in fed Nepenthes plants,but propose that this is an indirect effect of increased A N rather than a direct effect of feeding.Adamec (2008)observed two different responses to feeding in the aquatic carnivorous plants Utricularia australis and Aldrovanda vesi-culosa .Both species,when fed,produced longer shoots and had smaller N concentrations in comparison with control plants.Photosynthetic rate was higher in fed Aldrovanda but lower in fed Utricularia .It was suggested that tissue N in fed plants was diluted by growth processes much more than in unfed controls,so the main physiological effect of catching prey was not based on enhancement of A N ,as was suggested by Givnish et al.(1984),but on providing N and P (and prob-ably C)for essential growth processes.The present study results contrasted with this,as there was a positive correlation between N and A N in lamina (Fig.2),in agreement with the study of Ellison and Farnsworth (2005),but not of Wakefield et al.(2005).The contradictory results concerning feeding experiments discussed above might lie in genotypic differ-ences among plant species.The Givnish model considers not only the ability of carniv-ory to enhance A N ,but also the costs associated with carniv-ory.The costs include a reduced A N and higher R D .The first was confirmed in this and in our previous study of N.alataand N.mirabilis (Pavlovicˇet al.,2007),but the second is prob-ably species-specific.Different results were obtained here depending on the units of measurements.Area-based R D was higher in the lamina,and mass-based R D was higher in the pitcher.This discrepancy is due to different leaf mass area (LMA was higher in lamina)of these two distinct organs.Differences in leaf thickness between lamina and pitcher are well documented in six Nepenthes species (Osunkoya et al.,2007).It appears that the result is influenced more by leaf structure than by specialization for carnivorous or photosyn-thetic function.Reduced A N and higher R D was found in Utricularia bladder.Photosynthetic rate in leaves of six aquatic Utricularia species exceed that in bladders seven-to ten-fold and R D of bladders was 75–200%greater than in leaves (Adamec,2006).The high R D of bladders in Utricularia is consistent with specific amino acid changes (Leu113,Ser114replaced by Cys113,Cys114)in Utricularia cytochrome c-oxidase,the rate-limiting enzyme in the respirat-ory cycle,which accelerates the rate of respiration.These amino acid changes were not confirmed for Nepenthes (Jobson et al.,2004).According to Givnish,there is a trade-off between photosyn-thetic costs and benefits that could lead to the evolution of car-nivory.Enhancement of A N resulting from the addition of nutrients as a result of carnivory should be more rapid in high-light than in shady environments (Givnish et al.,1984;Ellison and Gotelli,2001).However,convincing evidence for this is lacking.From the present data we can calculate the benefit ofPavlovicˇet al.—Photosynthetic response to feeding in Nepenthes 312 by guest on March 15, 2012/Downloaded from。

叶绿素吸收光谱英文Chlorophyll is a pigment that gives plants their green color. It plays a crucial role in photosynthesis, the process by which plants convert sunlight into energy. One of the key properties of chlorophyll is its ability to absorb light. The absorption spectrum of chlorophyll refers to the range of wavelengths of light that it can absorb. This spectrum is an important characteristic of chlorophyll and has significant implications for photosynthesis and plant growth. Chlorophyll absorbs light most strongly in the red and blue regions of the visible spectrum. These wavelengths are ideal for driving the chemical reactions of photosynthesis. The absorption of light by chlorophyll triggers a series of biochemical processes that ultimately result in the production of glucose and other organic molecules. The specific wavelengths of light that chlorophyll absorbs can vary depending on the type of chlorophyll and the plant species. Different plants may have slightly different absorption spectra, which can affect their photosynthetic efficiency and adaptability to different light environments. Understanding the absorption spectrum of chlorophyll is not only important for understanding plant physiology but also has practical applications in areas such as agriculture and biotechnology. By manipulating the light environment or developing plants with enhanced chlorophyllabsorption, it may be possible to improve crop yields and optimize photosynthetic processes. In summary, the absorption spectrum of chlorophyll is a fascinating aspect of plant biology that has important implications for photosynthesis and plant growth. Further research in this area can provide valuable insights into the mechanisms of photosynthesis and lead to new strategies for improving plant productivity.。


叶绿素荧光成像技术在植物生物学中的应用植物是地球生态系统中最重要的生物类群之一,其生长和代谢对人类的食品、医药和环境保护具有极其重要的意义。
而叶绿素作为植物中的重要色素,则是植物正常生长和光合作用的关键。
因此,如何准确地掌握植物中叶绿素的分布和代谢过程,对于我们深入了解植物生物学的本质有着重要的作用。
而叶绿素荧光成像技术,则为我们提供了一种非常实用的手段。
首先,为了更好地理解叶绿素荧光成像技术的应用,不得不先简要了解一下叶绿素荧光成像技术的基本原理和技术流程。
叶绿素荧光成像技术基于植物叶片中的叶绿素荧光信号,通过专业相机等设备将荧光信号转换为图像。
而在荧光成像技术中,荧光成像指探测叶绿素在光照下出现的荧光信号,在探测的过程中可以得到信号强度和时间。
这些荧光信号可以通过荧光成像仪等设备进行检测和记录,并转化为图像,从而形成可视化的数据信息。
其次,叶绿素荧光成像技术在植物生物学中的应用也是十分广泛的。
例如,通过叶绿素荧光成像技术可以非常精确地测量植物中的叶绿素含量和PSII (Photosystem II;光合作用中的光反应系统第二个过程)功能状态,进而研究叶绿素的分布和代谢过程。
同时,通过检测叶绿素荧光信号的变化可以分析植物生长和发育的过程,例如其可以监测光合作用中的电子转移过程,同时也可以用来研究植物在环境变化下的应激反应情况。
此外,叶绿素荧光成像技术还可用于植物农艺性状的研究,例如套袋处理对苗圃欧洲红松幼苗光合作用和光渗透性的影响。
其还可以用于研究植物叶片形态学和光合作用对植物生长与发育的调节作用等。
利用荧光成像技术,可以更精准地实现对植物生命活动的分析和监测。
综上所述,叶绿素荧光成像技术在植物生物学领域中有着十分广泛和深入的应用。
它不仅可以帮助我们更好地了解植物生长和代谢的本质,还可以为植物农艺性状的变异性研究提供有力的支持。
未来,相信随着技术的进一步发展,叶绿素荧光成像技术在植物生物学中的应用也将更加广泛和深入。
Fluorcam荧光成像技术及其在光合作用研究中的应用Eco‐lab生态实验室北京易科泰生态技术有限公司info@eco‐目录1、叶绿素荧光成像技术发展过程2、荧光参数及其生理意义3、PSI介绍(荧光成像的发明者)4、PSI产品介绍5、应用案例叶绿素荧光技术发展历程•Kautsky effect: Kautsky and Hirsch(1931)首次用肉眼发现叶绿素荧光现象并发表论文“CO2同化新实验”,后被称作“Kautsky effect”•PAM(Pulse Amplitude Modulated Fluorometer): Schreiber(1986)等发明了PAM脉冲调制技术测量叶绿素荧光。
•FluorCam:KineKc imaging of chlorophyll fluorescence: Ladislav Nedbal(2000)等于上世纪90年代末期发明了与PAM技术相结合的叶绿素荧光成像技术成像测量局部放大荧光参数及其意义•Fo、Fm与QY,此外还有PAR_Abs及ETR•Kautsky诱导效应:Fo,Fp,Fv,Ft_Lss,QY,Rfd•荧光淬灭分析:Fo,Fm,Fp,Fs,Fv,QY,NPQ,Qp,Rfd 等50多个参数•OJIP曲线:快速荧光诱导曲线。
Fo,Fj,Fi,P或Fm,Mo(OJIP曲线初始斜率)、FixArea固定面积、Sm(对关闭所有光反应中心所需能量的量度)、QY、PI等•LC光响应曲线:Fo,Fm,QY,QY_Ln叶绿素荧光仪著名厂商•PSI:捷克布尔诺Brno(孟德尔在此发现著名的孟德尔遗传定律),Ladislav Nedbal为首席科学家和主要股东(另一股东为David Kramer,美国密执根州立大学教授),1997年为美国华盛顿大学H.Pakrasi教授研制成了第一台FluorCam荧光成像系统。
主要产品有:–FluorCam叶绿素荧光成像系列产品–FL3500/FL5000双调制荧光仪系列产品–FluorPen及AquaPen等手持式荧光仪产品–光养生物反应器等藻类培养与在线监测产品–光源与植物培养室•Optics:美国,主要产品为OS5p‐PAM叶绿素荧光仪等•Walz:德国,主要产品为PAM2500叶绿素荧光仪等PSI厂家介绍PSI厂家剪影laboratoryFluorCam叶绿素荧光成像:1. Handy FC——FluorCam便携式叶绿素荧光成像系统2. Handy GFPCam——FluorCam便携式荧光蛋白成像系统3. Handy Leaf chamber——便携式光合联用叶绿素荧光成像系统4.Closed FC——封闭式叶绿素荧光成像系统5. Closed GFPCam——封闭式多光谱荧光蛋白成像系统6. Open FC——开放式叶绿素荧光成像系统‐Rover FluorCam——移动式大型植物荧光成像系统‐Transect FluorCam——样带扫描式植物荧光成像系统‐XY‐Plane FluorCam——多光谱XY‐平台式大型植物荧光成像系统‐Arch FluorCam——拱形三维植物荧光扫描成像系统7. Micro‐FluorCam——显微叶绿素荧光成像系统,又分标准版、增强版(可选配GFP FilterCube Set)及滤波轮版8. Conveyor and RoboKc PlantScan System——PlantScan全自动植物光谱成像分析系统9. Fluorescence KineKc Microscope——FKM荧光动态显微光谱成像系统Fluorcam荧光成像技术特点◆对叶片无损伤、测量迅速◆测量对象多样,包括叶片、果实、藻类、地衣、苔藓、拟南芥等◆具备自动重复测量功能,从而实现无人职守自动成像实验◆结果以图片或视频形式输出,直观、易于观察◆应用领域广泛,如光合作用、植物胁迫生理学、水生生物学、海洋学和遥感等◆实验室、野外均可使用◆测量面积范围广,小至微米,大至整块草坪◆用户可根据实验需要,自定义测量参数FlourCam叶绿素荧光成像技术应用领域•植物光合特性和代谢紊乱植株的筛选•生物和非生物胁迫的检测•植物抗胁迫能力或者易感性研究•气孔非均一性研究•长势与产量评估•植物——微生物交互作用研究•植物——原生动物交互作用研究Kautsky effect in a diuron‐inhibited leaf(敌草隆抑制电子传递实验)OJI PScreen mutants by NPQ parameters (通过荧光淬灭分析筛选变异植株)水分对沙漠中苔藓的光合特性的影响加水0.5 h后高光胁迫获得的衣藻突变体重金属胁迫条件下的烟叶荧光成像左图为对照烟叶,中图为通过叶脉浸泡硫酸铜30分钟后的荧光成像,右图为经硫酸铜浸泡处理60分钟后的荧光成像。
PlantScreen叶绿素荧光与RGB自动扫描成像分析系统PlantScreen叶绿素荧光与RGB自动扫描成像分析系统集成了自动化控制系统、FluorCam大型叶绿素荧光成像测量分析、RGB植物真彩成像分析等先进技术,实现对各种培养植物——从拟南芥、水稻到各种其它植物的生理生态与形态结构成像分析,用于高通量植物表型成像分析测量、植物胁迫响应成像分析测量、生态毒理学与污染生态学研究、性状识别及植物生理生态分析研究、作物育种与抗性检测、生物多样性/遗传多样性表型检测分析及土壤种子库研究等。
成像平台可在主机箱内XYZ三维自动化移动,自动扫瞄成像范围为60cm x 129cm,植物最大高度约50cm。
系统配置与工作原理:系统由XYZ三维自动控制箱、XYZ三维移动成像平台及自动控制与分析软件等组成,LED光源、FluorCam叶绿素荧光成像、RGB成像集成于一个可XYZ三维自动化移动的成像平台上,程序控制XYZ三维精确定位和定时,在线数据分析。
采用世界上单幅成像面积最大的叶绿素荧光成像系统,成像面积达35×35cm。
技术指标:1.XYZ三轴机械臂可自由移动至植物上方成像分析,成像扫瞄面积范围60cm x 129cm(可选配其它大型系统),植物高度49cm,镜物距25cm,Z轴最大负重30kg2.标准配置X轴活动范围0-101cm,精确度±1mm;Y轴活动范围0-72cm,精确度±1mm;Z轴活动范围0-49cm,精确度±5mm;3.叶绿素荧光成像:镜头分辨率1392x1040像素,单幅成像面积35x35cm,测量光橙色618nm,橙色和白色双波长光化学光,饱和光闪为白色,最大光强3600μmol/m2/s,具735nm红外光源4.叶绿素荧光成像测量参数包括Fo, Fm, Fv,Fo’, Fm’,Fv’, Ft,Fv/Fm, Fv’/Fm’,Phi_PSII, NPQ, qN,qP, Rfd等几十个叶绿素荧光参数5.RGB成像分析测量参数包括:1)叶面积(Leaf Area: Useful for monitoring growth rate)2)植物紧实度/紧密度(Solidity/Compactness. Ratio between the area covered by theplant’s convex hull and the a rea covered by the actual plant)3)叶片周长(Leaf Perimeter: Particularly useful for the basic leaf shape and widthevaluation (combined with leaf area))4)偏心率(Eccentricity: Plant shapeestimation, scalar number, eccentricityof the ellipse with same secondmoments as the plant (0...circle, 1...linesegment))5)叶圆度(Roundness: Based on evaluatingthe ratio between leaf area andperimeter. Gives information about leafroundness)6)叶宽指数(Medium Leaf Width Index: Leafarea proportional to the plant skeleton(i.e. reduction of the leaf to linesegment))7)叶片细长度SOL (Slenderness of Leaves)8)植物圆直径(Circle Diameter. Diameter of a circle with the same area as the plant)9)凸包面积(Convex Hull Area. Useful for compactness evaluation)10)植物质心(Centroid. Center of the plant mass position (particularly useful for theeccentricity evaluation))11)节间距(Internodal Distances)12)生长高度(Growth Height)13)植物三维最大高度和宽度(Maximum Height and Width of Plant in 3 Dimensions)14)相对生长速率(Relative growth rate)15)叶倾角(Leaf Angle)16)节叶片数量(Leaf Number at Nodes)17)其它参数如用于植物适合度估算的颜色定量分级、绿度指数(Other parameters suchas color segmentation for plant fitness evaluation, greening index and others)6.高灵敏度RGB成像传感器,CMOS 1/2”,分辨率2560x1920像素,像素大小2.2μm,四个LEDs高强白色光源,成像信息包括时间和位置,纪录格式为日期-月份-年度-小时-分钟-秒-Pos_X_Y_Z.bmp7.系统控制与数据采集分析系统:用户友好的图形界面,用户定义、可编辑自动测量程序(protocols),控制单元有主电源开关、紧急关闭、XYZ三维轴启动开关、暂停键、移动键等,用户名和密码保护8.程序控制XYZ三维精确定位和定时,并纪录带时间和三维空间位置的数据(四维信息数据)9.三相电源供电,3x230/220VAC,50/60Hz10.大小规格200cm(长)x150cm(宽)x230(高),重量约400kg产地:欧洲。
FluorCam叶绿素荧光成像技术应用案例(第二期)——藻类研究中的应用PSI公司首席科学家Nedbal教授与公司总裁Trtilek博士等首次将PAM叶绿素荧光技术与CCD技术结合在一起,研制成功了FluorCam叶绿素荧光成像技术(Nedbal等,2000),并于1997年为美国华盛顿大学提供了第一台商业FluorCam系统。
FluorCam叶绿素荧光成像技术成为上世纪90年代叶绿素荧光技术的重要突破,使科学家们对光合作用与叶绿素荧光的研究正式进入了二维世界和显微世界。
目前FluorCam叶绿素荧光成像技术已成为世界上最权威、使用最广、种类最全面、发表论文最多的叶绿素荧光成像技术,已经发展出FluorCam便携式叶绿素荧光成像仪、FluorCam便携式Chl/GFP荧光成像仪(Handy GFPCam)、FluorCam便携式光合联用型叶绿素荧光成像系统、FluorCam封闭式叶绿素荧光成像系统、FluorCam封闭式Chl/GFP荧光成像系统(Closed GFPCam)、FluorCam封闭式多光谱荧光成像系统、FluorCam开放式标准版叶绿素荧光成像系统、FluorCam开放式大型版叶绿素荧光成像系统、FluorCam开放式多光谱荧光成像系统、FKM多光谱荧光动态显微成像系统、FluorCam移动式大型版叶绿素荧光成像系统、FluorCam样带扫瞄叶绿素荧光成像系统等一系列仪器系统。
现有SCI发表参考文献近400篇,可联系Ecolab生态实验室索取或点击以下链接下载FluorCam 叶绿素荧光成像部分参考文献名录链接本期应用案例主要介绍使用FluorCam叶绿素荧光成像技术进行藻类研究的各种案例。
一、蓝藻固氮与光合放氧的关系(论文发表于Science)文献:I Berman-Frank, et al. 2001. Segregation of Nitrogen Fixation and Oxygenic Photosynthesis in the Marine Cyanobacterium Trichodesmium. science, 294: 1534-1537使用仪器技术:FKM多光谱荧光动态显微成像技术和FRRF快速重复荧光测量技术(FRRF技术介绍链接)FKM技术详细介绍链接研究内容:现代海洋中,有相当一部分固氮作用是由Trichodesmium属蓝藻完成的。
ORIGINAL ARTICLEArabidopsis BPG2:a phytochrome-regulated gene whose protein product binds to plastid ribosomal RNAsByung-Hoon Kim •Przemyslaw Malec •Andrzej Waloszek •Albrecht G.von ArnimReceived:17February 2012/Accepted:22March 2012ÓSpringer-Verlag 2012Abstract BPG2(B rz-insensitive p ale g reen 2)is a dark-repressible and light-inducible gene that is required for the greening process in Arabidopsis .Light pulse experiments suggested that light-regulated gene expression of BPG2is mediated by phytochrome.The T-DNA insertion mutant bpg2-2exhibited a reduced level of chlorophyll and carot-enoid pigmentation in the plastids.Measurements of time resolved chlorophyll fluorescence and of fluorescence emission at 77K indicated defective photosystem II and altered photosystem I functions in bpg2mutants.Kinetic analysis of chlorophyll fluorescence induction suggested that the reduction of the primary acceptor (Q A )is impaired in bpg2.The observed alterations resulted in reduced pho-tosynthetic efficiency as measured by the electron transfer rate.BPG2protein is localized in the plastid stroma frac-tion.Co-immunoprecipitation of a formaldehyde cross-linked RNA–protein complex indicated that BPG2protein binds with specificity to chloroplast 16S and 23S ribosomal RNAs.The direct physical interaction with the plastid rRNAs supports an emerging model whereby BPG2pro-vides light-regulated ribosomal RNA processing functions,which are rate limiting for development of the plastid and its photosynthetic apparatus.Keywords Light ÁChloroplasts ÁRNA binding ÁrRNA processing ÁChlorophyll fluorescence AbbreviationsBPG2B rz-insensitive p ale g reen 2Brz BrassinazoleCaMV Cauliflower mosaic virus ETR Electron transfer rate LHC Light-harvesting complex PSI Photosystem I PSII Photosystem II YFP Yellow fluorescence proteinIntroductionSince plants use light as their energy source,the photo-synthetic efficiency is critical to their fitness and survival.Indeed,the goal of many plant developmental processes is to obtain optimal quantity and quality of light.Those pro-cesses include leaf development,shade avoidance and chloroplast development and movement (Franklin et al.2005).In order to attain this,not only the photosynthetic gene expression,but also the expression levels of genes that are directly or indirectly related to those developmental processes are regulated by light.Based on microarray data,B.-H.Kim (&)Department of Natural Sciences,Albany State University,504College Drive,Albany,GA 31705,USA e-mail:bkim@B.-H.Kim ÁA.G.von ArnimDepartment of Biochemistry,Cellular and Molecular Biology,University of Tennessee,Knoxville,TN 37996,USA e-mail:vonarnim@P.Malec ÁA.WaloszekFaculty of Biochemistry,Biophysics and Biotechnology,Jagiellonian University,ul.Gronostajowa 7,30-387Krakow,Polande-mail:przemyslaw.malec@.pl A.Waloszeke-mail:andrzej.waloszek@.plA.G.von ArnimGraduate Program in Genome Science and Technology,University of Tennessee,Knoxville,TN 37996,USAPlantaDOI 10.1007/s00425-012-1638-6light/dark-induced gene expression changes occur in many different cellular processes,such as nitrogen and sulfur assimilation,cell wall synthesis,protein synthesis and degradation,secondary metabolism,amino acid synthesis, hormone synthesis and responses,as well as photosynthesis (Ma et al.2001;Kim and von Arnim2006).Phytochromes are photoreceptors that play a central role in the perception of the light environment,in particular,the balance between red and far-red light(Franklin and Quail2010).In angiosperms,assembly of the photosynthetic appa-ratus remains suppressed under dark conditions,which permits seedlings that germinate under a protective layer of soil to allocate the maximum of resources to prolonged extension growth(etiolation).Light,then,triggers a tightly orchestrated program of gene expression changes that result in the ordered assembly of the photosynthetic apparatus and thus development of the plastid organelle from a non-photosynthetic etioplast to a photosynthetic chloroplast.This program includes chlorophyll biosynthe-sis,development of thylakoid membranes and the forma-tion of thylakoid membrane stacks termed grana.All these require gene expression changes in both the plastid and the nuclear genome at the transcription and/or translation level. Analysis of chlorophyllfluorescence facilitates the assessment of plant photosynthetic activity.In particular, emission spectra at low temperatures provide information on the energy transfer to pigment-protein complexes,such as reaction centers of photosystems I and II and light-harvesting complex(LHC)II monomers(Krause1991). Conversely,kinetic analysis of chlorophyllfluorescence at room temperature is a non-invasive tool to monitor early photosynthetic events and to evaluate the physiological condition of plant organisms(Maxwell and Johnson2000).Assembly of the photosynthetic apparatus is regulated not only by light,but also by hormones such as abscisic acid,cytokinin and brassinosteroid at least to some extent (Kusnetsov et al.1998).A previous report revealed that the BPG2gene(B rz-insensitive p ale g reen)is involved in the greening process.BPG2was identified by virtue of being less sensitive to the brassinosteroid biosynthesis inhibitor, Brz(brassinazole).Mutant bpg2plants showed defects in plastid rRNA processing(Komatsu et al.2010).We report that Arabidopsis BPG2expression is regu-lated by phytochrome.The mutation in bpg2led to a variety of changes in thefluorescence characteristics of both photosystems.The BPG2protein is localized in the plastid stroma where it mediates ribosomal RNA process-ing by interacting with rRNA.The induction of rRNA production by phytochrome during de-etiolation was described in pea and mustard plastids over40years ago during the dawn of molecular plant physiology(Scott et al. 1971;Thien and Schopfer1975).We propose that BPG2is a phytochrome-regulated gene important for assembly of the chloroplast translation apparatus and,consequently,of the photosynthetic apparatus.MethodsPlant material and growthWild type,bpg2-2mutant(T-DNA insertion,SALK-068713;Alonso et al.2003)and bpg2-2mutant comple-mented by the overexpression of BPG2cDNA fused to YFP were Arabidopsis thaliana ecotype Columbia.For the experiments using young seedlings,Arabidopsis plants were grown under continuous light condition(80l mol/m2/ s)on19MS-medium containing1%sucrose and0.8% agar with or without other supplements under conditions given in the text.For the experiments using older plants, about10-day-old seedlings on Petri dishes were transferred onto soil and grown further at22°C under continuous light conditions(90l mol/m2/s).For the induction of BPG2expression by red light pulse, 8-day-old dark-grown seedlings were illuminated for5min of red(10l mol/m2/s)or far-red(50l mol/m2/s)light. Seedlings were kept in darkness for5h and harvested for total RNA isolation.Construction of plasmid DNAFor the BPG2-YFP fusion construct,full-length BPG2 (At3g57180)cDNA was PCR amplified by Vent Poly-merase(NEB,Ipswich,MA,USA)using primers with Nco I restriction endonuclease sites(BPG2forward-Nco I, 50-acgccatggtggttttgatttcaagtacag-30;BPG2reverse-Nco I, 50-tatccatggcaacactatcagagagaa-30).The Nco I-digested PCR product was inserted into Nco I-cut of pBS-EYFP(Subra-manian et al.2006)generating a translational fusion of CaMV35S promoter-driven BPG2-YFP protein,which is named pBS-BPG2-YFP.For the genetic complementation,pBS-BPG2-YFP was digested using Kpn I/Bam HI.The resulting expression cassette includes the promoter,BPG2-YFP coding sequence and the CaMV transcriptional terminator.This was inserted into Kpn I/Bam HI-digested binary vector pPZP222(Hajdukiewicz et al.1994)for the transformation of the bpg2mutant.Plant stable transformation and transient expressionin onion epidermal cellsAgrobacterium tumefaciens(GV3101)harboring the appropriate binary vector was used for Arabidopsis trans-formation.Transformants were selected by growing the seedlings on MS agar medium supplemented withPlantagentamicin(100l g/ml).Transient expression of BPG2-YFP in onion epidermal cells was conducted by particle bombardment as described previously(Subramanian et al. 2006).Pigment quantificationChlorophyll and carotenoid contents were measured by following previous methods(Lichtenthaler1987).The aerial part of11-day-old seedlings(100mg fresh weight) was ground in5ml of80%acetone(20mg/ml,final concentration)on ice under safe green light.The solution was incubated at4°C in darkness overnight.After cen-trifugation for10min at4°C,the supernatant was diluted to1:1with cold80%acetone(10mg/ml,final concen-tration).Spectroscopic absorbance was measured at 663.2,646.8and470nm.The pigment contents were calculated by the following equations:chlorophyll a(C a)= 12.259A663.2-2.799A646.8;chlorophyll b(C b)= 21.509A646.8-5.109A663.2;total carotenoid=(1,0009 A470-1.829C a-85.029C b)/198.The resulting con-centrations are shown as l g/10mg plant fresh weight.Values are mean±SD from three independent experiments.For HPLC analysis,*100mg of rosette leaves was homogenized with a pestle and mortar in5–7ml of90% acetone(v/v)with an addition of20mg of CaCO3 according to(Lichtenthaler1987).Extracts were clarified by centrifugation(10,000g for5min)and evaporated to dryness with gaseous nitrogen.The obtainedfilm was dissolved directly in the HPLC mobile phase(solvent A). Pigments were separated with a Prostar HPLC system (Varian,Miami,FL,USA)equipped with a photodiode array spectrophotometric detector Tidas I(World Precision Instruments,Sarasota,FL,USA)and a Nucleosil100C-18 reversed phase column(4.69250mm),5l m particle size (Technokroma,Barcelona,Spain),using the solvent system described by Gilmore and Yamamoto(1991).Samples (100l l)werefiltered through a stainless steelfilter (u=0.22l m)and loaded onto the column equilibrated with the solvent A(acetonitrile:methanol:H2O72:8:1;v/v/v). The column was eluted isocratically with solvent A for 15min,followed by a one-step gradient(0–100%,2min) of the solvent B(ethyl acetate:methanol360:160,v/v)and an isocratic hold(5min)at100%B.During separation,a constantflow rate of 1.5ml/min was ensured.The absorption spectra of the eluate(380–800nm)were recorded every0.2s.Pigments were identified on the basis of both their absorption spectra and their retention times. The concentrations of carotenoid species were calculated from Beer–Lambert’s law using their specific extinction coefficients at440nm(Mantoura and Llewellyn1983). Chlorophyll a contents were calculated accordingly using its specific extinction coefficient at665nm(Lichtenthaler 1987).Values are mean±SE from at least three individual experiments.Chlorophyllfluorescence and electron transport rateThe F V/F M was calculated from the ground state chloro-phyllfluorescence value(F0)and the maximumfluores-cence value(F M),where F V/F M=(F M-F0)/F M.The F M and F0were measured by using a OS-30p Chlorophyll Fluorometer(Opti-Sciences,Hudson,NH,USA).V J and S M were calculated from the numeric data offluorescence as described in Strasser et al.(2000).Electron transfer rate(ETR)light intensity-dependent curves were measured using a PAM210(Walz,Germany) pulse-amplitude-modulated chlorophyllfluorometer.Sour-ces of red(630–680nm)measuring(ML),adapting(AL) and saturating(SP)light were internal light emitting diodes (LED)of the apparatus.Intensities of ML and SP were below0.1and3,500l mol/m2/s of photons,respectively. After the measurement of F0and F M values,the sample was adapted for5min in the lowest AL and,in ten fol-lowing steps,for2min in increasing AL intensities.A measurement of F M has been done at the end of each adaptation period.ETR values were calculated as it is described in Schreiber(1997).PSII efficiency imaging was carried out using an Open FluorCam FC800-O chlorophyllfluorescence imaging system(Photon System Instruments,Czech Rep.).For each pixel,the basicfluorescence level(F0)was measured at lightfluence rate of0.1l mol/m2/s.Subsequently,the Kautsky induction kinetics offluorescence was recorded at 200l mol/m2/s of photons.The red band of excitation light with k max=635nm was used.Low temperaturefluorescenceFor77Kfluorescence measurements,the Arabidopsis rosette leaves were homogenized in10mM Hepes, pH7.0and immediately frozen in capillary tubes in liquid nitrogen.Steady-statefluorescence emission spectra(600–780nm)were recorded at77K,using437nm excitation wavelength,with Perkin-Elmer LS50B spectrofluorimeter (Beaconsfield,Buckinghamshire,UK)with automatic correction for the wavelength dependence of the detection system equipped with liquid nitrogen attachment.Both excitation and emission slits were of5nm.To enhance monochromatization of the excitation beam and to elimi-nate light scattering before emission slit,the BG16and KV550opticalfilters(Schott,Jena,Germany)were used, respectively.The scan rate was usually60nm/min. Three spectra were automatically averaged for a single measurement to optimize the signal/noise ratio.PlantaRNA isolation,Northern and RT-PCR analysisPlant samples were harvested and immediately frozen in liquid nitrogen.Total RNA was isolated using TRIreagent (SIGMA,St.Louis,MO,USA)following the manufac-turer’s guide.For reverse transcription reactions,1l g of RQ1DNase(Promega,Madison,WI,USA)-treated total RNA and0.5l g of oligo(dT)primer were incubated at 70°C for10min and chilled on ice.To this mixture,4l l of59reaction buffer,40units of RNasin(Promega), 20l M of each dNTPs and200units of M-MLV reverse transcriptase(Promega)were added in a total volume of 20l l.The reaction was incubated at42°C for50min,and then inactivated at70°C for15min.Thefirst strand cDNAs were diluted to100,and5l l(1/20of the initial amount)was used for a50l l PCR reaction.PCR was carried out under standard conditions using30cycles (BPG2)or25cycles(EF1-a)of94°C for45s,60°C for 45s and72°C for60s.20l l of PCR products was separated on a1%(w/v)agarose gel.The following primer sets were used for PCR:BPG2rt-forward,50-aagg aagttcaacctcggag-30;BPG2rt-reverse,50-aagtcgatacaggtta tactaagc-30;EF1a-forward,50-cagctaagggtgccgcc-30;EF1a-reverse,50-gtcgatcataacgaaagtctcatc-30.Control reactions with higher cycle numbers were performed to confirm that the reactions had not reached saturation.Northern blot analyses were carried out as described by Bollenbach et al.(2005).Five micrograms of denatured total RNA was separated on a1%agarose gel with3.3% formaldehyde and transferred to a positively charged nylon membrane.RNA on the nylon membrane was visualized with methylene blue for the verification of equal loading and transfer.For the Northern hybridization of plastid16S rRNA full-length Arabidopsis rrn16DNA was labeled with32P using Rediprime II DNA Labeling System(GE Healthcare,Piscataway,NJ,USA).The probes were hybridized with immobilized RNA in the‘DIG Easy Hyb’hybridization solution(Roche Diagnostics,Mannheim, Germany).Hybridization and washing steps were carried out according to manufacturer’s instruction.The mem-brane-bound radioactive signal was detected by exposing blots to SuperRX X-rayfilm(Fujifilm,Tokyo,Japan). Formaldehydefixation and RNAco-immunoprecipitationThe formaldehydefixation and the co-immunoprecipitation methods were modified from Terzi and Simpson(2009). Wild-type Arabidopsis seedlings expressing plastid targeted YFP and bpg2mutant expressing wild-type BPG2-YFP targeted to plastids were grown on MS solid media as described above.When they were10days old,about0.5g of whole seedlings were pulled out from the solid media and washed four times in cold,sterile water for1min each. Seedlings were vacuum-infiltrated in1%formaldehyde for 15min.Formaldehyde was replaced by125mM of glycine and further vacuum-infiltrated for5min.Seedlings were washed four times in cold,sterile water for1min each. After drying between two sheets offilter paper,the seed-lings were either frozen in liquid nitrogen and stored in -80°C or ground in liquid nitrogen for the extraction of protein and RNA.The samples ground in liquid nitrogen were resus-pended in1ml of RNA-coIP buffer[25mM Tris/HCl pH 8,150mM NaCl,1mM EDTA,1%Triton X-100,0.1% SDS,10l l RNasin(Promega),10l l Protease Inhibitor Cocktail(SIGMA)].The samples were centrifuged in a table top centrifuge for10min at4°C.The supernatants were centrifuged again for2min.After determining the protein concentration by BCA protein assay(Pierce, Rockford,IL,USA),10mg of crude extract with the adjusted volume of1ml was pre-cleared for3h at4°C with gentle rotation by incubating with protein A Sepharose(100l l of50%slurry)that had been previ-ously washed three times with Beads Washing Buffer (25mM Tris/HCl pH8,150mM NaCl,1mM EDTA, 1%Triton X-100,0.1mM PMSF).These pre-cleared extracts were incubated with washed protein A Sepharose (50l l of50%slurry)and5l l of anti-GFP antiserum (Molecular Probes,Eugene,OR,USA)for4h at4°C with gentle rotation.The precipitates were washed twice with Washing Buffer1(25mM Tris/HCl pH8,150mM NaCl,1mM EDTA,1%Triton X-100,0.1%SDS)for 5min each at4°C.After that,two more washing solu-tions(Washing Buffer2,25mM Tris/HCl pH8,500mM NaCl,1mM EDTA,1%Triton X-100,0.1%SDS; Washing Buffer3,25mM Tris/HCl pH8,250mM LiCl, 1mM EDTA,1%Triton X-100,1%sodium deoxycho-late)were used twice each for5min at4°C to wash out the unspecific binding thoroughly.Finally,the pellets were washed twice with Washing Buffer4(25mM Tris/HCl pH8,1mM EDTA)for5min at4°C.To elute the precipitates,beads were resuspended in300l l of Elution Buffer(100mM NaHCO3,1%SDS)for15min at65°C with gentle agitation.The elution was repeated with new Elution Buffer.The eluates were combined.Formaldehyde cross-link was reversed by adding5M NaCl to afinal concentration of200mM and by incubating overnight at 65°C.The eluates were further incubated at37°C for 30min with three units of RQ1DNase(Promega).After adding protease K to afinal concentration of50l g/ml,the eluates were further incubated at50°C for30min. Co-precipitated RNAs were purified by phenol:chloro-form:isoamylalcohol extraction followed by ethanol pre-cipitation.Final pellets were solubilized in10l l of 10mM Tris/HCl(pH8).PlantaRadioactive labeling of cDNA probe and dot blot analysisTen microliters of co-precipitated RNAs were mixed with 1l l(1mg/ml)of random hexamer along withfirefly luciferase mRNA(1ng;Promega)and heated at70°C for 10min.After snap cooling on ice,the following compo-nents were added:59M-MLV reverse transcriptase buffer (5l l),10mM cold dNTP without dCTP(1l l),100l M cold dCTP(1l l),radioactive dCTP(5l l),RNasin(1l l; Promega)and M-MLV reverse transcriptase(1l l;Pro-mega).The reactions were incubated at42°C for40min. Again,1l l of M-MLV reverse transcriptase and1l l of 10mM cold dNTP(including dCTP)were added and further incubated at42°C for an additional40min.The reactions were inactivated by incubating at70°C for 15min.Dot blots were prepared as described by Brown(2001) using the indicated concentrations of cDNA probes on a positively charged nylon membrane.Probes for EF1-a, rbcL,16S rrn and23S rrn were generated by PCR ampli-fication of genomic DNA using primer pairs,EF1a-forward, 50-cagctaagggtgccgcc-30;EF1a-reverse,50-gtcgatcataacgaa agtctcatc-30;16Srrn-forward,50-gaaagagaggggtgccttcggg-30;16Srrn-reverse,50-acgacttcactccagtcactagcc-30;23Srrn-forward,50-gccaatgttcgagtaccaggcg-30.Partial DNA probes for atpB/E,ndhC and rpoC2were produced by enzyme digestion of Arabidopsis clones,M53H4(Eco RI/Xho I), 251N14(Sal I/Not I),and97D24(Sal I/Not I),respectively. All PCR products and restriction enzyme digested frag-ments were purified and quantified after agarose gel electrophoresis.Hybridization and detection were carried out with DIG Easy Hyb hybridization solution(Roche Diagnostics)under the same condition as described above for Northern analysis.Isolation of chloroplasts and Blue Native-PAGE Arabidopsis chloroplasts were isolated from wild-type and mutant plants according to Rensink et al.(1998).Rosette leaves(10g)from3-week-old plants were used as starting material.Small amount of chloroplasts were lysed by hypotonic buffer(50mM Tris/HCl,0.01%Triton X-100, pH8.0)and the concentration of soluble proteins was determined by BCA protein assay(Pierce,Rockford,IL, USA).Blue Native gel electrophoresis was carried out with a slight modification of the protocol available from http:// /PDF/BNPAGE.pdf.Intact chloro-plasts(equivalent of200l g of soluble proteins)were pelleted and resuspended in40l l of solubilization buffer (0.75M Aminocaproic acid,0.05M Bis–Tris,pH7.0).To solubilize membrane proteins,7.5l l of10%n-dodecyl-b-D-maltopyranoside was added and kept on ice for30min. After centrifugation(10min,4°C),supernatant was recovered and mixed with2.5l l of5%Coomassie blue in 0.5M aminocaproic acid.PMSF was also added to afinal concentration of1mM.Samples were spun briefly to eliminate insoluble aggregates,and20l l of supernatant was loaded onto a gradient(3.5–12%)BN-PAGE gel.Gel was run at150V in the cold room using a separate cathode buffer(50mM Tricine,15mM Bis–Tris,0.02%Coo-massie blue G,pH7.0)and an anode buffer(50mM Bis–Tris,pH7.0).To run a second dimension of SDS-PAGE,a single lane of the BN-PAGE gel was cut and incubated for 30min in10%glycerol,2%SDS,50mM Tris(pH6.8), 0.002%bromophenol blue and20mM b-mercap-toethanol.The gel strip was rinsed briefly in the same buffer without b-mercaptoethanol,and inserted between the two glass plates before the SDS separating gel (5–20%)was cast.After the solidification of separating gel and casting a stacking gel around the BN-PAGE gel strip, the second dimensional SDS-PAGE was carried out as a standard SDS-PAGE.Statistical analyses and reproducibilityAll statistical analyses(SD and SE)were carried out using Microsoft EXCEL,and treated statistically where possible as indicated above.Other non-statistical and non-quanti-tative data were performed multiple times with indepen-dent biological samples and produced similar results.Resultsbpg2mutant and gene expressionOur previous microarray study identified790Arabidopsis genes that responded when seedlings are shifted from light to darkness for1–8h(Kim and von Arnim2006).Of these, 142were screened for several light/dark-related mutant phenotypes,including greening status and petiole elonga-tion under light conditions and upon shift to darkness.We found a pale green mutant with a T-DNA insertion in BPG2(B rz-insensitive p ale g reen;At3g57180;Fig.1a). The T-DNA was inserted in thefirst exon,and no full-length mRNA was detected in the mutant plants at different ages(Fig.1b).After backcrossing twice,the T-DNA co-segregated with the mutant phenotype,and this pheno-type could be complemented by constitutive expression of BPG2cDNA fused to yellowfluorescent protein(YFP; Fig.1a),confirming that the pale green phenotype of the bpg2mutant is due to the disruption of the BPG2locus by the T-DNA insertion.The same mutant allele(Salk_ 068713)has been previously reported as bpg2-2,whichPlantaexhibited reduced sensitivity to Brz treatment(Komatsu et al.2010).Brz,a specific inhibitor of brassinosteroid (BR)biosynthesis promotes chlorophyll accumulation (Nagata et al.2000).RT-PCR analysis confirmed our previous microarray result showing that the BPG2mRNA level was reduced upon dark treatment(Fig.1c).Prolonged dark treatment up to36h reduced the mRNA level even further,and the re-illumination of dark-adapted seedlings rapidly restored its mRNA level(Fig.1d).The light-responsive expression of BPG2is probably regulated by phytochromes,since the BPG2mRNA could be induced by a short red light pulse and reversed by far-red light pulse(Fig.1e).BPG2mRNA was found at higher level in leaves than other non-photo-synthetic organs(Fig.1f).Many light-inducible genes have multiple light-responsive cis-regulatory elements in their promoter region(Green et al.1987;Giuliano et al.1988; Martı´nez-Garcı´a et al.2000;Luo et al.2010).The upstream region of the BPG2gene also has multiple motif elements that are known to be light-responsive in other contexts,although the classical G-box motif CACGTG isconspicuously absent.These motifs may be responsible for the phytochrome regulation of BPG2expression(Fig.2).BPG2protein is a soluble protein in plastids and affects the pigment compositionThe BPG2-YFP fusion protein transiently expressed in onion epidermal cells co-localized with the plastid-targeted CFP protein(Fig.3a,b)supporting the chloroplast locali-zation of BPG2-GFP in transgenic Arabidopsis plants (Komatsu et al.2010).Since the BPG2-YFP signal was found in the stroma-filled tubules,which lack thylakoids (stromules;Fig.3a inset),we conclude that the BPG2 protein is localized in the stroma fraction of plastids.We also determined the subplastid localization of transgenic BPG2-YFP protein by cell fractionation and Western blot analysis in Arabidopsis bpg2mutant plants(Fig.3c).YFP-tagged BPG2protein was detected in the soluble fraction, together with stroma proteins such as Rubisco,and was not associated with membranes(Fig.3c).ThecompletelyFig.1bpg2mutant and regulation of BPG2gene expression.a Morphological phenotype of wild type(WT),bpg2-2,and bpg2-2 complemented by BPG2cDNA fused to YFP(BPG2-YFP).b Gene structure of BPG2and the location of T-DNA insertion in the bpg2-2 mutant.The coding sequence(black boxes)is interrupted by three introns andflanked by short untranslated regions(gray boxes).BPG2 protein contains a putative GTP-binding domain.RT-PCR could not detect BPG2transcript in the bpg2-2mutant.c Microarray result (from Kim and von Arnim2006)and RT-PCR result showing repression of BPG2mRNA by darkness.Light-grown10-day-old seedlings were transferred to complete darkness(D)for a given time period before harvest.L indicates the samples kept in the light. Translation elongation factor1alpha(EF1-a)served as a control.d RT-PCR result showing the repressive effect of prolonged dark treatment(Dark)and light-inducibility after4days of dark adaptation (Light).L,the non-dark-adapted light-grown sample.e Light pulse experiment.Dark-grown8-day-old seedlings were illuminated with far-red light(FR,730nm,50l mol/m2/s,5min),red light(R, 660nm,10l mol/m2/s,5min),or red light followed by far-red light (R-FR,5min each).After light treatment,seedlings were kept in darkness for5h.As a light-inducible control dark-grown seedlings were treated with white light for5h(L).Total RNA were isolated for RT-PCR.f RT-PCR analysis using total RNA samples from different organs indicates that BPG2is expressed predominantly in photosyn-thetically active organs cPlantadifferent protein banding patterns for the soluble and membrane fractions,as well as the membrane localization of marker proteins AtpB and D1,confirmed the effec-tive separation of the soluble stroma and membrane compartments.Because transgenic BPG2-YFP comple-mented the bpg2mutant phenotype,the localization of BPG2to the stroma is most probably authentic.Despite the localization of BPG2in the chloroplast and the palegreenFig.2Putative light-responsive cis -regulatoryelements found in the upstream region of BPG2gene.The genomic sequence of 1kb upstream from thetranscriptional start site of BPG2was queried to PLACE (PLAnt Cis -acting regulatory DNA Elements),a database of nucleotide sequence motifs (http://www.dna.affrc.go.jp/PLACE/).Only the light-responsive elements are shown:BOXIINTPATPB (ATAGAA),GATABOX (GATA),GT1CONSENSUS (GRWAAW),IBOX(GATAAG),IBOXCORE(GATAA)and IBOXCORENT (GATAAGR)Plantaphenotype,the confocal microscopic images did not sug-gest any significant difference in the number or size of chloroplasts from wild-type and bpg2mutant plants (Fig.3d).rRNA composition in the bpg2mutantBPG2protein harbors a putative GTP-binding domain with an unusual motif pared to theregularFig.3Subcellular localization of BPG2protein and confocal microscopic images .a Punctate localization pattern of transiently expressed BPG2-YFP in onion epidermal cells.Also shown is a bright field image.b BPG2-YFP (green )and CFP fused to plastid target sequence of rbcS (red )were transiently co-expressed in onion epidermal cells.Perfect overlay is shown by yellow color (merged).c Proteins were prepared from soluble and membrane fractions of Arabidopsis chloroplasts.Coomassie staining (left panel )as well as the Western blot of atpB,psbA (D1)and BPG2-YFP (right panel )are shown.d Representative confocal microscopic images showing autofluorescence from chloroplasts in mesophyll cells from 10-day-old seedlings of WT and bpg2mutant.Size bars indicate 30lmFig.4Defect in pre-processing of rRNA and interaction between rRNA and BPG2protein.a Wild type (WT),bpg2-2mutant,and bpg2-2mutant complemented by BPG2-YFP (compl.)were used for Northern blot analysis showing the 16S rRNA band (16S)and an additional band (asterisk )that is not fully processed.Methylene blue stained nylon membrane is also shown for RNA loading Northern transfer control.b Dot blot analysis using cDNA probes after co-immunoprecipitation of RNA with BPG2-YFP or plastid-targeted YFP (cpYFP).One representative experiment from three indepen-dently replicated experiments is shownPlanta。