数字信号处理第四章习题
- 格式:doc
- 大小:146.00 KB
- 文档页数:7
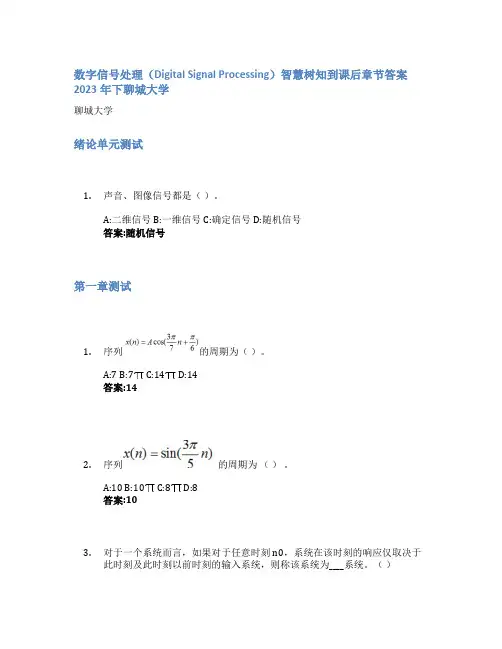
数字信号处理(Digital Signal Processing)智慧树知到课后章节答案2023年下聊城大学聊城大学绪论单元测试1.声音、图像信号都是()。
A:二维信号 B:一维信号 C:确定信号 D:随机信号答案:随机信号第一章测试1.序列的周期为()。
A:7 B:7 C:14 D:14答案:142.序列的周期为()。
A:10 B:10 C:8 D:8答案:103.对于一个系统而言,如果对于任意时刻n0,系统在该时刻的响应仅取决于此时刻及此时刻以前时刻的输入系统,则称该系统为____系统。
()A:线性 B:因果 C:稳定 D:非线性答案:因果4.线性移不变系统是因果系统的充分必要条件是______。
()A:n<0,h(n)=0 B:n>0,h(n)=0 C:n>0,h(n)>0 D:n<0,h(n)>0答案:n<0,h(n)=05.要想抽样后能够不失真的还原出原信号,则抽样频率必须,这就是奈奎斯特抽样定理。
()A:等于2倍fm B:小于等于2倍fm C:大于2倍fm D:大于等于2倍fm答案:大于等于2倍fm6.已知x(n)=δ(n),其N点的DFT[x(n)]=X(k),则X(N-1)= 1。
()A:对 B:错答案:对7.相同的Z变换表达式一定对应相同的时间序列。
()A:对 B:错答案:错8.滤波器设计本质上是用一个关于z的有理函数在单位圆上的特性来逼近所有要求的系统频率特性。
()A:错 B:对答案:对9.下面描述中最适合离散傅立叶变换DFT的是()A:时域为离散周期序列,频域也为离散周期序列 B:时域为离散有限长序列,频域也为离散有限长序列 C:时域为离散序列,频域也为离散序列 D:时域为离散无限长序列,频域为连续周期信号答案:时域为离散有限长序列,频域也为离散有限长序列10.巴特沃思滤波器的幅度特性必在一个频带中(通带或阻带)具有等波纹特性。
()A:错 B:对答案:错第二章测试1.N=1024点的DFT,需要复数相乘次数约()。

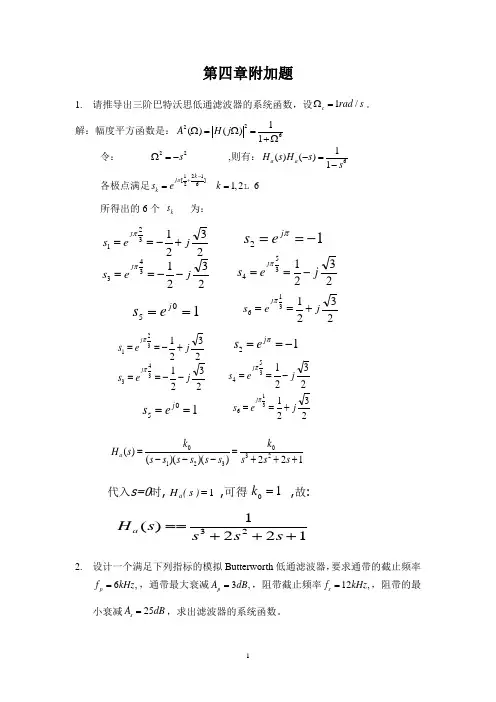
第四章附加题1. 请推导出三阶巴特沃思低通滤波器的系统函数,设1/c rad s Ω=。
解:幅度平方函数是:2261()()1A H j Ω=Ω=+Ω令: 22s Ω=- ,则有:61()()1a a H s H s s -=- 各极点满足121[]261,26k j k s ek π-+==所得出的6个 k s 为:15==j es 2321321jes j +-==π12-==πj e s 2321343jes j --==π2321354j es j -==π2321316j es j +==π15==j e s 2321321je s j +-==π12-==πj e s 2321343je s j --==π2321354j es j -==π2321316j es j +==π122))()(()(233210+++=---=s s s k s s s s s s k s H a 1221)(23+++==s s s s H a 代入s=0时, ,可得,故:1=)s (H a 10=k2. 设计一个满足下列指标的模拟Butterworth 低通滤波器,要求通带的截止频率6,p f kHz =,通带最大衰减3,p A dB =,阻带截止频率12,s f kHz =,阻带的最小衰减25s A dB =,求出滤波器的系统函数。
解: 2,2s s p p f f ππΩ=Ω= 0.10.1101lg 101N 2lg()s pA A sp⎛⎫- ⎪-⎝⎭≥ΩΩ=4.15取N=5,查表得H(p)为:221()(0.6181)( 1.6181)(1)H p p p p p p =+++++因为3,p A dB =所以c p Ω=Ω[]52222()()0.618 1.618cs p c c c c c c H s H p s s s s s =Ω=Ω=⎡⎤⎡⎤+Ω-Ω+Ω-Ω+Ω⎣⎦⎣⎦3. 设计一个模拟切比雪夫低通滤波器,要求通带的截止频率 f p =3kHz ,通带衰减要不大于0.2dB ,阻带截止频率 f s = 12kHz ,阻带衰减不小于 50dB 。


数字信号处理知到章节测试答案智慧树2023年最新上海健康医学院第一章测试1.如果连续时间信号是最高截止频率为的带限信号,采样频率为_______可不失真地恢复原连续时间信号。
参考答案:2.由模拟信号采样得到的序列,模拟角频率Ω与序列的数字域频率参考答案:线性3.在连续系统中,正弦信号是周期信号,其周期与频率呈_______关系。
参考答案:2π/w4.在离散时间系统中,最常用的是_______。
参考答案:线性非移变系统5.线性非移变系统的性质不包括_______。
参考答案:0-1 率6.由于序列是离散的,故在序列运算中不存在微积分运算。
()参考答案:对7.采样频率太高会产生太大的数据量,使运算时间延长,设备成本增加。
()参考答案:对8.系统满足可加性或齐次性,即为线性系统。
()参考答案:错9.任何序列都可以表示成单位脉冲序列移位加权和的形式。
()参考答案:对10.两个线性非移变系统级联后构成一个线性移变系统。
()参考答案:错第二章测试1.Z 变换是从_______直接引申出来的一种变换方法。
参考答案:拉普拉斯2.当序列是一个()序列时,双边Z变换和单边Z变换是相等的。
参考答案:因果3.Z 变换是关于 Z 的无穷多项的幂级数的_______。
参考答案:和4.的Z变换是_______。
参考答案:5.的 Z 变换收敛域是_______。
参考答案:|z|>|a|6.Z 变换等价于序列的傅里叶变换。
()参考答案:错7.收敛域包含∞是因果序列的Z变换得特征。
参考答案:对8.根据序列的 Z 变换求对应序列的运算称之为逆 Z 变换。
()参考答案:错9.的Z变换等于1。
参考答案:对10.对于求解同样的逆 Z 变换,因选择的方法不同,得到结果序列的分段点不同,实际数值上二者是等价的。
()参考答案:对第三章测试1.时域的连续周期对应于频域的()。
参考答案:非周期离散2.序列x1(n)的长度为4,序列x2(n)的长度为3,则它们线性卷积的长度是(),5点圆周卷积的长度是()。
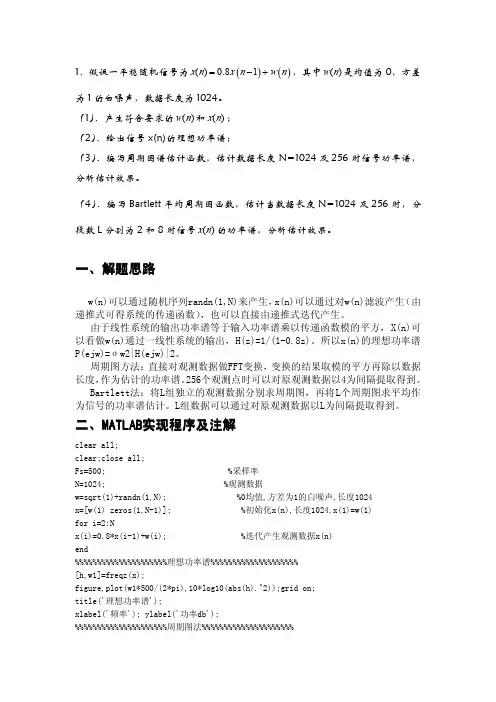
1、假设一平稳随机信号为()()()0.81x n x n w n =−+,其中)(n w 是均值为0,方差为1的白噪声,数据长度为1024。
(1)、产生符合要求的)(n w 和)(n x ;(2)、给出信号x(n)的理想功率谱;(3)、编写周期图谱估计函数,估计数据长度N=1024及256时信号功率谱,分析估计效果。
(4)、编写Bartlett 平均周期图函数,估计当数据长度N=1024及256时,分段数L 分别为2和8时信号)(n x 的功率谱,分析估计效果。
一、一、解题思路解题思路w(n)可以通过随机序列randn(1,N)来产生,x(n)可以通过对w(n)滤波产生(由递推式可得系统的传递函数),也可以直接由递推式迭代产生。
由于线性系统的输出功率谱等于输入功率谱乘以传递函数模的平方,X(n)可以看做w(n)通过一线性系统的输出,H(z)=1/(1-0.8z)。
所以x(n)的理想功率谱P(ejw)=σw2|H(ejw)|2。
周期图方法:直接对观测数据做FFT变换,变换的结果取模的平方再除以数据长度,作为估计的功率谱。
256个观测点时可以对原观测数据以4为间隔提取得到。
Bartlett法:将L组独立的观测数据分别求周期图,再将L个周期图求平均作为信号的功率谱估计。
L组数据可以通过对原观测数据以L为间隔提取得到。
二、二、MATLAB MATLAB MATLAB实现程序及注解实现程序及注解clear all;clear;close all;Fs=500;%采样率N=1024;%观测数据w=sqrt(1)+randn(1,N);%0均值,方差为1的白噪声,长度1024x=[w(1)zeros(1,N-1)];%初始化x(n),长度1024,x(1)=w(1)for i=2:Nx(i)=0.8*x(i-1)+w(i);%迭代产生观测数据x(n)end%%%%%%%%%%%%%%%%%%%%%理想功率谱%%%%%%%%%%%%%%%%%%%%[h,w1]=freqz(x);figure,plot(w1*500/(2*pi),10*log10(abs(h).^2));grid on;title('理想功率谱');xlabel('频率');ylabel('功率db');%%%%%%%%%%%%%%%%%%%%%周期图法%%%%%%%%%%%%%%%%%%%%%%1024个观测点Pxx=abs(fft(x)).^2/N;%周期图公式Pxx=10*log10(Pxx(index+1));%化为dbfigure;plot(k,Pxx);grid on;title('周期图1024点');xlabel('频率');ylabel('功率db');%周期图256个观测点x1=x(1:4:N);Pxx1=abs(fft(x1,1024)).^2/N;figure;plot(k,Pxx1);grid on;title('周期图256点');xlabel('频率');ylabel('功率db');%%%%%%%%%%%%%%%Bartlett平均周期图,N=1024%%%%%%%%%%%%%%%%%%%分段L=2L=2;x_21=x(1:L:N);x_22=x(2:L:N);Pxx_21=abs(fft(x_21,1024)).^2/length(x_21);Pxx_22=abs(fft(x_22,1024)).^2/length(x_22);Pxx_2=(Pxx_21+Pxx_22)/L;figure;subplot(2,2,1),plot(k,10*log10(Pxx_2(index+1)));grid on;title('N=1024,L=2');xlabel('频率');ylabel('功率db');%分段L=8L1=8;x3=zeros(L1,N/L1);%产生L1行,N/L1列的矩阵用以存储分组的数据for i=1:L1x3(i,:)=x(i:L1:N);%将原始数据分为8组endPxx3=zeros(L1,1024);%产生L1行,1024列矩阵用以存储分组的周期图for i=1:L1Pxx3(i,:)=abs(fft(x3(i,:),1024)).^2/length(x3(i,:));%分别求周期图,结果保存在Pxx3中,FFT长度为1024endfor i=1:1024Pxx3_m(i)=sum(Pxx3(:,i))/L1;%求平均endsubplot(2,2,2),plot(k,10*log10(Pxx3_m(index+1)));grid on;title('N=1024,L=8');xlabel('频率');ylabel('功率db');%%%%%%%%%%%%%%%Bartlett平均周期图,N=256,求法同上%%%%%%%%%%%%%%分段L=2,分别计算周期图,再取平均x=x(1:4:N);L2=2;x_31=x(1:L2:length(x));x_32=x(2:L2:length(x));Pxx_31=abs(fft(x_31,1024)).^2/length(x_31);Pxx_32=abs(fft(x_32,1024)).^2/length(x_32);Pxx_3=(Pxx_31+Pxx_32)/L2;subplot(2,2,3),plot(k,10*log10(Pxx_3(index+1)));grid on;title('N=256,L=2');xlabel('频率');ylabel('功率db');%分段L=8L3=8;x4=zeros(L3,length(x)/L3);for i=1:L3x4(i,:)=x(i:L3:length(x));%将原始数据分为8组endPxx4=zeros(L3,1024);for i=1:L3Pxx4(i,:)=abs(fft(x4(i,:),1024)).^2/length(x4(i,:));%分别求周期图,FFT长度为1024endfor i=1:1024Pxx4_m(i)=sum(Pxx4(:,i))/L3;%求平均endsubplot(2,2,4),plot(k,10*log10(Pxx4_m(index+1)));grid on;title('N=256,L=8');xlabel('频率');ylabel('功率db');三、实验结果理想功率谱图如图1-1所示图1-1理想功率谱图1024点的周期图以及256点的周期图分别如图1-2、1-3所示图2-21024点的周期图图2-3256点的周期图Bartlett平均周期图法的相应图像如图1-4所示图1-4Bartlett平均周期图法的相应图像四、实验结果分析由图1-2、1-3可以看出,周期图法得到的功率谱估计,谱线的起伏较大,即估计所得的均方误差较大。
数字信号处理习题集数字信号处理习题集第⼀章习题1、已知⼀个5点有限长序列,如图所⽰,h (n )=R 5(n )。
(1)⽤写出的()n δ()x n 函数表达式;(2)求线性卷积*。
()y n =()x n ()hn 2、已知x (n )=(2n +1)[u (n +2)-u (n -4)],画出x (n )的波形,并画出x (-n )和x (2n )的波形。
3、判断信号是否为周期信号,若是求它的周期。
3()sin 73x n n ππ??=+4、判断下列系统是否为线性的,时不变的,因果的,稳定的?(1),(2)2()(3)y n x n =-0()()cos()y n x n n ω=5、已知连续信号。
()2sin(2),3002a x t ft f Hz ππ=+=(1)求信号的周期。
()a x t (2)⽤采样间隔T=0.001s 对进⾏采样,写出采样信号的表达式。
()a x t ?()a xt (3)写出对应于的时域离散信号的表达式,并求周期。
?()a xt ()x n 6、画出模拟信号数字处理的框图,并说明其中滤波器的作⽤。
第⼆章习题1、求下列序列的傅⽴叶变换。
(1),(2)11()333nx n n ??=-≤ ?[]2()()()n x n a u n u n N =--2、已知理想低通滤波器的频率响应函数为:为整数,000(),0j n j e H e n ωωωωωωπ-?≤≤?=? <≤??cc 求所对应的单位脉冲响应h (n )。
3、已知理想⾼通滤波器的频率响应函数为:,求所对应0()1j H e ωωωωωπ≤≤=<≤??cc 的单位脉冲响应h (n )。
4、已知周期信号的周期为5,主值区间的函数值=,求该周期信号的()(1)n n δδ+-离散傅⾥叶级数和傅⾥叶变换.5、已知信号的傅⽴叶变换为,求下列信号的傅⽴叶变换。
()x n ()j X e ω(1)(2)(3)x n -*()x n -6、已知实因果信号如图所⽰,求和。
数字信号处理教程第四章练习题一、单选题1、直接计算N点DFT所需的复数乘法次数与( D)成正比。
A、NB、N2C、N3D、Nlog2N2、基-2FFT算法的基本运算单元为(A)。
A、蝶形运算B、卷积运算C、相关运算D、延时运算3、在N=32的按时间抽取法FFT运算流图中,从x(n)到X(k)需(B)级蝶形运A、4B、5C、6D、34、如图所示的运算流图符号是( B)基2FFT 算法的蝶形运算流图符号。
A、按频率抽取B、按时间抽取C、A、B都是D、A、B都不是5、如何将无限长序列和有限长序列进行线性卷积(D)。
A、直接使用线性卷积计算B、使用FFT计算C、使用循环卷积计算D、采用分段卷积可采用重叠相加法二、多选题1、用FFT算法计算DFT所需的复数乘法次数为(),复数加法次数为(AD)。
A、N/2log2NB、N/4log2NC、Nlog2N/2D、Nlog2N2、快速傅里叶变换的特点是(BCD)。
A、线性计算B、蝶形计算C、原位计算D、码位计算3、利用的哪些性质可以减少DFT的运算量(ACD)。
A、周期性B、循环性C、对称性D、可约性4、采用FFT算法用DFT计算线性卷积的方法有(AD)A、重叠相加法B、重叠相减法C、重叠去除法D、重叠保留法三、填空题1、快速傅里叶变换算法可以分为两大类,分别是(时域抽取法)、(频域抽取法)。
2、若对序列x(n)作1024点的DIT-FFT运算,则FFT运算中总需要的复数乘法次数(5120)。
四、判断题1、时域抽取法基2 FFT算法中不能实现原位计算。
(×)2、按频率抽取的基-2 FFT算法中,输入顺序为自然排列,输出为倒序排。
(√)3、按时间抽取的FFT算法运算量等于按频率抽取的FFT算法运算量。
(√)4、重叠相加法求线性卷积也是利用圆周卷积法代替线性卷积,用FFT算法求得。
(√)。
第四章习题4.1 (a) By expanding the equation()()[]()⎥⎦⎤⎢⎣⎡==⎰--∞→∞→2200021T T Ft j T xx T xx dt e t x T E lim F P E lim F 00πΓ taking the expected value, and finally taking the limit as ∞→0T ,show that the right-hand side converges to )(f xx Γ.(b) Prove that2102211)(1)(∑∑-=---+-==N n fn j fm j N N m xx en x N e m r ππ.4.2 For zero-mean, jointly Gaussian random variables, X 1, X 2, X 3, X 4, itis well known that)()()()()()()(3241423143214321X X E X X E X X E X X E X X E X X E X X X X E ++=. Use this result to derive the mean-square value of ()m r xx and the variance, given by()[][]()()()[]∑∞-∞=+-+-≈n xx xx xx xx m n m n n m N N m r γγγ*22varwhich is defined as[][][]22(()(var m r E m r E m r xx xx xx -=. 4.3 By use of the expression for the fourth joint moment for Gaussianrandom variables, show that(a)()()[]⎪⎭⎪⎬⎫⎪⎩⎪⎨⎧⎥⎦⎤⎢⎣⎡--+⎥⎦⎤⎢⎣⎡+++=2212122121421)(sin )(sin )(sin )(sin 1f f N N f f f f N N f f f P f P E x xx xx ππππσ (b)[]⎪⎭⎪⎬⎫⎪⎩⎪⎨⎧⎥⎦⎤⎢⎣⎡--+⎥⎦⎤⎢⎣⎡++=2212122121421)(sin )(sin )(sin )(sin )()(cov f f N N f f f f N N f f f P f P x xx xx ππππσ(c)[]⎪⎭⎪⎬⎫⎪⎩⎪⎨⎧⎪⎪⎭⎫ ⎝⎛+=242sin 2sin 1)(var f N fN f P x xx ππσ under the condition that the sequence ()n x is a zero-mean white Gaussian noise sequence with variance 2x σ.4.4 Generalize the results in Problem 4.3 to a zero-mean Gaussian noiseprocess with power density spectrum )(f xx Γ, as given by()[]()⎥⎥⎦⎤⎢⎢⎣⎡⎪⎪⎭⎫ ⎝⎛+Γ=222sin 2sin 1var f N fN f f P xx xx ππ (Hint: Assume that the colored Gaussian noise process is the output of a linear system excited by white Gaussian noise.)4.5 Show that the periodogram values at frequencies,1,1,0,/-==L k L k f k given by (4.1.35), can be computed by passing the sequence through a bank of L IIR filters, where each filter has an impulse response )()(/2n u e n h N nk j k π-= and then computing the magnitude-squared value of the filter outputs at n=N. Note that each filter has a pole on the unit circle at the frequency f k .4.6 The Bartlett method is used to estimate the power spectrum of asignal x(n). We know that the power spectrum consists of a single peak with a 3 dB bandwidth of 0.01 cycle per sample, but we do not know the location of the peak.(a) Assuming that N is large, determine the value of M=N/K so thatthe spectral window is narrower than the peak.(b) Explain why it is not advantageous to increase M beyond thevalue obtained in part (a).4.7 The N-point DFT of a random sequence x(n) is ∑-=-=10/2)()(N n N nk j e n x k X π.Assume that E[x(n)]=0 and E[x(n)x(n+m)]=)(2m w δσ (in other words,x(n) is a white noise process).(a) Determine the variance of X(k).(b) Determine the autocorrelation of X(k).4.8 An AR(2) process is described by the difference equation)()2(81.0)(n n x n x ω+-=, where w(n) is a white noise process withvariance 2ωσ.(a) Determine the parameters of the MA(2), MA(4), and MA(8)models that provide a minimum mean-sequare error fit to thedata x(n).(b) Plot the true spectrum and those of the MA (q), q=2,4,8spectra and compare the results. Comment on how well theMA(q) models approximate the AR (2) process.4.9 An MA (2) process is described by the difference equation )2(81.0)()(-+=n n n x ωω, where w(n) is a white noise process withvariance 2ωσ.(a) Determine the parameters of the AR(2), AR(4), and AR(8)models that provide a minimum mean-square error fit to the data x(n).(b) Plot the true spectrum and those of the AR(p), p=2,4,8, andcompare the results. Comment on how well the AR(p) modelsappoximate the MA (2) process.4.10 The autocorrelation sequence for an AR process x(n) ismxx m ⎪⎭⎫ ⎝⎛=41)(γ (a) Determine the difference equation for x(n)(b) Is your answer unique? If not, give any other possiblesolutions.4.11 Suppose that we represent an ARMA(p,q) process as a cascade ofan MA(q) followed by an AR(p) model. The input-output equation for the MA(q) model is ∑=-=qk k k n w b n v 0)()(, where w(n) is a whitenoise process. The input-output equation for the AR(p) model is∑==-+pk k n v k n x a n x 1)()()((a) By computing the autocorrelation of v(n), show thatq m d b b m mq k m w m k k w vv ≤≤==∑-=+0)(022σσγ(b) Show that 1)()(00=+=∑=a k m a m pk vx k vv γγ4.12 Suppose that the AR(2) process in Problem 4.8 is corrupted by anadditive white noise process v(n) with variance 2v σ. Thus, we havey(n)=x(n)+v(n)(a) Determine the difference equation for y(n) and thusdemonstrate that y(n) is an ARMA(2,2) process. Determinethe coefficients of the ARMA process.(b) Generalize the result in part (a) to an AR(p) process∑=+--=pk k n w k n x a n x 1)()()( and )()()(n v n x n y +=.4.13 The harmonic decomposition problem considered by Pisarenko maybe expressed as the solution to the equationa a a Γa H w yy H 2σ=The solution for a may be obtained by minimizing the quadratic form a Γa yy H subject to the constraint that a a H =1. The constraint can be incorporated into the performance index by means of a Lagrange multiplier. Thus the performance index becomes()a a a Γa H yy H 1-+=λζ.By minimizing ζ with respect to a , show that this formulation is equivalent to the Pisarenko eigenvalue problem given in (4.4.9), with the Lagrange multiplier playing the role of the eigenvalue. Thus,show that the minimum of ζ is the minimum eigenvalue 2w σ.4.14 The autocorrelation of a sequence consisting of a sinusoid withrandom phase in noise is)(2cos )(21m m f P m w xx δσπγ+=where 1f is the frequency of the sinusoidal, P its power, and 2w σthe variance of the noise. Suppose that we attempt to fit an AR(2) model to the data.(a) Determine the optimum coefficients of the AR(2) model as afunction of 2w σ and 1f .(b) Determine the reflection coefficients 1K and 2K correspondingto the AR(2) model parameters.(c) Determine the limiting values of the AR(2) parameters and (1K ,2K )as 02→w σ.4.15 This problem involves the use of cross-correlation to detect a signalin noise and estimate the time delay in the signal. A signal x(n) consists of a pulsed sinusoid corrupted by a stationary zero-mean white noise sequence. That is, 10),()()(0-≤≤+-=N n n w n n y n x ,where )(n w is the noise with variance 2w σ and the signal is⎩⎨⎧-≤≤=otherwise M n n A n y ,010,cos )(0ω. The frequency 0ω is known, but the delay 0n , which is a positiveinteger, is unknown, and is to be determined by cross-correlating x(n) with y(n). Assume that 0n M N +>. Let∑-=-=10)()()(N n xy n x m n y m rdenote the cross-correlation sequence between x(n) and y(n). In the absence of noise, this function exhibits a peak at delay 0n m =. Thus,0n is determined with no error. The presence of noise can lead toerrors in determining the unknown delay.(a) For 0n m =, determine ()[]0n r E xy . Also, determine thevariance ()[]0var n r xy , due to the presence of the noise. In bothcalculations, assume that the double-frequency term averages to zero. That is, 0/2ωπ>>M .(b) Determine the signal-to-noise ratio, defined as []{}[])(var )(020n r n r E SNR xy xy = (c) What is the effect of the pulse duration M on the SNR?。