多巴胺在脑中分布演示教学
- 格式:doc
- 大小:126.00 KB
- 文档页数:13


多巴胺在脑中分布MCM90问题一 A.药物在脑中的分布研究脑功能失调的人员要测试新的药物的效果,例如治疗帕金森症往脑部 注射多巴胺(dopamine )的效果。
为此,为了精确估计药物影响的脑部区域, 他们必须顾及注射后药物在脑内分布区域的大小和形状。
研究数据包括50各圆柱体组织样本的每个样本的药物含量的测定值(见附 表和附图),每个圆柱体样本的长为 0.76毫米,直径为0.66毫米,这些互相平 行的圆柱体样本的中心位于网格距为 1毫米*0.76毫米*1毫米的格点上,所以圆 柱体互相间的底面上接触,侧面互不接触(见附图所示)。
注射是在最高计数 的那个圆柱体的中心附近进行的。
自然在圆柱体之间以及由圆柱体样本覆盖的 区域外也有药物。
试估计受到药物影响的区域中药物的分布后方垂直截面 前方垂直截面164 442 1320 414 188480 7022 14411 5158 3522091 23027 28353 13138 681789 21260 20921 11731 727213 1303 3765 1715 453163 324 432 243 166 712 4055 6098 1048 232 2137 15531 19742 4785 330 444 11431 14960 3182 301 294 2061 1036 258 188一个单元表示一个闪烁微粒的计数,或多巴胺的 4.753*10-13克分子量,例如,附表指出位于后排当中的那个圆柱体的含药量是28353个单元。
本题是由华盛顿州东华盛顿大学数学系的Yves Nievergelt提供的。
他还写了一篇评论文章Yves Nievergelt,The Outstanding Brain Drug Papers,The UMAP Journal,v.11(1990), no.3,227-229.脑中多巴胺的分布一、结果概述为预测脑中多巴胺含量的分布我们构造了一个三维的非稳定态质量输运模型。
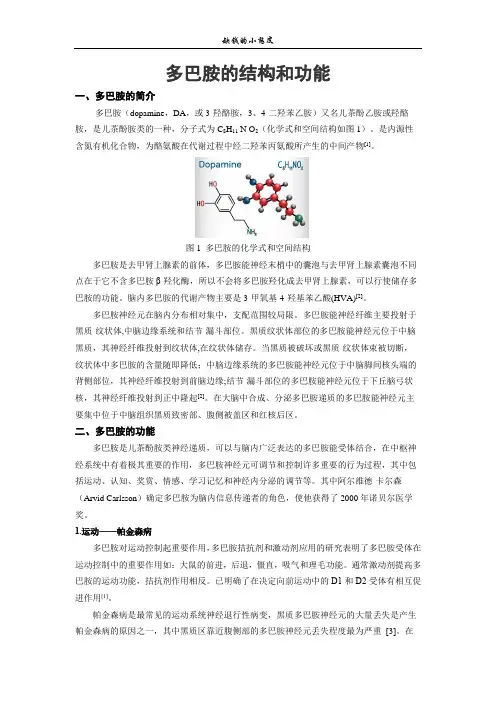
多巴胺的结构和功能一、多巴胺的简介多巴胺(dopamine,DA,或3-羟酪胺,3、4-二羟苯乙胺)又名儿茶酚乙胺或羟酪胺,是儿茶酚胺类的一种,分子式为C8H11 N O2(化学式和空间结构如图1)。
是内源性含氮有机化合物,为酪氨酸在代谢过程中经二羟苯丙氨酸所产生的中间产物[1]。
图1 多巴胺的化学式和空间结构多巴胺是去甲肾上腺素的前体,多巴胺能神经末梢中的囊泡与去甲肾上腺素囊泡不同点在于它不含多巴胺β-羟化酶,所以不会将多巴胺羟化成去甲肾上腺素,可以行使储存多巴胺的功能。
脑内多巴胺的代谢产物主要是3-甲氧基-4-羟基苯乙酸(HVA)[2]。
多巴胺神经元在脑内分布相对集中,支配范围较局限。
多巴胺能神经纤维主要投射于黑质-纹状体,中脑边缘系统和结节-漏斗部位。
黑质纹状体部位的多巴胺能神经元位于中脑黑质,其神经纤维投射到纹状体,在纹状体储存。
当黑质被破坏或黑质-纹状体束被切断,纹状体中多巴胺的含量随即降低;中脑边缘系统的多巴胺能神经元位于中脑脚间核头端的背侧部位,其神经纤维投射到前脑边缘;结节-漏斗部位的多巴胺能神经元位于下丘脑弓状核,其神经纤维投射到正中隆起[2]。
在大脑中合成、分泌多巴胺递质的多巴胺能神经元主要集中位于中脑组织黑质致密部、腹侧被盖区和红核后区。
二、多巴胺的功能多巴胺是儿茶酚胺类神经递质,可以与脑内广泛表达的多巴胺能受体结合,在中枢神经系统中有着极其重要的作用,多巴胺神经元可调节和控制许多重要的行为过程,其中包括运动、认知、奖赏、情感、学习记忆和神经内分泌的调节等。
其中阿尔维德·卡尔森(Arvid Carlsson)确定多巴胺为脑内信息传递者的角色,使他获得了2000年诺贝尔医学奖。
1.运动——帕金森病多巴胺对运动控制起重要作用,多巴胺拮抗剂和激动剂应用的研究表明了多巴胺受体在运动控制中的重要作用如:大鼠的前进,后退,僵直,吸气和理毛功能。
通常激动剂提高多巴胺的运动功能,拮抗剂作用相反。
American Journal of Medical Genetics(Neuropsychiatric Genetics)105:145±151(2001)Evidence for Linkage Disequilibrium Between the Dopamine Transporter and Bipolar DisorderTiffany A.Greenwood,1Meghan Alexander,1Paul E.Keck,2Susan McElroy,2A.Dessa Sadovnick,3 Ronald A.Remick,4and John R.Kelsoe1*1Departments of Psychiatry,University of California,San Diego and San Diego VA Medical Center,San Diego,California2Department of Psychiatry,University of Cincinnati,Cincinnati,Ohio3Department of Medical Genetics,University of British Columbia,Vancouver,Canada4Department of Psychiatry,St.Paul's Hospital,Vancouver,CanadaA role for the dopamine transporter(DAT) in bipolar disorder is implicated by several lines of pharmacological evidence,as well as suggestive evidence of linkage at this locus, which we have reported previously.In an attempt to identify functional mutations within DAT contributing a susceptibility to bipolar disorder,we have screened the entire coding region,as well as signi®cant portions of the adjacent non-coding sequence.Though we have not found a de®nitive functional mutation,we have identi®ed a number of single nucleotide polymorphisms(SNPs)that span the gene from the distal promoter through exon15. Of the39SNPs that are suitable for linkage disequilibrium(LD)studies,14have been analyzed by allele-speci®c PCR in a sample of50parent-proband triads with bipolar disorder.A haplotyped marker comprised of ®ve SNPs,spanning the region between exon9and exon15,was constructed for each individual,and transmission/disequi-librium test(TDT)analysis revealed this haplotype to be in linkage disequilibrium with bipolar disorder(allele-wise TDT p 0.001,genotype-wise TDT p 0.0004).These data replicate our previous®nding of linkage to markers within and near DAT in a largely different family set,and provide further evidence for a role of DAT in bipolar disorder.Published2001Wiley-Liss,Inc.yKEY WORDS:dopamine transporter;bipo-lar disorder;single nucleo-tide polymorphism;linkagedisequilibrium;transmis-sion/disequilibrium testINTRODUCTIONThe dopamine transporter(DAT)has been implicated as a candidate gene in several disorders,including bipolar disorder and attention-de®cit hyperactivity disorder(ADHD)[Kelsoe et al.,1996;Cook et al., 1995;Waldman et al.,1998].DAT plays a critical role in the regulation of dopaminergic transmission by mediating the active reuptake of dopamine from the synapse into the presynaptic terminal[Giros and Caron,1993].Several lines of pharmacological evidence suggest a possible role for dopamine in bipolar disorder, particularly in mania.Cocaine and amphetamine have been shown to increase synaptic dopamine concentra-tions by acting at DAT to inhibit dopamine reuptake [Giros et al.,1992].The acute effects of such psychos-timulants closely resemble mania,and chronic ad-ministration can provoke a manic episode in bipolar patients and trigger psychosis in nonbipolar patients [Angrist,1994].In addition,L-dihydroxyphenylalanine (L-DOPA),which also increases synaptic dopamine,has been observed to precipitate mania,and antipsychotic drugs,which block dopamine receptors,are an effective treatment for mania[Murphy et al.,1971;Goodwin and Jameson,1990].Finally,the antidepressant bupropion acts at least in part at DAT and has been reported to be of particular ef®cacy in bipolar depression[Sachs et al., 1994].Grant sponsor:Novartis Pharma AG;Grant sponsor:Depart-ment of Veterans Affairs and NIMH;Grant numbers:MH47612, MH59567;Grant sponsor:UCSD Mental Health Clinical Research Center;Grant number:MH30914;Grant sponsor: UCSD General Clinical Research Center;Grant number:M01 RR00827;Grant sponsor:UCSD Biomedical Sciences and Genet-ics graduate programs;Grant numbers:5T32CA67754,1T32GM08666.*Correspondence to:John R.Kelsoe,Department of Psychiatry, 0603,UCSD,La Jolla,CA92093.E-mail:jkelsoe@ Received5May2000;Accepted12October2000Published online13February2001Published2001Wiley-Liss,Inc.y This article is a US Government work and,as such,is in the public domain in the United States of America.We have reported previously on suggestive evidence of linkage between the DAT locus on chromosome 5p15.3and bipolar disorder using several markers within and near the DAT gene[Kelsoe et al.,1996]. Although statistically signi®cant results of3.0were not attained,the data suggested that DAT may play a causal role in a minority of families with bipolar disorder and justify further examination of the DAT gene.Our current efforts have thus focused on the identi®cation of possible functional mutations within the DAT gene in coding and regulatory sequence.In the process of screening the introns and exons of DAT for possible mutations,we have identi®ed a number of single nucleotide polymorphisms(SNPs)that span the gene from the distal promoter through exon15. Although of no obvious functional signi®cance,many of these SNPs are appropriate for linkage disequili-brium(LD)studies of bipolar disorder.We have therefore focused on the evaluation of LD,through transmission/disequilibrium test(TDT)analyses, between the DAT gene and bipolar disorder,as well as the detection of a possible shared haplotype among bipolar patients.MATERIALS AND METHODSSubjectsThe genomic DNA from three individuals was used in screening DAT for functional mutations:a control subject with no history of psychiatric illness,the bipolar I proband(GM5927)of Old Order Amish pedigree110, and a member of Family16(0244)from the UCSD family collection with schizoaffective disorder,bipolar type.These two affected subjects were chosen because suggestive evidence of linkage between DAT and bipolar disorder was found previously in these two families[Kelsoe et al.,1996].All three subjects chosen for sequencing studies were caucasians of European ancestry.A sample of50families,each consisting of either one or two children with bipolar disorder(bipolar I or bipolar II)and both parents,was chosen from the UCSD/UBC/UC family collection and Old Order Amish pedigree110for association studies with the14SNPs. Each of these triad or sib pair families was a subset of a more extended family that was ascertained for linkage studies.The family sample for this study exhibits some degree of overlap with the sample previously reported for our linkage study of the dopamine transporter,as10 of the50triad or sib pair families included in this sample derived from10of the original20families from our previous linkage study[Kelsoe et al.,1996].The UCSD/UBC/UC families were ascertained as part of a multi-site linkage study,which included collaborative sites at the University of California at San Diego,the University of British Columbia,and the University of Cincinnati.Families for this linkage study were selected for the availability of at least one member with bipolar disorder(I or II)and two other family members who were affected under a broad model (bipolar I,bipolar II,schizoaffective,bipolar type,or recurrent major depression).All subjects provided informed consent per local IRB approved procedures prior to participation.Blood was obtained from all subjects for the immortalization of lymphoblastoid cell lines,and DNA was prepared by phenol/chloroform extraction from cultured cells.DiagnosisEach family member was interviewed directly using the Structured Clinical Interview for DSM-III-R(SCID) [Spitzer et al.,1987].However,the Schedule of Af-fective Disorders and Schizophrenia(SADS-L)was used to interview one family(Family16)[Endicott and Spitzer,1978].Information from the interview, medical records,and at least one other family infor-mant was reviewed by a committee of clinicians in order to make consensus,best-estimate diagnoses.All inter-viewers underwent the same extensive training,and diagnostic reliability,which was tested biannually by review of videotaped interviews,was consistently high.Mutation ScreeningDAT sequence for use as a reference was compiled from several sources(GenBank accession numbers U12320±U12327,U17990±U17992,U92262, D88556±D88570)[Vandenbergh et al.,1992;Donovan et al.,1995;Kouzmenko et al.,1997;Kawarai et al., 1997].Primer sequences for the promoter,intron1,and exon15were obtained from published sequence,and these regions were ampli®ed in overlapping segments of approximately500bp each.Exons were ampli®ed with up to500bp of¯anking intronic sequence on either side.Primer sequences for the screening of exons 1,3,9,11,and12and¯anking intronic regions could be obtained from published sequence.A BAC containing DAT(BACH-278o18)was obtained from Genome Systems(St.Louis,MO)to generate sequence for the screening of exons2,4,5,6,7,8,10,13,and14in this manner.Following ampli®cation,PCR products were puri®ed and served as templates for dye-termination cycle-sequencing reactions to prepare¯uorescent-labeled products for analysis on an Applied Biosystems 377automated sequencer.Resultant sequences were aligned and manually screened for mutations.Allele Detection and Haplotype Determination Genotyping of the triads for the14SNPs was accomplished by allele-speci®c PCR(AS-PCR),in which primers were designed to speci®cally amplify either the baseline allele or its alternative in separate PCR reactions.The speci®c primers and reaction conditions for each SNP or pair of SNPs are listed in Table I.When possible,SNPs were combined in double-ended AS-PCR reactions to generate haplotyped markers.This was the case for the following SNPs:I1 1036/I1 1736, I1 1860/I1 1861/I2 28,and E9 59/I9 102.The reactions were assembled as follows:170ng of genomic DNA,0.2m M of each primer,200m M dNTPs,4%DMSO, 1.5mM or2.5mM MgCl2,GeneAmp10X PCR Gold Buffer (Perkin-Elmer Applied Biosystems,Foster City,CA),and 1.0unit of AmpliTaq Gold(Perkin-Elmer Applied Biosys-146Greenwood et al.tems)in a total volume of30m l.Thermocycling was performed using a PTC-200thermocycler from MJ Research,Waltham,MA and a modi®ed touchdown protocol with an initial denaturation at948C for10min to activate the AmpliTaq Gold,denaturation at948C for 30sec,primer annealing for30sec(temperatures speci®ed for each primer pair),and primer extension at 728C for1min30sec[Don et al.,1991].The annealing temperature was decreased by0.58C per cycle for a total of20cycles,with15or20additional cycles at the®nal annealing temperature.Ampli®ed products were then analyzed by agarose gel electrophoresis and ethidium bromide staining.Following genotyping,complete haplotypes com-prised of all14SNPs were constructed for each individual using family relationships.These haplotypes could be conclusively determined for47of the50 families.In three of the families,however,phase could not be unequivocally inferred for one SNP(I6 96). Therefore,haplotypes were determined for the remain-ing13SNPs,and the linkage phase of the I6 96SNP was estimated based on the haplotype frequencies observed in the47families in which linkage phase could be unequivocally determined.In addition to the SNP markers,the triads were genotyped for the40bp VNTR in the30untranslated region of exon15[Vandenbergh et al.,1992].Ampli®ca-tion of this repeat was accomplished using the same protocol as previously described with the following speci®cations:2.5mM®nal MgCl2concentration,pri-mers50-TGTGGTGTAGGGAACGGCCTGAG-30(for-ward)and50-CTTCCTGGAGGTCACGGCTCAAGG-30(reverse),and a touchdown from75to658C.Products were then run on a2%agarose gel at70V for three hr to ensure proper allele separation.Linkage Disequilibrium AnalysesThe transmission/disequilibrium test strategy was chosen for LD studies because of its robustness against artifacts induced by population strati®cation[Spielman et al.,1993;Spielman and Ewens,1996].The standard TDT considers one allele versus all other alleles at a particular marker and tests for an excess of transmis-sion to affected offspring,generating a composite w2 statistic and corresponding p value based on the total number of alleles.However,this approach may not detect association if more than one allele is transmitted in excess for a given marker.Therefore,we chose to use an extended version of the transmission/disequilibrium test(ETDT)for multi-allele marker loci,which provides for the analysis of parent-offspring data under two different models,allele-wise and genotype-wise[Sham and Curtis,1995a].The allele-wise model attempts to establish a pattern of preferential transmission of certain alleles across all parental genotypes,testing the hypothesis that different alleles may vary in the extent to which they are preferentially transmitted to affected offspring.The genotype-wise model considers every heterozygous parental genotype separately and tests each allele of a particular genotype for an excess of transmission.The empirical signi®cance of the TDT statistics were evaluated using the Monte Carlo approach(MCETDT)and1,000±10,000replicates [Sham and Curtis,1995b].RESULTSMutation ScreeningIn the process of screening DAT for functional mutations,the entire coding sequence and the imme-diately adjacent non-coding sequence,including both50 and30UTRs,9.5kb of¯anking intronic sequence,and 2.5kb of promoter sequence was screened.Intron1was screened in its entirety due to the presence of negative regulatory elements within this region[Kouzmenko et al.,1997].Complete sequence for introns2,5,7,and9, as well as substantial sequence for introns6,11,12,and 13,was obtained in the process of generating¯anking sequence for the screening of the relevant exons (GenBank accession numbers AF306558through AF306564).This mutation screen led to the identi®cation of92 deviations from the reference sequence,which include 17insertions,eight deletions,and67base substitu-tions.The one coding sequence variant identi®ed,an A to G substitution in exon9,was found to be synon-ymous,consistent with previous studies of ADHD [Vandenbergh et al.,2000].Although no variants of obvious signi®cance to transcriptional or splicing regulation were found,39of the SNPs were poly-morphic among the three genomic samples sequenced and are thus suitable for linkage disequilibrium studies.Linkage Disequilibrium and AssociationStudiesSince none of the SNPs were of obvious signi®cance to the function of DAT,those for analysis were chosen on the basis of location and feasibility of unequivocal allele detection by AS-PCR.The14SNPs thus chosen for a further examination of LD span the gene from the distal promoter through exon15.The speci®c positions of these SNPs within the DAT gene,as well as their observed frequencies and heterozygosities among the parental genotypes,are indicated in Table II.The use of double-ended AS-PCR to generate haplo-typed markers where possible resulted in10markers for the initial analysis:three multi-allelic,PCR-haplo-typed markers consisting of two or three SNPs and seven bi-allelic,single-SNP markers.The results of the ETDT analyses of the10markers are shown in Table III.No evidence for association between bipolar disorder and any of these SNPs was found under the allele-wise model.Under the genotype-wise model,only the PCR-haplotyped marker,ME9I9,was shown to be in linkage disequilibrium with bipolar disorder,with an empirical p value of0.044.A slight trend toward LD was seen for the40bp VNTR in exon15(E15VNTR), although statistically signi®cant results were not obtained.Following these initial analyses,family relationships were used to construct haplotypes comprised of all14148Greenwood et al.SNPs.Pairwise LD analyses revealed the presence of almost complete disequilibrium (p `0.00001)between the seven SNPs in the 50region of DAT (promoter through intron 6),as well as a high degree of LD between the seven SNPs in the 30region (exon 9through exon 15).Strikingly,there was a complete lack of LD between these two regions,indicating a complex structure that is likely the result of both mutation and recombination (data to be published in detail sepa-rately).This segmental pattern of LD was used to construct a limited number of haplotyped markers within the 50and 30regions separately.Haplo1includes all seven SNPs from the 50region of DAT (P 214through I6 96),whereas Haplo2is comprised of six SNPs from the 30region (intron 9through exon 15).Since the PCR-haplotyped marker ME9I9produced marginally signi®cant results,Haplo2was separated into two smaller haplotyped markers in an attempt to further re®ne the area of interest within the 30region.The resultant haplotyped markers,Haplo3and Haplo4,were comprised of SNPs from the intron 9-intron 10region and exon 15,respectively.As the 30region displayed a great deal more diversity than the 50region,with some pairs of SNPs in almost complete LD,and others exhibiting only marginal LD,a ®nal haplotyped marker,HaploLD,was constructed from the ®ve SNPs in the 30region that displayed the greatest degree of LD to each other.Haplo1,which consists solely of SNPs from the 50region,was not found to be in linkage disequilibrium with bipolar disorder.However,all of the haplotyped markers comprised of SNPs from the 30region of DAT were found to be in LD with bipolar disorder under the genotype-wise model.HaploLD was most striking of all,with a highly signi®cant empirical p value of 0.0004(w 2 40.5)under the genotype-wise model,as well as a signi®cant empirical p value of 0.001(w 2 26.4)under the allele-wise model.These p values remain signi®cant even when corrected for multiple comparisons based on the number of TDT tests conducted using the con-servative Bonferroni method,p 0.006and 0.016,respectively.TABLE II.Selection of SNPs Observed in DATSNP LocationVariant Heterozygosity aRelative frequency bP 214231bp 50of exon 1A !G 0.5370.572I1 10361036bp 30of exon 1C !A 0.5090.587I1 17361736bp 30of exon 1G !A 0.5090.582I1 18601860bp 30of exon 1A !G 0.5190.577I1 18611861bp 30of exon 1G !A 0.5190.577I2 4848bp 30of exon 2G !A 0.3430.721I6 9696bp 30of exon 6G !C 0.5280.582E9 5959bp within exon 9A !G 0.4070.736I9 102102bp 30of exon 9G !T 0.3890.269I9-2121bp 50of exon 10G !A 0.3150.817I10 117117bp 30of exon 10G !A 0.1200.933E15 274274bp within exon 15G !C 0.2870.798E15 352352bp within exon 15G !A 0.2780.803E15 18121812bp within exon 15T !C0.3240.788a Heterozygosity among parental genotypes.bRelative frequency among parental genotypes of baseline allele as determined from reference sequence.TABLE III.TDT Analyses*Marker SNP positionsAllele-wise Empirical Genotype-wiseEmpirical MP214P 2140.2090.2670.2090.267MI1I1 1036and I1 17360.6860.7450.6860.745MI1I2I1 1860,I1 1861,and I2 480.4030.4720.2460.355MI6I6 960.910 1.0000.910 1.000ME9I9E9 59and I9 1020.3210.3240.0230.044MI9I9-210.881 1.0000.881 1.000MI10I10 1170.3700.4750.3700.475M274E15 2740.7630.8920.7630.777M352E15 3520.0680.0940.0680.070E15VNTR 0.1610.1280.1590.164M1812E15 18120.2060.2710.2060.271Haplo1P 214,I1 1036,I1 1736,I1 1860-1,I12 48,I6 960.2900.4550.0950.309Haplo2I9 102,I9-21,I10 117,E15 274,E15 352,E15 1812-nan 0.0000.0060.023Haplo3I9 102,I9-21,I10 1170.0730.1080.0100.024Haplo4E15 274,E15 352,E15 18120.0940.0900.0310.036HaploLDE9 59,I9 102,I9-21,E15 274,E15 18120.00090.0010.00020.0004a*Allele-wise and genotype-wise p values generated by the ETDT program.Empirical p values generated as an evaluation of ETDT statistics using the Monte Carlo approach.No corrections were made for multiple comparisons.a10,000replications were used to generate a p value,rather than the usual 1,000.Nominally,signi®cant p values are indicated in bold.The Dopamine Transporter and Bipolar Disorder149DISCUSSIONThe TDT results presented here are consistent with the®ndings of suggestive evidence of linkage and linkage disequilibrium to the30end of DAT that we have reported previously[Kelsoe et al.,1996].It is noteworthy that some of the strongest evidence of linkage in our previous study came from markers in the 30end of DAT.Our previous results consistent with linkage of bipolar disorder to the highly polymorphic VNTR within intron8of DAT are replicated by the current®ndings of signi®cant linkage disequilibrium for all haplotyped markers containing SNPs from the exon9-intron9region,which is in close proximity to the intron8VNTR.Although our previously reported analysis of the VNTR within exon15also gave results consistent with linkage and linkage disequilibrium to bipolar disorder,the current ETDT analysis of this VNTR failed to reach statistical signi®cance.However, analysis of a haplotyped marker consisting of3SNPs within exon15(Haplo4)yielded modest evidence of linkage disequilibrium(p 0.036).These SNPs not only ¯ank the VNTR but are in complete linkage disequili-brium with it according to pairwise LD analyses. Furthermore,the10repeat allele,which previously has been reported to be associated with ADHD, segregates with the30haplotypes that were found to be associated with illness in this study.It is therefore possible that the failure of this marker to reach statistical signi®cance is due to the small sample size and resulting low statistical power.These results for the40bp VNTR are thus consistent with those that we and others have reported previously.Our current results must be quali®ed as not being entirely independent of our original study,as10of the families in the current sample of50originated from10 of the original20families reported previously.How-ever,our current results derive from a largely different clinical sample and a different set of markers was used for analysis.It is also noteworthy that HaploLD remained signi®cant under the genotype-wise model with a p value of0.001when these10original families were removed from the current sample,generating a sample entirely independent of that in our previous study(data not shown).There are a great many ways one could conceivably construct haplotypes based on two or more of the14 SNPs.For example,one could use a sliding window method,in which individual SNPs are progressively combined into haplotypes spanning the entire gene to assess the incremental bene®t of adding each SNP to the haplotype.However,our pairwise LD data,which will be published in detail separately,indicated nearly complete LD between SNPs in the50region of DAT and a very high degree of LD between SNPs in the30region. Since the lack of LD between these two regions of DAT may be an indication that recombination has effectively unlinked them,we opted not to use a sliding window method,in which the haplotypes would ultimately span the gap between these two regions.Although the use of separate haplotyped markers for the50and30region has allowed us to narrow down the area of interest to the30region of DAT,we were unsuccessful at more pre-cisely de®ning the region possibly containing a func-tional polymorphism.Thus,more sequencing of this region is required to identify the functional elements within this gene that may be etiologically relevant. DAT has been implicated in other disorders,such as ADHD,psychosis in cocaine abusers,and alcoholism [Cook et al.,1995;Waldman et al.,1998;Gelernter et al.,1994;Muramatsu and Higuchi,1995].It is striking that the30end of the gene is implicated in each of these other disorders.The studies of ADHD are particularly intriguing in light of family epidemiological data that suggest a possible genetic relationship between ADHD and bipolar disorder[Bierderman et al.,1991a,b]. Furthermore,a recent study revealed an association between DAT protein availability and genotype of the VNTR in exon15[Heinz et al.,2000].Together these data raise the possibility that a functional mutation within the30region of the DAT gene may play a role in several behavioral syndromes.The use of high density SNP maps and haplotypes in LD studies has been the focus of much recent attention. These results illustrate several points regarding these methods.First,haplotypes are much more informa-tive than individual SNPs and,therefore,have much greater power to detect LD.SNPs may also be superior markers for the detection of LD because of their lower mutation rate as compared to microsatellites.However, LD relationships between SNPs may be quite complex, and their power for disease mapping may only be fully maximized when these relationships are taken into account.In summary,the data presented here provide evidence for an association between DAT and bipolar disorder.They also implicate the30end of DAT,exon9 through exon15,as the region of interest and are thereby consistent with previous studies of the30 VNTR.These data suggest the presence of a functional variant of a30non-coding sequence element that is involved in the susceptibility to bipolar disorder.Thus, further investigation of this region is needed to de®ne any regulatory elements that may be present,and to evaluate their relevance with regards to bipolar disorder.ACKNOWLEDGMENTSWe thank the family members who participated in this study,without whom it would not have been possible.This work was supported by grants to J.R.K. from the Department of Veterans Affairs and the NIMH(MH47612,MH59567).Support was also pro-vided by the UCSD Mental Health Clinical Research Center(MH30914)and the UCSD General Clinical Research Center(M01RR00827).T.A.G.was supported by training grants to the UCSD Biomedical Sciences and Genetics graduate programs(5T32CA67754, 1T32GM08666).REFERENCESAngrist B.1994.Clinical variations of amphetamine psychosis.In:Cho AK, Segal DS,editors.Amphetamine and its analogs.San Diego:Academic Press.p387±414.150Greenwood et al.Bierderman J,Faraone SV,Keenan IK,Tsuang MT.1991a.Evidence of familial association between attention de®cit disorder and major affective disorders.Arch Gen Psychiatry48:633±642.Bierderman J,Newcorn J,Sprich orbidity of attention de®cit hyperactivity disorder with conduct,depressive,anxiety,and other disorders.Am J Psychiatry148:564±577.Cook EH,Stein MA,Krasowski MD,Cox NJ,Olkon DM,Kieffer JE, Leventhal BL.1995.Association of attention-de®cit disorder and the dopamine transporter gene.Am Hum Genet56:993±998.Don RH,Cox PT,Wainwright BJ,Baker K,Matick JS.1991.``Touchdown'' PCR to circumvent spurious priming during gene ampli®cation.Nucleic Acids Res19:4008.Donovan DM,Vandenbergh DJ,Perry MP,Bird GS,Ingersoll R, Nanthakumar E,Uhl GR.1995.Human and mouse dopamine transporter genes:conservation of50-¯anking sequence elements and gene structures.Mol Brain Res30:327±335.Endicott J,Spitzer R.1978.A diagnostic interview:the schedule for affective disorders and schizophrenia.Arch Gen Psychiatry35:837±844.Gelernter J,Kranzler HR,Satel SL,Rao PA.1994.Genetic association between dopamine transporter protein alleles and cocaine-induced paranoia.Neuropsychopharmacology11:195±200.Giros B,el Mestikawy S,Godinot N,Zheng K,Han H,Yang-Feng T,Caron MG.1992.Cloning,pharmacological characterization,and chromosome assignment of the human dopamine transporter.Mol Pharmacol 42:383±390.Giros B,Caron MG.1993.Molecular characterization of the dopamine transporter.Trends in Pharmacol Sci14:43±49.Goodwin FK,Jameson KR.1990.Manic-depressive illness.New York: Oxford University Press.p614±615.Heinz A,Goldman D,Jones DW,Palmour R,Hommer D,Gorey JG,Lee KS, Linnoila M,Weinberger DR.2000.Genotype in¯uences in vivo dopamine transporter availability in human striatum.Neuropsycho-pharmacology22:133±139.Kawarai T,Kawakami H,Yamamura Y,Nakamura S.1997.Structure and organization of the gene encoding human dopamine transporter.Gene 195:11±18.Kelsoe JR,Sadovnick AD,Kristbjarnarson H,Bergesch P,Mroczkowski-Parker Z,Drennan M,Rapaport MH,Flodman P,Spence MA,Remick RA.1996.Possible locus for bipolar disorder near the dopaminetransporter on chromosome5.Am J Med Genet(Neuropsychopharma-cology)67:533±540.Kouzmenko AP,Pereira A,Singh BS.1997.Intronic sequences are involved in neural targeting of human dopamine transporter gene expression.Biochem and Biophys Res Comm240:807±811.Muramatsu T,Higuchi S.1995.Dopamine transporter gene polymorphism and alcoholism.Biochem Biophys Res Commun211:28±32.Murphy DL,Brodie HK,Goodwin FK,Bunney WE.1971.Regular induction of hypomania by L-DOPA in``bipolar''manic-depressive patients.Nature229:135±136.Sachs GS,Lafer B,Stoll AL,Banov M,Thibault AB,Tohen M,Rosenbaum JF.1994.A double-blind trial of bupropion versus desipramine for bipolar depression.J Clin Psychiatry55:391±393.Sham PC,Curtis D.1995a.An extended transmission/disequilibrium test (TDT)for multi-allele marker loci.Am J Hum Genet59:323±336. Sham PC,Curtis D.1995b.Monte Carlo tests for association between disease and alleles at highly polymorphic loci.Ann Hum Genet59:97±105. Spielman RS,McGinnis RE,Ewens WJ.1993.Transmission test for linkage disequilibrium:the insulin gene region and insulin-dependent diabetes mellitus(IDDMM).Am J Hum Genet52:506±516. Spielman RS,Ewens WJ.1996.The TDT and other family-based tests for linkage disequilibrium and association.Am J Hum Genet59:983±989. Spitzer RL,Williams JSW,Gibbon M.1987.Structured clinical interview for DSM-III-R(SCID).New York:New York State Psychiatric Institute, Biometrics Research.Vandenbergh DJ,Persico AM,Uhl GR.1992.A human dopamine transporter cDNA predicts reduced glycosylation,displays a novel repetitive element and provides racially-dimorphic TaqI RFLPs.Mol Brain Res15:161±166.Vandenbergh DJ,Thompson M,Cook EH,Bendahou E,Nguyen T, Krasowski MD,Comings D,Sellers E,Tyndale R,George SR,O'Dowd BF,Uhl GR.2000.Human dopamine transporter gene:coding region conservation among normal,Tourette's disorder,alcohol dependence, and attention-de®cit hyperactivity disorder populations.Mol Psychia-try5:283±292.Waldman ID,Rowe DC,Abramowitz A,Kozel ST,Mohr JH,Sherman SL, Cleveland HH,Sanders ML,Gard JMC,Stever C.1998.Association and linkage of the dopamine transporter gene and attention-de®cit hyperactivity disorder in children:heterogeneity owing to diagnostic subtype and severity.Am J Hum Genet63:1767±1776.The Dopamine Transporter and Bipolar Disorder151。
多巴胺的结构和功能一、多巴胺的简介多巴胺(dopamine,DA,或3-羟酪胺,3、4-二羟苯乙胺)又名儿茶酚乙胺或羟酪胺,是儿茶酚胺类的一种,分子式为C8H11 N O2(化学式和空间结构如图1)。
是内源性含氮有机化合物,为酪氨酸在代谢过程中经二羟苯丙氨酸所产生的中间产物[1]。
图1 多巴胺的化学式和空间结构多巴胺是去甲肾上腺素的前体,多巴胺能神经末梢中的囊泡与去甲肾上腺素囊泡不同点在于它不含多巴胺β-羟化酶,所以不会将多巴胺羟化成去甲肾上腺素,可以行使储存多巴胺的功能。
脑内多巴胺的代谢产物主要是3-甲氧基-4-羟基苯乙酸(HVA)[2]。
多巴胺神经元在脑内分布相对集中,支配范围较局限。
多巴胺能神经纤维主要投射于黑质-纹状体,中脑边缘系统和结节-漏斗部位。
黑质纹状体部位的多巴胺能神经元位于中脑黑质,其神经纤维投射到纹状体,在纹状体储存。
当黑质被破坏或黑质-纹状体束被切断,纹状体中多巴胺的含量随即降低;中脑边缘系统的多巴胺能神经元位于中脑脚间核头端的背侧部位,其神经纤维投射到前脑边缘;结节-漏斗部位的多巴胺能神经元位于下丘脑弓状核,其神经纤维投射到正中隆起[2]。
在大脑中合成、分泌多巴胺递质的多巴胺能神经元主要集中位于中脑组织黑质致密部、腹侧被盖区和红核后区。
二、多巴胺的功能多巴胺是儿茶酚胺类神经递质,可以与脑内广泛表达的多巴胺能受体结合,在中枢神经系统中有着极其重要的作用,多巴胺神经元可调节和控制许多重要的行为过程,其中包括运动、认知、奖赏、情感、学习记忆和神经内分泌的调节等。
其中阿尔维德·卡尔森(Arvid Carlsson)确定多巴胺为脑内信息传递者的角色,使他获得了2000年诺贝尔医学奖。
1.运动——帕金森病多巴胺对运动控制起重要作用,多巴胺拮抗剂和激动剂应用的研究表明了多巴胺受体在运动控制中的重要作用如:大鼠的前进,后退,僵直,吸气和理毛功能。
通常激动剂提高多巴胺的运动功能,拮抗剂作用相反。


多巴胺多巴胺(dopamine, DA)是神经系统中另一类重要的儿茶酚胺类神经递质,其含量至少占整个中枢神经系统儿茶酚胺含量的50%。
多巴胺一度被认为仅是去甲肾上腺素生物合成过程中的中间产物。
1958年,瑞典药理学家Carlson首先报道纹状体内多巴胺含量极高,约占全脑多巴胺含量的70%,且和去甲肾上腺素的分布并不一致。
这使人们提出设想,多巴胺可能是脑内独立存在的神经递质。
60年代,人们证实帕金森病是黑质致密区多巴胺能神经元变性所致,用多巴胺的前体左旋多巴(L-DOPA)可获较好疗效,这对多巴胺的研究起了极大的推动作用。
70年代中,应用放射受体结合分析方法证实体内存在着多巴胺受体,某些化合物能与其结合而产生生理效应。
进入80年代后,大量实验深入分析了DA受体的亚型及其与多种生理功能和疾病的关系。
80年代末至90年代初,随着分子生物学技术的发展,DA受体的不同类型得以克隆,其结构也被阐明。
第一节 多巴胺能神经元的分布及纤维联系一、多巴胺能神经元的主要分布采用荧光组织化学、免疫细胞和组织化学方法可以显示出多巴胺能神经元在中枢神经系统中的分布。
Falck-Hillarp(1962)发现,神经元内的单胺类物质可与甲醛蒸汽反应,聚合成为异喹啉(isoquinoline)类化合物,该化合物在荧光显微镜下可发射出波长不同的荧光,神经元内的儿茶酚胺可转变成绿色荧光物,5-羟色胺可转变成黄色荧光物。
运用这一方法,中枢多巴胺能神经元的胞体分布被成功定位。
到目前为止,已知脑内有10个多巴胺细胞群,继去甲肾上腺素的A1 ~ A7细胞群之后,被命名为A8 ~ A17,其中A8 ~ A10细胞群分布于中脑,A11 ~ A14细胞群在丘脑,A15、A16位于端脑,A17在视网膜内(表1)。
A8 ~ A10细胞群集中了约70%的DA能神经元。
表1 脑内多巴胺能神经元胞体的定位A8 位于红核后方的网状结构内,内侧丘系外侧部的背侧A9 位于中脑大脑脚的背内侧黑质复合体,大部分位于致密部,少部分位于网状部A10 位于脚间核的背侧和腹侧被盖区。


多巴胺能神经元
多巴胺是⼀种脑内分泌的化学递质与⼈的情欲、感觉有关,它传递兴奋及开⼼的信息。
另外,多巴胺也与各种上瘾⾏为有关。
对于我们要了解多巴胺能神经元通路,了解作⽤,以及受体分布。
其实多巴胺能神经元是脑⼲的上端中脑多巴胺能神经元产⽣的神经递质。
这种物质在⾏程过程中有四个⽅向,如新纹状态,边缘系统,前额叶⽪质和下丘脑。
这张图很明显的看出多巴胺产⽣于⿊质和腹侧被盖区
这张图可见四个通路的起始位置,以及功能
具体代表结构和功能
·1、中脑边缘通路
·本通路多巴胺增多与精神分裂症的阳性症状有关
·2、中脑⽪层通路
·该通路多巴胺缺失与精神分裂症的阴性症状和认知症状有关
·3、⿊质纹状体通路
·属于椎体外系参与运动的调控
·D2受体阻断导致PD(强直少动,肌张⼒障碍);过度运动如TD
·4、结节漏⽃通路
·正常情况下该通路是活跃的,并抑制催乳素的释放
·阻断D2受体增加催乳素的释放导致溢乳和闭经。
多巴胺受体的分布。
多巴胺能效应在中枢,主要有4条多巴胺能通路,一是中脑-边缘通路,二是中脑-皮质通路,三是黑质-纹状体通路,四是下丘脑-漏斗通路,现将介绍这些通路激动时的中枢效应和药物治疗。
精神分裂症发病的三条神经通路精神分裂症涉及以下三条神经通路:①中脑-边缘通路。
从中脑腹侧被盖部到边缘系统有一条神经通路,称中脑-边缘通路,该通路经多巴胺传导,故又称中脑-边缘多巴胺能通路。
②中脑-皮质通路。
从中脑腹侧被盖部到前额皮质有一条神经通路,称为中脑-皮质通路,该通路经多巴胺传导,故又称中脑-皮质多巴胺能通路。
③皮质-边缘谷氨酸-伽马氨基丁酸通路。
从前额皮质到边缘系统有一条神经通路,称皮质-边缘通路,该通路先由谷氨酸能神经元传导,中途换元为伽马氨基丁酸神经元,终止于边缘系统,故又称皮质-边缘谷氨酸-伽马氨基丁酸能通路。
三条神经通路中多巴胺能的病态情况①中脑-边缘通路。
当中脑-边缘多巴胺能通路功能亢进时,激动边缘系统的多巴胺D2受体,引起阳性症状,如幻觉、妄想。
②中脑-皮质通路。
当中脑-皮质多巴胺能通路功能低下时,前额皮质背外侧的多巴胺D1受体功能不足,引起阴性、认知症状,前额皮质背内侧部、眶部、扣带皮质前部的D1受体功能不足,引起心境症状(抑郁、悲哀、心境不稳和烦恼)。
③皮质-边缘谷氨酸-伽马氨基丁酸通路。
当前额皮质功能低下时,皮质-边缘谷氨酸-伽马氨基丁酸能通路功能减退,该通路本是抑制边缘系统多巴胺能的,当其功能减退时,中脑-边缘通路中多巴胺能脱抑制性释放,D2受体功能亢进,引起阳性症状。
药物治疗机制①典型抗精神病药阻断中脑-边缘通路的多巴胺D2受体,治疗阳性症状;②不典型抗精神病药不但阻断中脑-边缘通路的多巴胺D2受体,治疗阳性症状,而且阻断中脑-皮质通路突触前膜上的5-羟色胺(5- HT)2a受体,该受体兴奋时能抑制多巴胺释放,当被阻断时,导致多巴胺脱抑制性释放增加,激动前额皮质的多巴胺D1受体,改善阴性、认知和心境症状。
多巴胺在脑中分布MCM90 问题一A. 药物在脑中的分布研究脑功能失调的人员要测试新的药物的效果,例如治疗帕金森症往脑部注射多巴胺(dopamine)的效果。
为此,为了精确估计药物影响的脑部区域,他们必须顾及注射后药物在脑内分布区域的大小和形状。
研究数据包括50各圆柱体组织样本的每个样本的药物含量的测定值(见附表和附图),每个圆柱体样本的长为0.76毫米,直径为0.66毫米,这些互相平行的圆柱体样本的中心位于网格距为1毫米*0.76毫米*1毫米的格点上,所以圆柱体互相间的底面上接触,侧面互不接触(见附图所示)。
注射是在最高计数的那个圆柱体的中心附近进行的。
自然在圆柱体之间以及由圆柱体样本覆盖的区域外也有药物。
表1后方垂直截面164 442 1320 414 188480 7022 14411 5158 352 2091 23027 28353 13138 681 789 21260 20921 11731 727 213 1303 3765 1715 453前方垂直截面163 324 432 243 166712 4055 6098 1048 232 2137 15531 19742 4785 330 444 11431 14960 3182 301 294 2061 1036 258 188试估计受到药物影响的区域中药物的分布。
一个单元表示一个闪烁微粒的计数,或多巴胺的4.753*10-13克分子量,例如,附表指出位于后排当中的那个圆柱体的含药量是28353个单元。
本题是由华盛顿州东华盛顿大学数学系的Yves Nievergelt提供的。
他还写了一篇评论文章Yves Nievergelt,The Outstanding Brain Drug Papers,The UMAP Journal,v.11(1990),no.3,227-229.脑中多巴胺的分布一、结果概述为预测脑中多巴胺含量的分布我们构造了一个三维的非稳定态质量输运模型。
该模型是建立在分子扩散、一阶衰减及瞬时点源输入三条原理的基础上的。
我们给出了描述该模型的微分方程给出了解析解。
我们利用所给的受实验者在脑注射后脑中多巴胺分布的数据来标定模型中的参数。
我们采用二维曲线拟合和五维格点搜索的最优化程序。
最后我们用数值积分来求模型中空间区域上的浓度使之能给定数据进行直接比较。
本模型显示了预测和观察数据间良好的量级一致,但并不表明计算数值上的一致。
在本模型中附加上一个随机分量并不能改进模型的预测能力。
我们做了模型对参数值变化的敏感性的初步分析。
本模型对所有参数的扰动具有同样的响应,这表明本模型对参数的变化有相当程度的稳定性。
二、假设多巴胺是在脑和神经系统中发现的具有拟交感神经作用的化合物儿茶酚胺(catecholamines)中的一种,它的作用就像神经传递质。
在整个脑中多巴胺的含量是变化的,它或者被合成或者被代谢掉。
例如,在鼠脑的某些区域,天然的多巴胺只占千万分之六到千万分之七十四或相当于大脑组织的10到119计数单位/立方毫米。
基于这一事实,我们假定本样本中的基准数(background level )是可以忽略的。
按文献记述,多巴胺的示踪实验通常是对实验动物进行的。
取很小的脑组织样本(就像本题给的数据那样)的方法都取自脑的深部组织。
典型试验对象的脑的体积从0.2立方厘米到25立方厘米。
对于近似球形的脑,20毫米代表了实验动物的很好的平均大脑直径。
基于这两方面的考虑,从数据可作出假设:样本区域的大小比之于脑的其余部分是可以忽略的,样本不是从脑的边界处取的。
数学模型的研制还需要一些关于脑的生理生化特征及数据的附加假设。
在研制模型的过程中,我们要证实这些假设中的合理性。
例如,我们假定:可以粗略的认为大脑是均质的,扩散和衰减决定了脑中多巴胺的输运。
我们还忽略了对流过程。
此外,还假定了一次性注射,注射位置在y 方向后排垂直柱体的中点。
取样所需的确切时间不知道。
由于注射到取样之间有足够的时间,因而取样所需时间相比之下可以忽略。
决定多巴胺在大脑中的行为的物质可能极为复杂。
通过假定分子扩散及组成元素衰减是脑中多巴胺输运的主要手段可得到合理的预测能力。
所以我们假定该过程由一个二阶偏微分方程决定,这种形式的方程可应用于包括质量输运、流体动力学、热交换等多种问题。
三、 模型的形成建立预测脑中多巴胺含量的数学模型要考虑在三维空间及时间过程中的质量输运,只考虑一阶衰减的非稳定态的质量的扩散输运方程是t C ∂∂=x ∂∂(E x x C ∂∂)+y ∂∂(E y y C ∂∂)+z∂∂(E z z C ∂∂)-kC (1)其中C 是多巴胺浓度(计数/立方毫米),x,y,z 是三维空间坐标(毫米),t 是时间,E x ,E y ,E z 是x,y,z 方向相应的扩散系数(平方毫米/单位时间),k 是衰减系数(l/单位时间)。
E x ,E y ,E z 和k 实际上都是时间和空间的函数。
不幸地,它们的值事先是不知道的。
此外,这类一般的变系数方程的求解要用数值解法,常常是很费钱的。
假定E x ,E y ,E z 和k 对时,空的均匀性,因而可以取作常数,(1)可重写为t C ∂∂=E x 22x C ∂∂+E y 22yC ∂∂+E z 22z C ∂∂-kC 对于在t=0时刻在(x s ,y s ,z s )处的瞬时点源的情形(编译者注:即考虑(1)的右端有非齐次项δ—函数δ(x —x s )δ(y-y s )δ(z-z s )非齐次方程,上述方程有下面的解析解C(x,y,z,t)=()⎪⎭⎪⎬⎫⎪⎩⎪⎨⎧-------•kt tE z z tE y y tE x x E E E t M z y x z y x 4)(4)(4)(exp )(4200202/12/3π ,(2)(编者按:即基本解),其中M 是瞬时点源的质量(计数),而x s ,y s ,z s 是点源的坐标(毫米)。
这个解没有考虑多巴胺在边界界面处的相互作用。
但是,由于假定样本是从脑内很好地取出的,所以不需要考虑边界条件。
我们假定注射所需时间及取样所需时间都可以忽略不计(即都是瞬时完成的),所以认为数据是在某时刻取的。
我们取变量的单位使得1个单位时间正好等于注射到取样之间的时间间隔。
四、 数值求积方安 因为数据是用圆柱取样上的计数单位表示的,又因为模型预测了多巴胺的浓度值,有必要取应变量C 在每个圆柱体上的积分值使之能和给定数据进行直接比较。
不幸地是(2)对空间变量的积分没有解析表达式,因而必须进行数值积分。
我们采用三维矩形积分公式。
第i 个柱体上的多巴胺克分子质量m I 算作 m I =⎰⎰⎰dV z y x C ),,(≈∑jij C z y x ∆∆∆其中C ij 是第i 个圆柱体的第j 个“微元”上多巴胺浓度的计算值。
令样本柱体的直径为D ,我们采用一致的空间步长=∆=∆=∆z y x D/6,这是一个能在计算精度和计算时间(经济方面)保持平衡的值。
五、 参数估计粗一看模型有八个参数我们令y s =L/2就确定了瞬间点源的y 坐标,即我们假定注射是在与样本的后排垂直截面的二分面上进行的。
这样C 的值关于该平面是对称的。
和别的参数不一样,x s 和z s 的值不是用模型和数据相比较而得到的。
我们用统计软件包基于样本网络内的数据点作一个二元二次回归方程得到的,回归方程是C(x,z)=ax 2+bz 2+cxz+dx+ez+f其中C 表示在x ,z 处的多巴胺浓度的回归值,而a ,b ,c ,d ,e 和f 都是常数值。
我们求使C 达到最大值的x ,z 坐标为x s 和z s ,即解.0,0=∂∂=∂∂zC x C 当然,对所提供的前部和后部圆柱上的数据都可解出一组(x s ,z s )。
但由表2可见他们是很相近的(编译者注:表1为本优秀论文中所用到的符号及其意义的列表,我们把它略去了),所以我们取它们的平均值。
表2 x ε和z ε的估计值我们采用格点优化搜索法确定其余的参数,我们简单的取数据和本模型的预测值得均方残值差的和取极小作为收敛判据,因此要极小化的目标函数是2)ˆ(i ii mm -∑ 其中m I 是第I 个圆柱体上多巴胺克分子质量的观察值,而i mˆ是模型的预测值。
当然,实际上确切的注射量应该是已知的,而不应该是未知的参数,把M 作为模型中的参数,由于它和衰减系数k 的强烈正相关而变得更复杂了。
所以我们利用最优化程序求得M 的量值应有的范围,从而把M 当作一个常数来处理。
网络搜索始终如一的指出其范围应在1*106到1.5*106多巴胺计数。
所以假定注射多巴胺得M 值为10μg (约为1.4*106计数单位)。
最后,网络搜索指出E x 和E z 的值是高度相关的,看来这一事实证实了我们假定E x 和E 相同是有道理的。
由这个假定结合前面的论证就把模型的决定简化为一个三参数的最优化问题。
模型中的最优化参数见表3。
表3 最优参数值六、 结果 表4 表示柱体中多巴胺含量的观察值,而表5 表示充分标定过后的模型的预测值,图4表示相应的绝对值。
表4 多巴胺观察值(计数)789 21260 20921 11731 727213 1303 3765 1715 453444 11431 14960 3182 301294 2061 1036 258 188表5 多巴胺预测值(计数)后部垂直截面前部垂直截面153 753 1087 406 421518 7454 10808 4042 4194424 21796 31534 11764 12133312 16320 23593 8800 907688 3394 4886 1821 18795 466 672 251 26939 4609 6682 2499 2592735 13476 19497 7273 7502048 10090 14587 5441 561426 2098 3021 1126 116图1 后部和前部垂直截面上的绝对残差虽然给定的数据只代表了某个时刻(可选作t=1)的状态,本模型能预测任何时间任何空间位置多巴胺得含量。
图2给出了t=1和t=4时刻后排垂直截面上的浓度。
正如我们以前指出过的,脑中多巴胺得基准数大概是10计数/立方毫米,虽然本模型中的假定基数为零,我们对浓度大于等于该基准数的所有的点定义点源的影响球面。
图3 表图2 t=1和t=4时后部垂直截面上多巴受的浓度示代表这个影响球面的常数浓度三维等值面。
结合图2,图3表明当浓度等值面扩张时,在点源附近的浓度高峰变平。
图3 t=1和t=4时的影响区域(应向球面)值得指出,尽管一开始基准浓度等值面向外扩张,但它在收缩到注射点位置之前达到一个最大的曲面。