雅思写作概述
- 格式:ppt
- 大小:2.06 MB
- 文档页数:6
雅思(IELTS)写作是国际英语语言测试系统的一部分,用于评估考生对英语写作的能力。
它是世界上最广泛接受和认可的英语语言考试之一,被广泛应用于教育、移民和就业等领域。
雅思写作主要考察考生在书面表达方面的能力,要求考生能够清晰、准确地表达观点、论述问题,并有效地组织文本结构。
以下是对雅思写作的一些重要信息:1.考试结构:雅思写作考试分为两个任务。
第一项任务是描述和解释图表、图像或图画;第二项任务是就某个话题发表自己的观点。
考试时间为60分钟,每项任务30分钟。
2.任务要求:第一项任务要求考生根据提供的信息,描述、解释或比较数据,图表或图像。
第二项任务要求考生根据给定的观点、论题或问题,表达自己的意见,论述观点并支持其立场。
3.文体和结构:雅思写作可以采用不同的文体,如说明文、议论文、辩论文等。
考生需要合理组织文章结构,包括引言、主体段落和结论,并使用适当的过渡词和句子连接词来展示逻辑关系。
4.语言运用:雅思写作涉及到语法、拼写、词汇和标点等语言要素的运用。
考生需要注意使用正确的语法和拼写,并且灵活运用丰富的词汇和表达方式,以使文章更具流畅性和表达力。
5.计分标准:雅思写作的评分标准主要包括任务完成度、语言运用、文本组织和词汇使用。
评分范围为0-9分,每个任务均独立评分,最后取两项任务的平均得分。
6.提升技巧:提高雅思写作能力需要多方面的准备和训练。
阅读和学习范文和写作技巧是提高写作水平的有效方法。
此外,多进行练习并接受有针对性的反馈也是提升写作能力的关键。
总体而言,雅思写作要求考生在给定时间内,精确地表达观点、论述问题,并使用恰当的语言和结构组织文章。
通过系统的学习和练习,考生可以提高写作能力,并在雅思考试中取得更好的成绩。
雅思图表作文TASK1精讲精练A理论部分:雅思小作文概论1、文章结构:主要分三部分:i。
introductory sentence;ii。
body paragraph;iii.Concluding sentence具体讲:第一段introductory sentence只要写一句话,交待图形(如the line graph, pie chart等等),描述对象(如图表描述的是the number of tourists visiting England),地点(如the US, the UK等)以及时间(如between 1988 and 1997等等);另外要注意的就是第一段不能和图表上方已给的句子太过相似!否则,会失分的!第二部分一般写1~3段,这要视情况而定。
这部分主要就是对比不同的数据,如相似或相同的数据;某个数据是另一个数据的2倍;某个数据所占比例最大或最小等等。
最后一段concluding sentence也只要写一句话,主要是总结图表的整个趋势。
2。
文章的效果。
很多学生会发现小作文的例文特别简单(尤其是剑桥书里提供的)。
原因很简单,这个report 的目的就是要让university lecturer了解某个事物的发展趋势,所以写出来的文章必须结构清晰、易懂,绝对不能太复杂,也不要把每个数据都描写出来,只要描写有代表性的,重要的数据即可.以下为雅思小作文的四个基本步骤第一步:改写题目通过同义词转换在短短的1分钟内就写好作文的第一段。
举例:The graph below shows the percentage of people unable to find work in three major countries from 1983 to 1992.题目中划线的单词都可以进行同义转换:graph—figure, show—illustrate, percentage-proportion, major-key, from…to…—between…and…,第二步:分析时态1. 图表小作文大部分时候使用过去时态,因为出现的数据一般都是以往的统计数据,过去的情形和现在的情形很有可能完全不一样,因此用过去时态比较恰当。
剑桥雅思18写作范文本文为您提供剑桥雅思18写作范文,旨在帮助您更好地了解考试要求和提高写作水平。
第一部分:图表描述范文一:Pie ChartsThe given pie charts illustrate the reasons why people in a particular country chose to travel abroad in the year2017. The information is divided into two categories:personal and business travel.According to the charts,personal travel accounted for the majority,with73%of respondents citing this as their reason for going abroad.Within this category,the main motivation for traveling was to'relax and take a break'at 39%.Visiting family and friends,as well as exploring new cultures,were also popular reasons at22%and12% respectively.On the other hand,only27%of the respondents traveled for business purposes.In terms of business travel,'attending conferences and meetings'was the most common reason at15%,closely followed by'visiting clients and partners'at12%.'Training and professional development'and'international assignments' accounted for8%and7%respectively.Overall,the pie charts demonstrate that the majority of people traveled abroad for personal reasons,mainly to relax and explore new cultures.However,a significant portion also traveled for business purposes,attending conferences and visiting clients.第二部分:图表分析范文二:Line GraphsThe given line graphs compare the average monthly household spending on three different categories in the United Kingdom from2010to2015.The first graph shows the trends in spending on food and drink,with a slight increase from around£200in2010to approximately£250in2015.Despite minor fluctuations,the overall trend shows a steady rise during the period.The second graph displays the changes in spending on clothing and footwear.It demonstrates a more significant increase,starting at around£100in2010and rising to nearly£150in2015.Like the previous graph,it shows some fluctuations,but the overall trend is upward.Finally,the third graph presents the variations in household spending on recreation and culture.It exhibits a similar pattern to the previous graphs,with an initialfigure of approximately£100in2010,which steadily increases to reach nearly£125in2015.In conclusion,the line graphs show that household spending on food and drink,clothing and footwear,as well as recreation and culture,all experienced an upward trend from 2010to2015.This reflects an overall increase in the average monthly expenditure in these areas.第三部分:图表讨论范文三:Bar ChartsThe provided bar charts compare the age distribution of the population in two countries:Country A and Country B.The data is categorized into five different age groups:0-14,15-24,25-64,65-79,and80+.In Country A,the age group with the highest percentageis25-64,representing over50%of the population.The0-14age group comprises around25%of the population,while the remaining three age groups each account for less than10%.On the other hand,in Country B,the age groupdistribution is more evenly spread.The25-64age group still holds the majority,but it is followed closely by the0-14 age group,both at around30%.The15-24and65-79age groups both make up approximately15%of the population,while the 80+age group has the smallest percentage at around10%.Overall,the bar charts reveal that the population age distribution in Country A is more concentrated in theworking-age group(25-64),while Country B has a more balanced distribution across all age groups,particularly with a larger portion of young people(0-14).第四部分:图表总结范文四:TableThe provided table presents the percentage of households in a particular country who own different types of electronic devices in the year2018.According to the table,the highest ownership percentage is for mobile phones,with a staggering98%of households having this device.It is followed by televisions,which are present in92%of puters,both desktops and laptops,have relatively lower ownership rates at75%and68% respectively.Other devices included in the table are tablets,with55% ownership,while gaming consoles and smart speakers have the lowest ownership percentages,both at32%.In conclusion,the table demonstrates that mobile phones and televisions are the most commonly owned electronic devices in households,with computers,tablets,gamingconsoles,and smart speakers following behind in terms of ownership rates.本文为您提供的剑桥雅思18写作范文履行了任务要求,采用准确、生动、简洁的语言表达,并且没有出现与主题无关的内容。
雅思考试作文试题讲解雅思考试作文试题讲解篇一:雅思写作小作文题型分类总结雅思写作小作文题型分类总结摘要:雅思写作小作文题型一般都是图表作文,常见的几种主要类型有:表格图,曲线图,柱状图,饼状图和图画题五大类。
雅思写作小作文是雅思写作的重要组成部分。
雅思写作小作文的题型一般包括柱图和线图是每月常考的题型,饼图和表格题也是相对频率较高的题型。
偶尔也会考综合题。
图画题主要分为流程图和地图题,一般每季度轮换题库的时候会出现。
只要同学们按照固定的题目分类学习,针对性的进行复习,做到多样性和灵活性的语言使用,考生就能达到更高的分数。
在雅思课程A类小作文图表题的写作当中,考生经常会碰到图表看懂了,专家将从动态图表和静态图表的角度来详细分析雅思小作文的解题思路。
一、动态图有时间推移变化的图我们通常叫做动态图。
曲线图都是动态图,但是对于表格图,饼图和柱图却有动态和静态之分。
对于大多数的动态图我们都可以大致当作线图来处理。
动态图重点在数字变化的表达上,利用主语句型的不同和衔接关联词来展开。
写好动态图的基础是要准备好三个方面:1. 解题思路1). 表格题的动态题解题思路大致可以分为四步:①先相减(年份大的减小的);②后分类(上升一类,下降一类);③挑出极值(最大值);④挑选数值(倍数关系,变化明显的数值);2). 线图的解题思路大致分为两种:第一种:①按整条线来写(可以把相同趋势的线放在一起,也可把相反趋势的线拿来做对比);②挑选重要信息(整体趋势,起点,重点,最高点,最低点);③整体作比较。
第二种:①按时间区间来写(横轴对上去有共同拐点或交点的分为一段);②对比着写(强调交点,拐点,最高点,最低点);3). 动态柱图解题思路:把各个柱子的顶点连起来就是几条线,所以按线图方式处理;4). 动态饼图解题思路:把每种颜色看做一条线,可把相同相反的颜色放在一起写,很多时候也可以把占的比例最大的单独写一部分。
2. 基础替换词汇1). 趋势词汇上升动词类:increase, rise, grow, jump, surge, shoot up, soar下降动词类:decrease, decline, fall down, drop, sink, dip波动动词类:fluctuate持平动词类:remain the same, stabilize, remain stable, remain constant修饰动词的副词:slightly 轻微地,slowly 缓慢地,gradually 逐渐地,steadily 稳定地,rapidly 迅速地,moderately 温和地,轻微地,significantly 明显地,sharply 明显地,dramatically 急剧地,drastically 急剧地上升名词类:increase, rise, growth, jump, surge下降名词类:decrease, decline, fall, reduction, drop波动名词类:fluctuation修饰名词的形容词:slight, slow, gradual, steady, rapid, moderate, significant, sharp, dramatic, drastic2). 极值类词汇和表达最高点:reach the peak/top/highest pointIncrease to the peak/top/highest point(所有上升类的动词都可以替换掉increase)最低点:reach the bottom/lowest pointdrop to the bottom/lowest point(所有下降类的动词都可以替换掉drop)占了:occupy/make up/take up/account for/represent/constitute3). 倍数的表达方式Double 是两倍/大一倍Increase/decrease three times 增长/减少了三倍4). 大约的表达方式Approximately/About/around+数字3. 常用的小作文的趋势句式表达句式一:变化主体/图画中主体+趋势动词+副词+数值+时间区间Eg: The number of aged people over 65 increased significantly from 1 million in 1940 to 1.2 million in 2000.句式二:There be+形容词+表示趋势的名词+in+变化的主体+时间区间Eg: There was a significant increase in the number of aged people over 65 from 1 million in 1940 to 1.2million in 2000.句式三:时间+see/experience/witness+ 表示趋势的名词+in+ 变化的主体+ 数值Eg: The period from 1940 to 2000 saw an upward trend in the number of aged people over 65 from 1 million to 1.2 million.句式四:表示趋势的名词+be+seen/experienced/witnessed+in+变化的主体+时间Eg: An upward trend was seen in the number of aged people over 65 from 1 million in 1940 to 1.2million in 2000.二、静态图静态图常见的是柱图,饼图和表格题。

雅思写作小作文模板及范文雅思写作小作文模板及范文。
雅思写作小作文是雅思考试中的一个重要部分,它要求考生在有限的时间内写出一篇简短的文章,表达自己的观点和看法。
为了帮助考生更好地应对雅思写作小作文,下面将介绍一些常用的写作模板和范文,供考生参考。
模板一,提出观点。
首先,引出话题,简要介绍自己的观点;其次,列举2-3个支持自己观点的理由或例子;最后,总结观点,得出结论。
范文一,提出观点。
Nowadays, more and more people prefer to work from home rather than in an office. In my opinion, working from home has several advantages.Firstly, working from home can save commuting time and reduce stress. Many people spend hours commuting to and from work every day, which can be tiring and frustrating. By working from home, they can avoid the daily commute and have more time for themselves.Secondly, working from home can improve work-life balance. With the flexibility of working hours, people can better manage their time and allocate more time to their families and personal interests. This can lead to a happier and more fulfilling life.In conclusion, working from home has many benefits, including saving time, reducing stress, and improving work-life balance. Therefore, I believe that working from home is a preferable option for many people.模板二,对比观点。
雅思大作文常见结构详解雅思写作一共包括两部分,分别是大作文和小作文,大作文对考生来说难度会更大一些,要求我们有清晰的逻辑,并且搭建一个清晰的结构,这本身对我们来说就有很大的难度了,那么雅思大作文该如何搭建结构呢?雅思大作文常见结构详解雅思大作文结构具体如下:雅思大作文分三大类型:argument,discussion和report,结构一般分为:introduction,body和conclusion。
一、Argument类essay结构“To what extent do you agree or disagree / what’s your opinion?”这类便是argument类雅思作文。
Introduction:表述自己同意或者不同意,A和D只能选一个,不能中立。
Body:从不同角度论证自己的观点(三个论据尤佳),每个论据成段,段与段之间的主要思想不能重复。
Conclusion:总结自己的观点,此段中切勿出现新的论据。
二、Discussion类essay结构“Do you think it is a positive or negative development / Discuss both views and give your opinions.”这类便是discussion 类雅思作文。
一般是讨论利弊或者从正方两面阐述观点,再阐述自己的观点。
切忌如果只讨论一个方面会偏题。
文章应尽量避免出现过多“advantage”单词和“disadvantage”单词,显得词汇量单薄。
可用merit, benefit, value, strength等代替advantage,用downside, weakness等代替disadvantage。
三、Report类essay结构“what are the reasons and provide solutions”这类便是report类雅思作文。
雅思大作文范文三篇雅思大作文写正题:ESSAY分为三部分:1.Introduction2.Body3.Conclusion一篇学术性论文当中,这三部分是必须要有的,同理在考试中才能得高分。
那么什么是introduction呢,之前看书说是把题目用替换词带入照抄,后来发现这是傻瓜式写法,对于要求写作7分以上的同学并不适用。
真正的introduction是“present your viewpoint”那么怎样来present呢?继续。
第一步:lead-in background information即导入背景信息。
看这个例子:Some people think visitors to other countries should imitate local custom and behaviors. Some people degree. They think the host country should wele culture different. Discuss the two views,and give your own opinion..这个论文题目里, tourism 就是一个背景信息,所以我们introduction里第一句就该来介绍或者叫导入背景信息,即tourism的信息。
例如: Tourism has became an indispensable part in our modern world.或者Tourism is gradually considered to be a hot topic第二步:narrow down information即从大背景信息里提出你要去论证的方面。
还是上面给出的题目,你要narrow down出来的就是:“people show more concern to their two views. Some of them think visitors to others nations should imitate local custom and behaviors,but others argue that the host nation should wele various cultures”第三步:your viewpoint即给出你自己的立场。

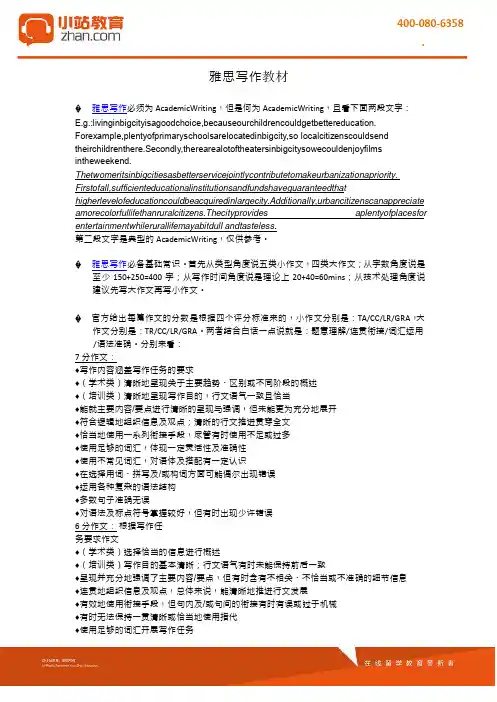
【关键字】写作Unit 1 雅思IELTS 考试写作简介雅思考试写作部分在听力和阅读后进行,由两部分组成,TASK1和TASK2。
要求考生在60分钟内完成两篇文章的写作。
普通培训类和学术类考生在写作的考试内容上有一些区别。
两类写作TASK2题目类型基本相同,考试的结构和要求也大体相同,要求在40分钟完成250字左右的议论文。
类似英美国家学校里任课教师布置的课堂讨论作文。
一般要求考生根据自己的知识和经验就一个现象阐明自己的态度和见解,或就一个观点发表自己赞同或反对的观点。
学术类写作TASK 1(ACADEMIC TRAINING MODULE)要求考生对题目中给出的各类图表加以观察和分析,并根据已知的图表和资料写一篇很多于150字的小短文。
考得较多的有曲线图、柱状图、饼状图、表格、饼图等。
也有可能考到两种不同种类的图。
另外,流程图和示意图也偶尔考到。
时间20分钟。
普通培训类写作TASK1(GENERAL TRAINING MODULE)则要求考生就某个假设的场景写一封信. 到目前为止,出现较多的书信种类有投诉信、请求信、建议信、寻找失物信、邀请信等。
20分钟内完成150个字的文章。
总之,就题目的难度而言,GENERAL TRAINING MODULE 普通类写作比ACADEMIC TRAINING MODULE学术类写作稍微简单一些。
评分标准The examiner reads your answer and awards band score of between 1(did not answer the question) and 9 (native speaker-like ) according to these criteria:• 1.Task Response (i.e. how fully and appropriately the candidate has answered all parts of the task; the extent to which the candidate's ideas are relevant, developed andsupported; the extent to which the candidate's position is clear and effective) • 2.Coherence and Cohesion (i.e. how well the information and ideas are organized and presented i.e. paragraphing; how well the information is linked)• 3.Lexical Resource (i.e. the range of vocabulary used, how accurately it is used and how appropriate it is for the task)• 4.Grammatical Range and Accuracy (i.e. the range of structures used, how accurately they are used and how appropriate they are for the task)The band scores are then added together divided by 3 and rounded to determine your band score for this task.Writing Overall Band = 1 / 3* Task1 + 2 / 3*Task2For example: Task1 =6Task2 =7Overall Band = 1 / 3* 6 + 2 / 3*7= 6.5Unit 2 曲线图1.描述上升的单词increase rise grow go up词汇升级:creep up ≤10 edge up 10 ease up 20boom 30 surge 45 soar 60 swell 70 escalate 80 rocket 902.描述下降的单词decrease drop decline fall go down词汇升级:creep down ≤10 edge down 10 ease down 20ebb 30 subside 45 slump 60 collapse 70 plunge 80 plummet 903.描述波动的单词fluctuate --- fluctuation go up and down rise and fall例:Sales of Computers 1995There was a slight growth in the sales of computers from Jan to Feb. However, they increased dramatically to a peak in the next month. After that, there was a downward trend in sales between Mar and Aug, which leveled off by the end of Dec.Task 1每部分的结构:例题分析example 1WRITING TASK 1You should spend about 20 minutes on this taskThe graph below shows the number of passengers in a London underground station at different times of the day.Summarize the information by selecting and reporting the main features and make comparisons where relevant.You should write at least 150 words.Number of passengers at a London underground stationThe line graph illustrates the fluctuation in the number of people at a London underground station over the course of a day.开头段三种万能方法:①改单词②换句型③加信息The busiest time of the day is in the morning. There is a sharp increase between 06:00 and 08:00, with 400 people using the station at 8 o'clock. After this the numbers drop quickly to less than 200 at 10 o'clock. Between 11 am and 2 pm the number rises, with a plateau of just under 300 people using the station.In the afternoon, numbers decline, with less than 100 using the station at 4 pm. There is then a rapid rise to a peak of 380 at 6 pm.After 7 pm, numbers fall significantly, with only a slight increase again at 8pm, tailing off after 9 pm.Overall, the graph shows that the station is most crowded in the early morning (around 08:00) and early evening (around 18:00) periods.例题分析2:Sample 2WRITING TASK 1---“例2”You should spend about 20 minutes on this taskThe graph below shows the annual amount of fish caught in North America from 1972 to 2000. Summarize the information by selecting and reporting the main features and make comparisons where relevant.You should write at least 150 words.line graph with two linesThe graph reveals changes in fish catches for the US and Canada over the last 30 years. Between 1975 and 1981, US fish catches averaged between 2.5 and 2.75 million tons per year, while Canadian landings fluctuatedbetwee n 600,000 and 900,000 tons. …In 1981, however, there was a significant increase in fish caught in the US, and this rise continued and peaked at 5.6 million tons in 1991. During the same period, Canada's catch went up from 1 million tons to 1.6 million tons, a growth of over 50%.From 1991 onwards, a sudden decline in fish catching was reported in both countries. US figures plummeted to 4 million tons in 2001, a drop of 28%, and Canadian catches plunged to 0.5 million tons, a decrease of 66%. In the following four years, US catches remained stable at 4 million tons, while Canadian catches rose and fell around the 0.5 million tons mark.In general, fish catches have declined drastically in both the US and Canada since the early 1990s. Although Canadian production was much lower, it echoed US figures, declining or increasing at the same rate.习题③You should spend about 20 minutes on this taskThe graph below shows the consumption of fish and some different kinds of meat in a European country between 1979 and 2004.Summarize the information by selecting and reporting the main features and make comparisons where relevant.You should write at least 150 words.The line chart illustrates changes in the amounts of beef, lamb, chicken and fish consumed in a particular European country between 1979 and 2004.In 1979 beef was by far the most popular of these foods, with about 225 grams consumed per person per week. Lamb and chicken were eaten in similar quantities (around 150 grams), while much less fish was consumed (just over 50 grams)However, during this 25-year period the consumption of beef and lamb fell dramatically to approximately 100 grams and 55 grams respectively. The consumption of fish also declined, but much less significantly to just below 50 grams, so although it remained the least popular food, consumption levels were the most stable.The consumption of chicken, on the other hand, showed an upward trend, overtaking that of lamb in 1980 and that of beef in 1989. By 2004 it had soared to almost 250 grams per person per week. Overall, the graph shows how the consumption of chicken increased dramatically while the popularity of these other foods decreased over the period.此文档是由网络收集并进行重新排版整理.word可编辑版本!。
雅思议论文写作方法-解释说明法在雅思写作大作文考试中,经常会以议论文的形式来考查大家,那么雅思写作议论文该如何写呢?接下来小编给大家介绍一种方法,那就是解释说明法,什么是解释说明法?又该怎么用呢?来看小编为大家带来的介绍内容吧。
雅思议论文写作方法-解释说明法雅思议论文解释说明法解释说明法,是其中一条有力的扩展补充方式,它可以将之前某一个不够清晰的想法加以阐述,说明及解释,让考官心中有数的同时,也让文章字数更加充实。
提醒考生们在使用时要注意两条要素:(一)一味改写之前的句子。
这类考生已经为字数愁白了头,俨然有点“不择手段”的意思。
以为解释就是重写,只是改动几个单词。
换位思考,若你看到某篇文章总是出现极其相似的句式,更糟糕的是意思还完全一样,会不会有种被糊弄的感觉?(二)一再的句意重复。
这类现象尤为普遍。
许多考官对中国考生的文章甚为头疼。
看似写了许多,但细看来却永远在说同一句话。
往往一句简单的意思翻来覆去偏要讲3遍,却始终得不到新鲜的信息来有力支持。
这样的文章写来何意?要记住:考官不是3岁孩子,不是任何东西都需要解释的。
因此,解释说明法只适用于一些个人觉得意思不是特别明确的句子之后,用更加简明的方式去补充说明主题句的意思或原因,并且要从整个句式上发生大幅度改变,目的是将某句阐述的更加清楚。
此法只作为补充的方式,不可在同一篇文章中使用过多。
用于解释的引导方式主要有:In other words, / That is to say,..... , which means that....让我们来看一个例子:【写作真题】Some people say that online learning is themost effective and convenient way to learn. Others say that online learning will never be as effective as learning at a real school in person. Discuss both these views and give your own opinion.【名师献计】While there are a couple of drawbacks with online learning ,there are many more advantages. One of the most significant issues is the pace of learning. Students can learn without distractions at their own pace. This means that students can really focus on the courses and, as a result, achieve better results.雅思写作高分必会的三种论证法举例要选有说服力的举例是很多考生愿意在考场上使用并且常用的方法,但是很多考生喜欢以自己或者自己的朋友、国家为例,这样的例子是片面的,没有典型性与普遍性。
雅思c18写作摘要:1.雅思写作概述2.雅思写作C18的特点3.雅思写作C18的题型及应对策略4.雅思写作C18的备考建议5.总结正文:一、雅思写作概述雅思写作作为雅思考试的一部分,旨在测试考生的英语书面表达能力。
它包括两部分:Task 1和Task 2。
Task 1主要考察考生的图表描述能力,Task 2则侧重于考察考生的议论性文章写作能力。
在雅思写作中,C18级别意味着题目难度较高,要求考生具备一定的英语水平和写作技巧。
二、雅思写作C18的特点1.题目难度较高:C18级别的雅思写作题目要求考生具有较强的思维能力和表达能力。
2.话题多样性:C18级别的题目涉及广泛的话题,包括社会、科技、教育、环境等。
3.观点鲜明:C18级别的题目往往要求考生在文章中表达清晰、有力的观点。
4.逻辑严谨:C18级别的雅思写作要求文章结构严谨,论证有力。
三、雅思写作C18的题型及应对策略1.提纲类作文:此类作文要求考生根据给出的提纲,展开论述。
应对策略是确保文章结构清晰,观点鲜明,论述有力。
2.图形作文:此类作文要求考生根据图表信息进行描述和分析。
应对策略是熟悉各类图表的特点,掌握描述和分析的技巧。
3.议论文:此类作文要求考生针对某一话题发表观点并进行论证。
应对策略是确立明确立场,运用恰当的论证方法,论据充分。
四、雅思写作C18的备考建议1.扩大阅读范围:阅读各类英文文章,积累话题素材和观点。
2.练习写作:多进行写作练习,提高自己的写作速度和质量。
3.学习写作技巧:学习如何进行文章结构布局,如何提出有力观点,如何运用恰当的论证方法等。
4.参加模拟考试:参加雅思写作模拟考试,熟悉考试流程,了解自己的薄弱环节。
五、总结雅思写作C18对考生的英语水平和写作能力有较高要求。
雅思大作文总体分为两种:说明文和议论文。
雅思说明文:it is / there is/ there are (it is true that many people eat junk food everyday.)议论文:I think that there are too many junk foods in our society.I think = I believe = I hold the opinion that = my view is 说明文一般描述的是关于社会现象或者问题,包括了或者是一个趋势的优点或者是缺点,这类文章通常都是以描述为主,基于事实描述,比较客观,不代有任何的特殊性。
就是一般我们这个社会都能够接受的论点。
议论文一般针对的是题目中的一个话题 (some people think),以及部分人对这个话题的想法(some people think, while others believe, 有些人认为。
当另外一些人认为),然后要求你是不是同意或者是发表你自己的看法(I think this is correct/true; I disagree with this)。
这类题目通常会在题目中引述一个观点,然后要求你针对那个观点,进行写作。
议论文比较基于主观事实描述,一般来说,文章的主体是以为什么而展开,,整理需要通过解释,论证从而达到一个比较合理的能够具有说服力的一个层次。
整理要展开自己的想法,并要通过论证,让读者认为你所写的是正确的,合理的。
雅思议论文通常只有两种问法:To what extent do you agree or disagree?? (你从多大程度上同意这个观点)》》》题目中一部分人只会提出对于某个问题所产生的一个看法。
整理所要进行论证就是你是否同意这么一个看法无论是采取同意的,还是不同意的写作手法,再论述的过程中必须从不同角度去验证你为什么同意或者不同意的理由。