Responses of stomatal conductance in field-grown maize [Zea mays] leaves to certain environmental
- 格式:pdf
- 大小:1.15 MB
- 文档页数:10

Response Evaluation Criteria in Solid Tumors (RECIST)Eligibility∙Only patients with measurable disease at baseline should be included in protocols where objective tumor response is the primary endpoint.Measurable disease - the presence of at least one measurable lesion. If the measurable disease is restricted to a solitary lesion, its neoplastic nature should be confirmed by cytology/histology.Measurable lesions - lesions that can be accurately measured in at least one dimension with longest diameter ≥20 mm using conventional techniques or ≥10 mm with spiral CT scan.Non-measurable lesions- all other lesions, including small lesions (longest diameter <20 mm with conventional techniques or <10 mm with spiral CT scan), i.e., bone lesions, leptomeningeal disease, ascites, pleural/pericardial effusion, inflammatory breast disease, lymphangitis cutis/pulmonis, cystic lesions, and also abdominal masses that are not confirmed and followed by imaging techniques; and.∙All measurements should be taken and recorded in metric notation, using a ruler or calipers. All baseline evaluations should be performed as closely as possible to the beginning of treatment and never more than 4 weeks before the beginning of the treatment.∙The same method of assessment and the same technique should be used to characterize each identified and reported lesion at baseline and during follow-up.∙Clinical lesions will only be considered measurable when they are superficial (e.g., skin nodules and palpable lymph nodes). For the case of skin lesions, documentation by color photography, including a ruler to estimate the size of the lesion, is recommended.Methods of Measurement –∙CT and MRI are the best currently available and reproducible methods to measure target lesions selected fo r response assessment. Conventional CT and MRI should be performed with cuts of 10 mm or less in slicethickness contiguously. Spiral CT should be performed using a 5 mm contiguous reconstruction algorithm.This applies to tumors of the chest, abdomen and pelvis. Head and neck tumors and those of extremities usually require specific protocols.∙Lesions on chest X-ray are acceptable as measurable lesions when they are clearly defined and surrounded by aerated lung. However, CT is preferable.∙When the primary endpoint of the study is objective response evaluation, ultrasound (US) should not be used to measure tumor lesions. It is, however, a possible alternative to clinical measurements of superficial palpable lymph nodes, subcutaneous lesions and thyroid nodules. US might also be useful to confirm the completedisappearance of superficial lesions usually assessed by clinical examination.∙The utilization of endoscopy and laparoscopy for objective tumor evaluation has not yet been fully and widely validated. Their uses in this specific context require sophisticated equipment and a high level of expertise that may only be available in some centers. Therefore, the utilization of such techniques for objective tumorresponse should be restricted to validation purposes in specialized centers. However, such techniques can be useful in confirming complete pathological response when biopsies are obtained.∙Tumor markers alone cannot be used to assess response. If markers are initially above the upper normal limit, they must normalize for a patient to be considered in complete clinical response when all lesions havedisappeared.∙Cytology and histology can be used to differentiate between PR and CR in rare cases (e.g., after treatment to differentiate between residual benign lesions and residual malignant lesions in tumor types such as germ celltumors).Baseline documentation of “Target” and “Non-Target” lesions∙All measurable lesions up to a maximum of five lesions per organ and 10 lesions in total, representative of all involved organs should be identified as target lesions and recorded and measured at baseline.∙Target lesions should be selected on the basis of their size (lesions with the longest diameter) and their suitability for accurate repeated measurements (either by imaging techniques or clinically).∙ A sum of the longest diameter (LD) for all target lesions will be calculated and reported as the baseline sum LD.The baseline sum LD will be used as reference by which to characterize the objective tumor.∙All other lesions (or sites of disease) should be identified as non-target lesions and should also be recorded at baseline. Measurements of these lesions are not required, but the presence or absence of each should be noted throughout follow-up.Response CriteriaEvaluation of target lesions* Complete Response (CR): Disappearance of all target lesions* Partial Response (PR): At least a 30% decrease in the sum of the LD of target lesions, taking as reference thebaseline sum LD* Progressive Disease (PD): At least a 20% increase in the sum of the LD of target lesions, taking as reference thesmallest sum LD recorded since the treatment started or the appearance of one ormore new lesions* Stable Disease (SD): Neither sufficient shrinkage to qualify for PR nor sufficient increase to qualify for PD,taking as reference the smallest sum LD since the treatment startedEvaluation of non-target lesions* Complete Response (CR): Disappearance of all non-target lesions and normalization of tumor marker level* Incomplete Response/ Stable Disease (SD): Persistence of one or more non-target lesion(s) or/and maintenance of tumor marker level above the normal limits* Progressive Disease (PD): Appearance of one or more new lesions and/or unequivocal progres sion of existingnon-target lesions (1)(1)Although a clear progression of “non target” lesions only is exceptional, in such circumstances,the opinion of the treating physician should prevail and the progression status should be confirmed later on by the review panel (or study chair).Evaluation of best overall responseThe best overall response is the best response recorded from the start of the treatment until disease progression/recurrence (taking as reference for PD the smallest measurements recorded s ince the treatment started). In general, the patient's best response assignment will depend on the achievement of both measurement and confirmation criteriaCR CR No CRCR Incomplete response/SD No PRPR Non-PD No PRSD Non-PD No SDPD Any Yes or No PDAny PD Yes or No PDAny Any Yes PD∙Patients with a global deterioration of health status requiring discontinuation of treatment without objective evidence of disease progression at that time should be classified as having “symptomatic deterioration”. Every effort should be made to document the objective progression even after discontinuation of treatment.∙In some circumstances it may be difficult to distinguish residual disease from nor mal tissue. When the evaluation of complete response depends on this determination, it is recommended that the residual lesion be investigated (fine needle aspirate/biopsy) to confirm the complete response status.Confirmation∙The main goal of confirmation of objective response is to avoid overestimating the response rate observed. In cases where confirmation of response is not feasible, it should be made clear when reporting the outcome of such studies that the responses are not confirmed.∙To be assigned a status of PR or CR, changes in tumor measurements must be confirmed by repeat assessments that should be performed no less than 4 weeks after the criteria for response are first met. Longer intervals as determined by the study protocol may also be appropriate.∙In the case of SD, follow-up measurements must have met the SD criteria at least once after study entry at a minimum interval (in general, not less than 6-8 weeks) that is defined in the study protocolDuration of overall response∙The duration of overall response is measured from the time measurement criteria are met for CR or PR (whichever status is recorded first) until the first date that recurrence or PD is objectively documented, taking as reference for PD the smallest measurements recorded s ince the treatment started.Duration of stable disease∙SD is measured from the start of the treatment until the criteria for disease progression are met, taking as reference the smallest measurements recorded since the treatment started.∙The clinical relevance of the duration of SD varies for different tumor types and grades. Therefore, it is highly recommended that the protocol specify the minimal time interval required between two measurements for determination of SD. This time interval should take into account the expected clinical benefit that such a status may bring to the population under study.Response review∙For trials where the response rate is the primary endpoint it is strongly recommended that all responses be reviewed by an expert(s) indepen dent of the study at the study’s completion. Simultaneous review of the patients’ files and radiological images is the best approach.Reporting of results∙All patients included in the study must be assessed for response to treatment, even if there are ma jor protocol treatment deviations or if they are ineligible. Each patient will be assigned one of the following categories: 1) complete response, 2) partial response, 3) stable disease, 4) progressive disease, 5) early death from malignant disease, 6) early death from toxicity, 7) early death because of other cause, or 9) unknown (not assessable, insufficient data).∙All of the patients who met the eligibility criteria should be included in the main analysis of the response rate.Patients in response categories 4-9 should be considered as failing to respond to treatment (disease progression).Thus, an incorrect treatment schedule or drug administration does not result in exclusion from the analysis of the response rate. Precise definitions for categories 4-9 will be protocol specific.∙All conclusions should be based on all eligible patients.∙Subanalyses may then be performed on the basis of a subset of patients, excluding those for whom major protocol deviations have been identified (e.g., early death due to other reasons, early discontinuation of treatment, major protocol violations, etc.). However, these subanalyses may not serve as the basi s for drawing conclusions concerning treatment efficacy, and the reasons for excluding patients from the analysis s hould be clearly reported.∙The 95% confidence intervals should be provided.。

生物科学领域毕业论文范文在生物科学领域的毕业论文范文中,需要遵循科学论文的基本结构和格式,包括主题引言、材料与方法、结果与讨论以及结论等部分。
以下是一个例子供参考:生物科学领域毕业论文范文一、引言生物科学是研究生物体结构、功能和进化等方面的科学领域。
在这个领域的研究中,我们经常需要运用实验方法和理论分析来解决各种生物学问题。
本论文旨在探讨植物光合作用对光强变化的响应机制,以期增加对光合作用的理解,并为农业生产和环境保护提供参考。
二、材料与方法2.1 实验对象本研究使用了普通大豆(Glycine max)作为实验对象。
实验采用相同的营养底物和生长条件,以确保实验结果的可比性。
2.2 实验设计将普通大豆分为三组,分别置于不同光强的环境中,分别为高光强组、中光强组和低光强组。
每组重复三次,以减小可能的随机误差。
2.3 数据采集与分析利用光合速率测定仪对不同光强下的光合作用速率进行测定。
通过采集数据并运用统计学方法,对不同光强下的光合作用速率进行比较和分析。
三、结果与讨论3.1 光合作用速率的变化结果显示,在较低光强下,植物的光合作用速率较低;而在较高光强下,光合作用速率较高。
这表明光合作用速率与光强呈正相关关系。
此外,光合作用速率在中等光强下也呈现适当的水平。
3.2 光合作用对光强变化的响应机制通过分析实验结果,推测光合作用对光强变化的响应机制包括光系统II的光化学反应和光系统I的电子传递。
较低光强下,光系统II的光化学反应相对较弱,限制了光合作用速率的提高。
而在较高光强下,光系统I的电子传递速率加快,进一步促进了光合作用速率的提升。
四、结论本研究结果表明光合作用速率与光强呈正相关关系,并揭示了光合作用对光强变化的响应机制。
这对于农业生产和环境保护具有重要意义,可以为优化光合作用的利用以提高农作物产量和调控生态系统提供科学依据。
参考文献:[1] Smith A, Johnson B. The effects of light intensity on photosynthesisin soybean plants. J Agric Sci. 2000;138(4):457-463.[2] Brown C, Williams G. Responses of photosynthesis and stomatal conductance of soybean plants grown under different light intensities. Photosynthetica. 2005;43(2):285-289.请注意以上范文仅供参考,并不代表真实研究结果。
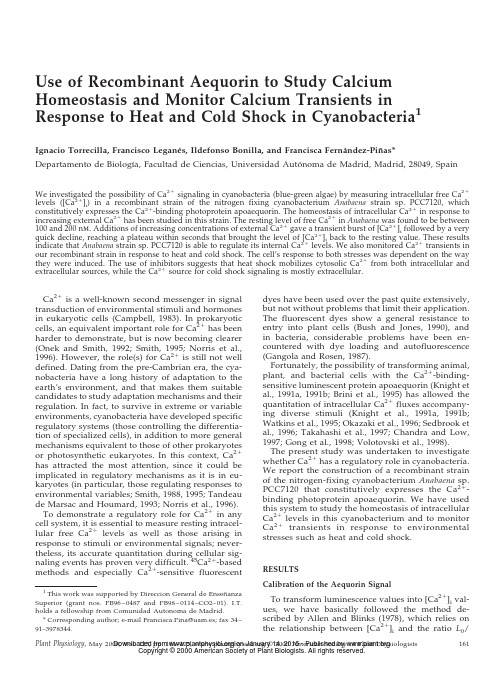
Use of Recombinant Aequorin to Study Calcium Homeostasis and Monitor Calcium Transients in Response to Heat and Cold Shock in Cyanobacteria1Ignacio Torrecilla,Francisco Legane´s,Ildefonso Bonilla,and Francisca Ferna´ndez-Pin˜as*Departamento de Biologı´a,Facultad de Ciencias,Universidad Auto´noma de Madrid,Madrid,28049,SpainWe investigated the possibility of Ca2ϩsignaling in cyanobacteria(blue-green algae)by measuring intracellular free Ca2ϩlevels([Ca2ϩ]i)in a recombinant strain of the nitrogen fixing cyanobacterium Anabaena strain sp.PCC7120,which constitutively expresses the Ca2ϩ-binding photoprotein apoaequorin.The homeostasis of intracellular Ca2ϩin response to increasing external Ca2ϩhas been studied in this strain.The resting level of free Ca2ϩin Anabaena was found to be between 100and200n m.Additions of increasing concentrations of external Ca2ϩgave a transient burst of[Ca2ϩ]i followed by a very quick decline,reaching a plateau within seconds that brought the level of[Ca2ϩ]i back to the resting value.These results indicate that Anabaena strain sp.PCC7120is able to regulate its internal Ca2ϩlevels.We also monitored Ca2ϩtransients in our recombinant strain in response to heat and cold shock.The cell’s response to both stresses was dependent on the way they were induced.The use of inhibitors suggests that heat shock mobilizes cytosolic Ca2ϩfrom both intracellular and extracellular sources,while the Ca2ϩsource for cold shock signaling is mostly extracellular.Ca2ϩis a well-known second messenger in signal transduction of environmental stimuli and hormones in eukaryotic cells(Campbell,1983).In prokaryotic cells,an equivalent important role for Ca2ϩhas been harder to demonstrate,but is now becoming clearer (Onek and Smith,1992;Smith,1995;Norris et al., 1996).However,the role(s)for Ca2ϩis still not well defined.Dating from the pre-Cambrian era,the cya-nobacteria have a long history of adaptation to the earth’s environment,and that makes them suitable candidates to study adaptation mechanisms and their regulation.In fact,to survive in extreme or variable environments,cyanobacteria have developed specific regulatory systems(those controlling the differentia-tion of specialized cells),in addition to more general mechanisms equivalent to those of other prokaryotes or photosynthetic eukaryotes.In this context,Ca2ϩhas attracted the most attention,since it could be implicated in regulatory mechanisms as it is in eu-karyotes(in particular,those regulating responses to environmental variables;Smith,1988,1995;Tandeau de Marsac and Houmard,1993;Norris et al.,1996). To demonstrate a regulatory role for Ca2ϩin any cell system,it is essential to measure resting intracel-lular free Ca2ϩlevels as well as those arising in response to stimuli or environmental signals;never-theless,its accurate quantitation during cellular sig-naling events has proven very difficult.45Ca2ϩ-based methods and especially Ca2ϩ-sensitive fluorescent dyes have been used over the past quite extensively, but not without problems that limit their application. The fluorescent dyes show a general resistance to entry into plant cells(Bush and Jones,1990),and in bacteria,considerable problems have been en-countered with dye loading and autofluorescence (Gangola and Rosen,1987).Fortunately,the possibility of transforming animal, plant,and bacterial cells with the Ca2ϩ-binding-sensitive luminescent protein apoaequorin(Knight et al.,1991a,1991b;Brini et al.,1995)has allowed the quantitation of intracellular Ca2ϩfluxes accompany-ing diverse stimuli(Knight et al.,1991a,1991b; Watkins et al.,1995;Okazaki et al.,1996;Sedbrook et al.,1996;Takahashi et al.,1997;Chandra and Low, 1997;Gong et al.,1998;Volotovski et al.,1998).The present study was undertaken to investigate whether Ca2ϩhas a regulatory role in cyanobacteria. We report the construction of a recombinant strain of the nitrogen-fixing cyanobacterium Anabaena sp. PCC7120that constitutively expresses the Ca2ϩ-binding photoprotein apoaequorin.We have used this system to study the homeostasis of intracellular Ca2ϩlevels in this cyanobacterium and to monitor Ca2ϩtransients in response to environmental stresses such as heat and cold shock.RESULTSCalibration of the Aequorin SignalTo transform luminescence values into[Ca2ϩ]i val-ues,we have basically followed the method de-scribed by Allen and Blinks(1978),which relies on the relationship between[Ca2ϩ]i and the ratio L0/1This work was supported by Direccion General de Ensen¯anza Superior(grant nos.PB96–0487and PB98–0114–CO2–01).I.T. holds a fellowship from Comunidad Autonoma de Madrid.*Corresponding author;e-mail Francisca.Pina@uam.es;fax34–91–3978344.L max ,where L 0,the light intensity at time intervals of 1s,is obtained by integrating the luminometer out-put (in millivolts)over these 1-s intervals,and L max is defined as the sum of all L 0values from that interval to the end of the experiment.As aequorin is being consumed continuously,the value of L max is not con-stant and decreases steadily during the experiment.The relationship between the ratio (L 0/L max )and [Ca 2ϩ]i has been modeled mathematically (Allen et al.,1976).The model (model B)is based on the as-sumptions that each of the sites to which Ca 2ϩbinds has two states,T and R,which are in equilibrium,and that light is emitted by the molecule only when all sites are in the R state.The model contains three parameters:K R ,the equi-librium association constant;K TR ϭ[T]/[R];and n ,the number of Ca 2ϩ-binding sites of the molecule.Figure 1shows the calibration curves obtained at different temperatures (44°C,28°C,and 10°C)of re-combinant aequorin from cell lysates of Anabaena strain sp.PCC7120calculated according to thismodel.Experimental data were obtained by mixing a solution containing the recombinant aequorin with solutions containing different [Ca 2ϩ]that give de-fined pCa values in the final solutions,as described in “Materials and Methods.”The data plotted in Figure 1were used to fit a theoretical curve based on the model mentioned above,obtaining the best val-ues for parameters K R ,K TR ,and n .Fitting was made using a computer routine designed to use the Marquardt-Levenberg algorithm (Marquardt,1963).The values obtained in this way for the control curve at 28°C (K R ϭ7ϫ106m Ϫ1;K TR ϭ118;and n ϭ3)for the fitting of the [Ca 2ϩ]/(L 0/L max )relationship of recombinant aequorin are the same as those found by Allen et al.(1976)with purified aequorin from Ae-quorea ,and very similar to those obtained by Brini et al.(1995)(K R ϭ7.23ϫ106m Ϫ1;K TR ϭ120;and n ϭ2.99)using recombinant aequorin from transformed HeLa cells.The influence of temperature on the Ca 2ϩcalibra-tion curves,as shown in Figure 1,indicates that warming induces a slight acceleration of the lumines-cent reaction that is somewhat more pronounced at the lower end of the curve (nanomolar range);as also shown in the figure,cooling has the opposite effect.The calibration curves at different temperatures al-lowed us to obtain much more accurate data from the heat and cold shock experiments.The calibration curves shown in the figure also indicate that the aequorin isoform used for transfor-mation is very sensitive,since the dose-response curve begins below a pCa of 7(around 100n m free Ca 2ϩ)and is saturated well above pCa 5(around 10m free Ca 2ϩ).All in vivo Ca 2ϩmeasurements were performed at least three times,and the results were highly reproducible.A representative trace from the replicates was taken for each experiment and is rep-resented in the figures.Luminescence values were transformed into calibrated [Ca 2ϩ]i using the appro-priate calibration curve according to the temperature needed for the experiment (Fig.1);as an example,Figure 2B (see below)presents the transformation in free Ca 2ϩ(micromolar)of the luminescence data pre-sented in Figure 2A.As shown by Figure 2A,the final consumption of aequorin was never greater than 6%to 10%of total (the area occupied by the Ca 2ϩ/Triton discharge at the end of measurements comprised about 90%to 94%of the total signal)in our experi-ments,except when 10m m Ca 2ϩand 5m A23187were used (see below)and around 28%of aequorin was consumed (the total Ca 2ϩ/Triton discharge at the end of measurement of about 72%).However,in the latter case,the fact that the ionophore at such concentration in the presence of 10m m Ca 2ϩdid not completely discharge the photoprotein is difficult to explain unless,under our experimental conditions,this ionophore concentration does not have a full effect on the cyanobacterialcells.Figure 1.Calibration of recombinant aequorin luminescence at dif-ferent temperatures (44°C,28°C,and 10°C).The recombinant ae-quorin cell lysate (50L)at the appropriate temperature was mixed with 950L of the Ca 2ϩbuffer at the appropriate temperature (see “Materials and Methods”for details).The shown continuous curves correspond to the best fit of the experimental data to model B of Allen et al.(1976)as detailed in “Results.”Torrecilla et al.Studies on the Regulation of Intracellular Free Ca 2؉Levels ([Ca 2؉]i )by Anabaena Strain sp.PCC7120A fundamental requirement for Ca 2ϩ-mediated regulation is the ability of the species in question to regulate intracellular free Ca 2ϩlevels.Considering the cytotoxic effects of excess Ca 2ϩ,all cells are likely to possess a means of keeping their background free Ca 2ϩlevels very low,thus maintaining a Ca 2ϩcon-centration gradient across the cell membrane.We therefore studied the ability of Anabaena cells to reg-ulate internal free Ca 2ϩlevels in response to increas-ing external Ca 2ϩconcentrations.As Figure 2B shows,external additions of 10m ,100m,and 1m m CaCl 2gave a transient burst of intracellular free Ca 2ϩ,followed by a very quick de-cline (fast phase of recovery),reaching a plateau within seconds that brought the level of intracellular free Ca 2ϩback to the resting value (slow phase of recovery).To rule out the possibility that the ob-served spikes could be due to a discharge of aequorin released into the medium by lysed cells or by lysis of cells upon addition of Ca 2ϩ,we measured lumines-cence after the addition of Ca 2ϩto the medium inwhich reconstituted cells were present after remov-ing cells by centrifugation,and found no lumines-cence signal.We also measured phycobiliproteins in the supernatant with negative results,indicating that the Ca 2ϩtransients were not due to cell lysis.The resting value of [Ca 2ϩ]i was found to be between 100and 200n m .These results indicate that Anabaena is apparently able to regulate its internal free Ca 2ϩlevels.To confirm that the observed intracellular response was specific to external Ca 2ϩadditions,we treated cells with the Ca 2ϩionophore calcimycin (A23187)and with the Ca 2ϩchelator EGTA.Treatment with calcimycin resulted in larger spikes of intracellular Ca 2ϩcompared with controls when cells were chal-lenged with increasing external Ca 2ϩ;in addition,the Ca 2ϩtransients in the presence of the ionophore were longer lived (Fig.3A).On the contrary,EGTA inhib-ited the response and the only elevation of internal free Ca 2ϩlevels occurred when the concentration of external Ca 2ϩwas higher (1m m )than the concentra-tion of EGTA used (500m )(Fig.3B).We checked the pH of the EGTA-containing mediumthroughoutFigure 2.Effect of external Ca 2ϩconcentration on the regulation of Anabaena [Ca 2ϩ]i .Cell sus-pensions expressing apoaequorin were reconsti-tuted with coelenterazine,as described in “Ma-terials and Methods.”Coelenterazine-treated cells (0.5mL)were placed in a luminometer cuvette,and luminescence was recorded every 1s.CaCl 2was injected in the sample at the times indicated to give external Ca 2ϩconcen-trations of 10M ,100M ,and 1m M .At the end of the experiment,0.5mL of 100m M CaCl 2and 5%(v/v)Triton X-100was added to discharge the remaining aequorin.A,Light emission of the recombinant aequorin (in mV).In the inset,the asterisk indicates the peak area comprising the remaining aequorin discharge by the addition of an equal volume of 100m M CaCl 2and 5%Triton X-100.B,Calculated [Ca 2ϩ]i values ob-tained using the calibration curve depicted in Figure 2.These experiments were repeated 15times,and the traces represented have been chosen to best represent the average result.Use of Recombinant Aequorin to Monitor Ca 2ϩTransients in Cyanobacteriathe experiment and found no significant lowering of the medium pH (already buffered at pH 7.2)when Ca 2ϩwas added (not shown).The results with the Ca 2ϩagonist (ionophore)and the Ca 2ϩantagonist (chelator)show that the observed intracellular Ca 2ϩtransients are indeed a response to challenge with external Ca 2ϩand that influx of Ca 2ϩfrom the extra-cellular space occurs.The presence of a Ca 2ϩhomeostat in a cell system implies the existence of mechanisms of Ca 2ϩregula-tion that control influx and efflux through the mem-brane.In cyanobacteria,Ca 2ϩinflux may involve low passive permeability and/or Ca 2ϩ-sensitive channels as those described for eukaryotic cells.To investigate that,we used the plasma membrane Ca 2ϩ-channel blockers verapamil and La 3ϩ(Fig.4).The organic blocker verapamil (Fig.4A)did not inhibit the Ca 2ϩtransients induced by increasing the external Ca 2ϩconcentration.However,with the higher concentra-tion (500m ),after the initial rapid decline in [Ca 2ϩ]i ,basal levels were not approached,and instead re-mained quite high (between 0.5and 1m ).In the lysate assay we found that verapamil at the concen-trations indicated in Figure 4A did not affect the response of aequorin (not shown).La 3ϩ(1m m but not 100m )directly stimulated the luminescence of aequorin in our lysate assay (not shown),which should explain why 1m m La 3ϩevoked a significant elevation of the resting levels of [Ca 2ϩ]i even before CaCl 2was injected into the sam-ple (Fig.4B).La 3ϩ(100m )did not stimulate ae-quorin in the lysate assay;in fact,as shown in Figure 4B,the resting level of Ca 2ϩbefore the additionofFigure 3.Effect of the Ca 2ϩionophore calcimycin (compound A23187)and the Ca 2ϩchelator EGTA on the regulation of Anabaena [Ca 2ϩ]i .A,Effect of preincubation for 15min in 1M (‚)or 5M (E )calcimycin on intracellular Ca 2ϩtransients induced by increasing external Ca 2ϩconcentrations compared with the control (Ⅺ).B,Effect of preincubation for 15min in 500M EGTA (Œ)on intracel-lular Ca 2ϩtransients compared with the control (Ⅺ).CaCl 2was injected in the sample when indicated by the arrows.These experi-ments were repeated 10times,and the traces represented have been chosen to best represent the averageresult.Figure 4.Effect of plasma membrane Ca 2ϩchannel blockers vera-pamil and La 3ϩ(LaCl 3)on the regulation of Anabaena [Ca 2ϩ]i .A,Effect of preincubation for 30min in 200M (‚)or 500M (E )verapamil on intracellular Ca 2ϩtransients induced by increasing external Ca 2ϩconcentrations compared with the control (Ⅺ).B,Effect of preincubation for 20min in 100M (‚)or 1m M (E )LaCl 3on intracellular Ca 2ϩtransients induced by increasing external Ca 2ϩconcentrations compared with the control (Ⅺ).CaCl 2was injected in the sample when indicated by the arrows.These experiments were repeated 10times,and the traces represented have been chosen to best represent the average result.Torrecilla et al.CaCl 2was not modified by this concentration of La 3ϩ;the addition of CaCl 2to cells treated with 100m of La 3ϩprovoked a significant and apparently uncontrolled elevation of the levels of [Ca 2ϩ]i .In response to increasing external Ca 2ϩconcentrations,Ca 2ϩinflux apparently does not depend on the acti-vation of verapamil-sensitive channels.Furthermore,La 3ϩat 100m provokes an uncontrolled increase in [Ca 2ϩ]I ,probably due to the fact that La 3ϩmay enter the cell and inhibit intracellular Ca 2ϩchannels and/or Ca 2ϩpumps (ATPases)needed to regulate the efflux of Ca 2ϩions.However,when the concen-tration of La 3ϩused was higher (1m m ),as shown by our lysate assay,the high levels of luminescence encountered in the in vivo assay could be due mostly to direct stimulation of aequorin by the ion.In connection with this effect of La 3ϩ,and as de-scribed above (Fig.2B),after the initial rise of intra-cellular Ca 2ϩ,there was a decline to homeostaticvalues.As already described,this decline appears to be a two-phase phenomenon and it is important to determine whether the fast or the slow phase of the decrease in [Ca 2ϩ]i is rectified by Ca 2ϩefflux (Ca 2ϩpumps and/or Ca 2ϩexchangers)and/or intracellu-lar binding by Ca 2ϩbinding proteins.To address this question,we treated the cells with the calmodulin inhibitor TFP (Fig.5A)and the Ca 2ϩ-exchanger in-hibitor diltiazem (Fig.5B).Treatment with TFP pro-voked a poor regulation of [Ca 2ϩ]i when cells were challenged with increasing external Ca 2ϩ;after the initial rise in [Ca 2ϩ]i ,the cells maintained throughout the experiment extremely high levels of [Ca 2ϩ]i and no decline was observed,suggesting an important role for Ca 2ϩ-binding proteins in Ca 2ϩhomeostasis in this cyanobacterium.In this context,one could reasonably expect the observed elevation of the rest-ing [Ca 2ϩ]i values caused by TFP.These findings are also supported by the fact that,in our lysate assay,TFP at the concentration indi-cated in Figure 5A did not affect the response of aequorin (not shown).Treatment with diltiazem also elevated the resting level,but had no effect on the initial rise of [Ca 2ϩ]i and the subsequent fast phase of recovery,although it impaired the slow phase of regulation of [Ca 2ϩ]i levels,as they never settled back to basal values.In the lysate assay,diltiazem at the concentration indicated in Figure 5B did not affect the response of aequorin (not shown).Thus,the effect of diltiazem,although not as pronounced as that of TFP,suggests that in vivo the Ca 2ϩelectroneutral exchangers also may have a role in allowing the return of [Ca 2ϩ]i to resting values.The combination of both systems,Ca 2ϩ-binding proteins and Ca 2ϩexchangers (we cannot rule out the possible role of Ca 2ϩpumps)possibly prevent excessive Ca 2ϩaccu-mulation and,thus,cell damage in cyanobacteria.Intracellular Free Ca 2؉Changes in Response to Heat ShockAs indicated in “Materials and Methods,”heat shock was applied either by immersing cell suspensions in a water bath at 44°C or by directly irrigating with hot water.In the first case,cells placed in a luminometer cuvette were heat-shocked at 44°C for periods up to 60min in a thermostated water bath,and cuvettes were removed at specific times to monitor lumines-cence (Fig.6A).As shown in the figure,continued heat shock treatment caused a significant increase in [Ca 2ϩ]i that lasted more than 30min and approached basal levels very slowly.Its magnitude increased from around 1.14Ϯ0.17m after 2min,to reach a maximum of 3.10Ϯ0.25m (n ϭ15)after 20min (see Fig.6A).After that time,no further increases in [Ca 2ϩ]i were observed;in fact,a gradual decrease to about 1.22Ϯ0.59m occurred after 60min (n ϭ15).To monitor the actual temperature of the cellsuspen-Figure 5.Effect of the calmodulin inhibitor TFP and the Ca 2ϩ-exchanger inhibitor diltiazem on the regulation of Anabaena [Ca 2ϩ]i .A,Effect of preincubation for 1h in 10M TFP (‚)on intracellular Ca 2ϩtransients induced by increasing external Ca 2ϩconcentrations compared with the control (Ⅺ).B,Effect of preincubation for 45min in 500M diltiazem (‚)on intracellular Ca 2ϩtransients induced by increasing external Ca 2ϩconcentrations compared with the control (Ⅺ).CaCl 2was injected in the sample when indicated by the arrows.These experiments were repeated eight times,and the traces repre-sented have been chosen to best represent the average result.Use of Recombinant Aequorin to Monitor Ca 2ϩTransients in Cyanobacteriasions in the water bath throughout the experiment and the temperature fluctuations in the cuvettes dur-ing the 15to 20s of luminescence measurement,thermocouples were introduced into blank cuvettes containing equal volumes and cell densities as those used for the luminescence assays,and temperatures were recorded continuously.Using these thermocouples,it took around 5min for the cell suspension to achieve 44°C,indicating that in a water bath,heating of the sample is a slowprocess.The temperature fluctuations in the cuvette during the 15to 20s of luminescence measurement was only 1°C and lasted around 50s (by 100s,the temperature had decreased around 3°C)(not shown).Thus,during the 15to 20s measurement in the luminometer,the temperature change is very small (only 1°C).Nonetheless,to determine whether this small decrease in temperature at such a specific rate could be responsible for the observed Ca 2ϩtransient,we measured the effect of cooling at that same rate from 28°C (regular growth temperature of Anabaena cells)to 27°C,26°C,and 25°C and found no observ-able intracellular Ca 2ϩincrease (not shown).There-fore,these measurements truly reflect a Ca 2ϩre-sponse to heat shock.During the course of the experiment,we did not observe cell lysis.When heat shock was applied by irrigation of cell suspensions with hot water at temperatures up to 65°C to allow the temperature of the cell suspensions to immediately increase from 28°C to 44°C,the na-ture of the Ca 2ϩtransient was different:injected hot water triggered two contiguous phases of Ca 2ϩre-lease that lasted for a total of about 3min (Fig.6B).The peak [Ca 2ϩ]i concentration was approximately 0.80Ϯ0.14m for the first pulse and 0.98Ϯ0.18m (n ϭ15)for the second.The first phase was very short and the second was bell-shaped,accounting for over 90%of the total duration of the transient.The control (the addition of water at 28°C)did not elicit such a response,although a much smaller Ca 2ϩtran-sient in magnitude (peak height of 0.40Ϯ0.10m [n ϭ6])and duration (approximately 20s)was ob-served.To rule out that this small transient could be due to a hypoosmotic shock caused by water,we injected growth medium (BG11)both at 65°C and at 28°C and essentially found the same results as those obtained with water (not shown).This small tran-sient could therefore represent a small mechanically induced Ca 2ϩincrease.Thermocouples introduced into blank cuvettes were also used to measure the temperature changes after direct irrigation with hot water or hot growth medium.We found that the actual temperature at the peak of the first phase of the Ca 2ϩtransient (observed 2–3s after irrigation)was already 44°C,so the change in temperature from 28°C to 44°C is almost instanta-neous.Also,the actual temperature at the peak of the second,bell-shaped Ca 2ϩtransient (observed around 50s from the irrigation)was 42°C,and only after 100s did the temperature decrease approximately 4°C to 40°C (not shown).As in the water bath experiment,we also checked whether those small decreases in temper-ature would account for the observed Ca 2ϩtransients and found that cooling Anabaena cells from 28°C to 27°C,26°C,and 25°C at that specific rate did not induce any observable intracellular Ca 2ϩincrease (not shown).Thus,the observed biphasic Ca 2ϩtransient might correspond to a sudden rise in temperature.Cell lysis was notobserved.Figure 6.Changes in [Ca 2ϩ]i in response to heat shock.A,Continued heat shock treatment (up to 60min)in a water bath at 44°C of coelenterazine-treated cells (f ).Cuvettes were removed from the water bath at specific times to monitor luminescence as described in “Materials and Methods.”Cells maintained in a water bath at 28°C were taken as the control (Ⅺ).Measurements were made maintaining an external Ca 2ϩconcentration of 0.25m M .B,Coelenterazine-treated cells were heat-shocked by injecting hot water at 65°C to achieve a final temperature of 44°C in the cuvette and luminescence recorded as described in “Materials and Methods”(f ).Cells irrigated with water at 28°C were taken as the control (Ⅺ).Measurements were made maintaining an external Ca 2ϩconcentration of 0.25m M .Experiments were repeated 15times and the error bars represent ϮSE (A).Experiments were repeated 15times,and the traces represented have been chosen to best represent the average result (B).The vertical arrow in B indicates the injection of hot water.Torrecilla et al.The described heat shock experiments were per-formed with an external Ca2ϩconcentration of0.25 m m(the standard Ca2ϩconcentration of the medi-um).An increase in the external Ca2ϩdid not pro-voke a concomitant increase in[Ca2ϩ]i in either case (data not shown).Control experiments to test the stability of recombinant aequorin to heat treatment showed that the total luminescence signal remained unchanged at44°C,although at temperatures of 50°C and over,40%of the signal was lost.Recombi-nant aequorin was therefore stable to high tempera-tures(up to44°C),and we believe that the changes shown in Figure6represent true changes in cytosolic free Ca2ϩ.Intracellular Free Ca2؉Levels in Response toCold ShockAs indicated in“Materials and Methods,”cold shock was applied either by immersing cell suspen-sions in a water bath at0°C or by directly irrigating with cold water.In the first case,cell suspensions placed in lumi-nometer cuvettes were immersed into a water bath at 0°C,removed at specific times,and luminescence recorded.Continued cold shock,applied in this way for up to60min,provoked a much smaller increase in[Ca2ϩ]i than continued heat shock with a maxi-mum magnitude of1.04Ϯ0.23(nϭ8)after10min (Fig.7A).The continued cold-shock-induced Ca2ϩtransient was also shorter in duration than the con-tinued heat-shock-induced Ca2ϩtransient.We found that when cells were incubated in the presence of higher external Ca2ϩconcentrations(5m m as shown in Fig.7A),there was a significant(Student’s t test, PϽ0.1)elevation in the Ca2ϩ-induced transient.This result was the opposite of that found with heat shock, after which higher external Ca2ϩconcentrations did not exert any significant effect.Thermocouples intro-duced into blank cuvettes showed that the cell sus-pensions reached a temperature of10°C after5min in the water bath at0°C and that by10min,the tem-perature of the cell suspension decreased even fur-ther to5°C(not shown).No cell lysis was observed at the end of the experiment.Cold shock applied by irrigation with ice-cold wa-ter induced two well-defined Ca2ϩtransients(Fig. 7B).The first Ca2ϩtransient was biphasic,showing two contiguous phases of Ca2ϩrelease that lasted for a total of3to4min,and was very similar to that found after heat shock by irrigation(Fig.6B).The second Ca2ϩtransient was slower and smaller in magnitude,lasting around7to8min.This second Ca2ϩtransient after cold shock is a clear difference from that induced by heat shock,since it was never observed under the latter conditions.For the biphasic Ca2ϩtransient,the peak Ca2ϩconcentration was ap-proximately1.27Ϯ0.22m for the first phase and approximately1.36Ϯ0.16m(nϭ8)for the second phase.The first phase was very short and the second bell-shaped phase accounted for over90%of the total duration of the transient.The peak height con-centration for the second,slower transient was around0.67Ϯ0.11m(nϭ8).The control,the addition of water at28°C,did not elicit such an increase in[Ca2ϩ]i,although,as already described for heat shock,a much smaller Ca2ϩtransient in magnitude(peak height of approximately0.40Ϯ0.10m[nϭ6])and duration(approximately20s)Figure7.Changes in[Ca2ϩ]i in response to cold shock.A,Contin-ued cold-shock treatment(up to60min)in a water bath at0°C of coelenterazine-treated cells incubated with increasing external Ca2ϩconcentrations(E,5m M Ca2ϩ;F,0.25m M Ca2ϩ).Cuvettes were removed from the water bath at specific times to monitor lumines-cence as described in“Materials and Methods.”Cells maintained in a water bath at28°C were taken as the control(Ⅺ).B,Coelenterazine-treated cells incubated with increasing external Ca2ϩconcentrations (E,1m M Ca2ϩ;F,0.25m M Ca2ϩ)were cold-shocked by injecting ice-cold water to achieve a final temperature of10°C in the cuvette and luminescence recorded as described in“Materials and Methods.”Cells irrigated with water at28°C were taken as the control(Ⅺ). Experiments were repeated eight times and error bars representϮSE (A).Experiments were repeated eight times,and the traces represented have been chosen to best represent the average result(B).The vertical arrow in B indicates the injection of cold water.Use of Recombinant Aequorin to Monitor Ca2ϩTransients in Cyanobacteria。

山东农业大学学报(自然科学版),2024,55(2):146-152Journal of Shandong Agricultural University ( Natural Science Edition )VOL.55 NO.2 2024 doi:10.3969/j.issn.1000-2324.2024.02.002“东西成垄,一垄一行,弓背朝南”栽培对草莓生长与品质的影响孙楠1,2,张一诺1,2,柏尧非1,2,薛俊龙3,宫明永3,赵林3,李玲1,2*,肖伟1,2*1. 山东农业大学园艺科学与工程学院,山东泰安 2710182. 山东省果蔬优质高效生产协同创新中心,山东泰安 2710183. 山东省创新发展研究院,山东济南 250012摘要:为了确定东西垄单行栽植模式在草莓生产中应用的可能性,以草莓品种‘雪里香’和‘雪沁香’为试材,研究了东西垄单行和南北垄双行两种栽培模式对草莓植株表型、光合特性、果实品质及产量的影响。
结果表明:东西垄单行栽植叶面积、根系活力、根直径显著优于南北垄双行栽植,而株高和叶柄长则相反;叶绿素含量、光合速率、蒸腾速率、气孔导度、二氧化碳(CO2)浓度均在不同程度上高于南北垄双行栽植,且表现稳定;东西垄单行栽植显著提升了草莓果实可溶性糖、可溶性固形物及可溶性蛋白的含量,并在一定程度上降低了可滴定酸含量。
综合来看,东西垄单行栽植显著促进了草莓植株生长,提高了产量和品质。
本研究对关键词:草莓;东西垄单行;生长发育;品质;产量中图法分类号:S668.4文献标识码: A文章编号:1000-2324(2024)02-0146-07 Cultivation of "East-west Ridge, One-row Row, Bow-back Facing South" on Growth and Quality of StrawberrySUN Nan1,2, ZHANG Yi-nuo1,2, BAI Y ao-fei1,2, XUE Jun-long3, GONG Ming-yong3, ZHAO Lin3, LI Ling1,2*, XIAO Wei1,2*1. College of Horticulture Science and Engineering/Shandong Agricultural University, Tai'an 271018, China2. Shandong Collaborative Innovation Center for High-quality and Efficient Production of Fruits and Vegetables, Tai 'an Shandong 271018, China3. Shandong Institute of Innovation and Development, Jinan 250012, ChinaAbstract: In order to determine the application possibility of the east and west ridge single row planting model in strawberry production, we studied the effects of single row planting model in east and west ridge and double row planting model innorth and south ridge on plant phenotype, photosynthetic characteristics, fruit quality and yield of strawberry using 'Xuelixiang' and 'Xueqinxiang' as experimental materials. The results showed that the leaf area, root activity and root diameter of east-west row planting were significantly better than those of north-south row planting, but the plant height and petiole length were opposite. The chlorophyll content, photosynthetic rate, transpiration rate, stomatal conductance andcarbon dioxide (CO2) concentration were higher than those of the two-row planting in north and south rows, and the results were stable. The contents of soluble sugar, soluble solid matter and soluble protein of strawberry fruit were significantly increased, and the titrable acid content was decreased to some extent. east and west ridge single row planting model promote the growth of strawberry plants, and improve the yield and quality of strawberry, our study has significant effect on improving quality and efficiency, changing planting concept, promoting strawberry intensive production and reducing production cost.Keywords: Strawberry; east-west ridge single line; growth and development; quality; yield草莓(Fragaria×ananassa Duch.)为蔷薇科多年生草本植物。
收稿日期:2007-12-28基金项目:国家杰出青年基金(30225012);山东省中青年科学家奖励基金(2005BS B01177)作者简介:王建林(1976-),男,河北唐山人,副教授,博士,硕士生导师,主要从事植物生理生态方面研究。
通讯作者:于贵瑞(1959-),男,辽宁大连人,研究员,博士,主要从事水碳循环研究。
光和CO 2作用下C 3和C 4作物气孔导度-光合速率耦合关系的差异王建林1,林荣芳1,于贵瑞2,房全孝1,姜德锋1,齐 华3,王秋凤2,李举华1,刘兆丽1(1.青岛农业大学,山东青岛 266109;2.中国科学院地理科学与资源研究所,北京 100101;3.沈阳农业大学,辽宁沈阳 110161) 摘要:气孔控制着光合作用和蒸腾作用两个相互耦合的过程,气孔导度与光合速率的耦合关系是理解陆地生态系统碳循环和水循环及其耦合关系的基础。
利用LI 26400光合仪控制光强和C O 2浓度变化,分析了C 3和C 4作物气孔导度-光合速率耦合关系的差异。
结果表明:即使C O 2浓度变化条件下,Ball 2Berry 模型也能很好地模拟气孔导度与光合速率二者的耦合关系。
气孔导度与净光合速率之间的耦合系数体现了不同作物之间水-碳交换比例的差异,反映了气孔限制和内部生理生化过程限制在不同作物上所占的比例。
由于该系数在C 3作物和C 4作物之间存在明显差异,C 3作物中,陆生C 3作物和水生C 3作物也存在一定差异,因此作物的生态功能类型可以大体划分为3类:C 4作物、陆生C 3作物和水生C 3作物。
这种生态功能类型的划分为提高碳循环、水循环以及水碳耦合循环模型在区域尺度上应用的精度是有益的。
关键词:C 3作物;C 4作物;气孔导度;光合速率;生态功能型中图分类号:Q945 文献标识码:A 文章编号:1000-7091(2008)01-0071-04V ariations in R elationship Betw een Stomotal Conductance and PhotosynthesisR ate in C 3and C 4Crops under Different Light and CO 2ConditionsWANGJian 2lin 1,LI N R ong 2fang 1,Y U G ui 2rui 2,FANG Quan 2xiao 1,J I ANG De 2feng 1,QI Hua 3,WANG Qiu 2feng 2,LI Ju 2hua 1,LI U Zhao 2li 1(1.Qingdao Agricultural University ,Qingdao 266109,China ;2.Institute of G eographic Sciencesand Natural res ources Research ,Chinese Academy of Sciences ,Beijing 100101,China ;3.Shenyang Agricultural University ,Shenyang 110161,China )Abstract :The coupled processes of leaf photosynthesis and transpiration are controlled by stom otal ,and the relation 2ship between stom otal conductance and photosynthesis rate is the basis of understanding carbon and water cycle in terres 2trial ecosystem.The differences in the relationship between stom otal conductance and photosynthesis rate in C 3and C 4plant species were studied under controlled light density and C O 2concentration by LI 26400P ortable Photosynthesis Sys 2tem.The results showed :Ball 2Berry m odel can reas onably simulate the relation between stom otal conductance and photo 2synthesis rate even under various C O 2concentration conditions.The coefficient between stom otal conductance and photo 2synthesis rate revealed the difference in the ratio of water 2carbon exchange ,and in the limitations of stom otal and inter physiochemical processes between the different crop types.Because obvious differences in the coefficient between stom otal conductance and photosynthesis rate were found between C 3and C 4crops ,and between terricolous and aquicolous C 3crops ,the crop ecotype can be generally distinguished three types :C 4,terricolous and aquicolous C 3crops.The differentia 2tion of crop ecotype will im prove the accuracy in m odeling carbon and water cycle in regional scale.K ey w ords :C 3crop ;C 4crop ;Stom otal conductance ;Photosynthesis rate ;Ecotype华北农学报・2008,23(1):71275 研究生态系统碳水循环关键过程的耦合关系及其相互作用机制是认识生态系统与大气间气体和能量交换的基础[1]。

江苏农业学报(JiangsuJ.ofAgr.Sci.)ꎬ2023ꎬ39(2):423 ̄433http://jsnyxb.jaas.ac.cn樊玉春ꎬ李㊀玥ꎬ魏霖静ꎬ等.三种胡麻生长模型对现蕾期和青果期干旱胁迫响应能力的比较[J].江苏农业学报ꎬ2023ꎬ39(2):423 ̄433.doi:10.3969/j.issn.1000 ̄4440.2023.02.015三种胡麻生长模型对现蕾期和青果期干旱胁迫响应能力的比较樊玉春1ꎬ㊀李㊀玥2ꎬ㊀魏霖静2ꎬ㊀赵㊀霞2ꎬ㊀周㊀慧2(1.甘肃农业大学理学院ꎬ甘肃兰州730070ꎻ2.甘肃农业大学信息科学技术学院ꎬ甘肃兰州730070)收稿日期:2022 ̄06 ̄15基金项目:国家自然科学基金项目(32060437㊁31360315)ꎻ甘肃农业大学青年导师基金项目(GAU ̄QDFC ̄2020 ̄12)ꎻ甘肃省自然科学基金项目(18JR3RA165)作者简介:樊玉春(1997-)ꎬ男ꎬ河北张家口人ꎬ硕士研究生ꎬ研究方向为应用统计大数据分析ꎮ(E ̄mail)245309763@qq.com通讯作者:李㊀玥ꎬ(E ̄mail)liyue@gsau.edu.cn㊀㊀摘要:㊀本研究利用不同胡麻品种㊁不同干旱程度的大田试验数据ꎬ检验㊁评估3种作物模型干旱胁迫效应算法的精确性ꎬ及其在现蕾期㊁青果期干旱胁迫处理下对胡麻蒸腾速率㊁气孔导度㊁叶面积指数及籽粒产量4个指标的模拟预测能力ꎮ模拟结果表明ꎬ干旱胁迫使胡麻蒸腾速率㊁气孔导度㊁叶面积指数和籽粒产量降低ꎮ3种作物模型干旱胁迫效应算法可以模拟出胡麻生理生化指标在各干旱处理下的变化趋势ꎬ但模拟效果不够理想ꎮ3种干旱胁迫效应算法均低估了籽粒产量ꎮ综合考虑ꎬWOFOST模型干旱胁迫效应算法对籽粒产量㊁蒸腾速率的模拟效果最好ꎬAPSIM模型干旱胁迫效应算法对气孔导度的模拟效果最好ꎬDSSAT模型干旱胁迫效应算法对叶面积指数的模拟效果最好ꎮ关键词:㊀胡麻ꎻ作物生长模型ꎻ干旱胁迫ꎻ现蕾期ꎻ青果期中图分类号:㊀S565.3㊀㊀㊀文献标识码:㊀A㊀㊀㊀文章编号:㊀1000 ̄4440(2023)02 ̄0423 ̄11ComparisonofresponsivenessofthreeoilflaxgrowthmodelstodroughtstressatbuddingstageandgreenfruitstageFANYu ̄chun1ꎬ㊀LIYue2ꎬ㊀WEILin ̄jing2ꎬ㊀ZHAOXia2ꎬ㊀ZHOUHui2(1.CollegeofScienceꎬGansuAgriculturalUniversityꎬLanzhou730070ꎬChinaꎻ2.CollegeofInformationScienceandTechnologyꎬGansuAgriculturalUni ̄versityꎬLanzhou730070ꎬChina)㊀㊀Abstract:㊀Inthisstudyꎬtheaccuracyofdroughtstressalgorithmsofthreecropmodelsandtheirabilitytosimulateandpredictfourindicatorsoftranspirationrateꎬstomatalconductanceꎬleafareaindexandseedyieldofoilflaxunderdroughtstressatgreenfruitstageandbuddingstageweretestedandevaluatedusingdatafromfieldtrialswithdifferentoilflaxvarietiesanddifferentdroughtlevels.Thesimulationresultsshowedthatdroughtstressreducedtranspirationrateꎬstom ̄atalconductanceꎬleafareaindexandseedyield.Thedroughtstressalgorithmsofthreecropmodelscouldsimulatethechangetrendsofphysiologicalandbiochemicalindicesofoilflaxundereverydroughttreatmentꎬbutthesimulationwasnotsatisfactory.Allthreedroughtstressalgorithmsunderestimatedtheseedyield.TheresultsindicatedthatthedroughtstressalgorithmofWOFOSTmodelhadthebestperformanceonthesimulationofseedyieldandtranspirationrateꎬthedroughtstressalgorithmofAPSIMmodelhadthebestperformanceonthesimulationofstomatalconductanceꎬandthedroughtstressalgorithmofDSSATmodelhadthebestperformanceonthesimulationofleafareaindex.Keywords:㊀oilflaxꎻcropgrowthmodelꎻdroughtstressꎻbuddingstageꎻgreenfruitstage㊀㊀在气候变化的大背景下ꎬ水资源短缺ꎬ干旱是世界粮食安全面临的严重威胁[1]ꎬ且全世界迎来水供应324缺乏问题ꎬ以及未来粮食需求的增加可能会使干旱更加严重ꎮ大量研究结果表明ꎬ现蕾期㊁青果期干旱胁迫会对胡麻生长发育㊁器官生成㊁籽粒产量造成不利影响[2]ꎮ胡麻因其抗旱性强㊁抗寒性强㊁耐瘠薄的特点成为了干旱地区重要的经济油料作物ꎬ且越来越受到崇尚健康自然的现代消费者青睐[3]ꎮ干旱是威胁胡麻产量的主要因素ꎬ因此ꎬ准确预估作物模型对干旱胁迫下胡麻生长的模拟效果具有重大意义ꎮ作物生长模型是探索全球气候变化背景下作物生产力响应特征及制订相应措施的重要工具[4]ꎮ康佳等[5]基于APSIM模型通过控制不同程度干旱胁迫来评估胡麻生理生化及产量对干旱胁迫的响应ꎬ发现该模型具有较高的可行性ꎮ李玥等[6]采用水驱动作物模型AquaCropꎬ模拟㊁验证胡麻在不同灌溉水平下的生长情况ꎬ发现与低灌溉量处理相比ꎬ该模型在强化灌溉处理下模拟的胡麻产量更准确ꎬ且FAO水作物驱动模型具有更高的模拟精度ꎮ何丽等[2]发现ꎬ胡麻现蕾期的生物产量㊁气孔导度㊁蒸腾速率㊁叶绿素荧光参数等指标与干旱胁迫相关联ꎮ对干旱胁迫的定义虽然简单ꎬ但要在建立的作物模型中抽象表达多种干旱胁迫效应算法较为困难ꎮ陈先冠等[7]利用吴桥县小麦数据测试了SWC㊁AT/PT㊁WS/WD3种干旱胁迫模型的表现ꎬ结果发现这3种干旱胁迫模型对年间水分胁迫因子模拟变化相同ꎬ模拟值与实测值相差较小ꎬ但没有合理模拟出水分亏缺的发生时间和严重程度ꎮ姚宁等[8]利用连续2季旱田冬小麦数据ꎬ通过DSSAT ̄GLUE模块获得不同的参数估计结果ꎬ对比确定冬小麦各生理指标模拟值与实测值的差异ꎬ结果表明该调参工具具有较好的可靠性和收敛性ꎬ但对生长前期的干旱胁迫模拟效果较差ꎬ无法准确模拟物候期随水分胁迫的变化ꎮ刘健等[9]创建新物候期干旱胁迫响应函数ꎬ更加明显表现出冬小麦物候期受干旱胁迫的影响ꎬ但未考虑物候期对春化作用的响应机制ꎮChen等[10]对比了2个研究地点不同灌溉情境下SWAT模型的植物干旱胁迫效应算法ꎬ结果发现在缺水灌溉情境下SWAT模型对叶面积指数(LAI)的模拟性能降低ꎬ并且对产量进行了误差较大的高估ꎮSaseendran等[11]研究了5个作物模型ꎬ结果发现这些作物模型都没能合理地模拟出蒸腾㊁碳同化㊁气孔导度和能量守恒的耦合过程ꎮ综上所述ꎬ目前较少有利用作物模型模拟干旱胁迫下胡麻生理指标与籽粒产量的相关研究ꎬ且缺少对胡麻现蕾期㊁青果期2个重要物候期的研究ꎮ因此ꎬ本研究拟通过比较3种作物生长模型干旱胁迫效应算法对胡麻蒸腾速率㊁气孔导度㊁叶面积指数和籽粒产量的模拟效果ꎬ分析明确各干旱胁迫效应算法的优缺点ꎬ以期为优化㊁改善干旱胁迫效应算法提供理论依据ꎮ1㊀材料与方法1.1㊀试验区域概况试验设在甘肃省兰州市榆中县(35ʎ85ᶄNꎬ104ʎ12ᶄE)ꎮ试验区为温带半干旱大陆性气候ꎬ各季节降水差异明显ꎻ该区域平均海拔高度2159mꎬ年均日照时数2562.5hꎻ年平均降水量300~400mmꎻ土壤为典型黄绵土ꎬ呈微碱性(pH为8 0~8 5)ꎮ播前0~30cm土层土壤有机质平均含量为8 47g/kgꎬ全氮㊁磷㊁钾含量分别为0 55g/kg㊁0 61g/kg㊁18 05g/kgꎬ速效磷㊁速效钾含量分别为10 19mg/kg㊁106 04mg/kgꎮ1.2㊀试验设计试验选用的胡麻品种为抗旱性较好的陇亚杂1号(LYZ1)㊁陇亚11号(LY11)ꎮ胡麻种子于2013年4月1日㊁2014年4月1日采用条播方式进行播种ꎬ试验采用双因素随机区组法ꎬ双因素分别为干旱时期和干旱胁迫程度ꎮ播种量为1个小区20gꎬ小区面积为3 20m2ꎬ行距20 00cmꎬ行长3 25mꎬ每个小区3行ꎬ3次重复ꎮ试验设置2个干旱时期ꎬ分别为现蕾期和青果期ꎬ干旱胁迫程度由土壤含水量决定ꎮ试验设置对照组(CK)和2个干旱胁迫处理组(T1㊁T2)ꎬ其土壤相对含水量分别为70%~80%㊁50%~60%㊁30%~40%ꎬ于干旱胁迫第3d㊁6d㊁9d㊁12d㊁15d㊁18d取样测定蒸腾速率(E)㊁气孔导度(Gs)㊁叶面积指数(LAI)ꎮ每个处理重复3次ꎮ灌水量用水表严格计量控制ꎬ除干旱胁迫处理时期外ꎬ其他所有时期提供充分灌溉ꎬ农事操作与一般大田相同ꎮ1.3㊀测定指标与测定方法选择胡麻的现蕾期和青果期的晴日上午(9:00-10:00)ꎬ当自然光的光照度为1000~1500μmol/(m2 s)时ꎬ使用Li ̄6800便携式光合仪测定蒸腾速率㊁气孔导度ꎬ使用LAI ̄2000冠层分析仪测定叶面积指数ꎮ成熟期采用室内考种的方法ꎬ按小区收获测定籽粒产量ꎮ424江苏农业学报㊀2023年第39卷第2期1.4㊀干旱胁迫效应算法1.4.1㊀APSIM模型干旱胁迫效应算法㊀APSIM模型是由农业生产系统研究部(APSRU)开发的一种农业系统模型ꎬ用于评估农业生产中的风险[12 ̄13]ꎮAPSIM模型的干旱胁迫效应算法采用PERFECT模型和CERES模型中的级联水平衡模型算法求得[14]ꎬ且使用逐日计算的方式模拟土壤水分ꎬ其基本原理是比较植物可吸收的土壤含水量与潜在根系吸水量㊁作物水分需求量与潜在蒸腾量ꎮAPSIM模型通过土壤干旱胁迫因子来量化光合作用㊁叶片生长㊁固氮能力㊁物候期对干旱胁迫的敏感ꎬ从而模拟干旱胁迫对作物不同生育期的影响ꎮ1.4.2㊀WOFOST模型干旱胁迫效应算法㊀WOFOST模型是1年生作物解释性模型ꎬ模拟其在特定气候和土壤条件下的动态生长[15]ꎮWOFOST模型用蒸腾速率变化来响应土壤干旱程度ꎬ蒸腾速率直接影响作物的同化速率ꎮWOFOST模型的作物潜在蒸腾速率(Tm)通过使用Penman ̄Monteith(PM)模型的Penman公式计算得到ꎬ再使用凋萎点水分含量㊁土壤体积含水量等参数计算实际蒸腾速率[16]ꎬ最后使用作物和土壤的蒸腾蒸发量来量化由土壤湿度变化导致的作物同化量的变化ꎮ表层土壤蒸发量和作物蒸腾量在计算时视为一个整体ꎬPM模型通过作物的LAI区分二者ꎮWOFOST模型使用作物修正系数来校正不同作物的差异ꎬ多数作物㊁部分节水作物的修正系数分别为1 0㊁0 8ꎮTα/TP(Tα为实际蒸腾速率㊁TP为潜在蒸腾速率)是衡量土壤含水量的指标ꎬ其值为1 0说明作物生长发育正常ꎬ土壤含水量处于土壤田间最大持水量和土壤临界含水量之间ꎻ当土壤含水量降低时ꎬ土壤含水量的下降将导致实际蒸腾速率下降ꎬ进而影响作物的正常生长发育ꎮ1.4.3㊀DSSAT模型干旱胁迫效应算法㊀DSSAT由国际农业技术转让基准点网络项目开发[17]ꎬ可以促进作物模型在农艺学研究系统方法中的应用ꎬ其整合作物㊁土壤㊁气候和管理等模块ꎬ以便更好地决定将生产技术从一个土壤㊁气候不同的地方转移到其他地方[18]ꎮDSSAT模型对干旱胁迫的响应是从作物蒸腾速率的角度来考虑ꎬ采用2个干旱胁迫因子模拟干旱胁迫对作物造成的影响ꎬ以日为步长ꎬ通过比较潜在根系吸水速率与潜在蒸腾速率ꎬ对作物生长是否受到影响做出判断ꎬ并量化影响的程度ꎮDSSAT模型模拟土壤水分的理论依据是前人提出的一维 翻桶式 的土壤含水量平衡方法[19]ꎬ该方法对各层土壤的根系吸水和水分流动进行模拟ꎮ在土壤水分充足的环境下ꎬ植株根系的潜在吸水和潜在蒸腾比值大于1ꎬ即植株根系吸收水分充足ꎬ作物生长发育正常ꎬ作物没有受到干旱胁迫影响ꎻ发生干旱胁迫时ꎬ植株根系的水分吸收量低于潜在蒸腾量ꎬ即二者的比值开始减小ꎬ并在某个时刻达到一个阈值ꎬ第一个干旱胁迫因子(TURFAC)开始起作用ꎬ此因子会对作物叶片的生长过程造成影响ꎬ比如伸展等ꎻ第二个干旱胁迫因子(SWFAC)在潜在根系吸水速率小于或等于潜在蒸腾速率时开始起作用ꎬ此时土壤含水量较低ꎬ作物的光合作用速率开始降低ꎬ从而影响作物的同化速率ꎬ即该因子会对作物生长和生物量形成造成影响[20]ꎮ1.5㊀模型参数校正与检验采用2个生长年份2013年㊁2014年的田间试验观测数据ꎬ分别用于模型的校正㊁检验ꎮ前者用来调参ꎬ后者用来验证模型的模拟结果ꎮ3种模型的参数校正结果如表1显示ꎮ㊀㊀参照He等[21]的研究结果ꎬ对胡麻品种遗传参数的调整采取试错法ꎬ结合当地同期年份气象数据与胡麻观测数据ꎬ通过调试相关遗传参数使籽粒产量与各物候期叶面积指数的模拟结果尽可能接近实测数据ꎬ最终确定品种遗传参数ꎬ再利用其他年份的试验实测数据来验证模型和遗传参数的准确性ꎮ㊀㊀为系统评估3个模型模拟结果的可靠性和准确性ꎬ使用目前国际学术界在检验㊁评价模型上广泛认可的4个评价指标:决定系数(R2)㊁均方根误差(RMSE)㊁平均绝对误差(MAE)㊁平均绝对百分比误差(MAPE)ꎮR2的取值范围为[0ꎬ1]ꎬ其值越大ꎬ说明模型拟合效果越好ꎬ具体计算方法见公式1ꎮRMSE反映了模拟值与实测值的偏差大小ꎬ对数据异常值较为敏感ꎬ可以衡量模型模拟的准确程度ꎬ其值越小ꎬ模型越精确ꎬ具体计算方法见公式2ꎮMAE表示模拟值和实测值绝对误差的平均值ꎬMAE取值越小说明预测模型具有越高的精确度ꎬ具体计算方法见公式3ꎮMAPE是一种相对误差度量值ꎬ其使用绝对值来避免正误差㊁负误差相互抵消ꎬ一般认为MAPE小于10时ꎬ模型的模拟精确度较高ꎬ具体计算方法见公式4ꎮ524樊玉春等:三种胡麻生长模型对现蕾期和青果期干旱胁迫响应能力的比较表1㊀APSIM㊁DSSAT㊁WOFOST模型校正参数Table1㊀CalibrationparametersofAPSIMꎬDSSATꎬandWOFOSTmodels模型㊀㊀㊀㊀㊀参数名称㊀㊀单位㊀㊀参数含义㊀㊀㊀㊀㊀㊀㊀㊀㊀数值APSIMTransp_eff_cf-蒸腾效率系数0.005Water_stress_factor-光合作用干旱胁迫因子0.600Cover_greenMJ/m2辐射截获19.500RUEg/(MJ m2)辐射利用率1.400DSSATP1Vd春化敏感系数32.710P1D%光周期敏感系数102.300P5ħ d灌浆期特性系数544.600G1No./g籽粒数特性系数16.790G2mg标准粒粒质量系数48.810G3g成熟期单株茎穗质量系数1.635PHINTħ d出叶间隔特性参数92.400WOFOSTRML-叶片维持呼吸消耗系数0.021AMAXkg/hm2最大CO2同化速率32.000SWFCF-田间持水量0.340SMW-凋萎点土壤含水量0.150CFET-作物蒸散校正系数1.000㊀㊀R2= yi^-y-()2yi-y-()2(1)RMSE=1n yi-yi^()2(2)MAE=1n yi-yi^(3)MAPE=100%n yi^-yiyi(4)其中yi为实测值ꎬyi^为模拟值ꎬn为样本数ꎮ2㊀结果与分析2.1㊀蒸腾速率对干旱胁迫响应的模拟图1显示ꎬ从不同干旱胁迫水平下实测蒸腾速率的动态变化可以观察到ꎬ随着干旱时间的延长和干旱胁迫程度的加深ꎬ胡麻的蒸腾速率总体呈下降趋势ꎬ且相同处理条件下青果期胡麻蒸腾速率整体高于现蕾期ꎮ3种作物生长模型均模拟出干旱胁迫下蒸腾速率下降的趋势ꎮ㊀㊀不同模型模拟结果(表2)表明ꎬWOFOST模型的干旱胁迫效应算法在模拟胡麻蒸腾速率方面整体上表现最好ꎬAPSIM㊁DSSAT模型的干旱胁迫效应算法表现相对较差ꎮ以陇亚杂1号为例ꎬ在轻度干旱胁迫条件下WOFOST模型模拟胡麻现蕾期蒸腾速率的RMSE为0 06ꎬ青果期为0 07ꎻ在中度干旱胁迫下现蕾期模拟值的RMSE为0 05ꎬ青果期为0 28ꎬ误差指标总体低于其他2个作物模型ꎮ从不同干旱程度来看ꎬ干旱胁迫程度越高ꎬ蒸腾速率下降越快且所能达到的最低界限越小(图1)ꎮ3种作物模型都可以模拟蒸腾速率对不同干旱程度的响应ꎬ随着干旱程度的加深ꎬ对陇亚杂1号的模拟精度总体呈下降趋势ꎬ但对陇亚11号的模拟精度总体提高ꎬ例如在陇亚杂1号青果期的对照组中ꎬ3种作物模型的平均RMSE为0 05ꎬ但在中度干旱胁迫处理下的平均RMSE为0 42ꎻ在陇亚11号青果期对照组中ꎬ3种作物模型的平均RMSE为0 07ꎬ但在中度干旱胁迫处理下的平均RMSE为0 03ꎮ624江苏农业学报㊀2023年第39卷第2期LYZ1:陇亚杂1号ꎻLY11:陇亚11号ꎻCK:对照ꎻT1:轻度干旱胁迫处理ꎻT2:中度干旱胁迫处理ꎮ图1㊀3种干旱胁迫效应算法的蒸腾速率模拟值与实测值比较Fig.1㊀Comparisonofsimulatedandmeasuredvaluesoftranspirationratebythreedroughtstressalgorithms表2㊀3种作物模型对现蕾期、青果期胡麻蒸腾速率预测准确性的统计检验Table2㊀Statisticaltestsofthepredictionaccuracyoftranspirationrateofoilflaxatbuddingstageandgreenfruitstagebythreecropmodels品种㊀生育期指标㊀CKT1T2APSIM模型WOFOST模型DSSAT模型APSIM模型WOFOST模型DSSAT模型APSIM模型WOFOST模型DSSAT模型LYZ1现蕾期R20.900.900.910.890.900.910.930.940.93RMSE0.110.050.070.060.060.100.090.050.20MAE0.090.040.060.040.050.070.080.040.11MAPE10.035.206.883.233.845.294.814.655.67青果期R20.840.940.940.800.860.770.850.850.86RMSE0.070.050.030.060.070.020.670.280.32MAE0.050.040.020.050.060.020.100.431.11MAPE3.002.912.172.923.661.034.964.515.48724樊玉春等:三种胡麻生长模型对现蕾期和青果期干旱胁迫响应能力的比较续表2㊀Continued2品种㊀生育期指标㊀CKT1T2APSIM模型WOFOST模型DSSAT模型APSIM模型WOFOST模型DSSAT模型APSIM模型WOFOST模型DSSAT模型LY11现蕾期R20.940.950.940.920.930.930.940.940.94RMSE0.060.050.110.060.050.090.040.030.04MAE0.050.040.100.050.040.080.030.020.03MAPE5.045.3611.313.313.776.801.331.231.83青果期R20.770.840.810.840.890.820.810.870.85RMSE0.050.050.100.030.050.100.040.020.03MAE0.040.040.080.020.040.090.030.010.02MAPE4.063.617.731.602.575.371.880.821.19CK:对照ꎻT1:轻度干旱胁迫处理ꎻT2:中度干旱胁迫处理ꎮR2:决定系数ꎻRMSE:均方根误差ꎻMAE:平均绝对误差ꎻMAPE:平均绝对百分比误差ꎮLYZ1:陇亚杂1号ꎻLY11:陇亚11号ꎮ2.2㊀气孔导度对干旱胁迫响应的模拟表3㊁图2显示ꎬ干旱胁迫发生后ꎬ气孔导度受到抑制ꎬ且干旱程度越严重㊁干旱时间越长ꎬ气孔导度越低ꎮ与陇亚11号相比ꎬ陇亚杂1号对干旱胁迫更加敏感ꎻ与现蕾期相比ꎬ青果期对干旱胁迫更加敏感ꎮ表3㊀3种作物模型对现蕾期、青果期胡麻气孔导度预测准确性的统计检验Table3㊀Statisticaltestsofthepredictionaccuracyofstomatalconductanceofoilflaxatbuddingstageandgreenfruitstagebythreecropmodels品种㊀㊀生育期指标㊀CKT1T2APSIM模型WOFOST模型DSSAT模型APSIM模型WOFOST模型DSSAT模型APSIM模型WOFOST模型DSSAT模型LYZ1现蕾期R20.940.980.860.920.940.910.870.840.85RMSE1.731.772.441.601.772.001.461.962.13MAE1.571.712.281.421.711.711.281.571.71MAPE4.284.666.206.9210.0811.1013.4022.6724.41青果期R20.930.910.940.890.880.870.870.860.84RMSE1.363.644.121.061.923.251.702.742.14MAE1.283.143.850.851.712.851.502.351.78MAPE3.076.297.514.098.9413.0212.6018.4422.31LY11现蕾期R20.950.920.940.930.920.900.910.890.88RMSE1.851.641.551.261.852.330.911.311.61MAE1.711.571.281.071.712.210.601.001.03MAPE6.085.514.605.4410.1813.247.428.5812.69青果期R20.970.950.960.940.920.910.910.880.85RMSE1.311.461.961.191.852.391.021.191.58MAE1.141.281.571.111.712.210.811.141.28MAPE3.764.285.085.479.1211.414.679.3412.39CK:对照ꎻT1:轻度干旱胁迫处理ꎻT2:中度干旱胁迫处理ꎮR2:决定系数ꎻRMSE:均方根误差ꎻMAE:平均绝对误差ꎻMAPE:平均绝对百分比误差ꎮLYZ1:陇亚杂1号ꎻLY11:陇亚11号ꎮ㊀㊀比较3种作物模型对气孔导度的模拟结果ꎬ中度干旱胁迫处理下ꎬAPSIM模型对青果期胡麻气孔导度的动态模拟效果最好ꎬ例如陇亚11号模拟值和观察值之间的RMSE相较WOFOST模型和DSSAT模型降低了0 17㊁0 56ꎬR2提高了0 03㊁0 06ꎮ比较3种作物模型对2个物候期的模拟情况ꎬ3824江苏农业学报㊀2023年第39卷第2期LYZ1:陇亚杂1号ꎻLY11:陇亚11号ꎻCK:对照ꎻT1:轻度干旱胁迫处理ꎻT2:中度干旱胁迫处理ꎮ图2㊀3种干旱胁迫效应算法的气孔导度模拟值与实测值比较Fig.2㊀Comparisonofsimulatedandmeasuredvaluesofstomatalconductancebythreedroughtstressalgorithms种作物模型对现蕾期干旱胁迫处理下气孔导度的模拟效果整体优于青果期ꎮ2.3㊀叶面积指数对干旱胁迫响应的模拟图3显示ꎬ干旱胁迫发生后ꎬ胡麻叶面积指数下降ꎬ且干旱胁迫越严重叶面积指数下降越快㊁越低ꎮ3种作物生长模型都能反映出干旱胁迫下胡麻叶面积指数下降的趋势ꎮ一定程度上ꎬ3种作物生长模型均可以反映出叶面积指数受干旱胁迫的限制ꎬ但表现各有差别ꎮ整体上看ꎬ3种作物模型在轻度干旱胁迫处理下的模拟效果总体优于中度干旱胁迫处理下的模拟效果ꎮ3种作物模型对青果期叶面积指数的模拟效果总体好于现蕾期ꎻ3种作物模型对陇亚11号叶面积指数的预测精度总体优于陇亚杂1号ꎮ表4显示ꎬ从不同模型对胡麻2个物候期叶面积指数的模拟结果来看ꎬDSSAT模型干旱胁迫效应算法整体表现最好ꎬ其RMSE平均值为0 02ꎮ在中度干旱胁迫处理下ꎬ现蕾期模拟效果最好的是AP ̄SIM模型干旱胁迫效应算法ꎬ其模拟叶面积指数的平均RMSE为0 03ꎻ青果期表现最好的是DSSAT模型干旱胁迫效应算法ꎬ其模拟叶面积指数的平均RMSE为0 02ꎮ2.4㊀籽粒产量对干旱胁迫响应的模拟图4显示ꎬ3种作物生长模型对产量变化的模拟趋势相同ꎬ但误差各有不同ꎬ其中WOFOST模型干旱胁迫效应算法的模拟结果要优于其他2种模924樊玉春等:三种胡麻生长模型对现蕾期和青果期干旱胁迫响应能力的比较LYZ1:陇亚杂1号ꎻLY11:陇亚11号ꎻCK:对照ꎻT1:轻度干旱胁迫处理ꎻT2:中度干旱胁迫处理ꎮ图3㊀3种干旱胁迫效应算法的叶面积指数模拟值与实测值比较Fig.3㊀Comparisonofsimulatedandmeasuredvaluesofleafareaindexbythreedroughtstressalgorithms型ꎮWOFOST模型对胡麻产量的模拟值与实测值分布趋近1ʒ1线ꎬ残差平方和(RSS)为0.019~1 939ꎬ能较好地模拟了干旱胁迫条件下的胡麻产量ꎻAPSIM模型对胡麻产量的模拟值与实测值的RSS为0.264~11 629ꎻDSSAT模型对胡麻产量的模拟值与实测值的RSS为3.556~15 154ꎮ3㊀讨论极端干旱事件是全球气候变化背景下造成胡麻减产的重要原因之一ꎮ作物生长模型[22 ̄24]是量化气候变化对胡麻生产力影响的重要工具ꎮ本研究利用3种作物生长模型的干旱胁迫效应算法与田间试验资料ꎬ重点模拟胡麻生理生化指标㊁产量等对不同程度干旱胁迫的响应ꎬ系统评估了不同模型在干旱胁迫下的模拟结果ꎬ研究结果可以为以后优化干旱胁迫效应算法提供理论依据ꎮ㊀㊀本研究结果表明ꎬ3种干旱胁迫效应算法对干旱胁迫的响应存在明显差异ꎮ刘竞择[25]认为ꎬ干旱胁迫可能会导致叶片衰老ꎮ李正鹏[26]研究发现ꎬDSSAT模型对小麦籽粒产量㊁LAI和蒸腾作用的模拟主要受田间土壤含水量的影响ꎬ而APSIM模型对田间施氮量较敏感ꎮ本研究发现ꎬDSSAT模型对叶034江苏农业学报㊀2023年第39卷第2期表4㊀3种作物模型对现蕾期、青果期胡麻叶面积指数预测准确性的统计检验Table4㊀Statisticaltestsofthepredictionaccuracyofleafareaindexofoilflaxatbuddingstageandgreenfruitstagebythreecropmodels品种㊀㊀生育期指标㊀CKT1T2APSIM模型WOFOST模型DSSAT模型APSIM模型WOFOST模型DSSAT模型APSIM模型WOFOST模型DSSAT模型LYZ1现蕾期R20.930.930.940.880.840.910.850.820.86RMSE0.020.030.010.020.050.010.030.060.02MAE0.010.020.010.010.040.010.020.040.02MAPE1.242.070.731.223.691.101.414.681.52青果期R20.950.950.960.890.860.920.900.840.91RMSE0.020.040.010.050.070.030.020.040.01MAE0.020.030.010.040.060.020.020.030.01MAPE1.352.170.723.464.901.631.592.991.00LY11现蕾期R20.940.940.950.920.920.930.860.850.88RMSE0.020.040.010.020.030.010.020.050.04MAE0.020.030.010.010.020.010.010.040.04MAPE1.382.250.401.332.071.111.294.121.35青果期R20.940.950.970.930.930.940.900.890.90RMSE0.010.020.010.020.030.020.020.050.02MAE0.010.010.010.010.030.010.010.040.02MAPE0.430.850.431.292.391.061.403.641.46CK:对照ꎻT1:轻度干旱胁迫处理ꎻT2:中度干旱胁迫处理ꎮR2:决定系数ꎻRMSE:均方根误差ꎻMAE:平均绝对误差ꎻMAPE:平均绝对百分比误差ꎮLYZ1:陇亚杂1号ꎻLY11:陇亚11号ꎮa:基于陇亚杂1号现蕾期数据的产量模拟值与实测值的比较ꎻb:基于陇亚11号现蕾期数据的产量模拟值与实测值的比较ꎻc:基于陇亚杂1号青果期数据的产量模拟值与实测值的比较ꎻd:基于陇亚11号青果期数据的产量模拟值与实测值的比较ꎮ图4㊀产量模拟值与实测值的比较Fig.4㊀Comparisonofsimulatedandmeasuredyieldvalues面积指数的模拟效果整体相对较好ꎮDSSAT模型中叶面积扩大受叶片质量和比叶面积2个参数影响ꎬ后者受温度㊁水分亏缺和光照的影响ꎬ在达到土壤干燥度阈值后启动干旱胁迫因子来调节伸展性生长ꎬ如叶片的伸展ꎮWOFOST模型中叶片生长是由叶片生物量的增加驱动的ꎬ干旱胁迫不会直接影响134樊玉春等:三种胡麻生长模型对现蕾期和青果期干旱胁迫响应能力的比较叶片生长ꎬ而是通过叶片生物量变化间接影响叶片生长ꎮAPSIM模型使用叶片的外观㊁扩张和衰老等函数模拟叶面积的变化ꎬ而叶片衰老函数受叶龄㊁光照竞争㊁干旱和霜冻等因素共同影响ꎮ㊀㊀未来可以将作物的生长参数调整纳入干旱胁迫效应算法ꎬ并为每个胁迫因子创建适当的权重函数ꎬ不仅可以改善干旱胁迫下的植物生长模拟情况ꎬ还可以改善多种胁迫下的植物生长模拟情况ꎮPrasad等[27]认为模拟叶片干质量和叶面积积累的误差通过影响干物质生产模拟造成更大的效应ꎬ导致不能准确模拟干旱胁迫对整体生长和发育的影响ꎮHao等[28]认为ꎬ与充分灌溉相比ꎬ亏缺灌溉将导致作物较低的叶面积指数㊁收获指数和产量ꎮ本研究中ꎬWOFOST模型的干旱胁迫效应算法在模拟蒸腾速率和籽粒产量方面的效果整体优于AP ̄SIM模型和DSSAT模型ꎬ主要原因是APSIM模型和DSSAT模型评估不同干旱程度㊁不同干旱处理时期对胡麻生理指标的影响时涉及过多参数ꎬ复杂的参数调整使模型预测能力降低ꎮ在DSSAT模型中ꎬ作物的胁迫效应算法是基于温度㊁水㊁氮和磷4种胁迫因子的最大值计算的ꎬ作物在多重胁迫下所受的影响比单个胁迫因素更强ꎬ而本研究只探讨了水分这一基本变量ꎬ减弱了并发胁迫源和相互作用对实际作物生长的影响ꎮAPSIM模型中实际每日生物量累计是根据最低辐射量和水分限制速率来计算的ꎬ其中水分限制的日生物量受实际土壤供水㊁作物蒸腾系数㊁日间蒸气压亏缺影响ꎬ再根据发育阶段的分配功能将日生物量划分给叶㊁茎和籽粒ꎮTodorovic等[29]认为作物生长模型无法充分模拟水分利用效率ꎬ尤其是在干旱胁迫条件下ꎮAntle等[30]认为在水分㊁养分和极端温度等胁迫环境下ꎬ作物生长模型中仍有许多过程没有得到满意的量化ꎬ导致了作物生长发育㊁产量模拟的不确定性ꎮ综上所述ꎬ作物生长模型的干旱胁迫效应算法在模拟干旱条件下现蕾期㊁青果期胡麻的生理生化响应仍有不足之处ꎬ有待进一步优化㊁完善ꎮ4㊀结论干旱胁迫使胡麻的蒸腾速率㊁气孔导度㊁叶面积指数和籽粒产量明显降低ꎮ在干旱胁迫下ꎬWOFOST模型模拟蒸腾速率和籽粒产量表现较好ꎬAPSIM模型模拟气孔导度表现较好ꎬDSSAT模型模拟叶面积指数表现较好ꎮ本研究通过对比3种干旱胁迫效应算法分别对干旱条件下胡麻2个物候期的3个生理指标及产量的模拟效果来明确各模型的优缺点ꎬ为今后优化模型的干旱胁迫效应算法提供了参考依据ꎮ参考文献:[1]㊀赵㊀利ꎬ党占海ꎬ牛俊义ꎬ等.水分胁迫下不同抗旱类型胡麻苗期生理生化指标变化[J].干旱地区农业研究ꎬ2015ꎬ33(4):206 ̄211.[2]㊀何㊀丽ꎬ杜彦斌ꎬ张㊀金ꎬ等.干旱对胡麻现蕾期光合特性及产量的影响[J].西北农林科技大学学报(自然科学版)ꎬ2017ꎬ45(4):59 ̄64.[3]㊀李㊀玥ꎬ牛俊义ꎬ吴㊀兵ꎬ等.基于APSIM的胡麻陇亚杂1号的生育时期模拟模型[J].核农学报ꎬ2015ꎬ29(5):972 ̄979. [4]㊀肖浏骏ꎬ刘蕾蕾ꎬ邱小雷ꎬ等.小麦生长模型对拔节期和孕穗期低温胁迫响应能力的比较[J].中国农业科学ꎬ2021ꎬ54(3):504 ̄521.[5]㊀康㊀佳ꎬ李㊀玥ꎬ康亮河.胡麻生理生化代谢指标对干旱胁迫的响应及其模拟模型的研究[J].干旱区地理ꎬ2022ꎬ45(3):879 ̄889.[6]㊀李㊀玥ꎬ牛俊义ꎬ郭丽琢ꎬ等.AquaCrop模型在西北胡麻生物量及产量模拟中的应用和验证[J].中国生态农业学报ꎬ2014ꎬ22(1):93 ̄103.[7]㊀陈先冠ꎬ冯利平ꎬ白慧卿ꎬ等.基于小麦模型算法集成平台的三种水分胁迫算法比较[J].农业工程学报ꎬ2021ꎬ37(16):47 ̄57.[8]㊀姚㊀宁ꎬ周元刚ꎬ宋利兵ꎬ等.不同水分胁迫条件下DSSAT ̄CE ̄RES ̄Wheat模型的调参与验证[J].农业工程学报ꎬ2015ꎬ31(12):138 ̄150.[9]㊀刘㊀健ꎬ姚㊀宁ꎬ吝海霞ꎬ等.冬小麦物候期对土壤水分胁迫的响应机制与模拟[J].农业工程学报ꎬ2016ꎬ32(21):115 ̄124. [10]CHENYꎬMAREKGWꎬMAREKTHꎬetal.Assessingsoilandwaterassessmenttoolplantstressalgorithmsusingfullanddeficitirrigationtreatments[J].AgronomyJournalꎬ2019ꎬ111(3):1266 ̄1280.[11]SASEENDRANSAꎬAHUJALRꎬMALꎬetal.Currentwaterdeficitstresssimulationsinselectedagriculturalsystemmodels[J].ResponseofCropstoLimitedWater:UnderstandingandModelingWaterStressEffectsonPlantGrowthProcessesꎬ2008ꎬ1:1 ̄38. [12]茹晓雅ꎬ李㊀广ꎬ闫丽娟ꎬ等.基于APSIM模型模拟水氮调控对旱地春小麦产量的影响[J].草业科学ꎬ2019ꎬ36(9):2342 ̄2350.[13]HOLZWORTHDPꎬHUTHNIꎬDEVOILPGꎬetal.APSIM ̄e ̄volutiontowardsanewgenerationofagriculturalsystemssimulation[J].EnvironmentalModellingandSoftwareꎬ2014ꎬ62:327 ̄350. [14]刘沉默.旱作条件下APSIM模型的适应性评价及应用 以山西省为例[D].太原:山西农业大学ꎬ2019.[15]穆青云ꎬ李㊀俊ꎬ何㊀亮ꎬ等.青藏高原冬小麦生产潜力及其对气候变化的响应[J].干旱区资源与环境ꎬ2021ꎬ35(7):92 ̄99.234江苏农业学报㊀2023年第39卷第2期。
不同R∶FR值对菊花叶片气孔特征和气孔导度的影响杨再强;张静;江晓东;张继波;朱静;顾礼力;张波【摘要】以切花菊品种“神马(Jinba)”为试材,2010年10月至2011年2月间在南京信息工程大学试验温室采用不同Red(660±10) nm:Far-red (730±10) nm值的LED光源短日处理,研究了温室切花菊叶片气孔特征和气孔导度对不同R:FR值的响应.结果表明:不同R∶FR值短日处理35d菊花叶片的上表皮和下表皮的气孔直径分别以R∶FR值4.5和6.5处理最大,均以R∶FR值2.5处理最小,气孔密度和气孔开度均以R∶FR=2.5处理最高,以R∶FR值6.5处理最低,下表皮的气孔密度、气孔开度明显高于上表皮;不同R∶FR值处理叶片的气孔开张比和气孔指数差异不显著;在相同光强下,菊花叶片气孔导度和光合速率由大到小的R∶FR值顺序依次为2.5、4.5、0.5、6.5.叶片气孔导度与气孔指数、气孔密度、气孔开张比和气孔开度成正相关,与气孔长度和气孔宽度呈负相关;R∶FR值在2.5-6.5范围内,随光质中红光成分增加,叶片气孔密度、气孔指数、气孔开度、气孔开张比和气孔导度显著降低.【期刊名称】《生态学报》【年(卷),期】2012(032)007【总页数】7页(P2135-2141)【关键词】切花菊;R∶FR;气孔特性;气孔导度【作者】杨再强;张静;江晓东;张继波;朱静;顾礼力;张波【作者单位】南京信息工程大学,气象灾害省部共建教育部重点实验室,南京210044;南京信息工程大学应用气象学院,南京210044;南京信息工程大学,气象灾害省部共建教育部重点实验室,南京210044;南京信息工程大学,气象灾害省部共建教育部重点实验室,南京210044;南京信息工程大学,气象灾害省部共建教育部重点实验室,南京210044;南京信息工程大学,气象灾害省部共建教育部重点实验室,南京210044;南京信息工程大学,气象灾害省部共建教育部重点实验室,南京210044;南京信息工程大学,气象灾害省部共建教育部重点实验室,南京210044【正文语种】中文不同光质成分对植物形态建成、光合作用和物质代谢的调节作用各不相同,利用光谱成分中红光和远红光的比值(R∶FR值)调节设施作物生长发育的研究倍受关注[1-3]。
Available online at Epigenetic regulation of stress responses in plants Viswanathan Chinnusamy1and Jian-Kang Zhu2Gene expression driven by developmental and stress cues often depends on nucleosome histone post-translationalmodifications and sometimes on DNA methylation.A number of studies have shown that these DNA and histone modifications play a key role in gene expression and plant development under stress.Most of these stress-induced modifications are reset to the basal level once the stress is relieved,while some of the modifications may be stable,that is,may be carried forward as ‘stress memory’and may be inherited across mitotic or even meiotic cell divisions.Epigenetic stress memory may help plants more effectively cope with subsequent stresses. Comparative studies on stress-responsive epigenomes and transcriptomes will enhance our understanding of stress adaptation of plants.Addresses1Water Technology Centre,Indian Agricultural Research Institute,New Delhi110012,India2Department of Botany and Plant Sciences,Institute for Integrative Genome Biology,University of California,Riverside,CA92521,USACorresponding author:Zhu,Jian-Kang(jian-kang.zhu@)Current Opinion in Plant Biology2009,12:133–139This review comes from a themed issue onGenome studies and molecular geneticsEdited by Masahiro Yano and Roberto TuberosaAvailable online27th January20091369-5266/$–see front matter#2008Elsevier Ltd.All rights reserved.DOI10.1016/j.pbi.2008.12.006IntroductionInformation content of the genome(DNA sequence)and its expression in response to stress are crucial for the adaptability of a genotype.Expression of the genome is influenced by chromatin structure,which is governed by processes often associated with epigenetic regulation, namely histone variants,histone post-translational modi-fications,and DNA methylation.Developmental and environmental signals can induce epigenetic modifi-cations in the genome,and thus,the single genome in a plant cell gives rise to multiple epigenomes in response to developmental and environmental cues[1].Under-standing stress-induced epigenetic processes in stress tolerance of plants requires answers to the following questions:How much of the stress-induced gene expres-sion changes are associated with alterations in DNA methylation and histone modification marks?Are stress-induced DNA and histone modifications during acclimation or during thefirst experience of stress mem-orized and inherited mitotically and meiotically?What are the adaptive values of epigenetic stress memory?This review briefly describes epigenetic processes,and then focuses on recent data on the epigenetic regulation of stress responses and its heritability in plants. Epigenetic regulation of stress responses Retention of stress memory for short durations is well known in plants,as evident from acclimation responses [2,3].The stress memory can be retained for only short durations if the memory depends on the half-life of stress-induced proteins,RNAs,and metabolites,while the memory can last longer if it involves reprogramming in phenology and morphology of plants.Epigenetic processes,that is,stable or heritable DNA methylation and histone modifications,can also be a choice of retaining stress memory for longer times.Methods to decipher epigenetic changes are briefly described in Box1.Histone modificationsN-terminal regions of nucleosome core complex histones undergo various post-translational modifications.In addition,each histone has variants encoded by different genes.The combinations of histone variants and post-translational modifications can be considered a‘histone code’,which plays a key role in chromatin structure and thus determines the transcriptional state and expression level of genes.Some histone modifications,namely acety-lation,and certain phosphorylation and ubiquitination [4,5],enhance transcription,while biotinylation and sumoylation repress gene expression[6,7].Trimethyla-tion of H3K4activates transcription,while dimethylation of H3K9and H3K27represses transcription[5].Because several of the histone modifications are associated with changes in gene transcription in general,it is not surpris-ing that stress-induced gene regulation is associated with histone modifications in all cases that have been inves-tigated.Changes in histone variants,histone modifi-cations as well as DNA methylation are often referred to as epigenetic regulation.However,such changes may or may not be truly epigenetic in nature because common epigenetics definition requires mitotic or meiotic herit-ability.Drought induced the linker histone variant H1-S in tomato.H1-S appears to be involved in the negative regulation of stomatal conductance,because stomatal con-ductance and transpiration rates were higher in antisense transgenic H1-S tomato plants than in wild type(WT) plants[8].In rice seedlings,submergence induced histone H3K4 trimethylation and H3acetylation in alcohol dehydrogen-ase1(ADH1)and pyruvate decarboxylase1(PDC1) genes.These histone modifications were correlated with enhanced expression of ADH1and PDC1under stress. The modifications,however,were dynamic and were restored to the basal level after stress was relieved by reaeration[9 ].Environmental and endogenous signals can repress the target genes through reduction in histone acetylation levels.The REDUCED POTASSIUM DEPEN-DENCY3(RPD3)family histone deacetylases(HDACs), namely HDA6and HDA19,mediate histone deacetyla-tion in response to biotic and abiotic stresses in Arabi-dopsis.HDA6is induced by jasmonic acid(JA)and ethylene[10].HDA6is involved in transcriptional gene silencing(TGS)[11]and RNA-directed DNA methyl-ation(RdDM)in Arabidopsis[12].Wounding,infection by Alternaria brassicicola,and plant hormones(JA and ethyl-ene)induced the expression of the HDA19/HD1/ AtRPD3A gene.Overexpression of HDA19in transgenic plants reduced histone acetylation levels and increased the expression levels of ETHYLENE RESPONSE FAC-TOR-1(ERF1)and PATHOGENESIS-RELATED(PR)genes.In contrast,RPD3A-RNAi plants exhibited higher histone acetylation,which was accompanied by down-regulation of ERF1and PR genes in Arabidopsis[10]. Enhanced HDA6and HDA19expression caused by stress and hormonal signals thus might affect chromatin modi-fications at several loci.ABA downregulated the expression of AtHD2C(a mem-ber of plant-specific HD2family of HDACs).Transgenic Arabidopsis plants overexpressing AtHD2C exhibited enhanced expression of ABA-responsive genes and greater salt and drought tolerance than the WT plants [13 ].In rice,expression of different members of the HDAC families is also differentially regulated by abiotic factors such as cold,osmotic and salt stress,and hormones such as ABA,JA,and salicylic acid[14].Besides the HDACs,the WD-40repeat protein TBL1 (T ransducin B eta-L ike protein-1)is associated with histone deacetylation in humans.The Arabidopsis hos15 (high expression of osmotic stress responsive genes15)mutant was hypersensitive to freezing stress,and was hypersen-sitive,in terms of germination,to ABA or NaCl.HOS15 encodes a protein similar to TBL1,which interacts with histone H4.HOS15is probably involved in H4deacety-lation because acetylated H4was higher in hos15mutants than in WT plants,and thus regulates stress tolerance through chromatin remodeling in Arabidopsis[15 ]. Drought-induced expression of stress-responsive genes is associated with an increase in H3K4trimethylation and H3K9acetylation in Arabidopsis[16 ].In Drosophila,H3 Ser-10phosphorylation activates transcription during heat shock responses[17].In Arabidopsis also,high sal-inity,cold stress,and ABA triggered rapid and transient upregulation of histone H3Ser-10phosphorylation,H3 phosphoacetylation,and H4acetylation followed by stress-type-specific gene expression[18 ].Histone acetyltransferases(HATs)interact with tran-scription factors and are involved in activating stress-responsive genes.GCN5is the catalytic subunit of the Spt-Ada-Gcn5acetyltransferase(SAGA)and transcrip-tional adaptor(ADA).Like ADA2and GCN5in the response of yeast to extreme temperature stress,in Ara-bidopsis as well,GCN5and ADA regulate cold tolerance by interacting with C-repeat B inding F actor-1(CBF1). CBF1activates transcription of its downstream cold-responsive genes probably through the recruitment of ADA/SAGA-like complexes that may mediate chromatin remodeling in target genes[19].DNA methylationDNA cytosine methylation,both asymmetric(m CpHpH)-methylation and symmetric(m CpG and m CpHpG)-meth-ylation,is associated with repressive chromatin in gene promoters and with repression of gene transcription.De134Genome studies and molecular geneticsBox1Deciphering epigenetic changesHistone modifications:Chromatin immunoprecipitation(ChiP)—histones bound to the DNA in vivo are covalently crosslinked to DNA in situ by vacuum infiltration of plant tissue with formaldehyde.Then chromatin is isolated as part of cell extract,fragmented,and protein–DNA complexes are immunoprecipitated with antibodies specific against modified histone,for example,acetylated or dimethylated H3K9. DNA is isolated from the immunoprecipitate and analyzed by PCR [4,9 ,15 ,16 ,18 ,51].ChiP-Seq—this method combines ChiP with next-generation sequencing technology such as Solexa sequencing to analyze gen-ome-wide-specific histone modifications[52].DNA methylation:Methylation-sensitive restriction endonucleases—the classical method of cytosine methylation analysis is the restriction analysis of template DNA with methylation-sensitive restriction enzymes.Re-stricted DNA is then ligated to restriction site specific adaptor and analyzed by PCR or restricted genomic DNA is analyzed by Southern blotting[22,27 ,49 ,50 ].Bisulfite method—sodium bisulfite converts cytosines,but not50-methylcytosines,into uracil,under denaturing conditions.PCR amplification of bisulfite-treated DNA results in conversion of uracil to thymine.Bisulfite-treated DNA is analyzed by PCR or DNA sequen-cing[4,23 ,33 ,49 ,50 ]Methylated-DNA immunoprecipitation(MeDIP)—genomic DNA is fragmented and precipitated with5-methylcytosine-specific anti-body.The precipitated DNA is then analyzed by PCR or whole-genome tiling microarrays[53,54].Shotgun bisulfite-sequencing—this combines bisulfite treatment of genomic DNA with next generation sequencing technology such as Solexa sequencing.The converted sequences are mapped to the reference genome sequence to identify methyl-cytosines[21,55].novo methyltransferases DRM1(DOMAINS REARRANGED METHYLASE1)and DRM2catalyze new cytosine methylation,while the maintenance of symmetric CG and CHG methylation is mediated by the DNMT1-like enzyme MET1and the plant-specific enzyme Chromomethylase3(CMT3),respectively[20]. Recent studies suggested that MET1and CMT3may also catalyze de novo methylation,while DRM1and DRM2are also important for the maintenance of sym-metric methylation[1,21].Stresses can induce changes in gene expression through hypomethylation or hypermethylation of DNA.In maize roots,cold stress-induced expression of ZmMI1was cor-related with a reduction in methylation in the DNA of the nucleosome core.Even after seven days of recovery,cold-induced hypomethylation was not restored to the basal level[22].In tobacco,aluminum,paraquat,salt,and cold stresses induced-DNA demethylation in the coding sequence of the NtGPDL(a glycerophosphodiesterase-like protein)gene correlated with NtGDPL gene expres-sion[23 ].Osmotic stresses induced transient DNA hypermethyla-tion in two heterochromatic loci in tobacco cell-suspen-sion culture[24].DNA hypermethylation was also induced by drought stress in pea[25].In the facultative halophyte Mesembryanthemum crystallinum L.,drought and salt stresses-induced a switch in photosynthesis mode from C3to CAM.This metabolic change was associated with stress-induced-specific CpHpG-hypermethylation of satellite DNA[26].Transposons constitute a significant portion of plant genomes and are maintained in a repressed state by DNA methylation.Environmental factors may activate transposons through DNA demethylation.In Antirrhinum majus,cold stress induced hypomethylation,and transpo-sition of the Tam-3transposon[27 ].Stress-induced histone modifications can also influence DNA methylation.Knockout mutants and RNAi lines of stress-inducible HDA6of Arabidopsis and HDA101of maize showed an increase in histone acetylation accom-panied by changes in histone methylation pattern and derepression of silenced genes[28,29].Specific histone modification-dependent pathways appear to mediate methylation of about two-thirds of the methylated loci in the Arabidopsis genome[1].Thus,dynamic histone modification marks could be converted into DNA meth-ylation marks,which are often more stable.RNA-directed DNA methylationGenetic analysis using Arabidopsis mutants impaired in genes for siRNA biogenesis or action revealed the invol-vement of small interfering RNAs(siRNAs)in RdDM [20,30].Integration of the Arabidopsisfloral epigenome with thefloral transcriptome and small RNA profiles revealed a direct correlation between the ability of geno-mic sequences to produce small RNAs and DNA meth-ylation[21].In fact,siRNAs are involved in the methylation of at least one-third of methylated loci [21].Studies on the repressor of silencing1(ros1)mutant of Arabidopsis revealed that the DNA glycosylase ROS1 actively demethylates DNA by a base excision repair mechanism and can counteract RdDM[31,32].ROS3, a RNA recognition motif-containing protein,binds to small RNAs and may direct sequence-specific demethyl-ation by ROS1and related DNA demethylases[33 ]. Gene silencing processes can be sensitive to temperature. Temperature and other abiotic stresses can also regulate specific small RNAs.Low temperature promoted virus-induced gene silencing,while high temperature delayed it[34].Endogenous siRNAs that are regulated by abiotic stress have been identified in Arabidopsis[35].In Arabi-dopsis,24-nt SRO5-P5CDH nat-siRNA downregulates the expression of P5CDH mRNAs through mRNA clea-vage,leading to decreased proline degradation,and enhanced proline accumulation and salt stress tolerance [36].This and other stress-regulated siRNAs conceivably could also lead to changes in histone modifications and DNA methylation.Microarray data showed that abiotic stresses and ABA influence the expression of many of the genes implicated in RdDM pathways in Arabidopsis(our unpublished data).Further studies are clearly needed to unravel the roles of RdDM pathway under stress. Plant development under stress Reprogramming of cell differentiation in response to environmental stress leads to phenological and develop-mental plasticity,which are important mechanisms of stress resistance.Phenotypic plasticity helps adjust the durations of various phenological phases in plants,and thus allows plants to avoid exposure of critical growth phases,and especially reproductive development,to stress.Further,adjustment of growth and development is critical for effective use of resources under stress. Germination and vegetative growthOsmotic stress reduces the uniformity of seed germina-tion and seedling establishment.Several HDACs are induced by ABA in Arabidopsis[13 ]and rice[14].Arabi-dopsis HDA19/HD1interacts with a global corepressor of transcription,AtSIN3,which in turn interacts with AtERF7(APETALA2/EREBP-type transcription fac-tor).Suppression of AtERF7and AtSIN3in plants caused hypersensitivity to ABA during germination and seedling growth[37].Arabidopsis HDA6/HDA19double repression lines showed growth arrest after germination and for-mation of embryo-like structures on true leaves[38]. These results suggest that ABA accumulation leads to change in expression or activity of HDACs,which in turn regulate growth under stress.Epigenetics of stress tolerance Chinnusamy and Zhu135Transgenic Arabidopsis overexpressing a SNF2/ BRAHMA-type chromatin remodeling gene AtCHR12 exhibited growth arrest of primary buds and growth reduction of the primary stem.These responses were more pronounced under drought and heat stress than under nonstress conditions.Conversely,the growth arrest response under stress was less in the AtCHR12-knockout mutant than in the WT plants[39 ].Reproductive developmentFlowering and seed development are crucial for plant reproduction.Hence,plants have evolved mechanisms toflower when environmental conditions are appropriate. In Arabidopsis,low temperatures during vernalization induce epigenetic mechanisms which repress the FLOW-ERING LOCUS C(FLC,a MADS-box protein)gene,and the repressed FLC chromatin is maintained till transition toflowering.The mechanisms of mitotic inheritance of the repressed epigenetic state of FLC chromatin and resetting during reproduction are not fully understood [40].Because the low temperatures that induce vernali-zation also induce cold acclimation,some of the gene expression programs could be under common epigenetic control.Mutations in some of the genes involved in stress-related epigenetic processes cause changes inflowering time. The hos15,a freezing sensitive mutant of Arabidopsis, was lateflowering owing to downregulation offlower-ing-regulatory genes SOC and FT[15 ].Plant hormone and stress-regulated HDA6and HDA19may act as a link between stress and developmental cues that controlflow-ering and plant development.Reduction in HDA19 expression in antisense transgenic plants/T-DNA mutants resulted in developmental abnormalities in-cluding delayedflowering[41,42].HDA6-RNAi lines and axe1-5/hda6mutants showed hyperacetylation of histone H3globally,downregulation of JA-responsive genes,upregulation of FLC,and delayedflowering[43 ]. In Arabidopsis,FCA and FPA proteins form an autonom-ousflowering pathway by downregulatingflowering repressor FLC.Both FCA and FPA are RNA-binding proteins that can regulate DNA methylation[44].ABA and drought stress induced the expression of chromatin remodeling gene PsSNF5(Pisum sativum SNF5). PsSNF5interacts with Arabidopsis SWI3-like proteins (SWI3A and SWI3B),which in turn interact with FCA [45,46].ABA-induced SNF5and FCA may regulate flowering time and stress responses through chromatin remodeling.Because stresses reduce crop yield and quality,and ABA regulates seed development partly through epigenetic processes[47],effects of stress on ABA accumulation or epigenetic processes therefore may affect seed/fruit development under stress.SenescenceAbiotic stresses induce premature leaf senescence,which leads to reduced photosynthesis and thus less biomass accumulation.JA–and ethylene-responsive-HDACs, HDA6and HAD19,appear to modulate leaf senescence. Arabidopsis HDA6-RNAi lines and axe1-5(hda6)mutants exhibited downregulation of JA-responsive genes and senescence-associated genes,and delayed senescence as indicated by higher chlorophyll content and PSII activity as compared to WT plants[43 ].In contrast, HDA19antisense transgenic plants/T-DNA mutants showed early senescence[41].Stress memoryUV-C radiation orflagellin(an elicitor of plant defense) induced a high frequency of somatic homologous recom-bination,and the hyper-recombination state was trans-mitted as a dominant trait to untreated progenies of stress-treated parents[48 ].Similarly,tobacco mosaic virus(TMV)infection resulted in a high frequency of somatic and meiotic recombination rates in tobacco.The progeny of TMV-infected plants exhibited hypomethyla-tion in several leucine-rich repeat(LRR)-containing loci and a higher frequency of recombination in hypomethyl-ated LRR-containing TMV(N-gene)resistant gene [49 ].The adaptive value of stress-induced epigenetic plasticity was studied in hypomethylation progenies of5-aza-deox-ycytidine(inhibitor of DNA cytosine methylation)-trea-ted rice seeds.In one of the progenies,methylation was completely erased in Xa21G,a Xa21-like protein gene. The erasure of promoter methylation and inheritance of this epigenetic state resulted in constitutive expression of Xa21G in the progeny line and enhanced resistance to the pathogen Xanthomonas oryzae pv.oryzae,race PR2[50 ]. ConclusionsStress-induced changes in histone variants,histone N-tail modifications,and DNA methylation have been shown to regulate stress-responsive gene expression and plant de-velopment under stress.Transient chromatin modifi-cations mediate acclimation response.Heritable, epigenetic modifications may provide within-generation and transgenerational stress memory(Figure1).It is unclear how much of the stress-induced histone and DNA modification changes that have been observed to date may be epigenetic in nature because little is known about their mitotic or meiotic heritability.Abiotic stress-induced epigenetic changes might have an adaptive advantage.However,stress memory could have a nega-tive impact on crop yield by preventing the plant from growing to its full potential.Thus,stress memory has implications for the use of seeds from stressed crop to raise ensuing crops by the farmers,breeding for stress environments and in situ conservation of plant species. Recent progress in understanding DNA methylation and136Genome studies and molecular geneticsdemethylation,histone modifications,small RNAs and in developing powerful and versatile tools to study these epigenetic processes makes it possible to critically ana-lyze epigenetic stress memory and harness it for crop management and improvement.Conflict of interestThere is no conflict of interest relating to this article.AcknowledgementsThe work in J-KZ lab was supported by National Institutes of Health grants R01GM070795and R01GM059138.References and recommended readingPapers of particular interest,published within the period of review,have been highlighted as:of special interestof outstanding interest1.Zhu JK:Epigenome sequencing comes of age .Cell 2008,133:395-397.2.Thomashow MF:Plant cold acclimation:freezing tolerance genes and regulatory mechanisms .Annu Rev Plant Physiol Plant Mol Biol 1999,50:571-599.3.Iba K:Acclimative response to temperature stress in higher plants:approaches of gene engineering for temperature tolerance .Annu Rev Plant Biol 2002,53:225-245.4.Sridhar VV,Kapoor A,Zhang K,Zhu J,Zhou T,Hasegawa PM,Bressan RA,Zhu JK:Control of DNA methylation andheterochromatic silencing by histone H2B deubiquitination .Nature 2007,447:735-738.5.Zhang K,Sridhar VV,Zhu J,Kapoor A,Zhu JK:Distinctive core histone post-translational modification patterns in Arabidopsis thaliana .PLoS ONE 2007,11:e1210.6.Nathan D,Ingvarsdottir K,Sterner DE,Bylebyl GR,Dokmanovic M,Dorsey JA,Whelan KA,Krsmanovic M,Lane WS,Meluh PB et al.:Histone sumoylation is a negative regulator in Saccharomyces cerevisiae and shows dynamic interplay with positive-acting histone modifications .Genes Dev 2006,20:966-976.7.Camporeale G,Oommen AM,Griffin JB,Sarath G,Zempleni J:K12-biotinylated histone H4marks heterochromatin in human lymphoblastoma cells .J Nutr Biochem 2007,18:760-768.8.Scippa GS,Di Michele M,Onelli E,Patrignani G,Chiatante D,Bray EA:The histone-like protein H1-S and the response of tomato leaves to water deficit .J Exp Bot 2004,55:99-109.9.Tsuji H,Saika H,Tsutsumi N,Hirai A,Nakazono M:Dynamic and reversible changes in histone H3-Lys4methylation and H3acetylation occurring at submergence-inducible genes in rice .Plant Cell Physiol 2006,47:995-1003.Epigenetics of stress tolerance Chinnusamy and Zhu 137Figure1Epigenetic regulation of stress tolerance.Primary and secondary stress signals induce changes in the expression and/or activity of epigenetic regulators namely,small RNAs,RdDM components,histone variants,histone modification enzymes,and chromatin remodeling factors.Theseepigenetic regulators modify histone variants,histone modifications,and DNA methylation.Some of these are heritable epigenetic modifications,while others are transient changes.Transient chromatin modifications mediate acclimation response.Heritable epigenetic modifications provide within-generation and transgenerational stress memory.This study showed that submergence stress-induced histone H3K4 trimethylation and H3acetylation in alcohol dehydrogenase1and pyr-uvate decarboxylase1genes are correlated with enhanced expression of ADH1and PDC1.These histone modifications were restored to the basal level after the stress was relieved.10.Zhou C,Zhang L,Duan J,Miki B,Wu K:HISTONEDEACETYLASE19is involved in jasmonic acid and ethylenesignaling of pathogen response in Arabidopsis.Plant Cell2005, 17:1196-1204.11.Probst AV,Fagard M,Proux F,Mourrain P,Boutet S,Earley K,Lawrence RJ,Pikaard CS,Murfett J,Furner I et al.:Arabidopsis histone deacetylase HDA6is required for maintenance oftranscriptional gene silencing and determines nuclearorganization of rDNA repeats.Plant Cell2004,16:1021-1034. 12.Aufsatz W,Mette MF,Van Der Winden J,Matzke M,Matzke AJ:HDA6,a putative histone deacetylase needed to enhance DNA methylation induced by double-stranded RNA.EMBO J2002, 21:6832-6841.13. Sridha S,Wu K:Identification of AtHD2C as a novel regulator of abscisic acid responses in Arabidopsis.Plant J2006,46:124-133.Authors showed that ABA downregulated AtHD2C expression.Over-expression of AtHD2C resulted in enhanced expression of LEA classgenes,better leaf survival,downregulation of ABI2and K+inward rectify-ing channel genes,suggesting a key role of histone deacetylation in ABAand stress response.14.Fu W,Wu K,Duan J:Sequence and expression analysis ofhistone deacetylases in rice.Biochem Biophys Res Commun2007,356:843-850.15. Zhu J,Jeong J,Zhu Y,Sokolchik I,Miyazaki S,Zhu JK, Hasegawa PM,Bohnert HJ,Shi H,Yun DJ et al.:Involvement of Arabidopsis HOS15in histone deacetylation and cold tolerance.Proc Natl Acad Sci U S A2007,105:4945-4950.This study showed that Arabidopsis HOS15,a WD-40repeat proteint ransducin b eta-l ike protein-1(TBL1),interacts with histone H4and is important for H4deacetylation.Further,H4deacetylation mediated byHOS15regulates stress-responsive andflowering genes,and thus mod-ulates stress tolerance andflowering time.16. Kim JM,To TK,Ishida J,Morosawa T,Kawashima M,Matsui A, Toyoda T,Kimura H,Shinozaki K,Seki M:Alterations of lysine modifications on histone H3N-tail under drought stress conditions in Arabidopsis thaliana.Plant Cell Physiol2008, 49:1580-1588.This study showed that drought-induced expression of stress-responsive genes is associated with an increase in H3K4trimethylation and H3K9 acetylation on the promoter region and H3K23and H3K27acetylation on the coding regions.17.Nowak SJ,Corces VG:Phosphorylation of histone H3correlates with transcriptionally active loci.Genes Dev2000,14:3003-3013.18. Sokol A,Kwiatkowska A,Jerzmanowski A,Prymakowska-Bosak M:Up-regulation of stress-inducible genes in tobacco and Arabidopsis cells in response to abiotic stresses and ABA treatment correlates with dynamic changes in histone H3and H4modifications.Planta2007,227:245-254.This study showed correlation between stress-type-specific gene expression and stress-induced upregulation of histone H3Ser-10phos-phorylation,H3phosphoacetylation,and H4acetylation.19.Stockinger EJ,Mao Y,Regier MK,Triezenberg SJ,Thomashow MF:Transcriptional adaptor and histoneacetyltransferase proteins in Arabidopsis and theirinteractions with CBF1,a transcriptional activator involved in cold regulated gene expression.Nucleic Acids Res2001,29:1524-1533.20.Henderson IR,Jacobsen SE:Epigenetic inheritance in plants.Nature2007,447:418-424.21.Lister R,O’Malley RC,Tonti-Filippini J,Gregory BD,Berry CC,Millar AH,Ecker JR:Highly integrated single-base resolutionmaps of the epigenome in Arabidopsis.Cell2008,133:523-536.22.Steward N,Ito M,Yamaguchi Y,Koizumi N,Sano H:Periodic DNAmethylation in maize nucleosomes and demethylation byenvironmental stress.J Biol Chem2002,277:37741-37746.23.Choi CS,Sano H:Abiotic-stress induces demethylation andtranscriptional activation of a gene encoding aglycerophosphodiesterase-like protein in tobacco plants.Mol Genet Genome2007,277:589-600.This study showed that aluminium,salt,cold,and oxidative stresses induced DNA demethylation in the coding sequence of the NtGPDL gene within one hour in leaves,and this demethylation correlated with NtGDPL gene expression.24.Kovarik A,Koukalova B,Bezdek M,Opatrn Z:Hypermethylationof tobacco heterochromatic loci in response to osmoticstress.Theor Appl Genet1997,95:301-306.bra M,Ghiani A,Citterio S,Sgorbati S,Sala F,Vannini C,Ruffini-Castiglione M,Bracale M:Analysis of cytosine methylationpattern in response to water deficit in pea root tips.Plant Biol (Stuttgart)2002,4:694-699.26.Dyachenko OV,Zakharchenko NS,Shevchuk TV,Bohnert HJ,Cushman JC,Buryanov YI:Effect of hypermethylation ofCCWGG sequences in DNA of Mesembryanthemumcrystallinum plants on their adaptation to salt stress.Biochemistry(Moscow)2006,71:461-465.27.Hashida SN,Uchiyama T,Martin C,Kishima Y,Sano Y,Mikami T: The temperature-dependent change in methylation of theAntirrhinum transposon Tam3is controlled by the activity of its transposase.Plant Cell2006,18:104-118.Authors showed that low temperature decreases DNA methylation and promotes Tam3transposase binding in demethylated cytosine motif and thus enhances tranposition of Tam3.28.Earley K,Lawrence RJ,Pontes O,Reuther R,Enciso AJ,Silva M,Neves N,Gross M,Viegas W,Pikaard CS:Erasure of histoneacetylation by Arabidopsis HDA6mediates large-scalegene silencing in nucleolar dominance.Genes Dev2006,20:1283-1293.29.Rossi V,Locatelli S,Varotto S,Donn G,Pirona R,Henderson DA,Hartings H,Motto M:Maize histone deacetylase hda101isinvolved in plant development,gene transcription,andsequence-specific modulation of histone modification ofgenes and repeats.Plant Cell2007,19:1145-1162.30.Pontes O,Li CF,Nunes PC,Haag J,Ream T,Vitins A,Jacobsen SE,Pikaard CS:The Arabidopsis chromatin-modifying nuclear siRNA pathway involves a nucleolar RNAprocessing center.Cell2006,126:79-92.31.Gong Z,Morales-Ruiz T,Ariza RR,Roldan-Arjona T,David L,Zhu JK:ROS1,a repressor of transcriptional gene silencing in Arabidopsis,encodes a DNA glycosylase/lyase.Cell2002,111:803-814.32.Agius F,Kapoor A,Zhu JK:Role of the Arabidopsis DNAglycosylase/lyase ROS1in active DNA demethylation.ProcNatl Acad Sci U S A2006,103:11796-11801.33.Zheng X,Pontes O,Zhu J,Miki D,Zhang F,Li WX,Iida K,Kapoor A, Pikaard CS,Zhu JK:ROS3is an RNA-binding protein required for DNA demethylation in Arabidopsis.Nature2008,455:1259-1262. This study showed that a small RNA-binding protein,ROS3,facilitates sequence-specific demethylation by the DNA glycosylase ROS1.34.Tuttle JR,Idris AM,Brown JK,Haigler CH,Robertson D:Geminivirus-mediated gene silencing from cotton leafcrumple virus is enhanced by low temperature in cotton.Plant Physiol2008,148:41-50.35.Sunkar R,Zhu JK:Novel and stress-regulated microRNAsand other small RNAs from Arabidopsis.Plant Cell2004,16:2001-2019.36.Borsani O,Zhu J,Verslues PE,Sunkar R,Zhu JK:EndogenoussiRNAs derived from a pair of natural cis-antisense transcripts regulate salt tolerance in Arabidopsis.Cell2005,123:1279-1291.37.Song CP,Agarwal M,Ohta M,Guo Y,Halfter U,Wang P,Zhu JK:Role of an Arabidopsis AP2/EREBP-type transcriptionalrepressor in abscisic acid and drought stress responses.Plant Cell2005,17:2384-2396.38.Tanaka M,Kikuchi A,Kamada H:The Arabidopsis histonedeacetylases HDA6and HDA19contribute to the repression of embryonic properties after germination.Plant Physiol2008,146:149-161.138Genome studies and molecular genetics。
亚硫酸氢钠和碳酸氢钾对甜菜光合作用、块根产量及含糖率的影响斯琴;魏磊;田自华;邵金旺;李国荣;史树德【摘要】为了探讨外施低浓度亚硫酸氢钠和碳酸氢钾对甜菜光合碳代谢与块根产质量形成的内在机制及其在生产上应用的前景,以甜菜品种农大甜研4号为试验材料,在大田条件下,研究了喷洒亚硫酸氢钠(200 mg/L)和碳酸氢钾(700 mg/L)对甜菜叶片光合作用、光合作用相关酶以及块根产量和含糖率的影响.结果表明:NaHSO3和KHCO3喷施甜菜叶片,可显著提高甜菜叶片净光合速率、PEPCase和Rubisco 酶活性(P<0.01);气孔导度和胞间CO2浓度表现为前期升高后期下降的趋势,表明后期光合速率间的差异是非气孔因素占主导地位;收获期块根重量及含糖率分别较对照增加7.1%~23.2%和10.5%~20.3%.【期刊名称】《华北农学报》【年(卷),期】2010(025)003【总页数】5页(P212-216)【关键词】甜菜;亚硫酸氢钠;碳酸氢钾;净光合速率;含糖率;产量【作者】斯琴;魏磊;田自华;邵金旺;李国荣;史树德【作者单位】内蒙古农业大学,农学院,内蒙古,呼和浩特,010019;内蒙古农业大学,农学院,内蒙古,呼和浩特,010019;内蒙古农业大学,农学院,内蒙古,呼和浩特,010019;内蒙古农业大学,甜菜生理研究所,内蒙古,呼和浩特,010018;内蒙古呼伦贝尔市海拉尔区农业技术推广中心,内蒙古,呼伦贝尔,021008;内蒙古农业大学,农学院,内蒙古,呼和浩特,010019【正文语种】中文【中图分类】S566.3甜菜是以在块根中积累蔗糖为主的经济作物,而糖分积累和块根产量形成的一个重要基础是叶片的光合作用,因此提高甜菜叶片光合效率是甜菜获得丰产高糖的有效途径之一[1-3]。
已有的研究表明,亚硫酸氢钠(NaHSO3)处理可促进PSⅡ的电子传递速率,低浓度NaHSO3可能是通过促进围绕PSⅠ的循环电子传递及其偶联的光合磷酸化而促进光合作用,从而提高产量和改善品质以及提高抗逆性[4-10];碳酸氢钾(KHCO3)可以作为碳源来补充叶片细胞间隙CO2的不足,诱导和提高光合作用中磷酸烯醇式丙酮酸羧化酶(PEPCase)和核酮糖-1,5-二磷酸羧化/加氧酶(Rubisco)活性和含量,从而提高叶片的光合效率[11-15]。