商务统计学 2015期中考试卷
- 格式:doc
- 大小:96.50 KB
- 文档页数:7
统计学期中考试试卷考试时间:120分钟总分:100分一、选择题(每题2分,共20分)1. 统计学中,描述数据集中趋势的度量是:A. 方差B. 标准差C. 平均数D. 众数2. 下列哪项不是统计学中的抽样方法?A. 简单随机抽样B. 分层抽样C. 系统抽样D. 整体抽样3. 假设检验中,如果原假设为H0:μ = 50,备择假设为H1:μ ≠ 50,当检验结果拒绝原假设时,说明:A. 样本均值等于50B. 样本均值不等于50C. 样本方差等于50D. 样本方差不等于50...(此处省略剩余选择题)二、填空题(每空1分,共10分)请根据题目所给的数据,计算下列统计量:1. 平均数()2. 中位数()3. 众数()4. 方差()5. 标准差()...(此处省略剩余填空题)三、简答题(每题10分,共20分)1. 请简述相关系数和回归系数的区别。
2. 请解释什么是置信区间,并说明其在统计推断中的作用。
四、计算题(每题15分,共30分)1. 给定一组数据:23, 28, 31, 36, 40, 42, 49, 55, 58, 62。
请计算这组数据的平均数、中位数、众数、方差和标准差。
2. 假设某工厂生产的产品,其重量服从正态分布,平均重量为50克,标准差为2克。
如果从这批产品中随机抽取100件产品,请计算这100件产品的平均重量的95%置信区间。
五、论述题(20分)请论述统计学在数据分析中的重要性,并举例说明统计方法在实际问题中的应用。
考试结束,请考生停止答题并交卷。
[注:本试卷仅为示例,具体题目和内容应根据实际教学大纲和课程内容进行调整。
]。
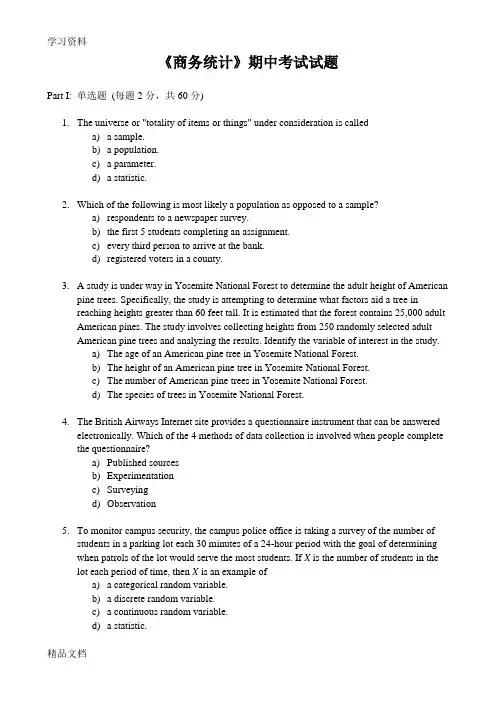
《商务统计》期中考试试题Part I: 单选题(每题2分,共60分)1.The universe or "totality of items or things" under consideration is calleda) a sample.b) a population.c) a parameter.d) a statistic.2.Which of the following is most likely a population as opposed to a sample?a)respondents to a newspaper survey.b)the first 5 students completing an assignment.c)every third person to arrive at the bank.d)registered voters in a county.3. A study is under way in Yosemite National Forest to determine the adult height of Americanpine trees. Specifically, the study is attempting to determine what factors aid a tree inreaching heights greater than 60 feet tall. It is estimated that the forest contains 25,000 adult American pines. The study involves collecting heights from 250 randomly selected adultAmerican pine trees and analyzing the results. Identify the variable of interest in the study.a)The age of an American pine tree in Yosemite National Forest.b)The height of an American pine tree in Yosemite National Forest.c)The number of American pine trees in Yosemite National Forest.d)The species of trees in Yosemite National Forest.4.The British Airways Internet site provides a questionnaire instrument that can be answeredelectronically. Which of the 4 methods of data collection is involved when people complete the questionnaire?a)Published sourcesb)Experimentationc)Surveyingd)Observation5.To monitor campus security, the campus police office is taking a survey of the number ofstudents in a parking lot each 30 minutes of a 24-hour period with the goal of determiningwhen patrols of the lot would serve the most students. If X is the number of students in the lot each period of time, then X is an example ofa) a categorical random variable.b) a discrete random variable.c) a continuous random variable.d) a statistic.6.An insurance company evaluates many numerical variables about a person before decidingon an appropriate rate for automobile insurance. A representative from a local insurance agency selected a random sample of insured drivers and recorded, X, the number of claims each made in the last 3 years, with the following results.X frequency1 142 183124 55 1Referring to the table, how many total claims are represented in the sample?a)15b)50c)111d)250(For Q7 and Q8) A survey was conducted to determine how people rated the quality of programming available on television. Respondents were asked to rate the overall quality from 0 (no quality at all) to 100 (extremely good quality). The stem-and-leaf display of the data is shown below.Stem Leaves3 244 034789995 01123456 125667 0189 27.Referring to the table, what percentage of the respondents rated overall television qualitywith a rating of 80 or above?a)0b) 4c)96d)1008.Referring to the table, what percentage of the respondents rated overall television qualitywith a rating between 50 and 75?a)11b)40c)44d)56(For Q9 and Q10) The following are the durations in minutes of a sample of long-distance phone calls made reported by one long-distance carrier.Time (in Minutes) Relative Frequency0 but less than 5 0.375 but less than 10 0.2210 but less than 15 0.1515 but less than 20 0.1020 but less than 25 0.0725 but less than 30 0.0730more 0.029.Referring to the table, if 1,000 calls were randomly sampled, how many calls lasted under10 minutes?a)220b)370c)410d)59010.Referring to the table, if 100 calls were randomly sampled, how many calls lasted 15minutes or longer?a)10b)14c)26d)7411.You have collected data on the approximate retail price (in $) and the energy cost per year(in $) of 15 refrigerators. Which of the following is the best for presenting the data?a) A pie chart.b) A scatter diagram.c) A Pareto diagram.d) A contingency table.(For Q12 and Q13) The histogram below represents scores achieved by 200 job applicants on a personality profile.12.Referring to the histogram, ________ percent of the job applicants scored between 10 and20.a)10%b)20%c)30%d)40%13.Referring to the histogram, the number of job applicants who scored between 30 and below60 is _______.a)20b)40c)60d)8014.Which measure of central tendency can be used for both numerical and categoricalvariables?a)Arithmetic mean.b)Median.c)Mode.d)Standard deviation.15.Which of the following statements about the median is not true?a)It is more affected by extreme values than the arithmetic mean.b)It is a measure of central tendency.c)It is equal to Q2.d)It is equal to the mode in bell-shaped "normal" distributions.16.When extreme values are present in a set of data, which of the following descriptivesummary measures are most appropriate:a)CV and range.b)arithmetic mean and standard deviation.c)interquartile range and median.d)variance and interquartile range.17.A probability distribution is an equation thata)associates a particular probability of occurrence with each outcome in the samplespace.b)measures outcomes and assigns values of X to the simple events.c)assigns a value to the variability in the sample space.d)assigns a value to the center of the sample space.18.In a binomial distributiona)the random variable Xb)the probability of event of interest is stable from trial to trial.c)the number of trials nd)the results of one trial are dependent on the results of the other trials.19.A lab orders 100 rats a week for each of the 52 weeks in the year for experiments that thelab conducts. Prices for 100 rats follow the following distribution:Price: $10.00 $12.50 $15.00Probability: 0.35 0.40 0.25How much should the lab budget for next year’s rat orders be, assuming this distribution does not change?a)$520b)$637c)$650d)$78020.A multiple-choice test has 30 questions. There are 4 choices for each question. A studentwho has not studied for the test decides to answer all questions randomly. What type of probability distribution can be used to figure out his chance of getting at least 20 questions right?a)binomial distribution.b)Poisson distribution.c)normal distribution.d)none of the above.21.In its standardized form, the normal distributiona)has a mean of 0 and a standard deviation of 1.b)has a mean of 1 and a variance of 0.c)has an area equal to 0.5.d)cannot be used to approximate discrete probability distributions.22.For some positive value of Z, the probability that a standard normal variable is between 0and Z is 0.3340. The value of Z isa)0.07b)0.37c)0.97d) 1.0623.The owner of a fish market determined that the average weight for a catfish is 3.2 poundswith a standard deviation of 0.8 pound. A citation catfish should be one of the top 2% in weight. Assuming the weights of catfish are normally distributed, at what weight (in pounds) should the citation designation be established?a) 1.56 poundsb) 4.44 poundsc) 4.84 poundsd) 5.20 pounds24.If a particular batch of data is approximately normally distributed, we would find thatapproximatelya) 2 of every 3 observations would fall betweenb) 4 of every 5 observations would fall betweenc)d)All the above.25.Which of the following about the binomial distribution is not a true statement?a)The probability of event of interest must be constant from trial to trial.b)Each outcome is independent of the other.c)The random variable of interest is continuous.d)Each outcome may be classified as either "event of interest" or "not event ofinterest."26.Why is the Central Limit Theorem so important to the study of sampling distributions?a)It allows us to disregard the size of the sample selected when the population is notnormal.b)It allows us to disregard the shape of the sampling distribution when the size of thepopulation is large.c)It allows us to disregard the size of the population we are sampling from.d)It allows us to disregard the shape of the population when n is large.27.Suppose a sample of n = 50 items is drawn from a population of manufactured products andthe weight, X, of each item is recorded. Prior experience has shown that the weight has aprobability distribution with = 6 ounces and = 2.5 ounces. Which of the following isa)The mean of the sampling distribution is 6 ounces.b)The standard deviation of the sampling distribution is 2.5 ounces.c)The shape of the sample distribution is approximately normal.d)All of the above are correct.28.For some positive value of X, the probability that a standard normal variable is between 0and +2X is 0.1255. The value of X isa)0.99b)0.40c)0.32d)0.1629.A campus program evenly enrolls undergraduate and graduate students. If a random sampleof 4 students is selected from the program to be interviewed about the introduction of a new fast food outlet on the ground floor of the campus building, what is the probability that all 4 students selected are undergraduate students?a)0.0256b)0.0625c)0.16d) 1.0030.If two events are collectively exhaustive, what is the probability that both occur at the sametime?a)0.b)0.50.c) 1.00.d)Cannot be determined from the information given.Part II: 计算题:Q1. 某证券公司为了分析上市公司股票价格与公司净资产收益率的关系,收集了各个上市公(10分)。
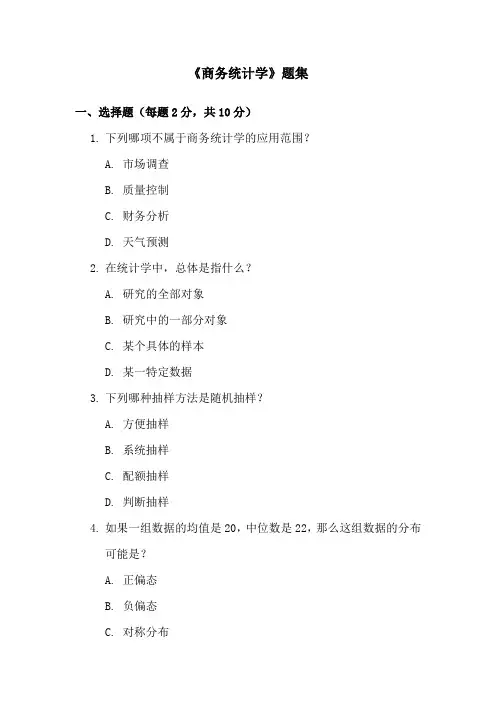
《商务统计学》题集一、选择题(每题2分,共10分)1.下列哪项不属于商务统计学的应用范围?A. 市场调查B. 质量控制C. 财务分析D. 天气预测2.在统计学中,总体是指什么?A. 研究的全部对象B. 研究中的一部分对象C. 某个具体的样本D. 某一特定数据3.下列哪种抽样方法是随机抽样?A. 方便抽样B. 系统抽样C. 配额抽样D. 判断抽样4.如果一组数据的均值是20,中位数是22,那么这组数据的分布可能是?A. 正偏态B. 负偏态C. 对称分布D. 无法确定5.在回归分析中,解释变量和被解释变量分别是什么?A. 因变量和自变量B. 自变量和因变量C. 都是自变量D. 都是因变量二、填空题(每空1分,共10分)1.在统计学中,用来衡量数据分布集中趋势的指标有______、______和______。
2.若一组数据的四分位数Q1=10,Q2=20,Q3=30,则该组数据的中位数为______。
3.在假设检验中,如果P值小于显著性水平α,则我们______原假设。
4.统计表中,频数和频率分别表示数据的______和______。
5.在回归分析中,回归系数的经济意义是解释变量每增加一个单位,被解释变量平均增加______单位。
三、判断题(每题1分,共10分)1.统计学的目的是收集、整理、分析和解释数据,从而帮助人们做出决策。
( )2.在正态分布中,均值、中位数和众数三者相等。
( )3.标准差是衡量数据波动大小的一个重要指标,标准差越大,说明数据的波动越大。
( )4.在假设检验中,如果P值大于显著性水平α,则我们有足够的证据拒绝原假设。
( )5.相关系数r的取值范围是[-1, 1],r=1表示完全正相关,r=-1表示完全负相关。
( )6.如果一组数据的偏度系数大于0,则说明这组数据是正偏态分布。
( )7.在抽样调查中,样本容量越大,抽样误差就越小。
( )8.统计推断是通过样本数据来推断总体的特征。
( )9.移动平均法是一种常用的时间序列预测方法。
商务经济统计试题及答案一、单项选择题1. 商务统计中,用于描述数据集中趋势的指标是:A. 方差B. 标准差C. 平均数D. 众数答案:C2. 在商务经济统计中,下列哪项不是统计量?A. 均值B. 标准差C. 样本容量D. 极差答案:C3. 以下哪项不是时间序列分析的类型?A. 季节性分析B. 趋势分析C. 相关性分析D. 循环分析答案:C二、多项选择题1. 商务统计中,以下哪些因素会影响数据的变异性?A. 数据的分布形态B. 数据的集中趋势C. 数据的离散程度D. 数据的样本大小答案:A、C2. 在进行商务经济预测时,常用的统计方法包括:A. 回归分析B. 指数平滑法C. 移动平均法D. 季节性调整答案:A、B、C三、简答题1. 简述商务统计中的指数平滑法的基本原理。
答案:指数平滑法是一种时间序列预测方法,它通过对历史数据加权平均来预测未来值。
权重随着时间的递减而递减,即近期的数据比远期的数据在预测中占有更大的权重。
这种方法可以平滑掉数据中的随机波动,从而更好地反映数据的趋势。
2. 描述商务统计中相关系数的计算方法及其意义。
答案:相关系数是用来衡量两个变量之间线性关系强度和方向的统计量。
其计算公式为:\[ r = \frac{\sum (X_i - \bar{X})(Y_i -\bar{Y})}{\sqrt{\sum (X_i - \bar{X})^2 \sum (Y_i -\bar{Y})^2}} \] 其中,\( X_i \) 和 \( Y_i \) 分别是两个变量的观测值,\( \bar{X} \) 和 \( \bar{Y} \) 是它们的平均值。
相关系数的值介于-1和1之间,值越接近1或-1表示变量间的线性关系越强,正值表示正相关,负值表示负相关。
四、计算题1. 假设有一组商务数据,其平均值为100,标准差为15。
如果某次测量结果为120,计算该结果的Z分数。
答案:Z分数的计算公式为:\[ Z = \frac{(X - \mu)}{\sigma} \]其中,\( X \) 是测量结果,\( \mu \) 是平均值,\( \sigma \) 是标准差。
精选全文完整版(可编辑修改)《商务统计》试题5------------------------------------------------------------------------------------------------------------------------一、判断题(每题1分,共10分)1.应用切比雪夫定理估计与平均数的距离在z个标准差之内的数据项所占比例时,z的取值可以是任意正数( )。
2.条形图和直方图都可以用于描述分类数据的频数分布、相对频数分布或百分比频数分布( )。
3.在样本容量一定的情况下,为了确保更高的置信度,置信区间的宽度必须变大( )。
4.事件A与其补A c是互斥的( )。
5.无论是单侧检验还是双侧检验,如果p值≤α,则拒绝原假设H0( )。
6.对于简单随机样本,样本均值x̅的数学期望、标准差受到样本容量n的影响 ( )。
7.在联列表中,两个变量必须都是分类变量或者都是数值型变量( )。
8.当分类数据用数值表示时,可以进行有意义的算术运算( )。
9.在满足一定条件时,可以用正态分布近似计算二项分布 ( )。
10.方差分析仅能用于实验性研究得到的数据而不能用于观测性研究得到的数据( )。
二、单项选择题(每题2分,共30分)1.由于改变生产方法所需的时间和成本都很大,所以在一种新方法实施之前,制造负责人必须使管理人员确信,推荐的制造方法能降低成本。
目前生产方法的平均成本是每小时22美元。
一项调研工作是在样本生产期同,测量新方法的成本。
以下假设合适的是( )。
A. H0:μ≥22 H a:μ<22B.H0:μ≤22 H a:μ>22C.H0:μ>22 H a:μ≤22D.H0:μ<22 H a:μ≥222.以下关于众数的说法错误的是( )。
A.众数是数据集中出现频率最高的数据值B.众数仅适用于数值型数据C.众数是一种位置度量指标D.众数有可能存在两个或更多3.以下关于事件的概率说法错误的是( )。
商务统计试题及答案### 商务统计试题及答案#### 一、选择题1. 统计数据收集的方法不包括以下哪项?- A. 观察法- B. 实验法- C. 调查法- D. 假设法答案:D2. 以下哪项不是描述性统计分析的内容?- A. 数据的分类- B. 数据的汇总- C. 数据的推断- D. 数据的图表展示答案:C3. 在统计学中,中位数是指:- A. 数据集中出现次数最多的数值- B. 数据集的算术平均值- C. 将数据集从小到大排列后位于中间位置的数值 - D. 所有数据的和除以数据的个数答案:C#### 二、简答题1. 解释什么是标准差,并简述其在商务统计中的重要性。
标准差是衡量一组数据离散程度的统计量,它表示数据集中的数值与平均值的偏差平方的平均数的平方根。
在商务统计中,标准差用于评估数据的波动性,帮助决策者了解业务风险和市场波动。
2. 描述相关系数的概念及其在商务分析中的应用。
相关系数是度量两个变量之间线性关系强度和方向的统计指标。
在商务分析中,相关系数可以用来评估不同因素对业务结果的影响,例如,销售额与广告支出之间的关系。
#### 三、计算题1. 给定以下数据集:10, 12, 15, 20, 25, 请计算平均值、中位数和标准差。
- 平均值 = (10 + 12 + 15 + 20 + 25) / 5 = 18- 中位数 = 15(数据集从小到大排列后位于中间位置的数值)- 标准差= √[(Σ(xi - 平均值)²) / n] = √[(10 - 18)² + (12 - 18)² + ... + (25 - 18)²] / 5 ≈ 5.392. 假设某公司连续5个月的销售额分别为:30万、35万、40万、45万和50万。
计算这5个月的平均销售额和销售额的增长趋势。
- 平均销售额 = (30 + 35 + 40 + 45 + 50) / 5 = 40万- 销售额的增长趋势可以通过计算每月销售额的增长率来分析,例如,从第一个月到第二个月的增长率为 (35 - 30) / 30 * 100% = 16.67%。
商务统计学[单项选择题]1、在数据采集活动中,进行观测记录的单位与总体中的个体()A.必须相同B.必须不同C.可以相同,也可以不同D.完全没有关系参考答案:C[单项选择题]2、对于内部差异很大且有明显的不同类型界限或标志的总体,进行抽样调查应该采用的抽样方式是()A.简单随机抽样B.系统抽样C.分层抽样D.整群抽样参考答案:C[单项选择题]3、如果观测变量的取值很多且数值成比例变化,则编制次数分布表时采用()A.单值B.等距分组C.异距分组D.复合分组参考答案:C[单项选择题]4、统计指标是用来测度统计活动研究对象某种特征数量的()A.概念B.数值C.概念和数值D.数值尺度参考答案:A[单项选择题]5、统计推断是一种()A.演绎推理B.完全归纳推理C.不完全归纳推理D.非逻辑推理参考答案:C[单项选择题]6、根据斯特吉斯公式,对于样本容量为1000的一个观测样本,采用等距分组,其组数应该为()A.9组B.10组C.11组D.12组参考答案:C[单项选择题]7、对于由观测变量的各个分组和各组变量总值顺序排列的分组分布表,计算算术平均数需采用的计算公式为()A.简单算术平均数B.加权算术平均数C.简单调和平均数D.加权调和平均数参考答案:D[单项选择题]8、随机变量的观测值中出现次数最多的变量值是该变量的()A.众数B.中位数C.极值D.均值参考答案:A[单项选择题]9、两个观测值之间如果存在同方向的线性函数关系,则二者的相关关系为()A.0B.1C.-1D.0.5参考答案:B[单项选择题]10、对于同一数据,所计算出的平均差与标准差相比,通常有()A.平均差大于标准差B.平均差小于标准差C.平均差等于标准差D.二者关系不定参考答案:B[单项选择题]11、变量x和y的相关系数的符号,取决于()A.变量x的标准差B.变量y的标准差C.变量x和y两个标准差的乘积D.变量x和y的协方差参考答案:D[单项选择题]12、对于从所考察总体中随机抽取的一个大样本,其样本均值近似服从()A.正态分布B.x2分布C.t分布D.均匀分布参考答案:A[单项选择题]13、抽样分布是指()A.抽取样本的总体分布B.样本自身的分布C.样本统计量的分布D.抽样观测变量的分布参考答案:C[单项选择题]14、如果θ^是该参数θ的一致估计,则随着样本容量n的增大,有()A.θ^的数值接近于总体参数θB.θ^的期望等于总体参数θC.θ^的方差接近于总体参数θD.θ^的方差接近于总体方差σ2参考答案:A[单项选择题]15、在假设检验中,犯第一类错误的概率等于()A.αB.βC.1-αD.1-β参考答案:A[单项选择题]16、在给定的显著性水平之下,进行假设检验,确定拒绝域的依据是()A.原假设为真的条件下检验统计量的概率分布B.备择假设为真的条件下检验统计量的概率分布C.观测变量的总体概率分布D.观测变量的样本分布参考答案:A[单项选择题]17、在单因子方差分析中,如果各个因子水平效应相同的原假设为真,则组间平方和SSA()A.等于0B.等于总平方和C.完全由观测的随机误差引起D.完全由各因子水平的差异引起参考答案:C[单项选择题]18、在方差分析中,所考察的影响观测变量的各个因子都必须()A.属性化B.数量化C.同质化D.差异化参考答案:A[单项选择题]19、使用最小二乘法估计得出的样本回归直线必然通过点()A.(0,0)B.(x,0)C.(0,y)D.(x,y)参考答案:D[单项选择题]20、居民家庭人均消费支出的差异随着家庭人均收入的提高而增加,这种现象称为()A.直线趋势B.曲线趋势C.异方差D.异常数据参考答案:C[单项选择题]21、累计采样所得到的时间序列是()A.时点序列B.时期序列C.特征序列D.平稳序列参考答案:B更多内容请访问《睦霖题库》微信公众号[单项选择题]22、已知一个时间序列的最初水平和最末水平,要计算各期的平均增长速度,则应采用的计算方法为()A.算术平均法B.几何平均法C.代数平均法D.调和平均法参考答案:B[单项选择题]23、如果时间序列的环比增长量大致相等,则应采用的趋势模型为()A.直线趋势模型B.指数曲线趋势模型C.二次曲线趋势模型D.修正指数曲线趋势模型参考答案:A[单项选择题]24、非概率型决策是一种()A.确定性决策B.非确定性决策C.等可能性决策D.非计算性决策参考答案:B[单项选择题]25、期望损益准则特别适用于()A.重复性决策B.一次性决策C.确定性决策D.非概率型决策参考答案:A[单项选择题]26、劳动生产率指数是一个()。
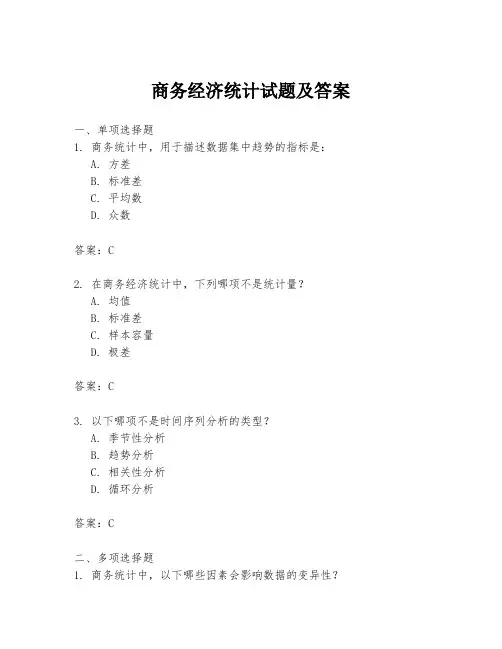
商务经济统计试题及答案一、单项选择题(每题2分,共20分)1. 商务经济统计的主要研究对象是什么?A. 社会经济现象B. 社会文化现象C. 自然现象D. 政治现象答案:A2. 下列哪项不是统计数据的来源?A. 人口普查B. 社会调查C. 历史记录D. 个人猜测答案:D3. 在商务经济统计中,下列哪项是描述性统计分析的内容?A. 预测未来趋势B. 描述数据特征C. 制定政策D. 进行假设检验答案:B4. 统计学中的“参数”是指什么?A. 样本数据B. 总体数据C. 样本容量D. 总体数量答案:B5. 以下哪个概念不是概率论的基本概念?A. 随机事件B. 概率C. 总体D. 样本答案:C6. 商务经济统计中,平均数通常用来衡量数据的什么?A. 集中趋势B. 离散程度C. 偏态分布D. 正态分布答案:A7. 在统计学中,标准差是用来衡量什么的?A. 集中趋势B. 离散程度C. 平均值D. 偏态分布答案:B8. 下列哪项是统计学中用于描述数据分布形状的指标?A. 平均数B. 标准差C. 众数D. 方差答案:C9. 在商务经济统计中,相关系数的取值范围是多少?A. -1到1B. 0到1C. 1到10D. -10到10答案:A10. 以下哪种图表最适合展示时间序列数据?A. 条形图B. 饼图C. 折线图D. 散点图答案:C二、多项选择题(每题3分,共15分)1. 商务经济统计中常用的数据收集方法包括哪些?A. 问卷调查B. 观察法C. 实验法D. 抽样调查答案:ABD2. 下列哪些是描述数据集中趋势的统计量?A. 平均数B. 中位数C. 众数D. 方差答案:ABC3. 在商务经济统计中,下列哪些因素会影响数据的代表性?A. 样本容量B. 抽样方法C. 样本误差D. 总体大小答案:AB4. 统计学中,下列哪些方法可以用来检验假设?A. t检验B. 卡方检验C. 回归分析D. 方差分析答案:ABD5. 在商务经济统计中,下列哪些图表可以用来展示数据的分布?A. 条形图B. 直方图C. 箱线图D. 散点图答案:ABC三、简答题(每题5分,共20分)1. 简述商务经济统计在企业决策中的作用。
商务统计试题及答案一、单项选择题(每题2分,共20分)1. 商务统计中,数据的收集方法不包括以下哪一项?A. 观察法B. 实验法C. 调查法D. 推算法答案:D2. 在统计学中,总体是指:A. 研究对象的全体B. 研究对象的一部分C. 研究对象的个体D. 研究对象的样本答案:A3. 下列哪个选项不是描述数据集中趋势的统计量?A. 平均数B. 中位数C. 方差D. 众数答案:C4. 在商务统计中,相关系数的取值范围是:A. -1到1之间B. 0到1之间C. 1到10之间D. 任何实数答案:A5. 以下哪种图表最适合展示时间序列数据的变化趋势?A. 条形图B. 饼图C. 折线图D. 散点图答案:C6. 假设检验的目的是:A. 确定总体参数B. 估计总体参数C. 验证样本数据D. 验证总体参数答案:D7. 在回归分析中,自变量和因变量之间的关系是:A. 正相关B. 负相关C. 无关D. 线性关系答案:D8. 下列哪个选项不是统计分析中常见的数据类型?A. 定类数据B. 定序数据C. 定距数据D. 定性数据答案:D9. 标准差是衡量数据离散程度的统计量,其计算公式为:A. 平均数的平方B. 平均数的平方根C. 方差的平方根D. 方差的倒数答案:C10. 以下哪个统计量用于衡量数据的偏态?A. 均值B. 方差C. 偏度D. 峰度答案:C二、多项选择题(每题3分,共15分)1. 下列哪些是商务统计中常用的数据收集方法?A. 观察法B. 实验法C. 调查法D. 推算法答案:ABC2. 在商务统计中,描述数据集中趋势的统计量包括:A. 平均数B. 中位数C. 方差D. 众数答案:ABD3. 以下哪些是描述数据离散程度的统计量?A. 标准差B. 方差C. 偏度D. 峰度答案:AB4. 在统计学中,总体参数和样本统计量的区别在于:A. 总体参数是固定的B. 样本统计量是估计值C. 总体参数是估计值D. 样本统计量是固定的答案:AB5. 下列哪些是商务统计中常见的数据类型?A. 定类数据B. 定序数据C. 定距数据D. 定性数据答案:ABC三、判断题(每题2分,共10分)1. 商务统计中,数据收集的方法只有调查法和观察法。
统计学期中考试题统计学是一门研究数据收集、分析、解释、呈现和预测的科学。
在学期中,考试通常包括对统计基本概念的理解和应用。
以下是一份可能的统计学期中考试题内容:一、选择题(每题2分,共20分)1. 以下哪个是描述性统计的度量?A. 均值B. 方差C. 标准差D. 相关系数2. 假设检验的目的是:A. 确定总体参数的确切值B. 估计总体参数的范围C. 确定样本数据是否代表总体D. 预测未来数据3. 以下哪个不是正态分布的特点?A. 对称性B. 均值等于中位数C. 所有数据都集中在均值附近D. 尾部逐渐接近但永不触及X轴4. 相关系数的取值范围是:A. -1 到 1B. 0 到 1C. -∞ 到+∞D. 1 到∞5. 以下哪个是统计推断的一部分?A. 均值计算B. 频率分布C. 置信区间D. 箱线图...二、简答题(每题10分,共30分)1. 解释什么是抽样分布,并给出一个例子说明其重要性。
2. 描述中心极限定理,并解释为什么它在统计学中如此重要。
3. 解释什么是假设检验,并简述其基本步骤。
三、计算题(每题15分,共30分)1. 给定一组数据:23, 27, 29, 31, 33, 35, 37, 39, 41, 43。
计算其均值、中位数、方差和标准差。
2. 假设你进行了一项研究,收集了两组数据,A组和B组,每组有30个观测值。
A组的平均得分是75,标准差是10;B组的平均得分是70,标准差是8。
使用t检验来确定两组之间是否存在显著差异。
四、应用题(每题20分,共20分)1. 一家公司想要评估其新产品的市场接受度。
他们随机选择了100名消费者进行调查,其中70人表示他们喜欢这款新产品。
使用适当的统计方法来估计整个市场对这款新产品的接受度,并给出95%的置信区间。
请注意,这只是一个示例,实际的考试内容会根据课程的具体要求和教学大纲而有所不同。

《统计学》期中试卷〔15上〕浙江财经学院课程期中考试试卷浙江财经学院2022~2022学年第二学期密封线《统计学》课程期中试卷考核方式:闭卷考试日期:年月日适用专业、班级:题号得分评卷人一二三四五总分专业、班级:学号:姓名:〔共五大题〕一、单项选择〔每题1分,共20分〕1、以杭州的全部工业企业为总体,那么娃哈哈集团公司的工业增加值是〔〕A、数量标志B、品质标志C、质量指标D、数量指标2、以下属于时点数列的是〔〕 A、某厂各年工业产值 B、某厂各年劳动生产率 C、某厂各年生产工人占全部职工的比重 D、某厂各年年初职工人数3、某市统计局欲对该市职工2022年8月15日至21日一周的时间安排进行调查。
要求此项调查在9月底完成。
那么调查时间是〔〕 A、8月15日 B、8月15日至21日 C、8月底 D、9月底4、分组标志一经选定〔〕A、就掩盖了总体在此标志下的性质差异B、就突出了总体在此标志下的性质差异C、就突出了总体在其他标志下的性质差异D、就使得总体内部的差异消失了 5、某班学生的平均年龄为20.8岁,21岁的人数最多,那么该分布属于〔〕A、正态分布B、左偏分布C、右偏分布D、无法判断6、某工业局所属企业职工的平均工资和职工人数资料,要计算该工业局职工的平均工资,应选择的权数是〔〕 A、职工人数 B、平均工资 C、工资总额 D、职工人数或工资总额7、某企业生产三批产品,第一批产品废品率为1%,第二批产品废品率为1.5%,第三批产品废品率为2%。
第一批产品数量占总数的25%,第二批产品数量占总数的30%,那么平均废品率为〔〕 A、1.5% B、1.75% C、1.6% D、1.55%8、逐日登记资料的时点数列计算序时平均数应采用〔〕 A、几何平均法 B、加权算术平均法 C、简单算术平均法 D、首末折半法 9、以下有关典型调查的表述不正确的选项是〔〕 A、可以检验全面调查数据的真实性 B、能够补充全面调查资料的缺乏 C、必须同其他调查结果结合起来使用 D、不容易受人们主观认识上的影响10、由组距数列确定众数时,如果众数组相邻两组的次数相等,那么〔〕 A、众数为零 B、众数组的组中值就是众数第1页,共5页浙江财经学院课程期中考试试卷C、众数不能确定D、众数组的组限就是众数11、某产品单位本钱方案规定比基期下降3%,实际比基期下降3.5%,那么单位本钱降低方案完成程度为〔〕 A、116.7% B、100.5% C、99.5% D、85.5% 12、以下指标中属于相对指标的是〔〕 A、某商品平均价格 B、某地区按人口平均的粮食产量 C、某企业生产工人劳动生产率 D、某公司职工人均工资13、某公司2022年管理人员年均收入6.5万元,生产人员为5.5万元;2022年各类人员年均收入水平不变,但管理人员增加15%,生产人员增加25%,那么两类人员平均的年收入2022年比2022年〔〕 A、持平 B、提高 C、下降 D、无法判断14、重点调查中重点单位是指〔〕 A、标志总量在总体中有很大比重的单位B、具有典型意义或代表性的单位C、那些具有反映事物属性差异的品质标志的单位D、能用以推算总体标志总量的单位 15、某城市2022年-2022年各年6月30号统计的从业人员数资料如下。
《统计学基础》2014-2015学年度(上)期中考试试卷一、选择题(每题1分,共10分)1、某企业有500名职工,把他们的工资额加起来除以500是(B )A 对500个变量求平均数 B对500个变量值求平均数C对500个指标求平均数 D对500个标志求平均数2、统计资料按数量标志进行组距式分组后,处于每组两端的数值叫( C )A组距 B组数 C组限 D组中值3、将比较的基数确定为10,计算出来的相对数为( C )A系数 B百分数 C成数 D倍数4、在下列变异指标中,受极端数值影响最大的是( A )A全距 B平均差 C标准差 D变异系数5、抽样误差( D )。
A既可以避免,也可以控制B既不可以避免,也不可以控制C可以避免,但不能控制D不能避免,但可以控制6、某变量数列如下:53,55,54,57,56,55,54,55,56.则其中位数为(D )。
A、53B、54C、55D、567、若销售量增长5%,零售价格增长2%,则商品销售额增长( D )A7% B10% C15% D7.1%8、某企业成本计划降低率为5%,实际降低率为10%,则成本计划完成百分比为( D )A、94.74 %B、200%C、105.56%D、104.76%9、某市2007年的税收收入是二十年钱的五倍,这一指标是( B )A结构相对指标 B动态相对指标 C比列相对指标 D比较相对指标10、2008年春节,某市质量监督部门要对市场销售的食品进行检验,那么,最适合采用的调查方式是( C )A普查 B重点调查 C抽样调查 D典型调查二、多项选择题(每题2分,共20分)1、统计的职能包括( A BC )A信息职能 B咨询职能 C监督职能 D协调职能2、下列调查中,属于一次性调查的是(BC )A近十年我国利用外资的情况调查B10年一次的人口普查C一批产品合格率的检查D按月统计的钢产量调查3、以一个企业为总体,下列属于相对指标的是( BC )A职工人数 B人均产值 C人均工资 D工业总产值4、下列统计指标中,属于质量指标的有(BCE )A、销售额B、单位产品价格C、利润率D、人口数E、年人均收入5、用几何平均法计算平均发展速度时,被开方的指标是( ACD )A环比发展速度的连乘积B环比增长速度的连乘积C报告期发展水平与基期发展水平之比D发展总速度6、测定现象之间有无相关性的方式是( ABD )A编制相关表B 绘制相关图C估计标准差D计算相关系数7、某市三种消费品销量未变,其价格总指数为110%,它的影响额为5万元,这表示(ABCD ) A这三种商品价格平均上涨10%B因涨价而使销售额增10%C 因涨价而使商品销售额增加5万元D由于涨价,居民要维持原来的生活水平,需为此多支付5万元8、在下列条件下,加权算术平均数和简单算术平均数相等(ACD)A各组次数相对 B各组变量值相等C变量数列为组距数列 D各组次数都为19、平均数的种类有(ABCDE )。
《商务统计》试题7参考答案及评分标准一、判断题(每题1分,共10分)三、填空题(每题3四、简答题(每题5分,共15分)1.简述小概率事件原理及其在假设检验中的应用。
小概率事件指概率很小的事件(1分)。
小概率事件原理是指在一次实验中,发生概率很小的事件,可以认为是不可能事件(2分)。
在假设检验中,根据样本观测量计算检验统计量的值,如果在原假设正确的前提下,检验统计量的值的出现是小概率事件,则可以认为原假设错误(2分)。
2.列举描述一个变量的数值方法。
平均值、中位数、众数、极差、四分位距、方差、标准差(答对1个计1分)。
3.简述方差分析的基本原理。
方差分析是分析分类型自变量对数值型因变量影响的一种统计方法,可以检验多个总体均值是否相等(1分)。
方差分析通过分析数据的误差来检验自变量对因变量的影响效果是否显著(1分)。
具体地,它通过检验各总体均值是否相等来判断分类型自变量对数值型因变量是否具有显著影响。
如果总体均值相等,可以期望三个样本的均值会很接近。
因此,三个样本的均值的分散程度可以为原假设是否成立提供证据(3分)。
五、计算题(每题15分,共30分)1.(1)令μ1、μ2分别表示两家分行的经常性账户平均余额,则原假设为H0:μ1−μ2=0(2分),备择假设为H a:μ1−μ2≠0(1分)。
(2)应该应用t统计量(1分)。
因为两家银行的账户余额都服从正态分布,两个总体的方差σ12与σ22未知。
在原假设成立的条件下,12√s1/n1+s2/n2t分布(2分)。
检验统计量t=12√s1/n1+s2/n2=√1502/28+1252/22=2.96(2分)。
(3)t分布自由度df=(s12n1+s22n2)21n1−1(s12n1)2+1n2−1(s22n2)2≈47,显著性水平是α=0.05,则拒绝域的临界值t0.025=2.01、−t0.025=−2.01 。
拒绝原假设的决策准则为:t≥2.01或者t≤−2.01时,拒绝原假设H0(2分)。
商务统计试题卷《商务统计》试题选登⼀、单项选择题下列各题A)、B)C)、D)四个选项中,只有⼀个选项是正确的。
1.进⾏全国⼈⼝普查,普查总体中的个体是A)每个省的⼈⼝ B)每个县的⼈⼝ C)每个家庭的⼈⼝ D)每个⼈2.根据⼈的性别特征将⼈⼝划分为男性和⼥性两类,所采⽤的测度计量尺度是A)名义尺度 B)顺序尺度 C)差距尺度 D)⽐例尺度3.某市场调查公司为了对⼀家⼤型商场做顾客满意度调查,对不同性别和年龄的顾客按事先规定的⼈数随意进⾏了⼀些调查询问,这种调查属于A)任意调查 B)⽴意调查 C)配额抽样 D)整群抽样4.利⽤拉丁⽅来安排试验观测,所需要考虑的因素只能为A)2个 B)3个 C)4个 D)5个5.从0-1分布总体中进⾏不放回抽样,样本中具有1值的个体数服从A)两点分布 B)⼆项分布 C)超⼏何分布 D)泊松分布6.测度随机变量分布中⼼最常⽤的指标是A)算术平均数 B)中位数 C)众数 D)调和平均数7.变量x与y的相关系数的符号取决于A)变量x的标准差 B)变最y的标准差C)变量x和y两标准差的乘积 D)变量x和y的协⽅差8.有⼀个样本容量为10的样本,其均值为1300⼩时,⽅差为8175.56。
若按放回抽样计算,则样本均值的标准误是A)28.35⼩时 B)28.59⼩时 C)29.61⼩时 D)30.02⼩时9.在关于总体参数的假设检验中,原假设必须是⼀个A)精确假设 B)⾮精确假设 C)复合假设 D)备择假设10.如果原假设为H0:θ≥θ0,备则假设为H1:θ<θ0,则进⾏假设检验时应采⽤A)侧检验 B)左侧检验 C)双侧检验 D)上侧检验11.在⽅差分析中,各次试验观测应A)相互关联 B)互不相关 C)计量逐步精确 D)⽅法逐步改进12.相关关系是变量之间⼀种A)线性函数依存关系 B)确定性的数量依存关系C)⾮线性函数依存关系 D)⾮确定性的数量依存关系13.对于回归模型y j=βo+β1x j+u j(j=1,2,…,n),为了进⾏统计推断,通常假定u1、u2、…、u n的数学期望A)均⼤于0 B)均等于0 C)均⼩于0 D)均不为014.如果时间序列的环⽐增长量⼤致相等,则应采⽤的趋势模型为A)直线趋势模型 B)指数曲线趋势模型C)⼆次曲线趋势模型 D)修正指数曲线趋势模型15.对于p阶时间序列⾃回归模型来说,可⽤于估计其模型参数的有效样本容量为A)n B)p C)n-p D)n+p16.若决策者按照对客观环境状态最乐观的设想寻求取得最⼤的收益,则他所采⽤的决策准则是A)⼤中取⼩原则 B)⼩中取⼤原则 C)⼤中取⼤原则 D)折中原则17.在决策树中,引出各客观状态的是A)⽅案枝 B)状态枝 C)决策点 D)状态点18.由拉⽒指数和派⽒指数经过简单⼏何平均⽽得到的指数是A)杨格综合指数 B)马埃综合指数 C)费暄理想指数 D)平均指数19.现期与基期相⽐,某地粮⾷总产量增长了10%,粮⾷播种⾯积增长了5%,则粮⾷平均亩产量增长了A)0.5% B)2% C)4.8% D)5%20.经济业绩指数的分⼦是A)实际经济增长率 B)名义经济增长率 C)通货膨胀率 D)失业率⼆、多项选择题下列各题A)、B)、C)、D)、E)五个选项中,⾄少有两个答案是正确的。
商务统计试题及答案一、选择题(每题2分,共20分)1. 商务统计的主要目的是:A. 收集数据B. 分析数据C. 做出决策D. 预测未来2. 下列哪项不是描述性统计的内容?A. 均值B. 方差C. 相关性D. 抽样3. 正态分布的特点是:A. 所有数据都集中在中间B. 大部分数据分布在两端C. 数据分布是对称的D. 数据分布是不规则的4. 在商务统计中,相关系数的取值范围是:A. -1 到 1B. 0 到 1C. -∞ 到+∞D. 1 到 105. 以下哪个是假设检验的步骤?A. 确定显著性水平B. 收集数据C. 计算样本均值D. 所有选项都是二、简答题(每题10分,共30分)6. 简述商务统计中的抽样误差和非抽样误差的区别。
7. 解释什么是置信区间,并举例说明其在商务决策中的应用。
8. 描述回归分析在商务决策中的作用。
三、计算题(每题25分,共50分)9. 假设你是一家零售公司的分析师,你收集了以下数据,显示了过去10天的日销售额(单位:千元):120, 130, 110, 140, 150, 160, 170, 180, 190, 200。
请计算:- 均值- 中位数- 方差- 标准差10. 假设你正在分析两个变量X和Y之间的关系,收集到以下数据点(X, Y):(1, 2), (2, 3), (3, 5), (4, 7), (5, 9)。
请计算:- 线性回归方程- 相关系数- 预测当X=6时的Y值答案一、选择题1. C. 做出决策2. D. 抽样3. C. 数据分布是对称的4. A. -1 到 15. D. 所有选项都是二、简答题6. 抽样误差是由于从总体中抽取的样本不能完全代表总体而产生的误差。
非抽样误差可能由数据收集、处理或分析过程中的错误引起,与抽样过程无关。
7. 置信区间是指在一定置信水平下,总体参数可能取值的范围。
例如,在市场研究中,置信区间可以用来估计某个新产品的潜在市场份额。
8. 回归分析可以帮助预测一个变量(因变量)如何依赖于一个或多个其他变量(自变量)。
商务与经济统计15版摘要:I.引言A.统计学的定义B.商务与经济统计的重要性C.本书的目标读者II.数据收集与整理A.数据来源B.数据类型C.数据整理III.描述性统计分析A.频数与频率分布B.图表法C.统计量度IV.概率论基础A.随机实验与样本空间B.事件与概率C.概率公理体系V.抽样与抽样分布A.抽样方法B.抽样分布C.参数估计VI.假设检验A.假设检验的基本思想B.常见的检验方法C.检验的误差VII.相关与回归分析A.相关分析B.一元线性回归C.多元线性回归VIII.时间序列分析与预测A.时间序列的基本概念B.平稳性检验C.时间序列模型与预测IX.统计软件的应用A.常见统计软件介绍B.软件在统计分析中的应用C.注意事项X.总结与展望A.统计学在经济和管理中的作用B.统计学的发展趋势C.学习建议正文:商务与经济统计(第15 版)从数据收集与整理、描述性统计分析、概率论基础、抽样与抽样分布、假设检验、相关与回归分析、时间序列分析与预测以及统计软件的应用等方面,系统地介绍了商务与经济统计的基本概念、原理和方法。
统计学是一门关于数据的科学,旨在通过对数据的收集、整理、分析、解释和展示,揭示数据背后的规律和趋势。
商务与经济统计作为统计学的一个重要分支,旨在为经济和管理决策提供依据。
数据收集与整理是统计分析的基础。
数据来源包括企业内部数据、政府公开数据和市场调查数据等。
数据类型主要包括定量数据和定性数据。
数据整理包括数据清洗、数据转换和数据汇总等步骤。
描述性统计分析主要通过频数与频率分布、图表法和统计量度等方法,对数据进行概括和描述。
概率论基础是统计学的理论基石,涉及随机实验与样本空间、事件与概率以及概率公理体系等内容。
抽样与抽样分布、假设检验、相关与回归分析以及时间序列分析与预测等方法,主要应用于对数据进行深入分析和预测。
这些方法在商务和经济领域具有广泛的应用价值。
统计软件的应用使得统计分析变得更加简便和高效。
《商务统计》期中考试试题Part I: 单选题(每题2分,共60分)1.The universe or "totality of items or things" under consideration is calleda) a sample、b) a population、c) a parameter、d) a statistic、2.Which of the following is most likely a population as opposed to a sample?a)respondents to a newspaper survey、b)the first 5 students completing an assignment、c)every third person to arrive at the bank、d)registered voters in a county、3. A study is under way in Yosemite National Forest to determine the adult height of Americanpine trees、Specifically, the study is attempting to determine what factors aid a tree inreaching heights greater than 60 feet tall、It is estimated that the forest contains 25,000adult American pines、The study involves collecting heights from 250 randomly selected adult American pine trees and analyzing the results、Identify the variable of interest in the study、a)The age of an American pine tree in Yosemite National Forest、b)The height of an American pine tree in Yosemite National Forest、c)The number of American pine trees in Yosemite National Forest、d)The species of trees in Yosemite National Forest、4.The British Airways Internet site provides a questionnaire instrument that can be answeredelectronically、Which of the 4 methods of data collection is involved when peoplecomplete the questionnaire?a)Published sourcesb)Experimentationc)Surveyingd)Observation5.To monitor campus security, the campus police office is taking a survey of the number ofstudents in a parking lot each 30 minutes of a 24-hour period with the goal of determiningwhen patrols of the lot would serve the most students、If X is the number of students in the lot each period of time, then X is an example ofa) a categorical random variable、b) a discrete random variable、c) a continuous random variable、d) a statistic、6.An insurance company evaluates many numerical variables about a person before decidingon an appropriate rate for automobile insurance、A representative from a local insurance agency selected a random sample of insured drivers and recorded, X, the number of claims each made in the last 3 years, with the following results、X frequency1 142 183124 55 1Referring to the table, how many total claims are represented in the sample?a)15b)50c)111d)250(For Q7 and Q8) A survey was conducted to determine how people rated the quality of programming available on television、Respondents were asked to rate the overall quality from 0 (no quality at all) to 100 (extremely good quality)、The stem-and-leaf display of the data is shown below、Stem Leaves3 244 034789995 01123456 125667 0189 27.Referring to the table, what percentage of the respondents rated overall television qualitywith a rating of 80 or above?a)0b) 4c)96d)1008.Referring to the table, what percentage of the respondents rated overall television qualitywith a rating between 50 and 75?a)11b)40c)44d)56(For Q9 and Q10) The following are the durations in minutes of a sample of long-distance phone calls made reported by one long-distance carrier、Time (in Minutes) Relative Frequency0 but less than 5 0、375 but less than 10 0、2210 but less than 15 0、1515 but less than 20 0、1020 but less than 25 0、0725 but less than 30 0、0730more 0、029.Referring to the table, if 1,000 calls were randomly sampled, how many calls lasted under10 minutes?a)220b)370c)410d)59010.Referring to the table, if 100 calls were randomly sampled, how many calls lasted 15minutes or longer?a)10b)14c)26d)7411.You have collected data on the approximate retail price (in $) and the energy cost per year(in $) of 15 refrigerators、Which of the following is the best for presenting the data?a) A pie chart、b) A scatter diagram、c) A Pareto diagram、d) A contingency table、(For Q12 and Q13) The histogram below represents scores achieved by 200 job applicants on a personality profile、12.Referring to the histogram, ________ percent of the job applicants scored between 10 and20、a)10%b)20%c)30%d)40%13.Referring to the histogram, the number of job applicants who scored between 30 and below60 is _______、a)20b)40c)60d)8014.Which measure of central tendency can be used for both numerical and categoricalvariables?a)Arithmetic mean、b)Median、c)Mode、d)Standard deviation、15.Which of the following statements about the median is not true?a)It is more affected by extreme values than the arithmetic mean、b)It is a measure of central tendency、c)It is equal to Q2、d)It is equal to the mode in bell-shaped "normal" distributions、16.When extreme values are present in a set of data, which of the following descriptivesummary measures are most appropriate:a)CV and range、b)arithmetic mean and standard deviation、c)interquartile range and median、d)variance and interquartile range、17.A probability distribution is an equation thata)associates a particular probability of occurrence with each outcome in the samplespace、b)measures outcomes and assigns values of X to the simple events、c)assigns a value to the variability in the sample space、d)assigns a value to the center of the sample space、18.In a binomial distributiona)the random variable X is continuous、b)the probability of event of interest is stable from trial to trial、c)the number of trials n must be at least 30、d)the results of one trial are dependent on the results of the other trials、19.A lab orders 100 rats a week for each of the 52 weeks in the year for experiments that thelab conducts、Prices for 100 rats follow the following distribution:Price: $10、00 $12、50 $15、00Probability: 0、35 0、40 0、25How much should the lab budget for next year’s rat orders be, assuming this distribution does not change?a)$520b)$637c)$650d)$78020.A multiple-choice test has 30 questions、There are 4 choices for each question、 Astudent who has not studied for the test decides to answer all questions randomly、What type of probability distribution can be used to figure out his chance of getting at least 20 questions right?a)binomial distribution、b)Poisson distribution、c)normal distribution、d)none of the above、21.In its standardized form, the normal distributiona)has a mean of 0 and a standard deviation of 1、b)has a mean of 1 and a variance of 0、c)has an area equal to 0、5、d)cannot be used to approximate discrete probability distributions、22.For some positive value of Z, the probability that a standard normal variable is between 0and Z is 0、3340、The value of Z isa)0、07b)0、37c)0、97d)1、0623.The owner of a fish market determined that the average weight for a catfish is 3、2 poundswith a standard deviation of 0、8 pound、A citation catfish should be one of the top 2% in weight、Assuming the weights of catfish are normally distributed, at what weight (in pounds) should the citation designation be established?a)1、56 poundsb)4、44 poundsc)4、84 poundsd)5、20 pounds24.If a particular batch of data is approximately normally distributed, we would find thatapproximatelya) 2 of every 3 observations would fall between ±1 standard deviation around the mean、b) 4 of every 5 observations would fall between ±1、28 standard deviations around themean、c)19 of every 20 observations would fall between ±2 standard deviations around the mean、d)All the above、25.Which of the following about the binomial distribution is not a true statement?a)、b)Each outcome is independent of the other、c)The random variable of interest is continuous、d)Each outcome may be classified as either "event of interest" or "not event ofinterest、"26.Why is the Central Limit Theorem so important to the study of sampling distributions?a)It allows us to disregard the size of the sample selected when the population is notnormal、b)It allows us to disregard the shape of the sampling distribution when the size of thepopulation is large、c)It allows us to disregard the size of the population we are sampling from、d)It allows us to disregard the shape of the population when n is large、27.Suppose a sample of n = 50 items is drawn from a population of manufactured products andthe weight, X, of each item is recorded、Prior experience has shown that the weight has a probability distribution with μ= 6 ounces and σ= 2、5 ounces、Which of thefollowing is true about the sampling distribution of the sample mean if a sample of size 15 is selected?a)The mean of the sampling distribution is 6 ounces、b)The standard deviation of the sampling distribution is 2、5 ounces、c)The shape of the sample distribution is approximately normal、d)All of the above are correct、28.For some positive value of X, the probability that a standard normal variable is between 0and +2X is 0、1255、The value of X isa)0、99b)0、40c)0、32d)0、1629.A campus program evenly enrolls undergraduate and graduate students、If a randomsample of 4 students is selected from the program to be interviewed about the introduction of a new fast food outlet on the ground floor of the campus building, what is the probability that all 4 students selected are undergraduate students?a)0、0256b)0、0625c)0、16d)1、0030.If two events are collectively exhaustive, what is the probability that both occur at the sametime?a)0、b)0、50、c)1、00、d)Cannot be determined from the information given、Part II: 计算题:Q1、某证券公司为了分析上市公司股票价格与公司净资产收益率的关系,收集了各个上市公:(10分)。