Involvement of pro-apoptotic and pro-autophagic pro-
- 格式:pdf
- 大小:963.89 KB
- 文档页数:9

线粒体氧化应激线粒体形态Mitochondrial oxidative stress is a phenomenon that occurs when there is an imbalance between the production of reactive oxygen species (ROS) and the ability of the cell to detoxify them or repair the resulting damage. This can lead to damage to cellular components and is implicated in a range of diseases, including neurodegenerative disorders, cardiovascular diseases, and cancer. One of the key consequences of mitochondrial oxidative stress is damage to the mitochondrial DNA (mtDNA), which can lead to mutations and deletions that affect the function of the mitochondria and, in turn, the overall health of the cell.The morphology of mitochondria is also affected by oxidative stress. Under normal conditions, mitochondria have a tubular, elongated shape, but when exposed to oxidative stress, they undergo fragmentation and become more spherical. This change in morphology is thought to be a protective response, as it allows damaged mitochondria to be segregated and targeted for removal by the cell'squality control mechanisms. However, excessivefragmentation can also lead to impaired mitochondrial function and cell death.In addition to the structural and functional changes in mitochondria, oxidative stress can also lead to the activation of cell death pathways. This can occur through the release of pro-apoptotic factors from the mitochondria, such as cytochrome c, which triggers a cascade of eventsthat ultimately lead to cell death. In this way, mitochondrial oxidative stress can have profound effects on cell survival and tissue integrity.One of the major sources of mitochondrial oxidative stress is the electron transport chain (ETC), which is responsible for generating the majority of the cell'senergy in the form of adenosine triphosphate (ATP). During this process, electrons can leak from the ETC and reactwith molecular oxygen to form superoxide, a type of ROS. Under normal conditions, the cell has antioxidant defense systems in place to neutralize these ROS and prevent damage. However, when the production of ROS exceeds the capacity ofthese defenses, oxidative stress occurs.There are several factors that can contribute to mitochondrial oxidative stress, including environmental toxins, metabolic dysfunction, and genetic mutations. For example, exposure to environmental pollutants such as heavy metals and pesticides can increase ROS production and overwhelm the cell's antioxidant defenses. Similarly, metabolic disorders such as diabetes and obesity can lead to increased ROS production due to dysregulation ofcellular metabolism. Finally, mutations in genes encoding for antioxidant enzymes or mitochondrial proteins can also predispose individuals to mitochondrial oxidative stress.In conclusion, mitochondrial oxidative stress and its effects on mitochondrial morphology and function have far-reaching implications for human health. Understanding the mechanisms underlying mitochondrial oxidative stress and developing strategies to mitigate its effects are critical for the prevention and treatment of a wide range of diseases. By targeting the sources of oxidative stress and enhancing the cell's antioxidant defenses, it may bepossible to alleviate the burden of mitochondrial dysfunction and improve overall cellular and tissue health.。
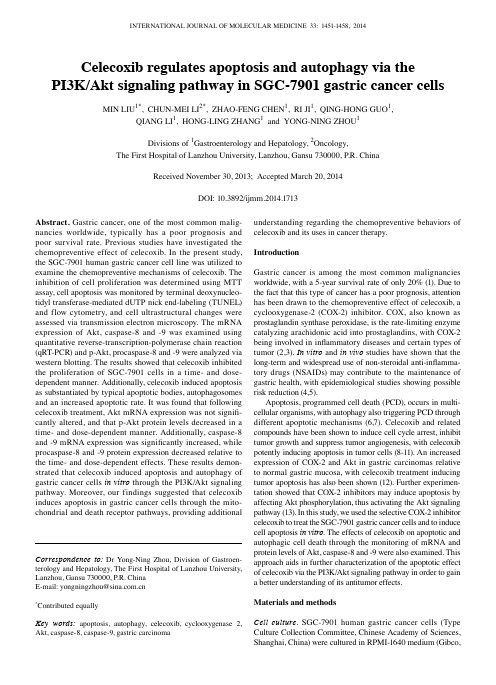
INTERNATIONAL JOURNAL OF MOLECULAR MEDICINE 33: 1451-1458, 2014Abstract. Gastric cancer, one of the most common malig-nancies worldwide, typically has a poor prognosis and poor survival rate. Previous studies have investigated the chemopreventive effect of celecoxib. In the present study, the SGC-7901 human gastric cancer cell line was utilized to examine the chemopreventive mechanisms of celecoxib. The inhibition of cell proliferation was determined using MTT assay, cell apoptosis was monitored by terminal deoxynucleo-tidyl transferase-mediated dUTP nick end-labeling (TUNEL) and flow cytometry, and cell ultrastructural changes were assessed via transmission electron microscopy. The mRNA expression of Akt, caspase-8 and -9 was examined using quantitative reverse-transcription-polymerase chain reaction (qRT-PCR) and p-Akt, procaspase-8 and -9 were analyzed via western blotting. The results showed that celecoxib inhibited the proliferation of SGC-7901 cells in a time- and dose-dependent manner. Additionally, celecoxib induced apoptosis as substantiated by typical apoptotic bodies, autophagosomes and an increased apoptotic rate. It was found that following celecoxib treatment, Akt mRNA expression was not signifi-cantly altered, and that p-Akt protein levels decreased in a time- and dose-dependent manner. Additionally, caspase-8 and -9 mRNA expression was significantly increased, while procaspase-8 and -9 protein expression decreased relative to the time- and dose-dependent effects. These results demon-strated that celecoxib induced apoptosis and autophagy of gastric cancer cells in vitro through the PI3K/Akt signaling pathway. Moreover, our findings suggested that celecoxib induces apoptosis in gastric cancer cells through the mito-chondrial and death receptor pathways, providing additional understanding regarding the chemopreventive behaviors of celecoxib and its uses in cancer therapy. IntroductionGastric cancer is among the most common malignancies worldwide, with a 5-year survival rate of only 20% (1). Due to the fact that this type of cancer has a poor prognosis, attention has been drawn to the chemopreventive effect of celecoxib, a cyclooxygenase-2 (COX-2) inhibitor. COX, also known as prostaglandin synthase peroxidase, is the rate-limiting enzyme catalyzing arachidonic acid into prostaglandins, with COX-2 being involved in inflammatory diseases and certain types of tumor (2,3). In vitro and in vivo studies have shown that the long-term and widespread use of non-steroidal anti-inflamma-tory drugs (NSAIDs) may contribute to the maintenance of gastric health, with epidemiological studies showing possible risk reduction (4,5).Apoptosis, programmed cell death (PCD), occurs in multi-cellular organisms, with autophagy also triggering PCD through different apoptotic mechanisms (6,7). Celecoxib and related compounds have been shown to induce cell cycle arrest, inhibit tumor growth and suppress tumor angiogenesis, with celecoxib potently inducing apoptosis in tumor cells (8-11). An increased expression of COX-2 and Akt in gastric carcinomas relative to normal gastric mucosa, with celecoxib treatment inducing tumor apoptosis has also been shown (12). Further experimen-tation showed that COX-2 inhibitors may induce apoptosis by affecting Akt phosphorylation, thus activating the Akt signaling pathway (13). In this study, we used the selective COX-2 inhibitor celecoxib to treat the SGC-7901 gastric cancer cells and to induce cell apoptosis in vitro. The effects of celecoxib on apoptotic and autophagic cell death through the monitoring of mRNA and protein levels of Akt, caspase-8 and -9 were also examined. This approach aids in further characterization of the apoptotic effect of celecoxib via the PI3K/Akt signaling pathway in order to gain a better understanding of its antitumor effects. Materials and methodsCell culture. SGC-7901 human gastric cancer cells (Type Culture Collection Committee, Chinese Academy of Sciences, Shanghai, China) were cultured in RPMI-1640 medium (Gibco,Celecoxib regulates apoptosis and autophagy via the PI3K/Akt signaling pathway in SGC-7901 gastric cancer cellsMIN LIU1*, CHUN-MEI LI2*, ZHAO-FENG CHEN1, RI JI1, QING-HONG GUO1,QIANG LI1, HONG-LING ZHANG1 and YONG-NING ZHOU1Divisions of 1Gastroenterology and Hepatology, 2Oncology,The First Hospital of Lanzhou University, Lanzhou, Gansu 730000, P.R. ChinaReceived November 30, 2013; Accepted March 20, 2014DOI: 10.3892/ijmm.2014.1713Correspondence to: Dr Yong-Ning Zhou, Division of Gastroen-terology and Hepatology, The First Hospital of Lanzhou University,Lanzhou, Gansu 730000, P.R. ChinaE-mail: yongningzhou@*Contributed equallyKey words: apoptosis, autophagy, celecoxib, cyclooxygenase 2,Akt, caspase-8, caspase-9, gastric carcinomaLIU et al: CELECOXIB INDUCES APOPTOSIS AND AUTOPHAGY VIA PI3K/Akt PATHWAY IN SGC-7901 CELLS 1452Long Island, NY, USA) with 2 mmol/l glutamine, supplemented with 10% fetal bovine serum (FBS; HyClone, Logan, UT, USA), 50 U/ml penicillin, and 50 mg/ml streptomycin. The cells were plated at a density of 1x10⁵ cells/ml in 6-well tissue culture plates and grown to confluency at 37˚C with 5% CO2. When 50% confluency was reached, serum-supplemented medium was replaced with the recommended serum-free RPMI-1640 medium for overnight culturing before celecoxib intervention. Celecoxib, provided by the Faculty of Medicine, the Chinese University of Hong Kong, stock solution was added to the serum-supplemented medium at different concentrations and cultured until the detection time.MTT assay. The inhibition of cell proliferation in SGC-7901 cells following celecoxib treatment was evaluated using an MTT assay (Sigma-Aldrich, Shanghai, China) as per the manufacturer's instructions. Briefly, 5x10³ cells/well were seeded in 96-well plates, incubated in culture medium for 24 h, and treated with varying concentrations of celecoxib (0, 50, 75, 100 and 125 µmol/l) for 24, 48 and 72 h, with parallel samples treated with DMSO only serving as controls. Following treat-ment, the formation of formazan crystals was measured after 4 h of MTT incubation (10% v/v) at an optical density (OD) of 490 nm, with each experiment repeated in triplicate. The relative cell proliferation inhibition rate was calculated as: (1-OD490Test/OD490Control) x100% to show a percentage value.TUNEL assay. DNA breaks occur late in the apoptotic pathway and can be determined and analyzed by performing the TUNEL assay (Roche, Basel, Switzerland). Firstly, cells were seeded on coverslips and treated with 100 µmol/l cele-coxib for 72 h. Following treatment, the cells were washed, fixed and stained as per the manufacturer's instructions and apoptotic numbers evaluated using a confocal laser scanning microscope (Leica, Wetzlar, Germany) at 515-565 nm.Flow cytometric (FCM) analysis of apoptosis. Apoptosis was assessed by flow cytometric analysis using the Annexin V-FITC/PI apoptosis detection kit (Invitrogen, Life Technologies Ltd., Carlsbad, CA, USA). SGC-7901 cells were seeded in 6-well plates at ~5x10⁴ cells/well. Following treat-ment with celecoxib, the cells were trypsinized, centrifuged to remove the supernatant, washed with phosphate-buffered saline (PBS), suspended in 100 µl of 1X binding buffer (10 mM HEPES, 140 mM NaCl, and 2.5 mM CaCl2), and stained with Annexin V and PI as per the manufacturer's instructions. FITC-positive and PI-negative cells were considered apoptotic cells, PI-positive cells were considered necrotic, and unstained cells were considered normal viable cells. The apoptotic rates of the various cell groups were calculated and comparisons of apoptotic rates were conducted among the various groups.Transmission electron microscope (TEM) analysis of cell ultrastructure. Cells were seeded on coverslips, treated with 125 µmol/l celecoxib for 72 h (with a parallel untreated control), cultured in RPMI-1640 for 72 h, collected and fixed with 3% glutaraldehyde. The cells were washed with PBS, fixed in 1% osmium tetroxide, dehydrated by graded ethanol and acetone, and routinely embedded and polymerized. The slices were contrasted with an aqueous solution of uranyl acetate and lead citrate and examined by JEM-1230 transmis-sion electron microscope (Jeol Ltd., Tokyo, Japan).Quantitative reverse-transcription-polymerase chain reac-tion (qRT-PCR) analysis. SGC-7901 cells were cultured at a density of 1x10⁵ cells/ml in 6-well tissue culture plates. One group was treated with various concentrations of celecoxib (0, 75, 100 and 125 µmol/l) and cultured for 72 h, while an additional test group was treated with 125 µmol/l celecoxib for 0, 24, 48 and 72 h. Total RNA was extracted by a column RNA extraction kit (Sangon, Shanghai, China) and reverse-transcribed into cDNA at 37˚C for 15 min, and 85˚C for 5 sec. Diluted cDNA was subjected to qRT-PCR using a SYBR®Premix Ex Taq™ II kit (Takara Bio, Inc., Shiga, Japan) in 25 µl of reaction solution containing 2 µl of cDNA template, 1 µM of each primer, 10 µl of 2X SYBR-Green master mix, and brought to the final volume with RNase-free water. Reactions were performed in triplicate via a PCR thermal cycler (Roter-Gene 3000; Corbett, Sydney, Australia) under the following conditions: pre-denaturation at 95˚C for 30 sec, 40 cycles of denaturation at 95˚C for 5 sec, and annealing at 62˚C for 30 sec. The relative expression was calculated by the 2-ΔΔCT formula. The primer pairs for qRT-PCR are listed in Table I.Western blot analysis. Total protein was extracted and protein concentrations established via bicinchoninic acid (BCA) assay. Protein (25 µg) was denatured, separated by SDS-PAGE electrophoresis and transferred to a PVDF membrane. AfterTable I. Primer pairs for qRT-PCR.Gene name Accession Sequence (5'-3') Product size (bp) Caspase-9 NM_001229 F: CCCATATGATCGAGGACATCCA 186R: ACAACTTTGCTGCTTGCCTGTTAGCaspase-8 NM_001228 F: GGTACATCCAGTCACTTTGCCAGA 83R: GTTCACTTCAGTCAGGATGGTGAGAAkt NM_005163 F: GTGGCAGCACGTGTACGAGAA 108R: GTGATCATCTGGGCCGTGAAβ-actin NM_001101 F: TGGCACCCAGCACAATGAA 126R: CTAAGTCATAGTCCGCCTAGAAGCAINTERNATIONAL JOURNAL OF MOLECULAR MEDICINE 33: 1451-1458, 20141453blocking overnight at 4˚C using 5% BSA, the membranes were incubated with primary antibodies (anti-procaspase-8 1:2,500 and procaspase-9 1:2,000; both from Abcam, Cambridge, MA, USA), p-Akt 1:800 (Bioworld, St. Louis Park, MN, USA) for 2 h at room temperature, washed by TBST and incubated with the corresponding horseradish peroxidase (HRP)-conjugated secondary antibody at 1:2,000 dilution for 2 h. Bands were visu-alized using enhanced chemiluminescence (ECL; Applygen, Beijing, China) detection reagents and scanned images were quantified using ImageJ software. Experiments were performed in triplicate with β-actin used as a housekeeping control for normalization. The ratio of target gene to β-actin was used for semi-quantification and comparison between different groups.Statistical analysis. Triplicate data are presented as mean values and shown as the means ± standard deviation (SD). Samples were analyzed by one-way ANOVA, with P<0.05 considered to indicate statistical significance.ResultsCelecoxib inhibits proliferation of SGC-7901 cells. Following in vitro treatment with celecoxib, the SGC-7901 gastric cancer cell line showed a significant inhibition of cell proliferation in a time- and dose-dependent manner, with the most pronounced effect evident at a concentration of 125 µmol/l for 72 h as iden-tified by a proliferation inhibition rate of 85.6±4.51% (Fig. 1).Celecoxib induces apoptosis of SGC-7901 cells. Fluorescein- labeled dUTP was connected to DNA 3'-OH ends of apoptotic cells by the deoxynucleotidyl transferase enzyme. Apoptotic cells with green fluorescence were detected by laser scanning confocal microscopy at an excitation of 515-565 nm, while all cells were exhibited as red under bright field microscopy. The two images were superimposed to show the specificity of apoptotic cells (yellow) and their position. Celecoxib-treated cells (Fig. 2B) showed significant levels of apoptosis relative to the control (Fig. 2A), with a statistical significance of P<0.05.Treatment with 0, 75, 100 and 125 µmol/l of celecoxib for 72 h yielded apoptotic rates of 4.0±0.91, 12.9±1.32, 24.6±3.63and 35.7±2.73%, respectively, with a statistical significance of P<0.05 when compared to the control group. Treatment with 125 µmol/l of celecoxib for 0, 24, 48 and 72 h, yielded apoptotic rates of 2.2±0.32, 8.5±1.57, 20.3±2.84 and 35.7±2.73%, respec-tively. Both study sets demonstrated a gradual increase in apoptotic rates in a time-and dose-dependent manner (Fig. 3).Celecoxib alters the ultrastructure of SGC-7901 cells. Following treatment with 125 µmol/l celecoxib for 72 h, typical early apoptotic changes were found to include nuclear membrane shrinkage and retraction (Fig. 4A), nuclear chro-matin condensation, marginalization and crescents, with late apoptotic changes observed by nuclei cleavage into frag-ments and apoptotic body production (Fig. 4B). Additionally, typical autophagic structures were found to include several cytoplasmic autophagic vacuoles and autophagosomes, which swallowed organelles (Fig. 4C and D).Effect of celecoxib on Akt, caspase-8 and -9 expression. No significant change in the mRNA levels of Akt was observed subsequent to treatment with celecoxib; however, the presence of p-Akt decreased in a time- and dose-dependent manner. Caspase-8 mRNA expression increased in a dose-dependent manner at concentrations of 75, 100 and 125 µmol/l of celecoxib. Caspase-9 mRNA expression levels increased significantly at a concentration of 100 and 125 µmol/l of celecoxib (Fig. 5A). Following treatment with 125 µmol/l of celecoxib for 24, 48 and 72 h, caspase-8 and -9 mRNA expression increased significantly (Fig. 5B). By contrast,procaspase-8 and -9 protein expression was significantlyFigure 1. Inhibitory effects of celecoxib on cell proliferation of the SGC-7901 gastric cancer cell line detected by MTT analysis. Following treatment with celecoxib at the indicated concentrations and time-points, SGC-7901 cells showed a significant inhibition of cell proliferation in a time- anddose-dependent manner.Figure 2. Apoptosis was assessed by terminal deoxynucleotidyl transferase-mediated dUTP nick end-labeling (TUNEL) analysis for SGC-7901 human gastric cancer cells. (A) Control group; (B) group treated with 100 µmol/l cele-coxib for 72 h. The apoptotic cell number of the group treated with 100 µmol/l celecoxib for 72 h increased significantly relative to the control. Apoptotic cells with green fluorescence were detected by laser scanning confocal microscopy at an excitation of 515-565 nm, while all the cells exhibit a red image under bright field microscopy. The two images were superimposed to show the speci -ficity of apoptotic cells (yellow) and their position..LIU et al: CELECOXIB INDUCES APOPTOSIS AND AUTOPHAGY VIA PI3K/Akt PATHWAY IN SGC-7901 CELLS 1454lower than the control group in a time- and dose-dependent manner (Fig. 6). These results showed that celecoxib may inhibit Akt phosphorylation and promote caspase-8, -9 tran-scription and procaspase-8, -9 protein activation. DiscussionGastric carcinoma is among the most common malignancies worldwide, with an elevated 5-year postoperative mortality rate (14) thus creating a need for an alternative treatment method. Currently, the role of celecoxib, a non-cytotoxic COX-2 inhibitor, in cancer therapy has been under scru-tiny (14). COX, also known as prostaglandin synthetase, has three known isoenzymes in mammals, COX-1, COX-2 and COX-3 (15). COX-2 is present at low levels of expression in most normal tissues, but tumor factors, inflammatory cytokines and growth factors could promote its expression (16). COX-2is related to the development of tumors by promoting tumor Figure 3. Apoptotic rates of human gastric cancer cell SGC-7901 after treatment with celecoxib at different doses and time-points as detected by flow cytom-etry. The apoptotic rates of SGC-7901 cells markedly increased in a time- and dose-dependent manner following treatment with 0, 75, 100 and 125 µmol/l of celecoxib for 72 h (A and B) *P<0.05 or #P<0.01 when compared with the control group..INTERNATIONAL JOURNAL OF MOLECULAR MEDICINE 33: 1451-1458, 20141455cell proliferation, enabling tumor evasion of the host immune surveillance and promoting tumor invasion/metastasis (5,17). Multicellular organisms maintain their homeostasis through cell proliferation and PCD, with an imbalance possibly leading to the development of cancer. In this experiment, we found that the selective COX-2 inhibitor celecoxib induced apoptosis of SGC-7901 cells via reduced expression levels of COX-2, as obsreved by inhibited cell proliferation using MTT analysis and an increased number of apoptotic cells as detected by TUNEL and flow cytometry. Moreover, typical apoptotic changes were shown to include nuclear membrane shrinkage, nuclear chromatin condensation and apoptotic bodies using TEM to support the apoptotic effects of celecoxib. Caspases are a type of protease associated with apop-tosis and cytokine maturation, and are divided into initiator caspases, effector caspases and inflammatory mediators. Caspases are synthesized as relatively inactive zymogens and must undergo a process of activation during apoptosis. Caspase-8 is the initiator of the Fas-Fas ligand (FasL) pathway,and usually exists in the form of procaspase-8. When FasL Figure 3. Continued. The apoptotic rates of SGC-7901 cells markedly increased in a time- and dose-dependent manner following treatment with 125 µmol/l of celecoxib for 0, 24, 48 and 72 h (C and D). *P<0.05 or #P<0.01 when compared with the control group.LIU et al : CELECOXIB INDUCES APOPTOSIS AND AUTOPHAGY VIA PI3K/Akt PATHWAY IN SGC-7901 CELLS1456Figure 4. Ultrastructure changes of SGC-7901 cells following treatment with 125 µmol/l celecoxib for 72 h. We observed nuclear membrane shrinkage and retraction in early apoptosis (x5,000) (A), apoptotic body in late apoptosis (x3,000) (B), and changes in autophagy: autophagic vacuolar and autophagosomes (x40,000 or x30,000) (C and D) by TEM.Figure 6. p-Akt, procaspase-8 and -9 protein expression in SGC-7901 human gastric cancer cells following treatment with celecoxib at different doses and time-points. SGC-7901 cells were treated with 0, 75, 100 and 125 µmol/l celecoxib for 72 h (lanes 1-4) and treated with 125 µmol/l celecoxib for 0, 24, 48 and 72 h (lanes 5-8). Procaspase-8, -9 and p-Akt protein expression were significantly lower than the control group in a time- and dose-dependent manner. Aliquotsof protein extracts (40 µg) were immunoblotted with the indicated antibodies.Figure 5. Akt, caspase-8 and -9 mRNA expression of SGC-7901 human gastric cancer cells following treatment with celecoxib at different doses and time-points with the first group including: the control, 75, 100 and 125 µmol/l celecoxib for 72 h (A) and group two including: the control, 125 µmol/l celecoxib for 24, 48 and 72 h (B). *P<0.05 or #P<0.01 relative to the control group from three independent experiments.INTERNATIONAL JOURNAL OF MOLECULAR MEDICINE 33: 1451-1458, 20141457binds to the corresponding Fas receptor, the intracellular death effector domain (DED) of the Fas receptor attracts Fas associated with death domain protein (FADD) and recruits procaspase-8 to form a death-inducing signaling complex (DISC). Procaspase-8 is then hydrolyzed to generate activated caspase-8, followed by the activation of procaspase-3 and other effector caspases that eventually induce apoptosis (18). Caspase-9 is the initiator of the mitochondrial pathway, also known as procaspase-9, an inactive zymogen. The initiator caspase-9 is activated by the assembly of a multimeric complex (dubbed apoptosome) involving Apaf-1 and cytochrome c. Cleaved caspase-9 and -3 are activated and these effector caspases degrade a large number of cell proteins, ultimately inducing cell apoptosis (19,20). In this study, we found that celecoxib significantly increased caspase-8 and -9 mRNA expression in a time- and dose-dependent manner in SGC-7901 cells, suggesting that celecoxib may activate caspase-8 and -9 to initiated apoptosis through the death receptor and mito-chondrial pathways, respectively.Autophagy is a crucial component of the cellular stress adaptation response that maintains mammalian homeo-stasis (21). There are three different forms of autophagy that are commonly described: macroautophagy, microautophagy and chaperone-mediated autophagy. Macroautophagy is the predominant pathway occurring mainly to eradicate damaged organelles or unused proteins. Macroautophagy is mediated by a unique organelle, the autophagosome, which encloses long-lived proteins and portions of organelles for delivery to the lysosome (22,23). Autophagy may play different roles in cancer occurrence and progression, while also potentially promoting or inhibiting cell proliferation at different stages of tumor growth (24). For example, autophagy plays a protective role in tumor cells via degradation of organelles under nutri-tional deficiency. Conversely, autophagy can also inhibit tumor growth via beclin 1, UVRAG, Bif and Atg. Findings of a recent study showed that berberine extracts promoted autophagy by activating beclin 1 expression and activated caspase-9 to induce apoptosis in hepatoma cells (25). Plant lectin from Polygonatum cyrtonema induced apoptosis and autophagy by inhibiting the Ras/Raf and PI3K/Akt signaling pathways in murine fibrosarcoma cells (26). In this study, the selective COX-2 inhibitor celecoxib, not only generated morphological changes indicative of apoptosis, but also typical changes of autophagy to include cytoplasmic autophagic vacuoles and autophagosomes.The molecular mechanism by which celecoxib induces apoptosis is not yet fully understood. The PI3K/Akt pathway widely presents in normal cells, but is abnormally activated in many malignant tumors (27-29). Akt, also known as protein kinase B (PKB), is a central component of the PI3K/Akt pathway, with Akt phosphoregulation impacting a variety of biological activities. In healthy and tumorigenic cells, Akt can be activated in an intracellular manner by hormones, growth factors, and extracellular matrix components (30). Akt regu-lates cell growth, survival and apoptosis through substrate phosphorylation, with Akt phosphoregulation observed at the Thr308 and Ser473 site, which are both required for activa-tion. Akt is activated as follows: the activated PI3K produces a secondary messenger PIP3 at the plasma membrane, PIP3 then binds an inactive Akt inducing its shift from the cytoplasm to the plasma membrane where Ser124 and Thr450 are phosphor-ylated, making Akt undergo a conformational change exposing its Thr308 and Ser473 sites. Immediately, phosphoinositide-dependent kinase 1 (PDK1) and phosphoinositide-dependent kinase 2 (PDK2), which are in close proximity to Akt, respec-tively catalyze the phosphorylation of the exposed Thr308 and Ser473 sites, resulting in the complete activation of Akt. This may trigger a phosphorylation cascade of downstream targets, ultimately impacting the regulation of cell growth and survival, proliferation and apoptosis, angiogenesis, cell migra-tion and numerous biological processes (30-33).In the present study, following celecoxib treatment in SGC-7901 cells, p-Akt, or activated Akt, was distinctly downregulated, leading to the upregulation of caspase-8 and -9 mRNA expression and increased procaspase-8 and -9 activation. Thus, we hypothesized that celecoxib inhibited the PI3K/Akt pathway by reducing the level of phosphorylation of Akt, which in turn activated the expression and activa-tion of caspase-8 and -9, resulting in apoptosis through the death receptor and mitochondrial pathways in SGC-7901 cells. Notably, we found changes in the cell ultrastructure to include apoptosis and autophagy, suggesting that celecoxib simultaneously induced apoptosis and autophagy, which is consistent with results of previous studies (5,13)). Autophagy is an evolutionarily conserved process that occurs during the growth and development process in many animals, but its specific mechanism of PCD is unclear. Autophagy and apoptosis could coadjust through p53 (35), PI3K/Akt (36) and Bcl-2-beclin 1 (37). Thus, celecoxib may impact both apop-tosis and autophagy via the PI3K/Akt signaling pathway in the SGC-7901 gastric cancer cells. The results of this study provide a new theoretical foundation for the antitumor mechanisms of celecoxib and offers new targets for cancer therapy, although these findings should be verified in future investigations. AcknowledgementsThis study was supported by a grant from the National Science Foundation of China (no. 81172366). We would like to thank LetPub for its linguistic assistance during the preparation of this manuscript.References1. Saukkonen K, Rintahaka J, Sivula A, et al: Cyclooxygenase-2 and gastric carcinogenesis. APMIS 111: 915-925, 2003.2. Jones DA, Carlton DP, McIntyre TM, Zimmerman GA and Prescott SM: Molecular cloning of human prostaglandin endo-peroxide synthase type II and demonstration of expression in response to cytokines. J Biol Chem 268: 9049-9054, 1993.3. Sarkar FH, Adsule S, Li Y and Padhye S: Back to the future: COX-2 inhibitors for chemoprevention and cancer therapy. Mini Rev Med Chem 7: 599-608, 2007.4. Duan L, Wu AH, Sullivan-Halley J and Bernstein L: Nonsteroidal anti-inflammatory drugs and risk of esophageal and gastric adenocarcinomas in Los Angeles County. Cancer Epidemiol Biomarkers Prev 17: 126-134, 2008.5. Fu SL, Wu YL, Zhang YP, Qiao MM and Chen Y: Anti-cancer effects of COX-2 inhibitors and their correlation with angiogen-esis and invasion in gastric cancer. World J Gastroenterol 10: 1971-1974, 2004.6. Lo AC, Woo TT, Wong RL and Wong D: Apoptosis and other cell death mechanisms after retinal detachment: implications for photoreceptor rescue. Ophthalmologica 226 (Suppl 1): 10-17, 2011.LIU et al: CELECOXIB INDUCES APOPTOSIS AND AUTOPHAGY VIA PI3K/Akt PATHWAY IN SGC-7901 CELLS 14587. Su M, Mei Y and Sinha S: Role of the crosstalk between autophagy and apoptosis in cancer. J Oncol 2013: 102735, 2013.8. Qadri SS, Wang JH, Coffey JC, et al: Surgically induced acceler-ated local and distant tumor growth is significantly attenuated by selective COX-2 inhibition. Ann Thorac Surg 79: 990-995, 2005.9. Grösch S, Maier TJ, Schiffmann S and Geisslinger G: Cyclooxygenase-2 (COX-2)-independent anticarcinogenic effects of selective COX-2 inhibitors. J Natl Cancer Inst 98: 736-747, 2006.10. Baek JY, Hur W, Wang JS, Bae SH and Yoon SK: Selective COX-2 inhibitor, NS-398, suppresses cellular proliferation in human hepatocellular carcinoma cell lines via cell cycle arrest. World J Gastroenterol 13: 1175-1181, 2007.11. Jendrossek V: Targeting apoptosis pathways by celecoxib in cancer. Cancer Lett 332: 313-324, 2013.12. Fan XM, Jiang XH, Gu Q, et al: Inhibition of Akt/PKB by a COX-2 inhibitor induces apoptosis in gastric cancer cells. Digestion 73: 75-83, 2006.13. Kim N, Kim CH, Ahn DW, et al: Anti-gastric cancer effects of Celecoxib, a selective COX-2 inhibitor, through inhibition of Akt signaling. J Gastroenterol Hepatol 24: 480-487, 2009.14. Patru CL, Surlin V, Georgescu I and Patru E: Current issues in gastric cancer epidemiology. Rev Med Chir Soc Med Nat Iasi 117: 199-204, 2013.15. Futagami S, Suzuki K, Hiratsuka T, et al: Chemopreventive effect of Celecoxib in gastric cancer. Inflammopharmacology 15: 1-4, 2007.16. Willoughby DA, Moore AR and Colville-Nash PR: COX-1, COX-2, and COX-3 and the future treatment of chronic inflam-matory disease. Lancet 355: 646-648, 2000.17. Greenhough A, Smartt HJ, Moore AE, et al: The COX-2/PGE2 pathway: key roles in the hallmarks of cancer and adaptation to the tumour microenvironment. Carcinogenesis 30: 377-386, 2009.18. Liu Y and Liu BA: Enhanced proliferation, invasion, and epithelial-mesenchymal transition of nicotine-promoted gastric cancer by periostin. World J Gastroenterol 17: 2674-2680, 2011.19. Fulda S: Caspase-8 in cancer biology and therapy. Cancer Lett 281: 128-133, 2009.20. Würstle ML, Laussmann MA and Rehm M: The central role of initiator caspase-9 in apoptosis signal transduction and the regu-lation of its activation and activity on the apoptosome. Exp Cell Res 318: 1213-1220, 2012.21. Allan LA and Clarke PR: Apoptosis and autophagy: Regulation of caspase-9 by phosphorylation. FEBS J 276: 6063-6073, 2009.22. White E, Karp C, Strohecker AM, Guo Y and Mathew R: Role of autophagy in suppression of inflammation and cancer. Curr Opin Cell Biol 22: 212-217, 2010.23. Lorin S, Hamaï A, Mehrpour M and Codogno P: Autophagy regu-lation and its role in cancer. Semin Cancer Biol 23: 361-379, 2013.24. White E: Deconvoluting the context-dependent role for autophagy in cancer. Nat Rev Cancer 12: 401-410, 2012.25. Helgason GV, Holyoake TL and Ryan KM: Role of autophagy in cancer prevention, development and therapy. Essays Biochem 55: 133-151, 2013.26. Xie BS, Zhao HC, Yao SK, et al: Autophagy inhibition enhances etoposide-induced cell death in human hepatoma G2 cells. Int J Mol Med 27: 599-606, 2011.27. Liu B, Wu JM, Li J, et al: Polygonatum cyrtonema lectin induces murine fibrosarcoma L929 cell apoptosis and autophagy via blocking Ras-Raf and PI3K-Akt signaling pathways. Biochimie 92: 1934-1938, 2010.28. Ye B, Jiang LL, Xu HT, Zhou DW and Li ZS: Expression of PI3K/AKT pathway in gastric cancer and its blockade suppresses tumor growth and metastasis. Int J Immunopathol Pharmacol 25: 627-636, 2012.29. Lin X, Zhang X, Wang Q, et al: Perifosine downregulates MDR1 gene expression and reverses multidrug-resistant phenotype by inhibiting PI3K/Akt/NF-kappaB signaling pathway in a human breast cancer cell line. Neoplasma 59: 248-256, 2012.30. Kang XH, Xu ZY, Gong YB, et al: Bufalin reverses HGF-induced resistance to EGFR-TKIs in EGFR mutant lung cancer cells via blockage of Met/PI3k/Akt pathway and induction of apoptosis. Evid Based Complement Alternat Med 2013: 243859, 2013. 31. Chang F, Lee JT, Navolanic PM, et al: Involvement of PI3K/Akt pathway in cell cycle progression, apoptosis, and neoplastic transformation: a target for cancer chemotherapy. Leukemia 17: 590-603, 2003.32. Song G, Ouyang G and Bao S: The activation of Akt/PKB signaling pathway and cell survival. J Cell Mol Med 9: 59-71, 2005.33. Falasca M: PI3K/Akt signalling pathway specific inhibitors: a novel strategy to sensitize cancer cells to anti-cancer drugs. Curr Pharm Des 16: 1410-1416, 2010.34. Garcia-Echeverria C and Sellers WR: Drug discovery approaches targeting the PI3K/Akt pathway in cancer. Oncogene 27: 5511-5526, 2008.35. Liu J, Lin Y, Yang H, Deng Q, Chen and He J: The expression of p33(ING1), p53, and autophagy-related gene Beclin1 in patients with non-small cell lung cancer. Tumor Biol 32: 1113-1121, 2011.36. Cheng Y, Ren X, Zhang Y, et al: eEF-2 kinase dictates cross-talk between autophagy and apoptosis induced by Akt inhibition, thereby modulating cytotoxicity of novel Akt inhibitor MK-2206. Cancer Res 71: 2654-2663, 2011.37. Djavaheri-Mergny M, Maiuri MC and Kroemer G: Cross talk between apoptosis and autophagy by caspase-mediated cleavage of Beclin 1. Oncogene 29: 1717-1719, 2010.。

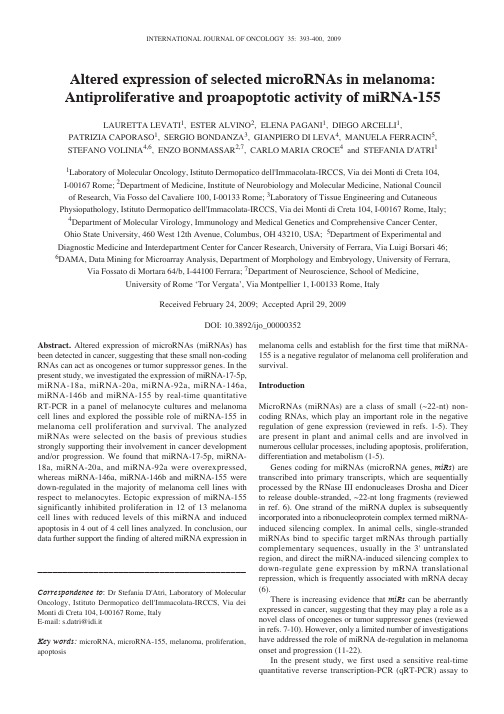
Abstract.Altered expression of microRNAs (miRNAs) has been detected in cancer, suggesting that these small non-coding RNAs can act as oncogenes or tumor suppressor genes. In the present study, we investigated the expression of miRNA-17-5p, miRNA-18a, miRNA-20a, miRNA-92a, miRNA-146a, miRNA-146b and miRNA-155 by real-time quantitative RT-PCR in a panel of melanocyte cultures and melanoma cell lines and explored the possible role of miRNA-155 in melanoma cell proliferation and survival. The analyzed miRNAs were selected on the basis of previous studies strongly supporting their involvement in cancer development and/or progression. We found that miRNA-17-5p, miRNA-18a, miRNA-20a, and miRNA-92a were overexpressed, whereas miRNA-146a, miRNA-146b and miRNA-155 were down-regulated in the majority of melanoma cell lines with respect to melanocytes. Ectopic expression of miRNA-155 significantly inhibited proliferation in 12 of 13 melanoma cell lines with reduced levels of this miRNA and induced apoptosis in 4 out of 4 cell lines analyzed. In conclusion, our data further support the finding of altered miRNA expression in melanoma cells and establish for the first time that miRNA-155 is a negative regulator of melanoma cell proliferation and survival.IntroductionMicroRNAs (miRNAs) are a class of small (~22-nt) non-coding RNAs, which play an important role in the negative regulation of gene expression (reviewed in refs. 1-5). They are present in plant and animal cells and are involved in numerous cellular processes, including apoptosis, proliferation, differentiation and metabolism (1-5).Genes coding for miRNAs (microRNA genes, miRs) are transcribed into primary transcripts, which are sequentially processed by the RNase III endonucleases Drosha and Dicer to release double-stranded, ~22-nt long fragments (reviewed in ref. 6). One strand of the miRNA duplex is subsequently incorporated into a ribonucleoprotein complex termed miRNA-induced silencing complex. In animal cells, single-stranded miRNAs bind to specific target mRNAs through partially complementary sequences, usually in the 3' untranslated region, and direct the miRNA-induced silencing complex to down-regulate gene expression by mRNA translational repression, which is frequently associated with mRNA decay (6).There is increasing evidence that miRs can be aberrantlyexpressed in cancer, suggesting that they may play a role as a novel class of oncogenes or tumor suppressor genes (reviewedin refs. 7-10). However, only a limited number of investigations have addressed the role of miRNA de-regulation in melanoma onset and progression (11-22).In the present study, we first used a sensitive real-time quantitative reverse transcription-PCR (qRT-PCR) assay toAltered expression of selected microRNAs in melanoma:Antiproliferative and proapoptotic activity of miRNA-155LAURETTA LEVATI1, ESTER ALVINO2, ELENA PAGANI1, DIEGO ARCELLI1, PATRIZIA CAPORASO1, SERGIO BONDANZA3, GIANPIERO DI LEVA4, MANUELA FERRACIN5, STEFANO VOLINIA4,6, ENZO BONMASSAR2,7, CARLO MARIA CROCE4and STEFANIA D'ATRI11Laboratory of Molecular Oncology, Istituto Dermopatico dell'Immacolata-IRCCS, Via dei Monti di Creta 104, I-00167 Rome;2Department of Medicine, Institute of Neurobiology and Molecular Medicine, National Council of Research, Via Fosso del Cavaliere 100, I-00133 Rome; 3Laboratory of Tissue Engineering and Cutaneous Physiopathology, Istituto Dermopatico dell'Immacolata-IRCCS, Via dei Monti di Creta 104, I-00167 Rome, Italy;4Department of Molecular Virology, Immunology and Medical Genetics and Comprehensive Cancer Center, Ohio State University, 460 West 12th Avenue, Columbus, OH 43210, USA; 5Department of Experimental and Diagnostic Medicine and Interdepartment Center for Cancer Research, University of Ferrara, Via Luigi Borsari 46;6DAMA, Data Mining for Microarray Analysis, Department of Morphology and Embryology, University of Ferrara, Via Fossato di Mortara 64/b, I-44100 Ferrara; 7Department of Neuroscience, School of Medicine,University of Rome ‘Tor Vergata’, Via Montpellier 1, I-00133 Rome, ItalyReceived February 24, 2009; Accepted April 29, 2009DOI: 10.3892/ijo_00000352_________________________________________Correspondence to:Dr Stefania D'Atri, Laboratory of MolecularOncology, Istituto Dermopatico dell'Immacolata-IRCCS, Via deiMonti di Creta 104, I-00167 Rome, ItalyE-mail: s.datri@idi.itKey words:microRNA, microRNA-155, melanoma, proliferation,apoptosisevaluate, in a panel of melanoma cell lines and normal melanocytes, the expression levels of seven miRNAs, namely miRNA-17-5p, miRNA-18a, miRNA-20a, miRNA-92a,miRNA-146a, miRNA-146b and miRNA-155. Actually,previous studies indicated that alterations in the expression of these miRNAs may have a role in cancer development and/or progression (7-10). Thereafter we focused our attention on miRNA-155, since it resulted markedly down-regulated in the majority of melanoma cell lines. In order to establish the possible biological significance of the low miRNA-155expression in melanoma, we investigated the effects of the ectopic expression of the miRNA on in vitro melanoma cell proliferation and apoptosis. Materials and methodsCell lines and normal melanocytes . Seventeen human melanoma cell lines were used in this study and cultured as previously described (23). GR-Mel and PNP-Mel were derived from primary melanomas, whereas the other cell lines were originated from metastatic lesions.Human melanocytes were isolated from normal skin biopsies of 10 different donors and cultured, as previously described (24).All biological material was obtained with the patient's informed consent and the study was conducted according to the Declaration of Helsinki Principles.Low molecular weight (LMW) RNA isolation and qRT-PCR analysis of miRNA expression . LMW RNA was isolated from melanocytes and melanoma cell lines using the mir Vana™miRNA isolation kit (Ambion, Austin, TX) according to the manufacturer's protocol. LMW RNA was quantified using the NanoDrop ND-1000 spectrophotometer (Thermo Fisher Scientific Inc, Waltham, MA).To evaluate the expression of U6 small nuclear RNA (snRNA) and mature miRNAs, the TaqMan®MicroRNA Reverse Transcription kit, the TaqMan Universal PCR Master Mix No AmpErase ®UNG and the TaqMan MicroRNA Assay for U6 snRNA and the selected miRNAs, all purchased from Applied Biosystems (Foster City, CA), were used. All experimental procedures were performed according to the manufacturer's protocols. One or 10 ng of LMW RNA were reverse transcribed in a final volume of 15 μl and qRT-PCR was done on an ABI PRISM 7000 Sequence Detection System (Applied Biosystems) in a final volume of 20 μl. All qRT-PCR reactions were run in duplicate. The expression of the miRNAs under investigation relative to miRNA-16 was determined using the formula 2-ΔC T , where ΔC T = (C TmiRNA - C TmiRNA-16) and C T (i.e. threshold cycle) indicates the fractional cycle number at which the amount of amplified target reaches a fixed threshold (25).Transfection . Pre-miR hsa-miR-155 miRNA Precursor (pre-miRNA-155) and Pre-miR miRNA Precursor Negative Control #1 (dsRNA-CTRL) were obtained from Ambion.To evaluate the effect of miRNA-155 on cell growth,melanoma cells were seeded into 24-well plates (Falcon,Becton and Dickinson Labware, Franklin Lakes, NJ) and allowed to adhere at 37˚C for 18 h. The cells were thentransfected with pre-miRNA-155 or dsRNA-CTRL. Trans-fection was performed using Oligofectamine or Lipofectamine 2000 (Invitrogen Corporation, Carlsbad, CA) in serum-free medium, according to the manufacturer's protocol. Additional controls consisted in melanoma cells left untreated or exposed to the transfection reagent only (mock-transfected cells). Three replica wells were used for each group. After 72 h of culture,the cells were subjected to a second transfection. Seventy-two hours later, the cells were harvested by trypsinization and cell growth was evaluated in terms of viable cell count.Transfection efficiency was evaluated using a fluorescein-labeled double-stranded RNA oligomer designated BLOCK-iT™fluorescent oligonucleotide (Invitrogen).Evaluation of apoptosis . Melanoma cells were plated in duplicate in 24-well plates and transfected with 100 nM pre-miRNA-155 or dsRNA-CTRL, as described above. Forty-eight hours after a single transfection procedure, apoptotic death was evaluated using the Cell Death Detection ELISA PLUS kit (Roche Diagnostics GmbH, Mannheim, Germany), according to the manufacturer's protocols. This kit allows the quantitative determination of mono- and oligonucleosomes that accumulate in the cytoplasm of cells undergoing apoptosis before plasma membrane breakdown. Signals were determined in a Microplate Reader 3550-UV (Bio-Rad, Hercules, CA). Data were expressed in terms of ‘Enrichment Factor’, calculated as the ratio between the adsorbance values of pre-miRNA-155-transfected cells and those of dsRNA-CTRL-transfected cells.Statistical analysis of qRT-PCR data . We performed two different statistical analyses to assess the significance of the differences in miRNA expression within a class of samples and between classes of samples.The statistical differences within a class of samples were determined using a customized script employing Bioconductor packages () and based on the R language (). In particular, we used ‘Permtest’ and ‘BootPR’ R-packages to perform t-test in conjunction with bootstrap analysis in order to determine which gene between U6 snRNA and miRNA-16 had the lowest variability among melanocytes. Fifty-thousand permutations were applied to the test in order to define the confidence limits and the corresponding significance thresholds. The statistical significance of the differential expression of U6 snRNA or miRNA-16 among the melanocytes was assessed by computing a P-value for each 2-CT value. No specific parametric form was assumed for the distribution of the test statistics. To determine the P-value, we used a permutation procedure in which the expression value of U6 snRNA or miRNA-16 was permuted 500,000 times, and for each permutation, two-sample t-statistics were computed for each value. The permutation P-value for a particular value is the proportion of the permutations (out of 500,000) in which the permuted test statistic exceeds the observed test statistic in absolute values.The same statistical analysis was applied to assess variability of miRNA-16 expression within the group of melanoma cell lines.The statistical significance of the differences in miRNA expression between melanoma cell lines and melanocytes was assessed by Student's t-test analysis performed on 2-ΔCT values.ResultsSelection of the internal control gene for the evaluation of miRNA expression by qRT-PCR. Previous studies showed that melanin inhibits RT-PCR (26). Therefore, to reduce melanin contamination and to enrich the miRNA content, we used column purified LMW RNA for qRT-PCR. U6 snRNA and miRNA-16 have been previously used as internal control genes to determine the relative expression of a large number of miRNAs in cell lines by qRT-PCR performed on total RNA (11,27). Therefore, preliminary experiments were carried out to select, between the two genes, the best internal control to be adopted for the present study.The first set of experiments showed that the 2-CT value of miRNA-16 was significantly higher (P<0.01 according to Student's t-test) than that of U6 snRNA in melanocytes isolated from normal skin biopsies of 10 different donors (data not shown). Moreover, t-test in conjunction with bootstrap analysis showed that variability of U6 snRNA expression among the different melanocyte samples was higher than that of miRNA-16 (i.e. P<0.01 or P<0.05 in 8 out of 10 samples in the case of U6 snRNA vs. no statistically significant variation in the case of miRNA-16, data not shown).In a subsequent set of experiments, the expression level of miRNA-16, in terms of 2-CT value, was determined in parallel in the 10 melanocyte samples and in 17 melanoma cell lines. The results of t-test in conjunction with bootstrap analysis confirmed that no significant differences existed in the expression of miRNA-16 within the group of melanocytes (Fig. 1). The same statistical analysis applied to melanoma cell lines identified three outliers (Fig. 1), indicating that de-regulation of miRNA-16 can occur in some melanomas. These 3 cell lines were then excluded from further analysis. Student's t-test analysis performed on miRNA-16 2-CT values relative to the remaining 14 melanoma cell lines and to the melanocytes showed no significant difference (Fig. 1). On these bases we selected miRNA-16 as the internal control gene for qRT-PCR assays.Expression of mature miRNAs in normal cultured melanocytes and melanoma cell lines. All qRT-PCR assays were performed using 1.33 μl of cDNA reverse transcribed from 1 ng of LMW RNA. However, the levels of miRNA-155 were found to be extremely low in melanoma cells. Therefore, the expression of this miRNA was evaluated using 1.33 μl of cDNA reverse transcribed from 10 ng of LMW RNA.As illustrated in Table I, all melanocyte samples expressed the miRNAs under investigation, being miRNA-146a the most expressed and miRNA-18a the less expressed miRNA in all samples.To identify miRNAs dysregulated in melanoma cell lines with respect to melanocytes, we performed Student's t-test analysis between the two groups (i.e. all melanoma cell lines vs. all melanocytes) and between each melanoma cell line and the group of melanocytes. When melanoma cell lines and melanocytes were compared as two groups, miRNA-17-5p, miRNA-18a, and miRNA-20a, which are encoded by the miR-17-92cluster, resulted overexpressed in the melanoma group (Table I). miRNA-92a, which is generated from the transcription of two different miRs(i.e. miR-92a-1in the miR-17-92cluster and miR-92a-2, in the miR-106a-363cluster) (reviewed in ref. 28) was also up-regulated in the melanoma group (Table I). In contrast, the expression of miRNA-146a, miRNA-146b and miRNA-155, was significantly reduced in the melanoma group with respect to that of melanocytes (Table I).When each melanoma cell line was compared with the melanocyte group, the four miRNAs encoded by the miR-17-92 cluster were up-regulated simultaneously in 9 cell lines. In contrast, miRNA-146a and miRNA-146b, were found to be concomitantly down-regulated in 10 melanomas and miRNA-155 resulted to be significantly reduced in 13 cell lines (Table I).Transfection of pre-miRNA-155 into melanoma cell lines inhibits proliferation. To investigate the biological significance of miRNA-155 down-regulation in melanoma cells, we decidedFigure 1. Expression levels of miRNA-16 in normal melanocytes and melanoma cell lines. Equal amounts (1.33 μl) of cDNA reverse transcribed from 1 ng of LMW RNA were used to determined by qRT-PCR the expression of miRNA-16 in normal skin melanocytes obtained from 10 different donors and in 17 melanoma cell lines. Data are expressed in terms of 2-CT x109. Each value represents the mean of six independent experiments, in which qRT-PCRs were run in duplicate. Bars, standard error of the mean. Among the melanoma group, three cell lines were found to be outliers (**P<0.01, according to t-test in conjunction with bootstrap analysis). The mean expression value for the melanocyte group was 155±8.13 and the mean expression value for the melanoma cell line group, not including CG-Mel, CR-Mel and MR-Mel, was 155±8.25.to assess the effect of ectopic expression of the miRNA on cell proliferation. To this end, all the melanoma cell lines were left untreated, mock-transfected or subjected to two sequential transfection procedures with 100 nM of a double-stranded RNA mimicking the endogenous precursor of miRNA-155(pre-miRNA-155) or with a double-stranded control RNA (dsRNA-CTRL). Cell growth was evaluated in terms of viable cell count 72 h after the second transfection.In preliminary experiments, the cell lines were transfected with either Oligofectamine or Lipofectamine 2000 and the BLOCK-iT™fluorescent oligonucleotide (100 nM) and assayed for transfection efficiency after 24 h. The cell lines were also subjected to two sequential transfections with the transfection reagents alone and assayed for proliferation 72 h after the second transfection. Based on the results of this set of experiments (data not shown), in 13 out of 14 cell lines we were able to select for the transfection reagent providing an acceptable transfection efficiency and minimal effects on proliferation (Table II and Fig. 2). In the remaining cell line (i.e. CT-Mel), we used Lipofectamine 2000 despite its marked inhibitory effect on cell growth because transfection efficiency with Oligofectamine was only 10%.The effects of pre-miRNA-155 transfection on melanoma cell growth are illustrated in Fig. 2. In 12 melanoma cell lines,growth inhibition induced by transfection of pre-miRNA-155was significantly higher than that observed in dsRNA-CTRL-transfected cells, with percentages of cell growth inhibition ranging between 30 and 98%. In the remaining cell lines (i.e. GR-Mel and PNM-Mel), no increase of cell growth inhibition was induced by pre-miRNA-155 transfection with respect to dsRNA-CTRL. Notably, GR-Mel, was the only cell line showing miRNA-155 levels comparable to those of melanocytes.To further assess the inhibitory activity of miRNA-155 on melanoma cell growth, a concentration-response curve was set up with CH-Mel, DR-Mel, GL-Mel and SK-Mel-28 cell lines.The results illustrated in Fig. 3 show that pre-miRNA-155,but not dsRNA-CTRL induced a concentration-dependent inhibition of cell growth.Table I. Expression of miRNAs in human normal melanocytes and melanoma cell lines.–––––––––––––––––––––––––––––––––––––––––––––––––––––––––––––––––––––––––––––––––––––––––––––––––––––Melanoma cell lines showing Melanoma cell lines showingmiRNA Relative expression level (2-ΔCT )aup-regulation of the miRNAdown-regulation of the miRNA–––––––––––––––––––––––––––––––––––––––––––––––––––––––––––––––––––––––––––––––––––––––––––––––––––––Melanocytes Melanoma P b No.c MC:NM Ratio d No.c MC:NM Ratio d–––––––––––––––––––––––––––––––––––––––––––––––––––––––––––––––––––––––––––––––––––––––––––––––––––––17-5p 0.045±0.0020.132±0.020<0.0110 2.3-5.50-18a 0.016±0.0010.049±0.008<0.0110 2.1-6.40-20a 0.247±0.0100.449±0.054<0.0111 1.5-3.420.7-0.692a 0.227±0.0180.367±0.041<0.0110 1.3-3.110.5146a 2.057±0.142 1.189±0.169<0.010-100.8-0.2146b 1.770±0.1440.861±0.140<0.010-100.6-0.11550.069±0.0110.005±0.004<0.010-130.2-0.0004–––––––––––––––––––––––––––––––––––––––––––––––––––––––––––––––––––––––––––––––––––––––––––––––––––––a The expression of miRNAs was determined by qRT-PCRs in melanocytes obtained from 10 different donors and in 14 melanoma cell lines.Values represent the mean ±standard error of the mean of the melanocyte or the melanoma group. For each melanocyte sample and melanoma cell line at least three independent experiments, in which qRT-PCRs were run in duplicate, were performed. b P, probability according to Student's t-analysis comparing miRNA expression values of melanocytes with those of melanoma cell lines.c Number of melanoma cell lines in which miRNA expression value was significantly higher or lower (P<0.05 according to Student's t-test analysis) than the mean expression value of the melanocyte group. d Range of the ratio between the mean expression value of each melanoma cell line (MC) and the mean expression value of the melanocyte group (NM).–––––––––––––––––––––––––––––––––––––––––––––––––––––––––––––––––––––––––––––––––––––––––––––––––––––Figure 2. Ectopic expression of miRNA-155 inhibits melanoma cell growth.Melanoma cells were left untreated, mock-transfected or subjected to two sequential transfections with 100 nM pre-miRNA-155 or dsRNA-CTRL, as described under Materials and methods. Seventy-two hours after the second transfection, the cells were harvested by trypsinization and cell growth was evaluated in terms of viable cell count. Data are expressed in terms of percentage of growth inhibition of target cells transfected with pre-miRNA-155, or dsRNA-CTRL or mock-transfected with respect to the untreated cells. Each value represents the mean of at least three independent experiments performed with triplicate samples, with bars indicating standard error of the mean. **P<0.01, according to Student's t-test, comparing the percentages of cell growth inhibition of pre-miRNA-155-transfected cells with those of dsRNA-CTRL-transfected cells. Percentages were subjected to angular transformation in order to obtain normally distributed data.Thereafter, conventional standard error calculation and Student's t-test statistics were performed on converted data. However, the data are expressed in non-transformed percentages, following conversion of transformed data into the original values.Transfection of pre-miRNA-155 into melanoma cell lines induces apoptosis. To investigate whether the growth inhibitory effect of pre-miRNA-155 could be due, at least in part, to the triggering of apoptosis, experiments were performed on 4 different cell lines, that were subjected to a single transfection with 100 nM pre-miRNA-155 or dsRNA-CTRL and assayed for apoptosis 48 h later. Ectopic expression of miRNA-155 was able to induce apoptosis in all the 4 cell lines tested (Fig. 4). Moreover, apoptosis was particularly pronounced in the two cell lines in which transfection with pre-miRNA-155 was followed by strong cell growth suppression (i.e. CH-Mel and DR-Mel).DiscussionAberrant expression of the miR-17-92cluster or single components of the cluster, as well as of miR-146a, miR-146b and miR-155can have a role in tumorigenesis (7,8,10,28). To investigate whether these miRs could be deregulated in melanoma, we comparatively analyzed the expression levels of the corresponding mature miRNAs in a panel of human melanoma cell lines and cultured normal melanocytes. Notably, the qRT-PCR assays were performed on RNA preparations enriched for miRNAs, with conceivably reduced content of melanin. Moreover, the internal control gene (i.e. miRNA-16) was selected following an experimental survey of two candidate small RNA molecules largely used as reference gene transcripts. We found that miRNA-17-5p, miRNA-18a, miRNA-20a, and miRNA-92a were up-regulated, whereas miRNA-146a, miRNA-146b and miRNA-155 were down-regulated in the majority of the melanoma cell lines analyzed.We focused our attention on the biological role of miRNA-155, that was found, for the first time, to be a candidate gene able to control melanoma cell growth and survival. Indeed, we observed that enforced expression of miRNA-155 was able to inhibit proliferation and induce apoptosis in melanoma cells expressing low levels of this miRNA.In humans, miR-155resides within the BIC gene on chromosome 21 (7,8). High levels of miRNA-155 have been found in B-CLL, B-cell lymphomas, papillary tyroid carcinoma, breast cancer (7-10), pancreatic ductal adeno-carcinoma (29) and other tumors (30). Moreover, enforced expression of miRNA-155 is sufficient to trigger murine B lymphoma (7). On the other hand, miRNA-155 was reported to be expressed in healthy pancreas and essentially absent in endocrine pancreatic tumors (10). Moreover, the levels of this miRNA were found to be reduced in ovarian cancer (31). These findings suggest that miR-155can act either as oncogene or as tumor suppressor gene, depending on the cell background in which miRNA-155 is performing its specific target gene controlling function.Our results demonstrate that miRNA-155, which appears to be the most altered miRNA among those analyzed, is a negative regulator of melanoma cell growth. Actually, ectopic expression of miRNA-155 significantly inhibited proliferation in 12 out of 13 melanoma cell lines endowed with low miRNA-155 levels. In contrast, enforced expression of this miRNA did not affect the growth of GR-Mel cells, which display miRNA-155 levels comparable to those of melano-cytes. It must be noted that the transfection efficiency of GR-Mel cells was ~70-80%, thus eliminating the possibility that ineffective pre-miRNA-155 uptake might underlie the lack of response. Moreover, a concentration-dependent inhibitionTable II. Transfection efficiency and cell growth inhibition relative to the transfection reagent selected for melanoma cell lines.–––––––––––––––––––––––––––––––––––––––––––––––––––––––––––––––––––––––––––––––––––––––––––––––––––––Transfection efficiency a Cell growth inhibition b Transfection reagent Cell line Range (%)Range (%)–––––––––––––––––––––––––––––––––––––––––––––––––––––––––––––––––––––––––––––––––––––––––––––––––––––Oligofectamine CH-Mel80-9010-20CN-Mel80-905-10DR-Mel80-9010-20GL-Mel60-70<5WM-266-470-80<5 Lipofectamine 2000CL-Mel80-9010-20CT-Mel90-10060-70GR-Mel70-805-20M1470-8015-25PNM-Mel90-10015-20PNP-Mel80-905-15SK-Mel-2870-805-20SN-Mel80-9015-25397-Mel80-9015-25–––––––––––––––––––––––––––––––––––––––––––––––––––––––––––––––––––––––––––––––––––––––––––––––––––––a Melanoma cells were seeded into 24-well plates, allowed to adhere at 37˚C for 18 h and then transfected with 100 nM BLOCK-iT™fluorescent oligonucleotide using Oligofectamine or Lipofectamine 2000. Transfection efficiency was evaluated 24 h after transfection using a fluorescence microscope (Axiovert 135, Zeiss, Oberkochen, Germany).b Melanoma cells were subjected to two sequential transfection procedures with the transfection reagent alone, as described in Materials and methods. Cell proliferation was evaluated 72 h after the second transfection.–––––––––––––––––––––––––––––––––––––––––––––––––––––––––––––––––––––––––––––––––––––––––––––––––––––of cell growth was observed upon transfection of pre-miRNA-155 but not of dsRNA-CTRL, thus further supporting the specificity of the inhibitory effects of miRNA-155. Impairment of melanoma cell proliferation appears to be dependent, at least in part, on miRNA-155-mediated induction of apoptosis.Indeed, in 4 out of 4 cell lines tested ectopic expression of miRNA-155 caused significantly higher levels of apoptosis than ectopic expression of dsRNA-CTRL.Since miRNAs can regulate a large number of target genes,several algorithms have been developed to predict in silico the targets of selected miRNAs. We adopted the TargetScan (/) and PicTar (/) algorithms to identify putative miRNA-155 targets and found that 160 targets are predicted by both algorithms.Down-regulation of one or more of these target genes might be involved in miRNA-155-induced impairment of melanoma cell proliferation and survival. For instance, the MAP3K14genes code for nuclear factor-inducing kinase (NIK), which plays a central role in the activation of the non-canonical NF-κB pathway in response to a subset of NF-κB-inducing stimuli (reviewed in ref. 32). It has been shown that NIK expression and/or activity is significantly higher in melanoma cells than in normal melanocytes and that overexpression of a kinase-deficient mutant of NIK strongly reduces basal NF-κBFigure 4. Ectopic expression of miRNA-155 induces apoptosis in melanoma cells. CH-Mel, DR-Mel, SK-Mel-28 and 397-Mel cells were subjected to a single transfection procedure with 100 nM pre-miRNA-155 or dsRNA-CTRL,as described in Materials and methods. Forty-eight hours after transfection,the cytoplasmic amount of mono- and oligonucleosomes originated from apoptotic DNA degradation was quantified using an ELISA assay. Data areexpressed in terms of Enrichment Factor (EF), calculated as the ratio between the adsorbance value of pre-miRNA-155-transfected cells and that of dsRNA-CTRL-transfected cells, to which the arbitrary value of 1.0 was assigned. Each value represents the mean of at least four independent experiments. Bars, standard error of the mean. **P<0.01 and *P<0.05,according to Student's t-test, comparing the adsorbance values of pre-miRNA-155-transfected cells with those of dsRNA-CTRL-transfected cells.Figure 3. Ectopic expression of miRNA-155 induces a concentration-dependent inhibition of melanoma cell growth. CH-Mel (a), DR-Mel (b), GL-Mel (c) and SK-Mel-28 (d) cells were left untreated or subjected to two sequential transfections with the indicated concentrations of pre-miRNA-155 or dsRNA-CTRL, as describe under Materials and methods. Seventy-two hours after the second transfection, the cells were harvested by trypsinization and cell growth was evaluated in terms of viable cell count. Data are expressed in terms of percentage of growth inhibition of target cells transfected with pre-miRNA-155 or dsRNA-CTRL with respect to untreated cells. Each value represents the mean of at least three independent experiments performed with triplicate samples,with bars indicating standard error of the mean. Percentages were subjected to angular transformation in order to obtain normally distributed data. Thereafter,conventional standard error calculation was performed on converted data. However, the data are expressed in non-transformed percentages, following conversion of transformed data into the original values.。
National Medical Frontiers of China, Mar.2011, Vol.6 No.6中国医疗前沿 2011年3月 第6卷 第6期25综述与进展迄今为止,细胞的凋亡过程确切机制尚不完全清楚,但凋亡过程的紊乱可能与许多疾病的发生有直接或间接的关系。
细胞凋亡涉及一系列蛋白,如Caspase 家族蛋白、Bcl-2家族蛋白和p53蛋白、survivin。
其中Caspase 半胱氨酸天冬氨酸特异性蛋白酶(Cysteinyl aspartate specific proteinase,Caspase)家族,也称为ICE/CED-3家族,是美丽线虫(Caenorhabditis elegans)死亡基因CED-3的同源物。
这类蛋白酶与细胞凋亡形态学特征变化(如细胞膜空泡形成、核膜破裂、染色质聚集和边聚及DNA 断裂等)以及一些生化改变关系密切。
1 Caspase 的生化特性从1992年人类第一次纯化Caspase-1克隆并测序其cDNA 至今,Caspase 家族中共有14个成员被克隆出,它们在氨基酸序列、结构及酶的特性上均相似,正常时均以无活性的酶原形式存在。
酶原分子由一个N 端前域及一大一小两个亚基组成。
酶原分子激活后,大小亚基解离并重新组装为四聚体形式的活性酶两个小亚基单位在中间,两个大亚基单位在外周。
每个异二聚体包含一个催化位点。
大小亚基的同源性较高,而N 端前域的同源性较低,因此N 端前域成为区别Caspase 家族各成员的重要指标。
Caspase 分为三大类:凋亡启动因子(apoptotic initiators)、凋亡执行因子(apoptotic executioners)和炎症介导因子(inflammatory mediators),构成了级联放大效应。
凋亡启动因子在级联反应的上游,包括Caspase-2、Caspase-8、Caspase-9、Caspase-10等,能在其它蛋白辅助下发生自我活化并识别和激活下游的Caspase。

缺血预处理英语Ischemic PreconditioningIschemic preconditioning is a phenomenon in which brief, repeated episodes of ischemia and reperfusion confer protection against subsequent prolonged ischemic injury. This concept was first introduced in 1986 by Murry et al., who demonstrated that brief periods of coronary artery occlusion in canine hearts could protect the myocardium from a subsequent prolonged ischemic insult. Since then, the cardioprotective effects of ischemic preconditioning have been extensively studied in various animal models and have also been observed in human clinical settings.The mechanisms underlying ischemic preconditioning are complex and involve a cascade of molecular events that ultimately lead to the activation of various signaling pathways and the modulation of cellular responses to ischemic stress. The initial trigger for ischemic preconditioning is the transient ischemic event, which results in the release of endogenous mediators such as adenosine, bradykinin, opioids, and reactive oxygen species. These mediators then activate specific cell surface receptors, leading to the activation of various protein kinases, including protein kinase C (PKC), protein kinase G(PKG), and mitogen-activated protein kinases (MAPKs).The activation of these signaling pathways leads to the modulation of various cellular processes, including the opening of mitochondrial ATP-sensitive potassium (KATP) channels, the inhibition of the mitochondrial permeability transition pore (mPTP), and the upregulation of antioxidant enzymes. These cellular changes ultimately result in the protection of the myocardium against subsequent ischemic injury by reducing the extent of cell death, preserving cellular function, and enhancing the recovery of the myocardium upon reperfusion.One of the key mechanisms underlying ischemic preconditioning is the modulation of mitochondrial function. Mitochondria play a crucial role in the regulation of cellular metabolism and the production of energy in the form of ATP. During ischemia, the lack of oxygen leads to a disruption of the electron transport chain, resulting in the accumulation of reactive oxygen species and the opening of the mPTP. This, in turn, leads to the release of proapoptotic factors, such as cytochrome c, and the initiation of cell death pathways.Ischemic preconditioning has been shown to attenuate the opening of the mPTP and to enhance the activity of mitochondrial KATP channels, which can help to maintain the integrity of themitochondrial membrane and prevent the release of proapoptotic factors. Additionally, ischemic preconditioning has been found to upregulate the expression of antioxidant enzymes, such as superoxide dismutase and catalase, which can help to scavenge reactive oxygen species and reduce oxidative stress.Another important mechanism of ischemic preconditioning is the modulation of cellular signaling pathways. Ischemic preconditioning has been shown to activate various protein kinases, such as PKC, PKG, and MAPKs, which can then phosphorylate and activate downstream effectors that are involved in the regulation of cell survival and the inhibition of cell death pathways. For example, the activation of PKC has been shown to phosphorylate and inhibit the proapoptotic protein Bad, thereby promoting cell survival.Ischemic preconditioning has also been found to upregulate the expression of various cardioprotective genes, such as those encoding heat shock proteins and growth factors. These proteins can help to protect the myocardium against ischemic injury by enhancing the cellular stress response, promoting the repair of damaged cells, and stimulating the growth of new blood vessels (angiogenesis).In addition to its cardioprotective effects, ischemic preconditioning has also been shown to have beneficial effects in other organ systems, such as the brain, liver, and kidney. In the brain, ischemicpreconditioning has been found to protect against the damaging effects of stroke, while in the liver and kidney, it has been shown to protect against the injury associated with ischemia-reperfusion events, such as those that occur during organ transplantation.Despite the extensive research on ischemic preconditioning, there are still many unanswered questions and challenges that need to be addressed. For example, the optimal protocols for ischemic preconditioning, the long-term effects of repeated preconditioning episodes, and the potential clinical applications of this phenomenon are all areas that require further investigation.Nevertheless, the concept of ischemic preconditioning has had a significant impact on our understanding of the cellular and molecular mechanisms involved in the response to ischemic stress, and it has opened up new avenues for the development of novel therapeutic strategies for the treatment of various ischemic diseases.。
吡罗克酮乙醇胺盐(PO )是一种羟肟酸,该药物除具有抗真菌活性外,对革兰氏阳性菌和革兰氏阴性菌的活性也有明显的抑制作用[1]。
有研究发现此药物还具有抗肿瘤作用,其作用机制主要是通过Wnt/β-catenin 通路促进凋亡[2,3],还可以作为WNT 抑制剂发挥抗肿瘤的作用[4]。
一项体内实验证明,PO 的毒性很低[5]。
因此,PO 对胶质瘤的治疗可能是一种方法,然而,PO 对胶质瘤的抑制作用及其机制尚不明确。
近年来,线粒体已成为科学研究热点,线粒体是产生能量、调节细胞信号和放大细胞凋亡的重要细胞器[6];其不能从头生成,而是必须通过裂变增殖,从而进行能量调整以维持细胞正常功能[7,8]。
氧化应激,线粒体DNA 损伤或线粒体膜电位丧失等细胞失衡会影响线粒Piroctone olamine disrupts mitochondrial dynamics in glioma cells through the PI3K/AKT pathwayXU Wenqin 1,2,YE Jingjing 1,2,WANG Fei 3,CHEN Tianbing 1,21Key Laboratory of Noncoding RNA Transformation Research of Anhui Higher Education Institution,Wannan Medical College,Wuhu 241002,China;2Central Laboratory of Yijishan Hospital,Wuhu 241001,China;3Wuhu Hospital of Traditional Chinese Medicine,Wuhu 241001,China摘要:目的探究吡罗克酮乙醇胺盐(PO )对胶质瘤细胞U251和U373增殖抑制和促凋亡的作用及其机制。
方法培养细胞,经不同浓度的PO 处理,CCK-8法和EdU 实验检测细胞增殖情况;克隆形成实验检测细胞克隆形成;流式细胞术检测细胞凋亡;JC-1检测线粒体膜电位水平;荧光探针检测线粒体形态学改变,Western blot 检测线粒体分裂蛋白DRP1和融合蛋白OPA1;转录组测序和差异基因富集分析后进行Western blot 检测验证PI3K ,AKT 和p-AKT 蛋白表达水平。
线粒体自噬的英语Mitochondrial Autophagy: A Vital Process for Cellular HomeostasisMitochondria, often referred to as the "powerhouses" of cells, play a crucial role in cellular metabolism and energy production. These organelles are responsible for generating the majority of the cell's supply of adenosine triphosphate (ATP), the primary energy currency of the cell. However, mitochondria are not just passive energy producers; they are dynamic structures that undergo constant remodeling and maintenance to ensure optimal function. One of the key mechanisms involved in this process is mitochondrial autophagy, also known as mitophagy.Autophagy is a fundamental cellular process in which damaged or unwanted components are engulfed and degraded within the cell. This process serves as a quality control mechanism, removing dysfunctional organelles, misfolded proteins, and other cellular debris to maintain cellular homeostasis. Mitophagy, a specialized form of autophagy, specifically targets and removes damaged or dysfunctional mitochondria, ensuring the overall health and efficiency of the cellular energy production system.The importance of mitophagy cannot be overstated. Impaired mitophagy has been linked to a variety of disease states, including neurodegenerative disorders, cardiovascular diseases, and metabolic disorders. When mitochondria become damaged or dysfunctional, they can release reactive oxygen species (ROS) and pro-apoptotic factors, leading to cellular stress and potentially triggering programmed cell death (apoptosis). Mitophagy serves as a protective mechanism, selectively removing these damaged mitochondria and preventing the propagation of cellular damage.The process of mitophagy is a highly regulated and complex event, involving a series of coordinated steps. The initial step involves the identification of damaged or dysfunctional mitochondria. This is typically achieved through the detection of specific molecular signals, such as the loss of membrane potential or the accumulation of misfolded proteins within the mitochondria. These signals trigger the recruitment of specialized proteins, known as mitophagy receptors, which act as the "tags" that mark the damaged mitochondria for removal.Once the mitochondria have been identified, the next step is the formation of the autophagosome, a double-membrane vesicle that engulfs the targeted mitochondria. This process is facilitated by a group of proteins known as the autophagy-related (Atg) proteins, which coordinate the assembly and maturation of theautophagosome. The autophagosome then fuses with the lysosome, an organelle rich in digestive enzymes, resulting in the degradation of the mitochondrial contents.The regulation of mitophagy is a delicate balance, as the process must be precisely controlled to ensure the appropriate removal of damaged mitochondria without compromising the overall cellular function. This regulation is achieved through a complex network of signaling pathways and transcriptional programs that respond to various cellular cues, such as oxidative stress, nutrient availability, and energy status.One of the key regulators of mitophagy is the PINK1/Parkin pathway, which has been extensively studied in the context of Parkinson's disease. In this pathway, the PINK1 protein acts as a sensor, detecting the loss of mitochondrial membrane potential and recruiting the E3 ubiquitin ligase Parkin to the damaged mitochondria. Parkin then ubiquitinates specific mitochondrial proteins, marking them for degradation and triggering the mitophagy process.In addition to the PINK1/Parkin pathway, other signaling cascades, such as the AMPK (AMP-activated protein kinase) and mTOR (mechanistic target of rapamycin) pathways, also play crucial roles in the regulation of mitophagy. These pathways respond to changes incellular energy status and nutrient availability, respectively, and modulate the activity of mitophagy-related proteins to maintain cellular homeostasis.The importance of mitophagy extends beyond its role in maintaining cellular health. Emerging evidence suggests that mitophagy may also be involved in various physiological processes, such as development, aging, and adaptation to environmental stressors. For instance, during embryonic development, mitophagy is crucial for the elimination of paternal mitochondria, ensuring the exclusive inheritance of maternal mitochondrial DNA.Furthermore, the dysregulation of mitophagy has been implicated in the pathogenesis of various age-related diseases, including neurodegenerative disorders, cardiovascular diseases, and cancer. Understanding the mechanisms underlying mitophagy and its role in these disease states has become a major focus of research in the field of cellular and molecular biology.In conclusion, mitochondrial autophagy, or mitophagy, is a vital process that ensures the proper maintenance and function of mitochondria within the cell. By selectively removing damaged or dysfunctional mitochondria, mitophagy plays a crucial role in maintaining cellular homeostasis and preventing the propagation of cellular damage. The regulation of mitophagy is a complex anddynamic process, involving a network of signaling pathways and transcriptional programs that respond to various cellular cues. Ongoing research in this field continues to shed light on the importance of mitophagy in both physiological and pathological conditions, paving the way for the development of potential therapeutic interventions targeting this crucial cellular process.。
Cell Biology2013;1(1) : 9-17Published online May 20, 2013 (/j/cb)doi: 10.11648/j.cb.20130101.12Involvement of pro-apoptotic and pro-autophagic pro-teins in Granulosa cell deathEscobarML, EcheverríaOM, CasasaAS, García G, AguilarSJ, Vázquez-NinGH*Laboratorio de Microscopía Electrónica. Departamento de Biología Celular. Facultad de Ciencias. Universidad Nacional Autónoma deMéxico (UNAM).Email address:vazqueznin@ciencias.unam.mx(V-NinGH)To cite this article:Escobar M L, Echeverría O M;Casasa A S, García G , Aguilar S J, Vázquez-NinGH. Involvement of Pro-Apoptotic and Pro-Autophagic Proteins in Granulosa Cell Death Cell Biology Vol. 1, No. 1, 2013, pp. 9-17. doi: 10.11648/j.cb.20130101.12Abstract: Follicular atresia is a process present in all mammals studied. It involves the oocyte and granulosa cells. The apoptotic cell death has been implicated in follicular atresia. Now it is known that the autophagy is a programmed cell death. In this work, atretic follicles of Wistar rats’ ovaries were analyzed, to evaluate the routes of granulosa cell death during the follicular atresia. The apoptosis and autophagy presence was studied by means of ultrastructural and immunohis-tochemical techniques, and by molecular procedures. During atresia, follicular cells undergo the standard processes of cell death, apoptosis and autophagy, as well as a process in which features of both occur in the same cell. Other processes of cell death affect only granulosa cells and involve such features as contraction of cell volume, an increase of the lumen of the nuclear envelope and the endoplasmic reticulum, and loss of contacts with the oocyte, which is also altered. Keywords: Atresia, Apoptosis, Autophagy, Granulosa Cell1. IntroductionThe follicle is a morphological and physiological unit that can remain unchanged, may grow into an ovulating follicle, or may suffer regressive changes called atresia. Follicular atresia is the process through which ovarian follicles not selected for ovulation are eliminated. Ovarian follicles in the process of atresia occur frequently in the ovaries of newborn, prepubertal and adult female mammals. The eventual fate of the follicle depends on a balance in the expression and actions of the factors that promote the proli-feration, growth and differentiation of follicular cells, and those that induce programmed cell death. FSH binds to its granulosa cell receptors to promote the survival and growth of ovarian follicles by stimulating proliferation and estra-diol secretion and inhibiting cell death by up-regulating the expression of anti-apoptotic proteins [1].During follicular atresia, the oocyte and granulosa cells undergo processes of cell death. In primordial follicles, the onset of the process of atresia seems to depend on altera-tions of the oocyte[2]. Immunohistochemical and ultra-structural analyses of the processes of cell death in oocytes in newborn and prepubertal female rats have demonstrated the presence of abundant autophagosomes, apoptotic bodies, a positive reaction to the TUNEL method, active caspase-3 and Lamp-1, and the absence of large clumps of compact chromatin associated with the nuclear membrane [3]. In adult rats, markers of both apoptosis and autophagy were found in the same oocyte [4]. The structural features of the process of oocyte death are characterized by the presence of clear vacuoles and autophagosomes, and the absence of large clumps of compact chromatin and apoptotic bodies [5, 6]. The main cytochemical feature of the oocytes was their positive reaction to the TUNEL method, which changed according to the age of the rats studied [3].The apoptotic process of cell death (programmed cell death type I) has been implicated in follicular atresia, as several studies have shown the different morphological characteristics of that process with, and the expression of several proteins related to the apoptotic cell death process has been identified in granulosa cells during follicular progress [7]. Apoptotic cell death is carried out by proteas-es called caspases; enzymes that are classified into two groups: initiator caspases (such as 8 and 9), and effector caspases (3, 6, 7). Once activated, these proteases cleave to different cellular proteins [8].Programmed cell death process type II –autophagy– is characterized morphologically by the presence of a large10 EscobarML et al.: Involvement of Pro-Apoptotic and Pro-Autophagic Proteins in Granulosa Cell Deathnumber of autophagosomes with cytoplasmic content in different degrees of degradation [9].Molecular mechanisms involved in autophagy suggest the participation of a tg genes [10]. In mammals, the micro-tubule-associated protein 1 light chain 3 (LC3), the Atg8 homologue, has been used as an indicator of autophagy. The phosphatidylethanolamine (PE)-conjugated Atg8 pro-tein plays a structural role in autophagy and is a useful tool for evaluating that process [11]. Beclin-1 (Atg6) is another autophagy-related protein with a fundamental role in auto-phagy [12], it is involved in the initiation of the autophagy [13, 14], in the formation [15] and maturation [16] of auto-phagosomes.The aim of the present study is to analyze the structural, ultrastructural, cytochemical, and molecular aspects of granulosa cell alterations together with modifications of the interrelations among rat granulosa cells and between them and the oocyte.2. Materials and Methods2.1. Experimental animals60 female Wistar rats were used in the study. They were kept under a 12 h light-darkness cycle with water and food ad libitum. All animals were handled in accordance with the NIH Guide for the Care and Use of Laboratory Animals.2.2. Ovary tissue processing for optical microscopy Ovaries were processed as described elsewhere [4]. They were fixed in 2% paraformaldehyde in phosphate-buffered saline (PBS) at pH 7.2 for 2 hours at room temperature, embedded in paraffin, and serially sectioned. Five µm-thick sections from each ovary were aligned on glass microscope slides covered with poli-l-lysine (Sigma, St Louis, MO), and observed under a Nikon Eclipse E600 Microscope. Images were recorded with a Nikon Digital Camera DXM1200F.2.3. Electron microscopy processOvaries were fixed in 2.5% glutaraldehyde-4% formal-dehyde in phosphate-buffered saline (PBS) at pH 7.2 for 2 hours. After rinsing in the same buffer, tissues were post-fixed in 1% osmium tetroxide (OsO4) in a PBS buffer at pH 7.2 for 1 hour. Tissues were then dehydrated using a graded ethanol series and embedded in Epon (Embed-812, Electron Microscopy Science; Hatfield, PA). Semi-thin sections were stained with toluidine blue. Selected areas were thin-sectioned and mounted on grids, which were counterstained with uranyl acetate and lead citrate. Sections were examined under a JEOL 1010 electron microscope operated at 100 KV. Digital images were taken with a Ha-mamatsu camera. 2.4. Immunodetection assaysOvaries were fixed in 4% formaldehyde in PBS at pH 7.2 for 2 hours. The tissues were dehydrated using a graded ethanol series and embedded in paraffin. The paraffin-embedded samples were then sectioned for use in carrying out immunolocalizations of the active caspase-3, Beclin-1, and LC3 proteins, and to perform the TUNEL technique. Antigen unmasking was carried out by microwaving the tissue sections in citrate-buffer at 0.1 M and pH 6 (BioGe-nex, Fremont, CA) in a Panasonic microwave oven for 3 min at 1,300 W, and then for 6 min at 780 W. After cooling, the sections were washed in PBS and incubated with prima-ry antibodies.2.5. Simultaneous Beclin-1 and active caspase-3 immuno-localizationDeparaffinized tissue sections were washed in PBS and incubated simultaneously with anti-active caspase-3 (Sigma, St Louis, MO) and anti-Beclin-1 (Abcam, Cambridge, UK) (1:100) in PBS dilution for 18 h at 4°C. Negative controls were elaborated by omitting the primary antibodies. After washing, the slides were incubated for 1 h under darkness at room temperature with an anti-rabbit immunoglobulin coupled to Alexafluor488(Invitrogen Carlsbad, CA) and anti-sheep immunoglobulin that in turn was coupled to Alexafluor 594 (Invitrogen; Carlsbad, CA). Next, the prep-arations were washed and counterstained with DAPI (Sig-ma, St Louis, MO) to evaluate DNA distribution. Slides were covered with mounting media for fluorescence micro-scopy (Vectashield Mounting Medium, Vector Labs., Bur-lingame, CA).2.6. Simultaneous TUNEL procedure and LC3 immuno-detectionDeparaffinized tissue sections were washed in PBS and simultaneously incubated with primary antibody anti-LC3 (Affinity BioReagents; Rockford, IL) (1:200) in PBS dilu-tion for 18 h at 4°C. After washing, slides were incubated with an anti-rabbit immunoglobulin coupled to Alexafluor 488 (Invitrogen; Carlsbad, CA) for 1 h under darkness at room temperature. Then the preparations were washed and the evaluation of DNA fragmentation was performed using the Apoptag Red In Situ Apoptosis Detection Kit (Milli-pore; Co, USA). Sections were labeled with biotin-dUTP by incubation with a reaction buffer containing terminal deoxinucleotidyltransferase for 1 h at 37°C. Biotinylated nucleotides were detected with a streptavidin-Rhodamine conjugate. Tissues were counterstained with DAPI (Sigma, St Louis, MO) to evaluate DNA distribution. Slides were covered with Vectashield Mounting Medium for fluores-cence microscopy. The negative controls were carried out omitting the primary antibody or the terminal deoxinucleo-tidyltransferase.Cell Biology 2013, 1(1):9-17 112.7. Annexin-V assayThe apoptotic granulosa cells were identified by fluores-cence microscopy using the Annexin-V/FITC Apoptosis Detection Kit (Sigma, St Louis, MO) according to the manufacturer’s instructions. 5 µl of Annexin-V/FITC and 1 µl of propidium iodide to the cellular fraction were added. Then the preparation was incubated at 37°C, protected from light, for exactly 10 min. The cells in early apoptotic process were stained by the Annexin-V/FITC alone.2.8. Western Blot analysisThe protein expression level was evaluated using the Western Blot assay. The granulosa cells were isolated from the ovaries of the Wistar rats, which were disaggregated in 0.1% trypsin (GIBCO; Grand Island, NY) in a calcium- and magnesium-free solution for 15 min at 37°C. The ovarian cells were then incubated at 37°C in an atmosphere con-taining 5% CO2 for 24 h on 35 mm culture plates (Nunc; Denmark), with DMEM GlutaMAX(GIBCO; Grand Island, NY) supplemented with 0.1% albumin (Sigma, St Louis, MO) and 4% fetal bovine serum (GIBCO; Grand Island, NY). The cells were incubated for 24 h to allow the granu-losa cells to adhere to the bottom of the dish. Next, the dishes were washed and the granulosa cells were incubated for 15 min in lysis buffer (50 mMTris–Cl, pH 7.5; 150 mMNaCl, 0.1% SDS, 1 mM PMSF, 0.5% sodium deoxy-cholate, and 1% Nonidet P-40), supplemented with the complete protease inhibitor cocktail (Roche, Mannheim, Germany). Total proteins were measured by Bradford As-say: 50 µg of total proteins were loaded onto a 12% SDS-PAGE gel before being transferred to polyvinylidene fluoride (PVDF) membranes, which were incubated for 1 h at room temperature in blocking buffer. Then the mem-branes were incubated with anti-active caspase-3 and anti-LC3 antibodies at a dilution of 1:5000. Afterwards, the proteins were tagged by incubation with peroxidase-conjugated secondary antibody (Jackson, Newmarket, UK) at 1:10,000 in blocking buffer for 1 h at room temperature. Using Horse Radish Peroxidase (HRP) as the substrate (Immobilon Western, Millipore Co, USA), specific labeling was detected by chemiluminescence. Amersham Bios-ciences Hyperfilm(Amersham Biosciences, UK) was ex-posed to the membranes to detect chemiluminescence.2.9. DNA fragmentation by electrophoresisThe presence of a ladder pattern of DNA degradation during the apoptotic process of cell death was evaluated by electrophoresis of ovarian DNA, which was obtained from the rats’ ovaries using DNAzol (Invitrogen; Carlsbad, CA), following the manufacturer’s instructions. DNA electro-phoresis was carried out in a 2% agarose gel and visualized by ethidium bromide. 2.10. mRNA by reverse transcriptase-polymerase chainreaction (RT–PCR)Total RNA from the rats’ ovaries was prepared using Trizol (Invitrogen; Carlsbad, CA), following the manufac-turer’s instructions. RT–PCR analysis was performed in a Mastercycler gradient (Eppendorf, Germany). For cDNA synthesis, OligodT (Applied Biosystem) was used as a primer following the condition for Transcriptor Reverse Transcriptase (Roche; Mannheim, Germany). The PCR contained 1X Taq polymerase buffer, 0.2 µM each of dNTPs, 0.5 ml of Taq Polymerase (Roche Applied Science; New Jersey), and 20 mM of the following primers: Cas-pase-3 Fwd GCCTGTCCTGGATAAGACCA, Rev TTGACTCAGAAGCCGAAGGT; LC3 Fwd TGGCCCTGAAATACGAAGTC, Rev GGCAG-TAGTCGCCTCTGAAG; β-Actin Fwd GTATGCCTCTGGTCGTACCA, and Rev CTTCTGCATCCTGTCAGCAA, as reported previously (6). The conditions for PCR were as follows: 2 min of initial denaturation at 94°C for 32 cycles (94°C for 45 s, 61°C for 45 s, 72°C for 45 s). In the case of β-actin, an annealing temperature of 60°C was used. Amplified PCR products were resolved in 1% agarose gel electrophoresis. Negative controls were provided by omitting reverse tran-scriptase from the cDNA synthesis reaction.2.11. Quantitative analysesThe estimations were conducted by taking into account all the atretic follicles in 384 sections examined. The total of granulosas cells were counted per each follicle. The intensity of label to Beclin-1 and LC3 immunodetections was measured using the Image Processing and Analysis Java (ImageJ) program[17],from 1200 granulosa cells of different atretic follicles. The background of the slide was evaluated with ImageJ program tools. For comparison of intensity of fluoresce between the normal and altered auto-phagy process, one way ANOVA was conducted with a P<0.05.3. ResultsTo define the morphological characteristics of the atretic follicles in rat ovaries, we made an examination by a light and electron microscope of ovary sections.The initial features of the process of cell death in granu-losa cells include the contraction of cell volume and the separation among them with the loss of most cell-to-cell contacts. As contraction progresses, the remaining cell contacts take place between prolongations of neighboring follicular cells that cross a large intercellular space. A greatly reduced number of prolongations of the follicular cells penetrate the pellucida to make contact with the cell membrane of the oocyte. In the figure1b, an arrow points to one of these remaining prolongations. Numerous granulosa cells contain clear cytoplasmic vacuoles, indicating the12 EscobarML et al.: Involvement of Pro-Apoptotic and Pro-Autophagic Proteins in Granulosa Cell Deathonset of an autophagic process of cell death (Fig.1b). In the normal follicles the granulosa cells are bonded together as is shown in the Fig. 1a.Figure 1. Growing follicles. (a) Is showing a normal follicle. (b) Follicle in process of atresia showing ample abnormal spaces between deformed granulosa cells. Clear vacuoles are frequent in the cytoplasm of these cells. The relationships between granulosa cells and the oocyte are almost completely lost, except for a few prolongations of the former, one of which is indicated by the arrow.Oo-oocyte; gc-granulosa cell; zp-zonapellucida. Scale bar 2 microns.Figure 2. Primordial follicles.a) Non atretic follicle. The granulosa cells are in contact one another and maintain the relationship with the oocyte (empty arrow). The cytoplasm of the oocyte has few autophagosomes, considered as physiological autophagy. (b) The cytoplasm of the oocyte is extensively vacuolated and it is contracted, indicating that it is undergoing a process of autophagic death(empty arrow). However, the granulosa cells are almost normal except for a few clear vacuoles. The arrows point to autophagic vacuoles containing residues of organelles.Oo-oocyte; gc-granulosa cell. Scale bar 2 microns.Figure 3. Light microscopic images of antral follicles. (a) and (b) are showing healthy follicles. (c) Antral follicle in an advanced stage of atresia. The cavity of the follicle contains granulosacells in an advanced process of cell death. The rectangle indicates the area enlarged in figure d. In (d) the arrows point to cells with dark, compacted nuclei and clear cytoplasmic vacuoles. Arrowheads point to severely altered cells in the last stages of the apoptotic process of cell death. gc-granulosa cells. Scale bars 50 microns.The atresia of primordial follicles is characterized by morphologically normal granulosa cells and important autophagic alterations of the oocyte in the form of clear vesicles, some of which contain cytoplasmic debris (Fig.2b). These features suggest that the process of atresia is triggered in these follicles by alterations of the oocyte, which are not present in a normal follicle (Fig.2a).In healthy follicles, the granulosa cells are attached be-tween them, the oocyte is rounded (Figs. 3a and 3b), and there are no altered cells in the antral cavity. In antral fol-licles undergoing atresia the granulosa cells suffer processes of cell death that are typical of either apoptosis or autophagy (Fig. 3). Their nuclei have abundant compact chromatin and their cytoplasm is frequently vesiculated (Fig. 3d). Cells in the final stages of the death process lose contacts with other granulosa cells and undergo fragmenta-tion of the cytoplasm through budding; however there is no apparent destruction of the cell membrane. Both nuclei without cytoplasm and portions of cytoplasm without nuc-lei can be found in the antral cavity (Fig.3d).The ultrastructural evaluation of granulosa cells in atretic follicles evidenced several alterations, including the clas-sical apoptotic morphology (Fig.4a); elevated amount of autophagic vacuoles in the cytoplasm. However, their nuc-lei are notapparentlyhighly altered (Fig.4b). High magnifi-cation of the autophagic cell cytoplasm allowsappreciating vesicles with cytoplasmic content in different degree of degradation (Fig.4c). A third type of ultrastructuralaltera-tions was evidenced in cells with simultaneous characteris-tics of apoptosis and autophagy, since they have highly compact chromatin corresponding to apoptosis cell death and anumerous autophagic vesicles (Fig.4d). Our ultra-structural observations indicate that the granulosa cells of atreticfollicles are dying with morphological characteristics corresponding to apoptosis, autophagy and with simultane-ous characteristics of both cell death processes.Figure 4. Electron microscopy views of altered granulosa cells. Classical apoptotic characteristics as compact chromatin are present (a). Numerous vesicles are present in several granulosa cells (b). High magnification of the cytoplasm shows the autophagic vesicles (c). Some granulosa cells with ultrastructural characteristics of apoptosis and autophagy (d). cc-compact chromatin; C-cytoplasm; N-nucleus; av-autophagic vesicle.Scale bars 2 microns.Cell Biology 2013, 1(1):9-17 13Figure 5.Granulosa cells of follicles during the process of atresia. (a) Normal granulosacellswith normal endoplasmic reticulumas can be seen in high magnification in a’. In some granulosa cells the lumen of the nuclear envelope and the cisterns of the endoplasmic reticulum are ex-tremely swollen (b, b’, c and c’). Other neighboring follicular cells appear to be almost normal. Arrows point the endoplasmic reticulum. N-nucleus. Scale bars 2 microns.Some altered cells showed swelling of the lumen of the nuclear envelope and of the cisterns of the endoplasmic reticulum. These cells co-exist with normal granulosa cells and other follicular cells that are undergoing distinct processes of cell death (Figs.5b and 5c). These alterations are not present in the normal cells (Fig.5a).To corroborate our structural and ultrastructural observa-tions we immunodetected specific proteins of apoptosis and autophagy cell death in the same cell. To identify autopha-gy we have immunodetectedBeclin-1 and LC3 proteins. We used the active-caspase-3 immunolocalization, and TUNEL technique to evaluate the apoptosis.Taken in account that the autophagy is a physiological process, the basal autophagic process was discriminated from autophagic cell death, measuring the fluorescence intensity corresponding to the Beclin-1 and LC3 immuno-detections (graphs 1a and 1b). Statistical analyses showed that the fluorescence signals between the two groups were significantly different.Graph 1Quantitation of fluorescence. (a) Beclin-1immunodetection. (b) LC3 immunodetection. The intensity of labeling in the altered granulosa cells was significantly different from that in the normal ones. Standard error is represented in each bar. a and b are significantly different (P<0.05, ANOVA; n=1200). Figure 6. Light microscopic images of atretic follicles. (a) Antralfollicle. The phase contrast image shows thegeneral morphology of the follicle. The granulosa cells are detached from their neighbors. The dotted square region is the zone shown at a higher magnification. DAPI is evidencing the chromatin disposition. Some cells are positive to active caspase-3 (in green). Some of these cells are also positive to Beclin-1 (in red, empty arrow). Active caspase-3 and Beclin-1 are simultaneously present in few granulosa cells (arrow heads), as the merging of the images reveals. (b) Atretic follicle with antrum as the negative control to active caspase-3 and Beclin-1 immunodetections. Scale bars 20 microns.Figure7.Phase contrast image showing the morphology of granulosa cells in a large antral follicle in an advanced process of atresia (a), the dotted square is the zone shown at high magnification. Some cellular shapes evidenced by the phase contrast are delineated by dotted lines (b). The arrow heads point to granulosa cells that are positive only for the auto-phagic marker LC3 (c). Some contracted cells that are positive only for the apoptotic marker TUNEL (arrows in d). The empty arrow points to one cell positive for autophagic and apoptotic markers; LC3 (green) and TUNEL (red) respectively (e). Scale bars (a) 100 microns; all the others 10 microns.Two simultaneous light microscope immunolocalizations of active caspase-3 and Beclin-1, as LC-3 and TUNEL technique were carried out to localizeapoptosis and auto-phagy in the same cells. The results reveal that some-granulosa cells of follicles in the process of atresia are simultaneously positive for both markers. Figure6 shows the presence of active caspase-3 (apoptosis) and Beclin-1 (autophagy) in a section of anantral follicle. Some cells are only positive to active caspase-3 or to Beclin-1, and simul-taneous positive cells were found to a lesser extent(high14 EscobarML et al.: Involvement of Pro-Apoptotic and Pro-Autophagic Proteins in Granulosa Cell Death magnifications Fig.6). Simultaneous LC3 and TUNELdetection showed that some cells are positive to the auto-phagic marker LC3 (Fig. 7c); other cells are positive to theTUNEL technique (Fig.7d), and few of them are positive toboth markers (Fig.7e). These findings indicate that proteinsof both processes of cell death are already present in fol-licles when the process of cell deathis carried out.Markers of apoptosis and autophagy are not alwayspresent to the same extent in all granulosa cells. Most ofthose cells are positive to markers of apoptosisor autophagy,and few are double positive to both apoptosis and autopha-gy (table 1).Table 1. Percentage of granulosa cells positive to the different proteins toidentify apoptosis and autophagy processes; n=11,188.label% posi-tivegranulosacellslabel% posi-tivegranulosacellsActive Caspase-3 67.29 TUNEL 8.54 Beclin-1 0.61 LC3 35.99 Act Casp-3+Beclin-1 32.08 TUNEL+LC3 4.30Figure 8.Annexin-V assay in granulosa cells.The phase contrast image shows the general morphology. The granulosa cells positive to the Annex-in-V incorporation (arrows) and negative to propidium iodide were apop-totic cells; the cells positive to both markers were considered as necrotic (arrow head). There were cells negative to both marks, considered as healthy. Scale bar 20 microns.The tendency and variation of the percentage of the markers to apoptosis and autophagy cell death were similar in each individual analyzed.The apoptosiswas evaluated in isolated cells by means of the Annexin-V labeled with FITC incorporation, which binds to the phosphatidylserine located on the external side of the cell membrane of the isolated cells. Supra-vital pro-pidium iodide labeling was used to identify dying cells with damaged cell membrane. Our results showed that the gra-nulosa cells are positive to the Annexin-V incorporation (Fig. 8), evidencing the apoptosis process.After analyzing these ultrastructural and immunohisto-chemical characteristics, we evaluated the molecular and biochemical properties of granulosa cell populations. The mRNA corresponding to the pro-apoptotic caspase-3 and pro-autophagic LC3 genes was evaluated via the RT-PCR technique. Results indicate the expression of both genes in the same granulosa cell population (Fig. 9a).The mature, functional stage of the proteins correspond-ing to the mRNA of LC3 and caspase-3 was evaluated with Western Blot. The level of autophagy was assessed by detecting the conversion of LC3-I to LC3-II, which corre-lates with the amount of autophagosomes in follicular cells. To investigate the participation of apoptosis, we assessed the presence of active caspase-3 in the granulosa cells. Results suggest that the active form of caspase-3 is present in follicular cells (Fig. 9a).Figure 9.(a) RT-PCR to identify mRNA from caspase-3 (1), LC3 (2) and β-actin (3). The negative (-) control was developed by omitting the reverse transcriptase from the cDNA synthesis reaction. (b) Western Blot for LC3, active caspase-3 and GADPH proteins. Lysates from granulosa cell populations indicate the protein bands that correspond to the two LC3 forms. Bands are detected at 18 and 16 kDa and correspond to mem-brane-bound LC3-I and LC3-II, respectively. Active caspase-3 is detected at 17 kDa. GADPH protein is detected at 16 kDa.(c) Agarose gel electro-phoresis of DNA extracted from granulosa cells, showing apoptotic DNA fragmentation in this cellular population.Finally, we evaluated the fragmented DNA using aga-rose gel electrophoresis, which showed the typical DNA ladder pattern of apoptosis in the granulosa cell population (Fig. 9c).4. DiscussionApoptosis and autophagy are two programmed cell death events involved in tissue homeostasis and development. In follicular atresia, cell death plays an important role in maintaining normal follicular maturation. Studies of folli-cular atresia in several species have shown that granulosa cells display typical traits of apoptosis, such as nuclei with chromatin margination, pyknotic nuclei, fragmented DNA, and apoptotic bodies[reviewed in 18]. Apoptotic cell death was found to occur simultaneously with mitosis within the same follicle; a result consistent with the notion that atresia is determined by a dynamic equilibrium between cell divi-sion and cell death [19].Conventionally, the death of granu-losa cells in mammalian ovaries during the process of folli-cular atresia was thought to be apoptotic in nature; however, morphological characteristics of other forms of cell death have been seen in birds [20].Observations from the present study demonstrate that granulosa cells from mammalian ovaries die through a variety of processes; i.e., both pro-grammed cell death processes apoptosis and autophagy.。