Agilent 噪声系数测量手册
- 格式:pdf
- 大小:2.71 MB
- 文档页数:38
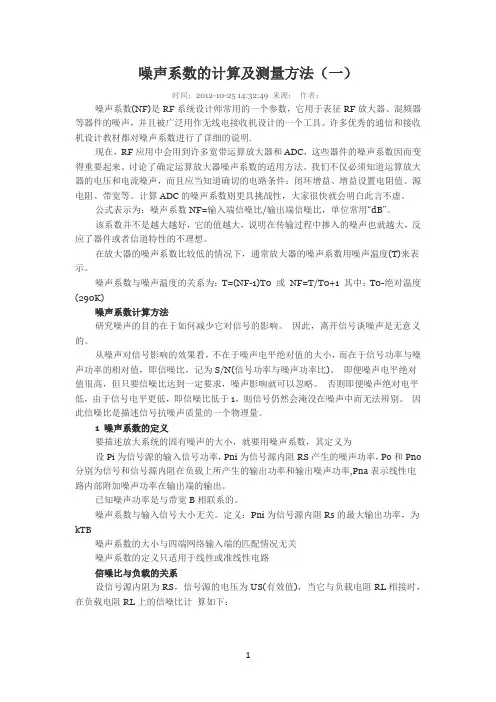
噪声系数的计算及测量方法(一)时间:2012-10-25 14:32:49 来源:作者:噪声系数(NF)是RF系统设计师常用的一个参数,它用于表征RF放大器、混频器等器件的噪声,并且被广泛用作无线电接收机设计的一个工具。
许多优秀的通信和接收机设计教材都对噪声系数进行了详细的说明.现在,RF应用中会用到许多宽带运算放大器和ADC,这些器件的噪声系数因而变得重要起来。
讨论了确定运算放大器噪声系数的适用方法。
我们不仅必须知道运算放大器的电压和电流噪声,而且应当知道确切的电路条件:闭环增益、增益设置电阻值、源电阻、带宽等。
计算ADC的噪声系数则更具挑战性,大家很快就会明白此言不虚。
公式表示为:噪声系数NF=输入端信噪比/输出端信噪比,单位常用“dB”。
该系数并不是越大越好,它的值越大,说明在传输过程中掺入的噪声也就越大,反应了器件或者信道特性的不理想。
在放大器的噪声系数比较低的情况下,通常放大器的噪声系数用噪声温度(T)来表示。
噪声系数与噪声温度的关系为:T=(NF-1)T0 或NF=T/T0+1 其中:T0-绝对温度(290K)噪声系数计算方法研究噪声的目的在于如何减少它对信号的影响。
因此,离开信号谈噪声是无意义的。
从噪声对信号影响的效果看,不在于噪声电平绝对值的大小,而在于信号功率与噪声功率的相对值,即信噪比,记为S/N(信号功率与噪声功率比)。
即便噪声电平绝对值很高,但只要信噪比达到一定要求,噪声影响就可以忽略。
否则即便噪声绝对电平低,由于信号电平更低,即信噪比低于1,则信号仍然会淹没在噪声中而无法辨别。
因此信噪比是描述信号抗噪声质量的一个物理量。
1 噪声系数的定义要描述放大系统的固有噪声的大小,就要用噪声系数,其定义为设Pi为信号源的输入信号功率,Pni为信号源内阻RS产生的噪声功率,Po和Pno 分别为信号和信号源内阻在负载上所产生的输出功率和输出噪声功率,Pna表示线性电路内部附加噪声功率在输出端的输出。


安捷伦公司N8973噪声指数分析仪使用说明二○○三年四月目录1. 噪声系数基本概念.............................................................................................. 错误!未定义书签。
2. 主要功能:.......................................................................................................... 错误!未定义书签。
2.1噪声系数测量 .............................................................................................. 错误!未定义书签。
2.2GPIB端口可允许SCPI编程。
.................................................................. 错误!未定义书签。
2.317CM彩色LED显示。
............................................................................... 错误!未定义书签。
2.4测量结果可用图形、表格或仪表模式显示。
........................................... 错误!未定义书签。
2.5双迹显示可同时显示下列任何两个噪声参数:....................................... 错误!未定义书签。
2.6单边带和双边带测量。
.............................................................................. 错误!未定义书签。


The ESA family of spectrum analyzers have proven and guaranteed performance with the flexibility to select the right level of functionality for your test needs. Take advantage of the best overall perfor-mance on a mid-performance spectrum analyzer.Industry best typical performance•Warm up time: 5 minutes•Third order intermodulation distortion: +16 dBm •Sensitivity: -166 dBm•Amplitude accuracy: ±0.4 dB•Overall phase noise (all carrier frequencies a ): •-101 dBc/Hz (10 kHz)•-122 dBc/Hz (100 kHz)•-136 dBc/Hz (1 MHz)AgilentESA Series Spectrum AnalyzersData SheetExpress analyzer configurations•Basic AnalyzerExpress Option BAS •Standard Analyzer Express Option STD•Communications Test AnalyzerExpress Option COMDefinitions and ConditionsThe distinction between specifications and characteristics is described as follows.•Specifications describe the performance of parameters covered by the product warranty.(The temperature range is 0 °C to 55 °C, unlessotherwise noted.)•Characteristics describe product performance that is useful in the application of the product, but isnot covered by the product warranty.•Typical performance describes additional product performance information that is not covered by the product warranty. It is performance beyondspecification that 80% of the units exhibit witha 95% confidence level over the temperature range20 to 30 °C. Typical performance does not includemeasurement uncertainty.•Nominal values indicate the expected performance, or describe product performance that is useful in the application of the product, but is not covered by the product warranty.•N/A (not applicable) - Not specified for this configurationThe following conditions must be met for the analyzer to meet its specifications.•The analyzer is within the one year calibration cycle.•If Auto Align All is selected:•After 2 hours of storage within the operating temperature range.• 5 minutes after the analyzer is turned on with sweep times less than 4 seconds.•If Auto Align Off is selected:•When the analyzer is at a constant temperature, within the operating temperature range, for aminimum of 90 minutes.•After the analyzer is turned on for a minimum of 90 minutes and Align Now All has been run.•When Align Now All is run:•Every hour•If the ambient temperature changes more than 3 °C•If the 10 MHz reference changes•If Auto Align All but RF is selected:•When the analyzer is at a constant temperature, within the operating temperature range, for aminimum of 90 minutes.•After the analyzer is turned on for a minimum of 90 minutes and Align Now RF has been run.•When Align Now RF is run:•Every hour•If the ambient temperature changes more than 3 °C Table of ContentsDefinitions and Conditions2 Frequency Specifications3 Amplitude Specifications7 Tracking Generator Specifications12 Quasi-Peak Detector Specifications13 General Specifications14 Option Ordering1623E4411B Frequency range E4403B E4408B BAS configuration 9 kHz - 1.5 GHz 9 kHz - 3 GHz9 kHz - 26.5 GHzCustom configurationN/AN/A(75 Ω input Option 1DP)1 MHz - 1.5 GHzE4402B E4404B E4405B E4407B STD or COM configuration9 kHz - 3 GHz 9 kHz – 6.7 GHz9 kHz – 13.2 GHz9 kHz - 26.5 GHz Custom configurationLow frequency extension Option UKB 100 Hz a - 3 GHz100Hz a - 6.7 GHz 100Hz a - 13.2 GHz100Hz a - 26.5 GHz External mixing Option AYZAdd 18 GHz - 325 GHzFrequency range Frequency range 100 Hz - 3 GHz2.85 - 6.7 GHz6.2 - 13.2 GHz12.8 – 19.2 GHz18.7 – 26.5 GHzBand 01234Harmonic (N b ) mixing mode1-1-2-4-4-gStandard analyzerCommunications test analyzer or ESA withOption 1D5±2 x 10⁻⁶/year ±1 x 10⁻⁷/year (Opt. 1D5)±5 x 10⁻⁶/year±1 x 10–8/year b (Opt. 1D5)±5 x 10⁻⁷/year±1 x 10–8/year (Opt. 1D5)[0.5 % + 1/ (sweep points –1) ] x span [0.5 % + 1/ (sweep points –1) ] x span10 MHz1 - 30 MHzLogarithmic scaleN/ARange = 0 Hz (zero span), 100 Hz to maximum frequency range of the analyzer AccuracyLinear scale 1% of span ±[0.5% x span + 2 x span/(sweep points – 1)]2% of span, nominalMarker frequency counter dAccuracy = ±(marker frequency x frequency reference error + counter resolution)Counter resolution = selectable from 1 Hz to 100 kHz Frequency spanSpan coefficient (SP)c 0.75 % x spanExternal reference10 MHzTemperature stability ±5 x 10⁻⁶/year±1 x 10–8/year bSettability ±5 x 10⁻⁷/year±1 x 10–8/yearFrequency readout accuracy (start, stop, center, marker)= ±(frequency indication x frequency reference error + SP c +15% of RBW + 10 Hz + 1 Hz x N a )Aging rate ±2 x 10⁻⁶/year±1 x 10–7/yearBasic analyzer Frequency referenceFrequency reference error = ± [(aging rate x time since last adjustment )+ settability + temperature stability]5Standard analyzer Communications test analyzer or ESA with Option AYXor ESA with Option B7D/B7ESpan = 0 Hz 4 ms – 4000 s 50 ns a – 4000 s25 ns a - 4000 sSpan ≥ 100 Hz4 ms – 4000 sRF burst (B7E)Span = 0 Hz 401Span ≥ 100 Hz401Delayed trigger range 1 us to 400 s Sweep (trace) points Range2 - 8192101 - 8192Accuracy (Span = 0 Hz)± 1%Trigger type bFree Run, Single, Line, Video, Offset, Delayed, ExternalGate (1D6)Basic analyzerSweep time and trigger Range1 ms– 4000 sN/AN/ACommunications test analyzer or ESA with Option 1DR and 1D5(-3 dB)1 kHz – 5 MHz d 1 kHz – 5 MHz d 1 Hz to 5 MHz d (-6 dB EMI)9 KHz, 120 kHz 9 KHz, 120 kHz 200 Hz, 9 kHz,120 kHz With 1DR c (-3dB)Add 100 Hz, 300 Hz Add 10 Hz - 300 Hz(-6 dB EMI)Add 200 Hz Add 200 Hz With 1DR and 1D5e N/A Add 1 Hz and 3 Hz Included 1 Hz to 300 Hz 1 kHz to 3 MHz5 MHz100 Hz to 300 Hz1 kHz to 5 MHz Rangewith 1DR < 15:1 synchronously tuned four poles, approximately Gaussian Video bandwidths (1-3-10 sequence)30 Hz to 3 MHz Adds 1, 3, 10 Hz for RBWs less than 1 kHz± 15%± 30%Selectivity (60 dB/3 dB bandwidth ratio)< 5:1 digital, approximately Gaussian RangeIncludedAccuracy ± 10%Basic analyzer Standard analyzerResolution bandwidths (1-3-10 sequence)6ESA-EE4411BE4403B/08Bwith Option 120aOffset from CW signal≥ 1 kHz ≥ 10 kHz -93, -95 dBc/Hz-98, -101 dBc/Hz (Option 1D5)d -100, -105 dBc/Hz -104, -107 dBc/Hz-106, -112 dBc/Hz-110, -113 dBc/Hz -118, -122 dBc/Hz-118, -122 dBc/Hz -125, -127 dBc/Hz -127, -129 dBc/Hz-131, -136 dBc/Hz -133, -136 dBc/Hz -135, -139 dBc/Hz -137, -141 dBc/Hz-100, -102 dBc/Hz -104, -106 dBc/Hz -113, -116 dBc/Hz -90, -94 dBc/Hz ≥ 20 kHz≥ 30 kHz ≥ 100 kHz ≥ 1 MHz ≥ 5 MHz ≥ 10 MHz Residual FM (peak-to-peak)StabilityNoise sidebands offset from CW signal with 1 kHz RBW, 30 Hz VBW and sample detector Spec and typical dBc/Hz applies to all frequencies ≤ 6.7 GHz b, cItalics indicate typical performance-78 dBc/Hz (Option 1D5 and 1DR)Basic analyzerStandard and communications test analyzerE4402B/04B/05B/07BN/A N/A N/A N/A N/AN/A N/A N/A N/A N/AN/AN/A N/AN/A N/A N/AOption 1D5 only 100 msOption 1DR only 20 msOption 1DR & 1D520 ms≥ 30 kHz offset from carrier CW signalSystem related sidebands ≤ -65 dBc + 20logN c≤ 10 Hz x N c ≤ 2 Hz peak-to-peak x N c≤ 150 Hz x N c (100 ms)≤ 10 Hz x N c (20 ms), Option 1DR≤ 2 Hz peak-to-peak x N c , (20 ms), Option 1DR & 1D5≤ 100 Hz x N c 1 kHz RBW, 1 kHz VBW (measurement time)≤ 150 Hz x N c (100 ms)≤ 30 Hz x N c (20 ms), Option 1DRFigure 1. Typical ESA-E Series performance at 1 GHzTypical performance @ 1 GHz (Standard)Typical performance @ 1 GHz (Option 120)Spec (Standard)Spec (Option 120)Spec (Option 1DR)7Amplitude Specifications9Amplitude SpecificationsAmplitude SpecificationsFigure 2. Specified dynamic range for E4407B spectrum analyzerTracking Generator SpecificationsTracking generator Specifications (Options 1DN and 1DQ)Frequency rangeE4411BOption 1DN, (50 Ω) 9 kHz to 1.5 GHzOption 1DQ, (75 Ω) 1 MHz to 1.5 GHzE4402B/03B/04B/05B/07B/08BOption 1DN, (50 Ω) 9 kHz to 3.0 GHzRBW range 1 kHz to 5 MHzOutput power level rangeE4411BOption 1DN 0 to –70 dBmOption 1DQ +42.75 to –27.25 dBmVE4402B/03B/04B/05B/07B/08BOption 1DN –2 to –66 dBmOutput vernier rangeE4411B 10 dBE4402B/03B/04B/05B/07B/08B 8 dBOutput attenuator rangeE4411B 0 to 60 dB, 10 dB stepsE4402B/03B/04B/05B/07B/08B 0 to 56 dB, 8 dB stepsOutput flatnessE4411BOption 1DN, (50 W)9 kHz to 10 MHz ±2.0 dB10 MHz to 1.5 GHz ±1.5 dBOption 1DQ, (75 W)1 MHz to 10 MHz ±2.5 dB10 MHz to 1.5 GHz ±2.0 dBE4402B/03B/04B/05B/07B/08B9 kHz to 10 MHz ±3.0 dB10 MHz to 3.0 GHz ±2.0 dBEffective source match (characteristic)E4411B < 2.5:1E4402B/03B/04B/05B/07B/08B < 2.0:1 (0 dB attenuator)< 1.5:1 (8 dB attenuator)Spurious outputHarmonic spursE4411B(0 dBm output)9 kHz to 20 MHz < –20 dBc20 MHz to 1.5 GHz < –25 dBcE4402B/03B/04B/05B/07B/08B(–1 dBm output)20 kHz to 3 GHz < –25 dBcNon-Harmonic spursE4411B < –35 dBcE4402B/03B/04B/05B/07B/08B9 kHz to 2 GHz < –27 dBc2 GHz to3 GHz < –23 dBcDynamic rangeMaximum output power – displayed average noise levelOutput power sweep rangeE4411BOption 1DN (–15 dBm to 0 dBm) – (source attenuator setting)Option 1DQ (+27.75 dBmV to +42.75 dBmV) –(source attenuator setting) E4402B/03B/04B/05B/07B/08BOption 1DN (–10 dBm to –2 dBm) – (source attenuator setting)121415Inputs/outputsFront panel Input 50 Ω type N (f); 75 Ω BNC (f) (Option 1DP); 50 Ω APC 3.5 (m) (Option BAB) RF out50 Ω type N (f); 75 Ω BNC (f) (Option 1DQ)Probe power + 15 Vdc, -12.6 Vdc at 150 mA maximum (characteristic)External keyboard 6-pin mini-DIN, PC keyboards (for entering screen titles and file names) Headphone Front panel knob controls volume Power output0.2 W into 4 Ω (characteristic) AMPT REF out50 Ω BNC (f) (nominal) IF INPUT (Option AYZ)50 Ω SMA (f) (nominal) LO OUTPUT (Option AYZ)50 Ω SMA (f) (nominal)Rear panel10 MHz REF OUT 50 Ω BNC (f), > 0 dBm (characteristic)10 MHz REF IN50 Ω BNC (f), -15 to +10 dBm (characteristic) GATE TRIG/EXT TRIG IN BNC (f), 5 V TTL GATE /HI SWP OUT BNC (f), 5 V TTLVGA OUTPUTVGA compatible monitor, 15-pin mini D-SUB, (31.5 kHz horizontal, 60 Hz vertical sync rates, non-interlaced analog RGB 640 x 480)IF, sweep and video ports (Option A4J or AYX)AUX IF OUT BNC (f), 21.4 MHz, nominal -10 to -70 dBm (uncorrected) AUX VIDEO OUT BNC (f), 0 to 1V, characteristic (uncorrected) HI SWP IN BNC (f), low stops sweep, (5 V TTL) HI SWP OUT BNC (f), (5 V TTL) SWP OUT BNC (f), 0 to +10 V ramp GPIB interface (Option A4H)IEEE-488 bus connector Serial interface (Option 1AX)RS-232, 9-pin D-SUB (m)Parallel interface (Option A4H or 1AX)25-pin D-SUB (f) printer port only Dimensions and weight for the ESA family of analyzers. Width to outside of instrument handle 416 mm (16.4 in.) Width to outside of the shipping cover 373 mm (14.7 in.) Overall height222 mm (8.75 in.) Depth from front frame to rear frame409 mm (16.1 in.) Depth with instrument handle rotated horizontal 516 mm (20.3 in.)E4401B/11BInstrument Weight 13.2 kg (29.1 lbs.) Shipping Weight 25.1 kg (55.4 lbs.) E4402B/E4403B Instrument Weight 15.5 kg (34.2 lbs.) Shipping Weight 27.4 kg (60.4 lbs.) E4404B/E4405B Instrument Weight 17.1 kg (37.7 lbs.) Shipping Weight 31.9 kg (70.3 lbs.) E4407B/08BInstrument Weight 17.1 kg (37.7 lbs.) Shipping Weight 31.9 kg (70.3 lbs.)I/O connectivity software IO Libraries Suite (www. /find/iosuite/data-sheet)General Specifications (continued)Option OrderingFor information on ordering options, please refer to the ESA/EMC Spectrum Analyzer Configuration Guide , literature number 5968-3412E.More InformationFor the latest information on the Agilent ESA-E Series see our Web page at:/find/esaAgilent Technologies’ Test and Measurement Support, Services, and Assistance Agilent T echnologies aims to maximize the value you receive, while minimizing your risk and problems. We strive to ensure that you get the test and measurement capabilities you paid for and obtain the support you need. Our extensive support resources and services can help you choose the right Agilent products for your applications and apply them successfully. Every instrument and system we sell has a global warranty. T wo concepts underlie Agilent’s overall support policy: “Our Promise” and “Your Advantage.”Our PromiseOur Promise means your Agilent test and measurement equipment will meet its advertised performance and functionality. When you are choosing new equipment, we will help you with product information, including realistic perfor-mance specifications and practical recommendations from experienced test engi-neers. When you receive your new Agilent equipment, we can help verify that it works properly and help with initial product operation.Your AdvantageYour Advantage means that Agilent offers a wide range of additional expert test and measurement services, which you can purchase according to your unique tech-nical and business needs. Solve problems efficiently and gain a competitive edge by contracting with us for calibration, extra-cost upgrades, out-of-warranty repairs,and onsite education and training, as well as design, system integration, project management, and other professional engineering services. Experienced Agilent engineers and technicians worldwide can help you maximize your productivity, opti-mize the return on investment of your Agilent instruments and systems, and obtain dependable measurement accuracy for the life of those products./find/openAgilent Open simplifies the process of connecting and programming test systems to help engineers design, validate and manufacture electronic products. Agilent offers open connectivity for a broad range of system-ready instruments, open industry software, PC-standard I/O and global support, which are combined to more easily integrate test system development.United States:Korea:(tel) 800 829 4444(tel) (080) 769 0800(fax) 800 829 4433(fax) (080)769 0900Canada:Latin America:(tel) 877 894 4414(tel) (305) 269 7500(fax) 800 746 4866Taiwan :China:(tel) 0800 047 866(tel) 800 810 0189(fax) 0800 286 331(fax) 800 820 2816Other Asia Pacific Europe:Countries:(tel) 31 20 547 2111(tel) (65) 6375 8100Japan:(fax) (65) 6755 0042(tel) (81) 426 56 7832Email:*****************(fax) (81) 426 56 7840Contacts revised: 05/27/05For more information on Agilent Technologies’ products, applications or services,please contact your local Agilent office. The complete list is available at:/find/contactusProduct specifications and descriptions in this document subject to change without notice.© Agilent Technologies, Inc. 2005, 2004Printed in USA, October 5, 20055968-3386E/find/emailupdatesGet the latest information on the products and applications you select.Agilent Email Updates/find/agilentdirectQuickly choose and use your test equipment solutions with confidence.Agilent DirectAgilent Open。

--
安捷伦有三种相位噪声(PN)测量方案。
1,直接频谱技术。
利用频谱分析仪进行相位噪声测量。
由于频谱分析仪的本身噪声大,因此测量范围以及测量精度低。
代表产品N9068A相位噪声测量软件。
参考价格:5290美元。
安捷伦多种频谱分析仪和信号分析仪都可用于相位噪声测量,但是测量精度及测量范围有区别。
2,相位检测技术。
直接对信号源的相位波动进行测量。
这种方法测量精度最高,测量范围大。
代表产品E5505A。
3,两通道交叉相关技术。
代表仪器为E5052B。
测量范围介于以上两种产品之间,价格也介于两种产品之间。
基本配制价格为:96593美元。
下图为安捷伦提供的各种仪器的相位噪声测量范围图表。
--。
安捷伦公司N8973噪声指数分析仪使用说明二○○三年四月目录1. 噪声系数基本概念.............................................................................................. 错误!未定义书签。
2. 主要功能:.......................................................................................................... 错误!未定义书签。
2.1噪声系数测量 .............................................................................................. 错误!未定义书签。
2.2GPIB端口可允许SCPI编程。
.................................................................. 错误!未定义书签。
2.317CM彩色LED显示。
............................................................................... 错误!未定义书签。
2.4测量结果可用图形、表格或仪表模式显示。
........................................... 错误!未定义书签。
2.5双迹显示可同时显示下列任何两个噪声参数:....................................... 错误!未定义书签。
2.6单边带和双边带测量。
.............................................................................. 错误!未定义书签。
Agilent6890N仪器检测限测定步骤有网友发e-mail询问Agilent6890N仪器检测限的测定方法,现作详细叙述,希望对刚操作此型号仪器的新手会有所帮助。
1、点击桌面上图标“instrument offline”2、从“method and run control“data analysis”“report layout”中点击“data analysis”选项3、点击菜单中“report选项,选择“system suitability”之“edit noise ranges”,并填写若干基线平稳时间段后点击“o k”4、再一次点击“report”选择“specify report”,在report style下拉菜单选择“performance+noise”选项,点击“ok”5、稀释分析物标准工作液浓度并进样,至报告中signal/noise比值为3时,可认为此时进样分析物标液之浓度为在当前仪器状态下的检测限。
其中“当前仪器状态”包含了以下因素:色谱条件、载气质量、柱类型柱规格及使用时间、衬管洁净度及惰性程度、石英棉填充量及洁净度与惰性程度、柱头污染程度等。
其中色谱条件包括(检测器以ECD为例):柱流量、进样口柱及检测器温度、尾吹气流量、进样模式、分流出口流量(此为间接影响因素,当衬管洁净度不够时此流量因影响衬管洁净度而影响基线信号值大小)[转帖]气相色谱分析测试常见问题及解决来自:(中国环保卫生研究协会室内空气成分测试中心)气相色谱分析测试常见问题及解决一、标定时有峰丢失可能的原因及应采用的排除方法1.注射器有毛病,用新注射器验证。
2.未接入检测器,或检测器不起作用,检查设定值3.进样温度太低,检查温度,并根据需要调整4.柱箱温度太低,检查温度,并根据需要调整5.无载气流,检查压力调节器,并检查泄漏,验证柱进品流速6.柱断裂,如果柱断裂是在柱进口端或检测器末端,是可以补救的,切去柱断裂部分,重新安装二、前沿峰1.柱超载,减少进样量2.两个化合物共洗脱,提高灵敏度和减少进样量,使温度降低10~20度,以使峰分开3.样品冷凝,检查进样口和柱温,如有必要可升温4.样品分解,采用失活化进样器衬管或调低进样器温度三、拖尾峰1.进样器衬套或柱吸附活性样品:更换衬套。
噪声系数的含义和测量方法噪声系数的含义噪声系数是用来描述一个系统中出现的过多的噪声量的品质因数。
把噪声系数降低到最小的程度可以减小噪声对系统造成的影响。
在日常生活中,我们可以看到噪声会降低电视画面的质量,也会使无线通信的话音质量变差;在诸如雷达等的军用设备中,噪声会限制系统的有效作用范围;在数字通信系统中,噪声则会增加系统的误码率。
电子设备的系统设计人员总是在尽最大努力使整个系统的信噪比(SNR)达到最优化的程度,为了达到这个目的,可以用把信号提高的办法,也可以用把噪声降低的办法。
在像雷达这样的发射接受系统中,提高信噪比的一种方法是用更大的大功率放大器来提高发射信号的功率,或使用大口径天线。
降低在发射机和接收机之间信号传输路径上对信号的衰耗也可以提高信噪比,但是信号在传输路径上的衰耗大都是由工作环境所决定的,系统设计人员控制不了这方面的因素。
还可以通过降低由接收机产生的噪声—通常这都是由接收机前端的低噪声放大器(LNA)的质量决定的—来提高信噪比。
与使用提高发射机功率的方法相比,降低接收机的噪声(以及让接受机的噪声系数的指标更好)的方法会更容易和便宜一些。
噪声系数的定义是很简单和直观的。
一个电子系统的噪声因子(F)的定义是系统输入信号的信噪比除以系统输出信号的信噪比:F=(Si/Ni)/(So/No)Si=输入信号的功率So=输出信号的功率Ni=输入噪声功率No=输出噪声功率把噪声因子用分贝(dB)来表示就是噪声系数(NF),NF=10*log(F)。
这个对噪声系数的定义对任何电子网络都是正确的,包括那些可以把在一个频率上的输入信号变换为另外一个频率的信号再输出的电子网络,例如上变频器或下变频器。
为了更好地理解噪声系数的定义,我们来看看放大器的例子。
放大器的输出信号的功率等于放大器输入信号的功率乘以放大器的增益,如果这个放大器是一个很理想的器件的话,其输出端口上噪声信号的功率也应该等于输入端口上噪声信号的功率乘以放大器的增益,结果是在放大器的输入端口和输出端口上信号的信噪比是相同的。
噪声系数测量手册Part 2. 噪声系数测量技巧安捷伦科技:顾宏亮1.选择正确的噪声系数测量方法现在我们知道,噪声系数测量主要可以通过三种方法,分别是Y系数测量方法,频谱仪直接测试法,网络分析仪冷态噪声源法,那下表主要描述在各个场合下适合于选择哪种测量方式。
2.噪声系数测量不确定度分析在Y系数法测量中,噪声系数测量结果的不确定度主要来源于噪声源以及测量仪器。
噪声源部分a. 超噪比ENR 的不确定度b. 噪声源的输出与被测件输入的失配仪器部分a.噪声系数测量不确定度b.增益测量不确定度c.仪表自身噪声系数d.仪表输入端失配Agilent在噪声系数测量不确定度分析上提供给免费的软件可以供用户使用。
具体地址如下所示/noisefigure/NFUcalc.html举例说明如下图所示3.校准完后噪声系数不等于零如果你使用过网络分析仪,那么当你做完直通校准后仪表的S21测量结果一定是0dB。
同样在噪声系数分析仪校准后,因为没有接入任何器件,理论上这个时候显示的噪声系数应该是0dB,增益为0dB。
但是事实上,经常看到校准完之后不为0.根据Y系数法测量的理论,仪表的测量结果如下述公式所示F meas = F DUT + (F NFA– 1)/G DUT当校准完后,没有接入任何器件,这个时候测量得到的F meas= F NFA,G DUT=1。
F NFA = F DUT + (F NFA– 1)/1F DUT = F NFA - (F NFA– 1)/1F DUT = 1 = 0dB现在假设增益测量的抖动为0.01dB,那么转换为线性值为10(0.01/10) =1.00231.同时假设仪表的噪声系数为10dB,转换为线性值为10(10/10) =10,这样计算式为如下所示:F DUT = 10 – (10 – 1)/1.00231=1.02074F DUT = 0.089 dB如果增益的抖动为0.05dB,,那么转换为线性值为10(0.05/10) =1.01158,这种情况下F DUT = 10 – (10 – 1)/ 1.01158=1.10303F DUT = 0.426 dB从上述的关系式可以看到,在校准完后未接入被测件时,只要增益的测量发生一点点变化。
ErrataTitle & Document Type: 3746A Selective Level Measuring Set Operating Manual Manual Part Number: 03746-90003Revision Date: January 1984About this ManualWe’ve added this manual to the Agilent website in an effort to help you support your product. This manual provides the best information we could find. It may be incompleteor contain dated information, and the scan quality may not be ideal. If we find a bettercopy in the future, we will add it to the Agilent website.HP References in this ManualThis manual may contain references to HP or Hewlett-Packard. Please note that Hewlett- Packard's former test and measurement, life sciences, and chemical analysisbusinesses are now part of Agilent Technologies. The HP XXXX referred to in this document is now the Agilent XXXX. For example, model number HP8648A is now model number Agilent 8648A. We have made no changes to this manual copy.Support for Your ProductAgilent no longer sells or supports this product. You will find any other availableproduct information on the Agilent Test & Measurement website:Search for the model number of this product, and the resulting product page will guideyou to any available information. Our service centers may be able to perform calibrationif no repair parts are needed, but no other support from Agilent is available.。
信噪比测定信噪比测定:点击tools/Signal to Noise check,回答相应提问(是否从打印机输出、用提取离子色谱或用总离子流图)后依照提示用鼠标右键分别拖划信号与噪音范围。
报告会自动生成如下:Signal to noise reportData Path : c:\MSDChem\1\data\Data File : evaldemo.dAcq On : 7 Sep 1989 13:59Operator : perkinsSample : demoscan sampleMisc : 10 ng per componentALS Vial : 1 Sample Multiplier: 1Integration File: events.eMethod : C:\MSDCHEM\1\METHODS\T.MTitle :Last Update :Signal Used: TICSignal region: 7.70 to 7.76 min; height: 3490043Noise region : 7.36 to 7.63 min; Max noise 14859.0, Min noise 9093.0Calculations ValueNoise Points used 34Average noise = (sum of noise)/points 11329.0Corrected Signal = height/Average noise 3478714.0Pk-pk noise = Max noise/Min noise 5766.0Pk-pk S/N = Corrected signal/Pk-pk noise 603.3RMS noise = SQRT(sum(square(noise-avg noise))/points) 1488.6RMS S/N = Corrected signal/RMS noise 2336.9其中:Noise Points used 噪音数据点数Average noise = (sum of noise)/points 平均噪音=噪音加合/噪音数据点数Corrected Signal = height/Average noise 校正信号=最高点信号-平均噪音Pk-pk noise = Max noise/Min noise PK-PK噪音=最大噪音-最小噪音Pk-pk S/N = Corrected signal/Pk-pk noise PK-PK S/N=校正信号/PK-PK噪音RMS noise = SQRT(sum(square(noise-avg noise))/points)RMS噪音=[∑(噪音-平均噪音)2/噪音数据点数]1/2 RMS S/N = Corrected signal/RMS noise RMS S/N=校正信号/ RMS噪音。