克鲁格曼国际经济学第八版上册课后答案
- 格式:doc
- 大小:94.50 KB
- 文档页数:19
克鲁格曼《国际经济学》第8版笔记和课后习题详解第19章宏观经济政策和浮动汇率制下的国际协调19.1复习笔记1.支持浮动汇率制的观点(1)货币政策自主性在布雷顿森林体系的固定汇率制度下,除美国以外的其他国家极少有机会运用货币政策来达到内部平衡和外部平衡。
由于要抵消资本流动的影响,货币政策的作用被弱化了。
但是,如果各国中央银行不再为固定汇率而被迫干预货币市场,各国政府就能够运用货币政策来达到内部平衡和外部平衡,并且各国不再会因为外部因素导致本国出现通货膨胀或通货紧缩。
浮动汇率制的提倡者认为,如果中央银行不必再承担稳定其币值的义务,那么它们将恢复对货币的控制。
货币贬值会降低本国产品的相对价格,从而使外国对本国产品的需求增加,进而减少本国的失业。
同样,在经济过热的国家中,中央银行可以通过压缩货币供给来抑制过热的经济活动,而不必担心过多的国际储备流入会破坏其稳定币值的努力。
通过加强对货币政策的控制,各国可以排除那些扭曲国际支付的障碍。
浮动汇率制的提倡者还认为,各国如果使用浮动汇率,就能够选择自己愿意接受的长期通货膨胀率,而不再会被动地引进国外的通货膨胀率。
支持浮动汇率最为有力的理论之一就是认为它能够通过汇率的自动调整来隔绝国外持续性通货膨胀带来的影响。
产生这种隔绝的机制是购买力平价。
(2)对称性浮动汇率制的支持者认为:浮动汇率制可以消除类似布雷顿森林体系所造成的不对称。
由于各国不再将本国货币钉住对美元的汇率,也就不必因此而持有美元作储备。
所以,各国都可以自主决定本国的货币状况。
同样,美国在运用货币政策或财政政策改变美元汇率时,不会再遇到特别的阻碍。
最后,在全球范围内,所有国家的汇率都将由市场而不是由政府决定。
(3)汇率自动稳定器功能与固定汇率相比,浮动汇率相对减少了需求冲击对就业的影响,从而有利于经济稳定。
当对本国产品和劳务的需求下降时,浮动汇率下的货币贬值,会使本国产品和劳务的价格下降,部分地减轻了这种需求下降的不利影响。
Chapter 5The Standard Trade ModelChapter OrganizationA Standard Model of a Trading EconomyProduction Possibilities and Relative SupplyRelative Prices and DemandThe Welfare Effect of Changes in the Terms of TradeDetermining Relative PricesEconomic Growth: A Shift of the RS CurveGrowth and the Production Possibility FrontierRelative Supply and the Terms of TradeInternational Effects of GrowthCase Study: Has the Growth of Newly Industrializing Countries Hurt Advanced Nations? International Transfers of Income: Shifting the RD CurveThe Transfer ProblemEffects of a Transfer on the Terms of TradePresumptions about the Terms of Trade Effects of TransfersCase Study: The Transfer Problem and the Asian CrisisTariffs and Export Subsidies: Simultaneous Shifts in RS and RDRelative Demand and Supply Effects of a TariffEffects of an Export SubsidyImplications of Terms of Trade Effects: Who Gains and Who Loses?SummaryAppendix: Representing International Equilibrium with Offer CurvesDeriving a Country’s Offer CurveInternational EquilibriumChapter 5 The Standard Trade Model 17Chapter OverviewPrevious chapters have highlighted specific sources of comparative advantage which give rise to international trade. This chapter presents a general model which admits previous models as special cases. This “standard trade model” is the workhorse of international trade theory and can be used to address a wide range of issues. Some of these issues, such as the welfare and distributional effects of economic growth, transfers between nations, and tariffs and subsidies on traded goods are considered in this chapter. The standard trade model is based upon four relationships. First, an economy will produce at the point where the production possibilities curve is tangent to the relative price line (called the isovalue line). Second, indifference curves describe the tastes of an economy, and the consumption point for that economy is found at the tangency of the budget line and the highest indifference curve. These two relationships yield the familiar general equilibrium trade diagram for a small economy (one which takes as given the terms of trade), where the consumption point and production point are the tangencies of the isovalue line with the highest indifference curve and the production possibilities frontier, respectively.You may want to work with this standard diagram to demonstrate a number of basic points. First, an autarkic economy must produce what it consumes, which determines the equilibrium price ratio; and second, opening an economy to trade shifts the price ratio line and unambiguously increases welfare. Third, an improvement in the terms of trade increases welfare in the economy. Fourth, it is straightforward to move from a small country analysis to a two country analysis by introducing a structure of world relative demand and supply curves which determine relative prices.These relationships can be used in conjunction with the Rybczynski and the Stolper-Samuelson Theorems from the previous chapter to address a range of issues. For example, you can consider whether the dramatic economic growth of countries like Japan and Korea has helped or hurt the United States as a whole, and also identify the classes of individuals within the United States who have been hurt by the particular growth biases of these countries. In teaching these points, it might be interesting and useful to relate them to current events. For example, you can lead a class discussion of the implications for the United States of the provision of forms of technical and economic assistance to the emerging economies around the world or the ways in which a world recession can lead to a fall in demand for U.S. export goods.The example provided in the text considers the popular arguments in the media that growth in Japan or Korea hurts the United States. The analysis presented in this chapter demonstrates that the bias of growth is important in determining welfare effects rather than the country in which growth occurs. The existence of biased growth, and the possibility of immiserizing growth is discussed. The Relative Supply (RS) and Relative Demand (RD) curves illustrate the effect of biased growth on the terms of trade. The new terms of trade line can be used with the general equilibrium analysis to find the welfare effects of growth. A general principle which emerges is that a country which experiences export-biased growth will have a deterioration in its terms of trade, while a country which experiences import-biased growth has an improvement in its terms of trade. A case study points out that growth in the rest of the world has made other countries more like the United States. This import-biased growth has worsened the terms of trade for the United States. The second issue addressed in the context of the standard trade model is the effect of international transfers. The salient point here is the direction, if any, in which the relative demand curve shifts in response to the redistribution of income from a transfer. A transfer worsens the donor’s ter ms of trade if it has a higher marginal propensity to consume its export good than the recipient. The presence of non-traded goods tends to reinforce the deterioration of terms of trade for the donor country. The case study attendant to this issue involves the deterioration of many Asian countries’ terms of trade due to the large capital withdrawals at the end of the 1990s.18 Krugman/Obstfeld •International Economics: Theory and Policy, Eighth EditionThe third area to which the standard trade model is applied are the effects of tariffs and export subsidies on welfare and terms of trade. The analysis proceeds by recognizing that tariffs or subsidies shift both the relative supply and relative demand curves. A tariff on imports improves the terms of trade, expressed in external prices, while a subsidy on exports worsens terms of trade. The size of the effect depends upon the size of the country in the world. Tariffs and subsidies also impose distortionary costs upon the economy. Thus, if a country is large enough, there may be an optimum, non-zero tariff. Export subsidies, however, only impose costs upon an economy. Intranationally, tariffs aid import-competing sectors and hurt export sectors while subsidies have the opposite effect. An appendix presents offer curve diagrams and explains this mode of analysis.Answers to Textbook Problems1.Note how welfare in both countries increases as the two countries move from productionpatterns governed by domestic prices (dashed line) to production patterns governed by worldprices (straight line).2.3. An increase in the terms of trade increases welfare when the PPF is right-angled. The production pointis the corner of the PPF. The consumption point is the tangency of the relative price line and the highest indifference curve. An improvement in the terms of trade rotates the relative price line about its intercept with the PPF rectangle (since there is no substitution of immobile factors, the production point stays fixed). The economy can then reach a higher indifference curve. Intuitively, although there is no supply response, the economy receives more for the exports it supplies and pays less for the imports it purchases.Chapter 5 The Standard Trade Model 19 4. The difference from the standard diagram is that the indifference curves are right angles rather thansmooth curves. Here, a terms of trade increase enables an economy to move to a higher indifference curve. The income expansion path for this economy is a ray from the origin. A terms of tradeimprovement moves the consumption point further out along the ray.5. The terms of trade of Japan, a manufactures (M) exporter and a raw materials (R) importer, is the worldrelative price of manufactures in terms of raw materials (p M/p R). The terms of trade change can be determined by the shifts in the world relative supply and demand (manufactures relative to raw materials) curves. Note that in the following answers, world relative supply (RS) and relative demand (RD) are always M relative to R. We consider all countries to be large, such that changes affect the world relative price.a. Oil supply disruption from the Middle East decreases the supply of raw materials, which increasesthe world relative supply. The world relative supply curve shifts out, decreasing the world relative price of manufactured goods and deteriorating Japan’s terms of t rade.b. Korea’s increased automobile production increases the supply of manufactures, which increasesthe world RS. The world relative supply curve shifts out, decreasing the world relative price ofmanufactured goods and deteriorating Japan’s terms of tr ade.c. U.S. development of a substitute for fossil fuel decreases the demand for raw materials. Thisincreases world RD, and the world relative demand curve shifts out, increasing the world relative price of manufactured goods and improving Japan’s terms of trade. This occurs even if no fusion reactors are installed in Japan since world demand for raw materials falls.d. A harvest failure in Russia decreases the supply of raw materials, which increases the world RS.The world relative supply curve shifts o ut. Also, Russia’s demand for manufactures decreases,which reduces world demand so that the world relative demand curve shifts in. These forcesdecrease the world relative price of manufactured goods and deteriorate Japan’s terms of trade.e. A reduction in Japan’s tariff on raw materials will raise its internal relative price of manufactures.This price change will increase Japan’s RS and decrease Japan’s RD, which increases the worldRS and decreases the world RD (i.e., world RS shifts out and world RD shifts in). The worldrelative price of manufactures declines and Japan’s terms of trade deteriorate.6. The declining price of services relative to manufactured goods shifts the isovalue line clockwise sothat relatively fewer services and more manufactured goods are produced in the United States, thus reducing U.S. welfare.20 Krugman/Obstfeld •International Economics: Theory and Policy, Eighth Edition7. These results acknowledge the biased growth which occurs when there is an increase in one factor ofproduction. An increase in the capital stock of either country favors production of Good X, while an increase in the labor supply favors production of Good Y. Also, recognize the Heckscher-Ohlin result that an economy will export that good which uses intensively the factor which that economy has in relative abundance. Country A exports Good X to Country B and imports Good Y from Country B.The possibility of immiserizing growth makes the welfare effects of a terms of trade improvement due to export-biased growth ambiguous. Import-biased growth unambiguously improves welfare for the growing country.a. A’s terms of trade worsen, A’s welfare may increase or, less likely, decrease, and B’s welfareincreases.b. A’s terms of trade improve, A’s welfare increases and B’s welfare decreases.c. B’s terms of trade improve, B’s welfare increases and A’s welfare decreases.d. B’s terms of trade worsen, B’s welfare may increase or, less likely, decrease, and A’s welfareincreases.8. Immiserizing growth occurs when the welfare deteriorating effects of a worsening in an economy’sterms of trade swamp the welfare improving effects of growth. For this to occur, an economy must undergo very biased growth, and the economy must be a large enough actor in the world economy such that its actions spill over to adversely alter the terms of trade to a large degree. This combination of events is unlikely to occur in practice.9. India opening should be good for the U.S. if it reduces the relative price of goods that China sends tothe U.S. and hence increases the relative price of goods that the U.S. exports. Obviously, any sector in the U.S. hurt by trade with China would be hurt again by India, but on net, the U.S. wins. Note that here we are making different assumptions about what India produces and what is tradable than we are in Question #6. Here we are assuming India exports products the U.S. currently imports and China currently exports. China will lose by having the relative price of its export good driven down by the increased production in India.10. Aid which must be spent on exports increases the demand for those export goods and raises their pricerelative to other goods. There will be a terms of trade deterioration for the recipient country. This can be viewed as a polar case of the effect of a transfer on the terms of trade. Here, the marginal propensity to consume the export good by the recipient country is 1. The donor benefits from a terms of trade improvement. As with immiserizing growth, it is theoretically possible that a transfer actuallyworsens the welfare of the recipient.11. When a country subsidizes its exports, the world relative supply and relative demand schedules shiftsuch that the terms of trade for the country worsen. A countervailing import tariff in a second country exacerbates this effect, moving the terms of trade even further against the first country. The firstcountry is worse off both because of the deterioration of the terms of trade and the distortionsintroduced by the new internal relative prices. The second country definitely gains from the firstcountry’s export su bsidy, and may gain further from its own tariff. If the second country retaliated with an export subsidy, then this would offset the initial improvement in the terms of trade; the“retaliatory” export subsidy definitely helps the first country and hurts th e second.。
第9章贸易政策中的政治经济学一、概念题1.约束(binding)答:在国际贸易中,约束一般是指税率的约束,即“约束”关税的税率。
约束税率是指经过谈判达成协议而固定下来的关税税率。
按关贸总协定规定,缔约各国应该在互惠互利的基础上通过有选择的产品对产品的方式,或者为有关缔约国所接受的多边的程序进行谈判,谈判结果固定下来的各国税则商品的税率为约束税率,汇总起来形成减让表,作为总协定的一个附属部分付诸实施。
按关贸总协定规定,关税减让谈判有四种减让形式来约束关税的税率:①降低关税并约束在降低了的关税水平;②约束现行关税税率;③约束在现行关税水平以上的某个关税水平;④约束免税待遇。
2.支持自由贸易的政治依据(political argument for free trade)答:支持自由贸易的政治依据是指,尽管理论上可能还有比自由贸易更好的政策,但从政治上认可和支持自由贸易的原则更重要。
现实中的贸易政策经常会由具有特殊利益关系的集团所左右,而不考虑国家的成本与收益。
虽然从理论上可以证明某些选择性的关税和出口补贴政策能够增进整体社会福利,但现实中,任何一个政府机构在制定一套干预贸易的详细计划时都有可能被利益集团所控制,从而成为在有政治影响的部门中进行收入再分配的工具。
如果上述观点正确的话,那么倡导自由贸易无疑是最好的选择。
3.集体行动(collective action)答:集体行动是指关于经济活动中个人理性并不必然导致集体理性。
如果某项活动或者福利的获得需要两个或者两个以上的人的共同努力才能完成,集体行动问题就出现了,即决策集体的每个成员必须单方面决定是否参与提供某种集体产品。
因为集体产品具有非排他性和非竞争性的特征,所以使得不为集体产品的提供付出成本的集团成员也可以获得集体产品。
集团越大,分享收益的人越多,个人的行动对集团利益的影响越小,集团内的成员“搭便车”的动机就越强烈。
这就意味着仅仅依靠个人的自愿,集体产品的供给将是不足的,集体产品不可能依靠个人的自愿提供来解决。

国际经济学克鲁格曼课后习题答案章集团标准化办公室:[VV986T-J682P28-JP266L8-68PNN]第一章练习与答案1.为什么说在决定生产和消费时,相对价格比绝对价格更重要?答案提示:当生产处于生产边界线上,资源则得到了充分利用,这时,要想增加某一产品的生产,必须降低另一产品的生产,也就是说,增加某一产品的生产是有机会机本(或社会成本)的。
生产可能性边界上任何一点都表示生产效率和充分就业得以实现,但究竟选择哪一点,则还要看两个商品的相对价格,即它们在市场上的交换比率。
相对价格等于机会成本时,生产点在生产可能性边界上的位置也就确定了。
所以,在决定生产和消费时,相对价格比绝对价格更重要。
2.仿效图1—6和图1—7,试推导出Y商品的国民供给曲线和国民需求曲线。
答案提示:3.在只有两种商品的情况下,当一个商品达到均衡时,另外一个商品是否也同时达到均衡?试解释原因。
答案提示:4.如果生产可能性边界是一条直线,试确定过剩供给(或需求)曲线。
答案提示:5.如果改用Y商品的过剩供给曲线(B国)和过剩需求曲线(A国)来确定国际均衡价格,那么所得出的结果与图1—13中的结果是否一致?6.答案提示:国际均衡价格将依旧处于贸易前两国相对价格的中间某点。
7.说明贸易条件变化如何影响国际贸易利益在两国间的分配。
答案提示:一国出口产品价格的相对上升意味着此国可以用较少的出口换得较多的进口产品,有利于此国贸易利益的获得,不过,出口价格上升将不利于出口数量的增加,有损于出口国的贸易利益;与此类似,出口商品价格的下降有利于出口商品数量的增加,但是这意味着此国用较多的出口换得较少的进口产品。
对于进口国来讲,贸易条件变化对国际贸易利益的影响是相反的。
8.如果国际贸易发生在一个大国和一个小国之间,那么贸易后,国际相对价格更接近于哪一个国家在封闭下的相对价格水平?答案提示:贸易后,国际相对价格将更接近于大国在封闭下的相对价格水平。
Chapter 4Resources, Comparative Advantage, and Income DistributionChapter OrganizationA Model of a Two-Factor EconomyPrices and ProductionChoosing the Mix of InputsFactor Prices and Goods PricesResources and OutputEffects of International Trade Between Two-Factor Economies Relative Prices and the Pattern of TradeTrade and the Distribution of IncomeFactor Price EqualizationTrade and Income Distribution in the Short RunCase Study: North-South Trade and Income InequalityThe Political Economy of Trade: A Preliminary ViewThe Gains from Trade, RevisitedOptimal Trade PolicyIncome Distribution and Trade PoliticsBox: Income Distribution and the Beginnings of Trade Theory Empirical Evidence on the Heckscher-Ohlin ModelTesting the Heckscher-Ohlin ModelImplications of the TestsSummaryAppendix: Factor Prices, Goods Prices, and Input Choices Choice of TechniqueGoods Prices and Factor PricesChapter OverviewIn Chapter 3, trade between nations was motivated by differences internationally in the relative productivity of workers when producing a range of products. In Chapter 4, this analysis goes a step further by introducing the Heckscher-Ohlin theory.The Heckscher-Ohlin theory considers the pattern of production and trade which will arise when countries have different endowments of factors of production, such as labor, capital, and land. The basic point is that countries tend to export goods that are intensive in the factors with which they are abundantly supplied. Trade has strong effects on the relative earnings of resources, and tends to lead to equalization across countries of prices of the factors of production. These theoretical results and related empirical findings are presented in this chapter.The chapter begins by developing a general equilibrium model of an economy with two goods which are each produced using two factors according to fixed coefficient production functions. The assumption of fixed coefficient production functions provides an unambiguous ranking of goods in terms of factor intensities. (The appendix develops the model when the production functions have variable coefficients.) Two important results are derived using this model. The first is known as the Rybczynski effect. Increasing the relative supply of one factor, holding relative goods prices constant, leads to a biased expansion of production possibilities favoring the relative supply of the good which uses that factor intensively.The second key result is known as the Stolper-Samuelson effect. Increasing the relative price of a good, holding factor supplies constant, increases the return to the factor used intensively in the production of that good by more than the price increase, while lowering the return to the other factor. This result has important income distribution implications.It can be quite instructive to think of the effects of demographic/labor force changes on the supply of different products. For example, how might the pattern of production during the productive years of the “Baby Boom” generation differ from the pattern of production for post Baby Boom generations? What does this imply for returns to factors and relative price behavior?The central message concerning trade patterns of the Heckscher-Ohlin theory is that countries tend to export goods whose production is intensive in factors with which they are relatively abundantly endowed. This is demonstrated by showing that, using the relative supply and relative demand analysis, the country relatively abundantly endowed with a certain factor will produce that factor more cheaply than the other country. International trade leads to a convergence of goods prices. Thus, the results from the Stolper-Samuelson effect demonstrate that owners of a country’s abundant factors gain from trade, but ownersof a country’s scarce factors lose. The extension of this result is the important Factor Price Equalization Theorem, which states that trade in (and thus price equalization of) goods leads to an equalization in the rewards to factors across countries. The political implications of factor price equalization should be interesting to students.The chapter also introduces some political economy considerations. First, it briefly notes that many of the results regarding trade and income distribution assume full and swift adjustment in the economy. In the short run, though, labor and capital that are currently in a particular industry may have sector-specific skills or knowledge and are being forced to move to another sector, and this involves costs. Thus, even if a shift in relative prices were to improve the lot of labor, for those laborers who must change jobs, there is a short run cost.The core of the political economy discussion focuses on the fact that when opening to trade, some may benefit and some may lose, but the expansion of economic opportunity should allow society to redistribute some of the gains towards those who lose, making sure everyone benefits on net. In practice, though, those who lose are often more concentrated and hence have more incentive to try to affect policy. Thus, trade policy is not always welfare maximizing, but may simply reflect the preferences of the loudest and best organized in society.Empirical results concerning the Heckscher-Ohlin theory, beginning with the Leontief paradox and extending to current research, do not support its predictions concerning resource endowments explaining overall patterns of trade, though some patterns do match the broad outlines of its theory (e.g., theUnited States imports more low-skill products from Bangladesh and more high-skill products from Germany). This observation has motivated many economists to consider motives for trade between nations that are not exclusively based on differences across countries. These concepts will be exploredin later chapters. Despite these shortcomings, important and relevant results concerning income distribution are obtained from the Heckscher-Ohlin theory.Answers to Textbook Problems1. The definition of cattle growing as land intensive depends on the ratio of land to labor used inproduction, not on the ratio of land or labor to output. The ratio of land to labor in cattle exceeds the ratio in wheat in the United States, implying cattle is land intensive in the United States. Cattle is land intensive in other countries as well if the ratio of land to labor in cattle production exceeds the ratio in wheat production in that country. Comparisons between another country and the United States is less relevant for this purpose.2. a. The box diagram has 600 as the length of two sides (representing labor) and 60 as the lengthof the other two sides (representing land). There will be a ray from each of the two cornersrepresenting the origins. To find the slopes of these rays we use the information from the questionconcerning the ratios of the production coefficients. The question states that a LC/a TC= 20 anda LF/a TF= 5.Since a LC/a TC= (L C/Q C)/(T C/Q C) =L C/T C we have L C= 20T C. Using the same reasoning,a LF/a TF= (L F/Q F)/(T F/Q F) =L F/T F and since this ratio equals 5, we have L F= 5T F. We cansolve this algebraically since L=L C+ L F= 600 and T=T C+ T F= 60.The solution is L C= 400, T C= 20, L F= 200 and T F= 40.b. The dimensions of the box change with each increase in available labor, but the slopes of the raysfrom the origins remain the same. The solutions in the different cases are as follows.L= 800: T C= 33.33, L C= 666.67, T F= 26.67, L F= 133.33L= 1000: T C= 46.67, L C= 933.33, T F= 13.33, L F= 66.67L= 1200: T C= 60, L C= 1200, T F= 0, L F= 0. (complete specialization).c. At constant factor prices, some labor would be unused, so factor prices would have to change, orthere would be unemployment.3. This question is similar to an issue discussed in Chapter 3. What matters is not the absolute abundanceof factors, but their relative abundance. Poor countries have an abundance of labor relative to capital when compared to more developed countries.4. In the Ricardian model, labor gains from trade through an increase in its purchasing power. Thisresult does not support labor union demands for limits on imports from less affluent countries. The Heckscher-Ohlin model directly addresses distribution by considering the effects of trade on theowners of factors of production. In the context of this model, unskilled U.S. labor loses fromtrade since this group represents the relatively scarce factors in this country. The results from theHeckscher-Ohlin model support labor union demands for import limits. In the short run, certainunskilled unions may gain or lose from trade depending on in which sector they work, but in theory, in the longer run, the conclusions of the Heckscher-Ohlin model will dominate.5. Specific programmers may face wage cuts due to the competition from India, but this is not inconsistentwith skilled labor wages rising. By making programming more efficient in general, this development may have increased wages for others in the software industry or lowered the prices of the goodsoverall. In the short run, though, it has clearly hurt those with sector specific skills who will facetransition costs. There are many reasons to not block the imports of computer programming services (or outsourcing of these jobs). First, by allowing programming to be done more cheaply, it expands the production possibilities frontier of the U.S., making the entire country better off on average.Necessary redistribution can be done, but we should not stop trade which is making the nation as a whole better off. In addition, no one trade policy action exists in a vacuum, and if the U.S. blocked the programming imports, it could lead to broader trade restrictions in other countries.6. The factor proportions theory states that countries export those goods whose production is intensivein factors with which they are abundantly endowed. One would expect the United States, whichhas a high capital/labor ratio relative to the rest of the world, to export capital-intensive goods if the Heckscher-Ohlin theory holds. Leontief found that the United States exported labor-intensive goods.Bowen, Leamer and Sveikauskas found for the world as a whole the correlation between factorendowment and trade patterns to be tenuous. The data do not support the predictions of the theory that countries’ e xports and imports reflect the relative endowments of factors.7. If the efficiency of the factors of production differs internationally, the lessons of the Heckscher-Ohlin theory would be applied to “effective factors” which adjust for the differences in technology or worker skills or land quality (for example). The adjusted model has been found to be moresuccessful than the unadjusted model at explaining the pattern of trade between countries. Factor-price equalization concepts would apply to the effective factors. A worker with more skills or in a country with better technology could be considered to be equal to two workers in another country. Thus, the single person would be two effective units of labor. Thus, the one high-skilled workercould earn twice what lower-skilled workers do, and the price of one effective unit of labor would still be equalized.。
第15章 长期价格水平和汇率一、概念题1.费雪效应(Fisher effect )答:费雪效应是指通货膨胀率和利率在长期中同比例变化的关系。
美国经济学家费雪在其《利息理论》一书中阐述了这一关系。
这一关系假定,在长期中通货膨胀率等于预期通货膨胀率。
在其他条件不变的情况下,如果一国的预期通货膨胀率上升,最终会导致该国货币存款利率的同比例上升;反之,如果预期通货膨胀率下降,最终会导致货币存款利率的同比例下降。
从国际资本流动来看,费雪效应体现了通货膨胀率、利率和汇率变化的关系。
当其他条件不变时,若一国的预期通货膨胀率上升,在外汇市场上将导致该种货币的贬值;根据利率平价理论,这最终将导致该国货币存款利率的上升。
这一关系还可以用相对购买力平价理论和利率平价理论的结合来说明。
相对购买力平价表明,在一定时期内两国货币汇率变动的百分比等于两国通货膨胀率之差。
利率平价表明,两国货币汇率预期变动的百分比等于两国货币存款的预期收益率之差,即两国货币存款未来的利率之差。
在长期中,两国货币的汇率变动即为两国货币汇率的预期变动。
这样,两国货币存款未来利率之差就等于两国通货膨胀率之差,用公式表示:G F G F R R ππ-=-G R 和F R 分别代表两国货币存款的利率,G π和F π分别代表两国的通货膨胀率。
该公式表明,在其他条件不变时,一国通货膨胀率的上升最终将导致该国货币存款利率同比例上升。
2.购买力平价(purchasing power parity ,PPP )答:购买力平价是指不同国家商品和服务的价格水平的比率。
一国的价格水平以一个基准的商品和服务“篮子”的价格来表示,它反映该国货币的国内购买力。
对购买同一个基准的商品和服务“篮子”来说,在本国以本国货币支付的价格与其在外国以外国货币支付的价格之比,便是购买力平价。
具体计算方法为:在两国(或多国)选择同质的“一篮子”商品和服务,收集价格、数量和支出额资料,分别核算各组、各类商品和服务价格的比率,最终获得一个综合的价格比率。
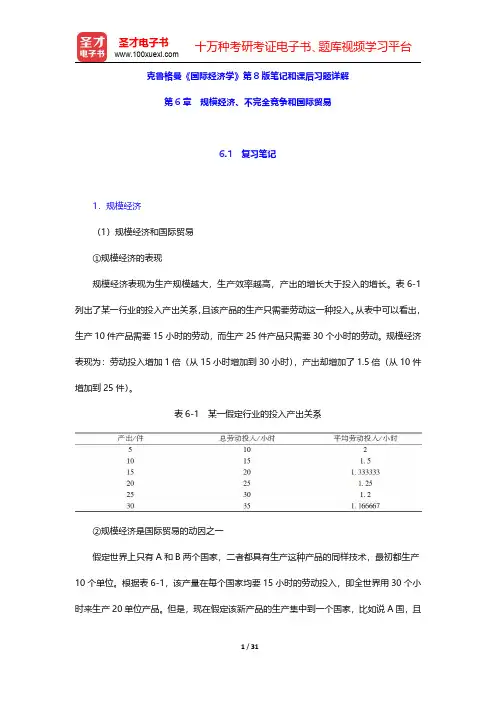
克鲁格曼《国际经济学》第8版笔记和课后习题详解第6章规模经济、不完全竞争和国际贸易6.1复习笔记1.规模经济(1)规模经济和国际贸易①规模经济的表现规模经济表现为生产规模越大,生产效率越高,产出的增长大于投入的增长。
表6-1列出了某一行业的投入产出关系,且该产品的生产只需要劳动这一种投入。
从表中可以看出,生产10件产品需要15小时的劳动,而生产25件产品只需要30个小时的劳动。
规模经济表现为:劳动投入增加1倍(从15小时增加到30小时),产出却增加了1.5倍(从10件增加到25件)。
表6-1某一假定行业的投入产出关系②规模经济是国际贸易的动因之一假定世界上只有A和B两个国家,二者都具有生产这种产品的同样技术,最初都生产10个单位。
根据表6-1,该产量在每个国家均要15小时的劳动投入,即全世界用30个小时来生产20单位产品。
但是,现在假定该新产品的生产集中到一个国家,比如说A国,且A国在这一行业也投入30个小时的劳动。
然而,在一个国家内投入30个小时的劳动,却能生产出25件产品。
显然,生产集中到A国可以使得世界以同样的劳动投入多产出25%的产品。
可见,各国可以用比以往更有效的规模专业化地生产有限类别的产品;同时,它们之间的相互贸易又使得消费所有产品成为可能。
(2)规模经济和市场结构①规模经济的分类a.外部规模经济,指单位产品成本取决于整个行业规模而非单个厂商规模的规模经济类型。
b.内部规模经济,指单位产品成本取决于单个厂商的规模而不是其所在的行业规模的规模经济类型。
②规模经济对市场结构的影响外部的和内部的规模经济对市场结构具有不同的影响。
一个只存在外部规模经济的行业(即大厂商没有优势)一般由许多相对较小的厂商构成,且处于完全竞争的状态;相反,存在内部规模经济的行业中,大厂商比小厂商更具有成本优势,就形成了不完全竞争的市场结构。
外部规模经济和内部规模经济都是国际贸易的重要原因。
但是,由于它们对市场结构的影响不同,下面将对它们进行分别讨论。
克鲁格曼《国际经济学》(第8版)课后习题详解克鲁格曼《国际经济学》(第8版)课后习题详解第1章绪论本章不是考试的重点章节,建议读者对本章内容只作大致了解即可,本章没有相关的课后习题。
第1篇国际贸易理论第2章世界贸易概览一、概念题1>(发展中国家(developing countries)答:发展中国家是与发达国家相对的经济上比较落后的国家,又称“欠发达国家”或“落后国家”。
通常指第三世界国家,包括亚洲、非洲、拉丁美洲及其他地区的130多个国家。
衡量一国是否为发展中国家的具体标准有很多种,如经济学家刘易斯和世界银行均提出过界定发展中国家的标准。
一般而言,凡人均收入低于美国人均收入的五分之一的国家就被定义为发展中国家。
比较贫困和落后是发展中国家的共同特点。
2>(服务外包(service outsourcing)答:服务外包是指企业将其非核心的业务外包出去,利用外部最优秀的专业化团队来承接其业务,从而使其专注于核心业务,达到降低成本、提高效率、增强企业核心竞争力和对环境应变能力的一种管理模式。
20世纪90年代以来,随着信息技术的迅速发展,特别是互联网的普遍存在及广泛应用,服务外包得到蓬勃发展。
从美国到英国,从欧洲到亚洲,无论是中小企业还是跨国公司,都把自己有限的资源集中于公司的核心能力上而将其余业务交给外部专业公司,服务外包成为“发达经济中不断成长的现象”。
3>(引力模型(gravity model)答:丁伯根和波伊赫能的引力模型基本表达式为:其中,是国与国的贸易额,为常量,是国的国内生产总值,是国的国内生产总值,是两国的距离。
、、三个参数是用来拟合实际的经济数据。
引力模型方程式表明:其他条件不变的情况下,两国间的贸易规模与两国的GDP成正比,与两国间的距离成反比。
把整个世界贸易看成整体,可利用引力模型来预测任意两国之间的贸易规模。
另外,引力模型也可以用来明确国际贸易中的异常现象。
4>(第三世界(third world)答:第三世界这个名词原本是指法国大革命中的Third Estate(第三阶级)。
Chapter 8The Instruments of Trade PolicyChapter OrganizationBasic Tariff AnalysisSupply, Demand, and Trade in a Single IndustryEffects of a TariffMeasuring the Amount of ProtectionCosts and Benefits of a TariffConsumer and Producer SurplusMeasuring the Costs and BenefitsOther Instruments of Trade PolicyExport Subsidies: TheoryCase Study: Europe’s Common Agricultural PolicyImport Quotas: TheoryCase Study: An Import Quota in Practice: U.S. SugarVoluntary Export RestraintsCase Study: A Voluntary Export Restraint in Practice: Japanese Autos Local Content RequirementsBox: American Buses, Made in HungaryOther Trade Policy InstrumentsThe Effects of Trade Policy: A SummarySummaryAppendix I: Tariff Analysis in General EquilibriumA Tariff in a Small CountryA Tariff in a Large CountryAppendix II: Tariffs and Import Quotas in the Presence of Monopoly The Model with Free TradeThe Model with a TariffThe Model with an Import QuotaComparing a Tariff with a QuotaChapter 8 The Instruments of Trade Policy 33Chapter OverviewThis chapter and the next three focus on international trade policy. Students will have heard various arguments for and against restrictive trade practices in the media. Some of these arguments are sound and some are clearly not grounded in fact. This chapter provides a framework for analyzing the economic effects of trade policies by describing the tools of trade policy and analyzing their effects on consumers and producers in domestic and foreign countries. Case studies discuss actual episodes of restrictive trade practices. An instructor might try to underscore the relevance of these issues by having students scan newspapers and magazines for other timely examples of protectionism at work.The analysis presented here takes a partial equilibrium view, focusing on demand and supply in one market, rather than the general equilibrium approach followed in previous chapters. Import demand and export supply curves are derived from domestic and foreign demand and supply curves. There are a number of trade policy instruments analyzed in this chapter using these tools. Some of the important instruments of trade policy include specific tariffs, defined as taxes levied as a fixed charge for each unit of a good imported; ad valorem tariffs, levied as a fraction of the value of the imported good; export subsidies, which are payments given to a firm or industry that ships a good abroad; import quotas, which are direct restrictions on the quantity of some good that may be imported; voluntary export restraints, which are quotas on trading that are imposed by the exporting country instead of the importing country; and local content requirements, which are regulations that require that some specified fraction of a good is produced domestically.The import supply and export demand analysis demonstrates that the imposition of a tariff drives a wedge between prices in domestic and foreign markets, and increases prices in the country imposing the tariff and lowers the price in the other country by less than the amount of the tariff. This contrasts with most textbook presentations which make the small country assumption that the domestic internal price equals the world price times one plus the tariff rate. The actual protection provided by a tariff willnot equal the tariff rate if imported intermediate goods are used in the production of the protected good. The proper measurement, the effective rate of protection, is described in the text and calculated for a sample problem.The analysis of the costs and benefits of trade restrictions require tools of welfare analysis. The text explains the essential tools of consumer and producer surplus. Consumer surplus on each unit sold is defined as the difference between the actual price and the amount that consumers would have been willing to pay for the product. Geometrically, consumer surplus is equal to the area under the demand curve and above the price of the good. Producer surplus is the difference between the minimum amount for which a producer is willing to sell his product and the price which he actually receives. Geometrically, producer surplus is equal to the area above the supply curve and below the price line. These tools are fundamental to the student’s understanding of the implications of trade polici es and should be developed carefully. The costs of a tariff include distortionary efficiency losses in both consumption and production. A tariff provides gains from terms of trade improvement when and if it lowers the foreign export price. Summing the areas in a diagram of internal demand and supply provides a method for analyzing the net loss or gain from a tariff.Other instruments of trade policy can be analyzed with this method. An export subsidy operates in exactly the reverse fashion of an import tariff. An import quota has similar effects as an import tariff upon prices and quantities, but revenues, in the form of quota rents, accrue to foreign producers of the protected good. Voluntary export restraints are a form of quotas in which import licenses are held by foreign governments. Local content requirements raise the price of imports and domestic goods and do not result in either government revenue or quota rents.34 Krugman/Obstfeld •International Economics: Theory and Policy, Eighth EditionThroughout the chapter the analysis of different trade restrictions are illustrated by drawing upon specific episodes. Europe’s common agricultural policy provides and example of export subsidies in action. The case study corresponding to quotas describes trade restrictions on U.S. sugar imports. Voluntary export restraints are discussed in the context of Japanese auto sales to the United States. The oil import quota in the United States in the 1960’s provides an example of a local content scheme.There are two appendices to this chapter. Appendix I uses a general equilibrium framework to analyze the impact of a tariff, departing from the partial equilibrium approach taken in the chapter. When a small country imposes a tariff, it shifts production away from its exported good and toward the imported good. Consumption shifts toward the domestically produced goods. Both the volume of trade and welfare of the country decline. A large country imposing a tariff can improve its terms of trade by an amount potentially large enough to offset the production and consumption distortions. For a large country, a tariff may be welfare improving.Appendix II discusses tariffs and import quotas in the presence of a domestic monopoly. Free trade eliminates the monopoly power of a domestic producer and the monopolist mimics the actions of a firm in a perfectly competitive market, setting output such that marginal cost equals world price. A tariff raises domestic price. The monopolist, still facing a perfectly elastic demand curve, sets output such that marginal cost equals internal price. A monopolist faces a downward sloping demand curve under a quota.A quota is not equivalent to a tariff in this case. Domestic production is lower and internal price higher when a particular level of imports is obtained through the imposition of a quota rather than a tariff.Answers to Textbook Problems1. The import demand equation, MD, is found by subtracting the home supply equation from the homedemand equation. This results in MD= 80 - 40 ⨯P. Without trade, domestic prices and quantities adjust such that import demand is zero. Thus, the price in the absence of trade is 2.2. a. Foreign’s export supply curve, XS, is XS=-40 + 40⨯P. In the absence of trade, the price is 1.b. When trade occurs, export supply is equal to import demand, XS=MD. Thus, using theequations from Problems 1 and 2a, P= 1.50, and the volume of trade is 20.3. a. The new MD curve is 80 - 40 ⨯ (P+ t) where t is the specific tariff rate, equal to 0.5. (Note: Insolving these problems, you should be careful about whether a specific tariff or ad valorem tariff is imposed. With an ad valorem tariff, the MD equation would be expressed as MD= 80 - 40 ⨯(1 + t)P.) The equation for the export supply curve by the foreign country is unchanged. Solving,we find that the world price is $1.25, and thus the internal price at home is $1.75. The volume of trade has been reduced to 10, and the total demand for wheat at home has fallen to 65 (from thefree trade level of 70). The total demand for wheat in Foreign has gone up from 50 to 55.b. andc. The welfare of the home country is best studied using the combined numerical andgraphical solutions presented below in Figure 8.1.Figure 8.1Chapter 8 The Instruments of Trade Policy 35where the areas in the figure are:a.55(1.75 - 1.50) -0.5(55 - 50)(1.75 - 1.50) = 13.125b. 0.5(55 - 50)(1.75 - 1.50) = 0.625c. (65 - 55)(1.75 - 1.50) = 2.50d. 0.5(70 - 65)(1.75 - 1.50) = 0.625e. (65 - 55)(1.50 - 1.25) = 2.50Consumer surplus change: -(a+ b+ c+ d) =-16.875. Producer surplus change: a= 13.125.Government revenue change: c+ e= 5. Efficiency losses b+ d are exceeded by terms of tradegain e. (Note: In the calculations for the a, b, and d areas, a figure of 0.5 shows up. This isbecause we are measuring the area of a triangle, which is one-half of the area of the rectangledefined by the product of the horizontal and vertical sides.)4. Using the same solution methodology as in Problem 3, when the home country is very small relativeto the foreign country, its effects on the terms of trade are expected to be much less. The smallcountry is much more likely to be hurt by its imposition of a tariff. Indeed, this intuition is shown in this problem. The free trade equilibrium is now at the price $1.09 and the trade volume is now$36.40.With the imposition of a tariff of 0.5 by Home, the new world price is $1.045, the internal home price is $1.545, home demand is 69.10 units, home supply is 50.90, and the volume of trade is 18.20.When Home is relatively small, the effect of a tariff on world price is smaller than when Home is relatively large. When Foreign and Home were closer in size, a tariff of 0.5 by home lowered world price by 25 percent, whereas in this case the same tariff lowers world price by about 5 percent. The internal Home price is now closer to the free trade price plus t than when Home was relatively large.In this case, the government revenues from the tariff equal 9.10, the consumer surplus loss is 33.51, and the producer surplus gain is 21.089. The distortionary losses associated with the tariff (areas b+ d) sum to 4.14 and the terms of trade gain (e) is 0.819. Clearly, in this small country example, the distortionary losses from the tariff swamp the terms of trade gains. The general lesson is the smaller the economy, the larger the losses from a tariff since the terms of trade gains are smaller.5. ERP = (200 ⨯ 1.50 - 200)/100 = 100%6. The effective rate of protection takes into consideration the costs of imported intermediate goods.Here, 55% of the cost can be imported, suggesting with no distortion, home value added would be 45%. A 15% increase in the price of ethanol, though, means home value added could be as high as 60%. Effective rate of protection = (V t-V w)/V w, where V t is the value added in the presence of trade policies, and V w is the value added without trade distortions. In this case, we have (60 - 45)/45 = 33% effective rate of protection.7. We first use the foreign export supply and domestic import demand curves to determine the newworld price. The foreign supply of exports curve, with a foreign subsidy of 50 percent per unit,becomes XS=-40 + 40(1 + 0.5) ⨯P. The equilibrium world price is 1.2 and the internal foreign price is 1.8. The volume of trade is 32. The foreign demand and supply curves are used to determine the costs and benefits of the subsidy. Construct a diagram similar to that in the text and calculate the area of the various polygons. The government must provide (1.8 - 1.2)⨯ 32 = 19.2 units of output to support the subsidy. Foreign producers surplus rises due to the subsidy by the amount of 15.3 units of output. Foreign consumers surplus falls due to the higher price by 7.5 units of the good. Thus, the net loss to Foreign due to the subsidy is 7.5 + 19.2 - 15.3 = 11.4 units of output. Home consumers and producers face an internal price of 1.2 as a result of the subsidy. Home consumers surplus rises by 70 ⨯ 0.3 + 0.5 (6⨯ 0.3) = 21.9, while Home producers surplus falls by 44 ⨯ 0.3 + 0.5(6 ⨯ 0.3) =14.1, for a net gain of 7.8 units of output.36 Krugman/Obstfeld •International Economics: Theory and Policy, Eighth Edition8. a. False, unemployment has more to do with labor market issues and the business cycle than withtariff policy.b. False, the opposite is true because tariffs by large countries can actually reduce world priceswhich helps offset their effects on consumers.c. This kind of policy might reduce automobile production and Mexico, but also would increase theprice of automobiles in the United States, and would result in the same welfare loss associatedwith any quota.9. At a price of $10 per bag of peanuts, Acirema imports 200 bags of peanuts. A quota limiting theimport of peanuts to 50 bags has the following effects:a. The price of peanuts rises to $20 per bag.b. The quota rents are ($20 - $10) ⨯ 50 = $500.c. The consumption distortion loss is 0.5 ⨯ 100 bags ⨯ $10 per bag = $500.d. The production distortion loss is 0.5 ⨯ 50 bags ⨯ $10 per bag = $250.10. The reason is largely that the benefits of these policies accrue to a small group of people and thecosts are spread out over many people. Thus, those that benefit care far more deeply about these policies. These typical political economy problems associated with trade policy are probably even more troublesome in agriculture, where there are long standing cultural reasons for farmers andfarming communities to want to hold onto their way of life, making the interests even moreentrenched than they would normally be.11. It would improve the income distribution within the economy since wages in manufacturing wouldincrease, and real incomes for others in the economy would decrease due to higher prices formanufactured goods. This is true only under the assumption that manufacturing wages are lower than all others in the economy. If they were higher than others in the economy, the tariff policies would worsen the income distribution.。
第一章练习与答案1.为什么说在决定生产和消费时,相对价格比绝对价格更重要?答案提示:当生产处于生产边界线上,资源则得到了充分利用,这时,要想增加某一产品的生产,必须降低另一产品的生产,也就是说,增加某一产品的生产是有机会机本(或社会成本)的。
生产可能性边界上任何一点都表示生产效率和充分就业得以实现,但究竟选择哪一点,则还要看两个商品的相对价格,即它们在市场上的交换比率。
相对价格等于机会成本时,生产点在生产可能性边界上的位置也就确定了。
所以,在决定生产和消费时,相对价格比绝对价格更重要。
2.仿效图1—6和图1—7,试推导出Y商品的国民供给曲线和国民需求曲线。
答案提示:3.在只有两种商品的情况下,当一个商品达到均衡时,另外一个商品是否也同时达到均衡?试解释原因。
答案提示:4.如果生产可能性边界是一条直线,试确定过剩供给(或需求)曲线。
答案提示:5.如果改用Y商品的过剩供给曲线(B国)和过剩需求曲线(A 国)来确定国际均衡价格,那么所得出的结果与图1—13中的结果是否一致?答案提示:国际均衡价格将依旧处于贸易前两国相对价格的中间某点。
6.说明贸易条件变化如何影响国际贸易利益在两国间的分配。
答案提示:一国出口产品价格的相对上升意味着此国可以用较少的出口换得较多的进口产品,有利于此国贸易利益的获得,不过,出口价格上升将不利于出口数量的增加,有损于出口国的贸易利益;与此类似,出口商品价格的下降有利于出口商品数量的增加,但是这意味着此国用较多的出口换得较少的进口产品。
对于进口国来讲,贸易条件变化对国际贸易利益的影响是相反的。
7.如果国际贸易发生在一个大国和一个小国之间,那么贸易后,国际相对价格更接近于哪一个国家在封闭下的相对价格水平?答案提示:贸易后,国际相对价格将更接近于大国在封闭下的相对价格水平。
8.根据上一题的答案,你认为哪个国家在国际贸易中福利改善程度更为明显些?答案提示:小国。
9*.为什么说两个部门要素使用比例的不同会导致生产可能性边界曲线向外凸?答案提示:第二章答案1.根据下面两个表中的数据,确定(1)贸易前的相对价格;(2)比较优势型态。
第4章资源、比较优势与收入分配一、概念题1.充裕要素(abundant factor)答:充裕要素是“稀缺要素”的对称,是指一国相对充裕的生产要素。
充裕要素的“充裕”是相对的,指的并不是一国所拥有的该生产要素的绝对数量的充裕,而是该生产要素相对于其他生产要素的相对充裕。
充裕要素是以资源禀赋解释国际贸易的赫克歇尔-俄林定理中的重要概念。
根据赫克歇尔-俄林定理,各国倾向于生产并出口国内充裕要素密集型的产品,一国充裕要素的所有者能够从国际贸易中获利。
2.要素价格(factor prices)答:要素价格即生产要素的价格,是指每一单位的生产要素在一定时期内给所有者带来的收入。
生产要素主要有四种:劳动力、土地、资本和企业家才能。
相应地,其价格分别称为工资、地租、利息和利润。
生产要素价格同产品的价格一样,主要是由生产要素市场上供求的相互作用决定的。
在市场经济中,工资主要由劳动力市场上的供求关系决定;地租主要由土地市场上的供求关系决定;利息主要由资本市场上的供求关系决定;利润作为企业家收入,主要由企业家市场上的供求关系决定。
3.生产可能性边界的偏向性扩张(biased expansion of production possibilities)答:生产可能性边界的偏向性扩张是指生产可能性边界在一个方向上扩张的幅度大于在另一方向上扩张的幅度,如图4-1所示。
图4-1(a)说明了生产可能性曲线偏向于X的扩张,图4-1(b)则说明了生产可能性曲线偏向Y的扩张。
图中的生产可能性边界都从1TT移到了2TT。
图4-1 生产可能性边界的偏向性扩张4.要素比例理论(factor-proportions theory)答:要素比例理论又称“赫克歇尔-俄林理论”、“生产要素禀赋理论”,是指从资源禀赋角度对国际贸易中生产成本和价格的差异做出解释的国际贸易理论。
要素比例理论的主要内容是:国际贸易源于不同国家之间商品的价格存在差异,而价格差异的原因在于不同国家生产成本有高有低,生产成本的高低又是因为各国生产要素价格有差别,生产要素价格的差别又与各国生产要素丰裕程度密切相关。
Chapter 18The International Monetary System, 1870–1973?Chapter OrganizationMacroeconomic Policy Goals in an Open EconomyInternal Balance: Full Employment and Price-Level StabilityExternal Balance: The Optimal Level of the Current Account International Macroeconomic Policy under the Gold Standard, 1870–1914 Origins of the Gold StandardExternal Balance under the Gold StandardThe Price-Specie-Flow MechanismThe Gold Standard “Rules of the Game”: Myth and RealityBox: Hume v. the MercantilistsInternal Balance under the Gold StandardCase Study: The Political Economy of Exchange Rate Regimes:Conflict over America’s Monetary Standard During the 1890s The Interwar Years, 1918–1939The Fleeting Return to GoldInternational Economic DisintegrationCase Study: The International Gold Standard and the Great Depression The Bretton Woods System and the International Monetary Fund Goals and Structure of the IMFConvertibility and the Expansion of Private Capital FlowsSpeculative Capital Flows and CrisesAnalyzing Policy Options under the Bretton Woods SystemMaintaining Internal BalanceMaintaining External BalanceExpenditure-Changing and Expenditure-Switching PoliciesThe External-Balance Problem of the United StatesCase Study: The Decline and Fall of the Bretton Woods SystemWorldwide Inflation and the Transition to Floating Rates Summary?Chapter OverviewThis is the first of five international monetary policy chapters. These chapters complement the preceding theory chapters in several ways. They provide the historical and institutional background students require to place their theoretical knowledge in a useful context. The chapters also allow students, through study of historical and current events, to sharpen their grasp of the theoretical models and to develop the intuition those models can provide. (Application of the theory to events of current interest will hopefully motivate students to return to earlier chapters and master points that may have been missed on the first pass.)Chapter 18 chronicles the evolution of the international monetary system from the gold standard of1870–1914, through the interwar years, and up to and including the post-World War II Bretton Woods regime that ended in March 1973. The central focus of the chapter is the manner in which each system addressed, or failed to address, the requirements of internal and external balance for its participants.A country is in internal balance when its resources are fully employed and there is price level stability. External balance implies an optimal time path of the current account subject to its being balanced over the long run. Other factors have been important in the definition of external balance at various times, and these are discussed in the text. The basic definition of external balance as an appropriate current-account level, however, seems to capture a goal that most policy-makers share regardless of the particular circumstances.The price-specie-flow mechanism described by David Hume shows how the gold standard could ensure convergence to external balance. You may want to present the following model of the price-specie-flow mechanism. This model is based upon three equations: 1. The balance sheet of the central bank. At the most simple level, this is justgold holdings equals the money supply: G ? M.2. The quantity theory. With velocity and output assumed constant and bothnormalized to 1, this yields the simple equation M ? P.3. A balance of payments equation where the current account is a function of thereal exchange rate and there are no private capital flows: CA ? f(E ? P*/P)These equations can be combined in a figure like the one below. The 45? line represents the quantity theory, and the vertical line is the price level where the real exchange rate results in a balanced current account. The economy moves along the 45? line back towards the equilibrium Point 0 whenever it is out of equilibrium. For example, the loss of four-fifths of a country’s gold would put that country at Point a with lower prices and a lower money supply. The resulting real exchange rate depreciation causes a current account surplus which restores money balances as the country proceeds up the 45? line froma to 0.FigureThe automatic adjustment process described by the price-specie-flow mechanism is expedited by following “rules of the game” under which governments contract the domestic source components oftheir monetary bases when gold reserves are falling (corresponding to a current-account deficit) and expand when gold reserves are rising (the surplus case).In practice, there was little incentive for countries with expanding gold reserves to follow the “rules of the game.” This increased the contractionary burden shouldered by countries with persistent current account deficits. The gold standard also subjugated internal balance to the demands of external balance. Research suggests price-level stability and high employment were attained less consistently under the gold standard than in the post-1945 period.The interwar years were marked by severe economic instability. The monetization of war debt and of reparation payments led to episodes of hyperinflation in Europe. Anill-fated attempt to return to thepre-war gold parity for the pound led to stagnation in Britain. Competitive devaluations and protectionism were pursued in a futile effort to stimulate domestic economic growth during the Great Depression.These beggar-thy-neighbor policies provoked foreign retaliation and led to the disintegration of the world economy. As one of the case studies shows, strict adherence to the Gold Standard appears to have hurt many countries during the Great Depression.Determined to avoid repeating the mistakes of the interwar years, Allied economic policy-makers metat Bretton Woods in 1944 to forge a new international monetary system for the postwar world. The exchange-rate regime that emerged from this conference had at its center the . dollar. All other currencies had fixed exchange rates against the dollar, which itself had a fixed value in terms of gold.An International Monetary Fund was set up to oversee the system and facilitate its functioning by lending to countries with temporary balance of payments problems.A formal discussion of internal and external balance introduces the concepts of expenditure-switching and expenditure-changing policies. The Bretton Woods system, with its emphasis on infrequent adjustmentof fixed parities, restricted the use of expenditure-switching policies. Increases in U.S. monetary growth to finance fiscal expenditures after the mid-1960s led to a loss of confidence in the dollar and the termination of the dollar’s convertibility into gold. The analysis presented in the text demonstrateshow the Bretton Woods system forced countries to “import” inflation from the United States and shows that the breakdown of the system occurred when countries were no longer willing to accept this burden.?Answers to Textbook Problems1. a. Since it takes considerable investment to develop uranium mines, you wouldwant a larger current account deficit to allow your country to finance some of the investment with foreign savings.b. A permanent increase in the world price of copper would cause a short-termcurrent account deficit if the price rise leads you to invest more in coppermining. If there are no investment effects, you would not change yourexternal balance target because it would be optimal simply to spend youradditional income.c. A temporary increase in the world price of copper would cause a currentaccount surplus. You would want to smooth out your country’s consumption bysaving some of its temporarily higher income.d. A temporary rise in the world price of oil would cause a current accountdeficit if you were an importer of oil, but a surplus if you were an exporter of oil.2. Because the marginal propensity to consume out of income is less than 1, atransfer of income from B to A increases savings in A and decreases savings in B.Therefore, A has a current account surplus and B has a corresponding deficit.This corresponds to a balance of payments disequilibrium in Hume’s world, which must be financed by gold flows from B to A. These gold flows increase A’s money supply and decrease B’s money supply, pushing up prices in A and depressingprices in B. These price changes cease once balance of payments equilibrium has been restored.3. Changes in parities reflected both initial misalignments and balance of paymentscrises. Attempts to return to the parities of the prewar period after the war ignored the changes in underlying economic fundamentals that the war caused. This made some exchange rates less than fully credible and encouraged balance ofpayments crises. Central bank commitments to the gold parities were also less than credible after the wartime suspension of the gold standard, and as a result of the increasing concern of governments with internal economic conditions.4. A monetary contraction, under the gold standard, will lead to an increase in thegold holdings of the contracting country’s central bank if other countries do not pursue a similar policy. All countries cannot succeed in doing thissimultaneously since the total stock of gold reserves is fixed in the short run.Under a reserve currency system, however, a monetary contraction causes anincipient rise in the domestic interest rate, which attracts foreign capital. The central bank must accommodate the inflow of foreign capital to preserve theexchange rate parity. There is thus an increase in the central bank’s holdings of foreign reserves equal to the fall in its holdings of domestic assets. There is no obstacle to a simultaneous increase in reserves by all central banksbecause central banks acquire more claims on the reserve currency country while their citizens end up with correspondingly greater liabilities.5. The increase in domestic prices makes home exports less attractive and causes acurrent account deficit. This diminishes the money supply and causescontractionary pressures in the economywhich serve to mitigate and ultimately reverse wage demands and price increases.6. A “demand determined” increase in dollar reserve holdings would not affect theworld supply of money as central banks merely attempt to trade their holdings of domestic assets for dollar rese rves. A “supply determined” increase in reserve holdings, however, would result from expansionary monetary policy in the United States (the reserve center). At least at the end of the Bretton Woods era the increase in world dollar reserves arose in part because of an expansionarymonetary policyin the United States rather than a desire by other central banks to increasetheir holdings of dollar assets. Only the “supply determined” increase indollar reserves is relevant for analyzing the relationship between world holdings of dollar reserves by central banks and inflation.7. An increase in the world interest rate leads to a fall in a central bank’sholdings of foreign reserves as domestic residents trade in their cash forforeign bonds. This leads to a d ecline in the home country’s money supply. The central bank of a “small” country cannot offset these effects sinceit cannot alter the world interest rate. An attempt to sterilize the reserve loss through open market purchases would fail unless bonds are imperfect substitutes.8. Capital account restrictions insulate the domestic interest rate from the worldinterest rate. Monetary policy, as well as fiscal policy, can be used to achieve internal balance. Because there are no offsetting capital flows, monetary policy, as well as fiscal policy, can be used to achieve internal balance. The costs of capital controls include the inefficiency which is introduced when the domestic interest rate differs from the world rate and the high costs of enforcing the controls.9. Yes, it does seem that the external balance problem of a deficit country is moresevere. While the macroeconomic imbalance may be equally problematic in the long run regardless of whether it is a deficit or surplus, large external deficits involve the risk that the market will fix the problem quickly by ceasing to fund the external deficit. In this case, there may have to be rapid adjustment that could be disruptive. Surplus countries are rarely forced into rapid adjustments, making the problems less risky.10. An inflow attack is different from capital flight, but many parallels exist. Inan “outflow” attack, speculators sell the home currency and drain the central bank of its foreign assets. The central bank could always defend if it so chooses (they can raise interest rates to improbably high levels), but if it is unwilling to cripple the economy with tight monetary policy, it must relent. An “inflow”attack is similar in that the central bank can always maintain the peg, it is just that the consequences of doing so may be more unpalatable than breaking the peg. If money flows in, the central bank must buy foreign assets to keep thecurrency from appreciating. If the central bank cannot sterilize all the inflows (eventually they may run out of domestic assets to sell to sterilize thetransactions where they are buying foreign assets), it will have to either let the currency appreciate or let the money supply rise. If it is unwilling to allow and increase in inflation due to a rising money supply, breaking the peg may be preferable.11. a. We know that China has a very large current account surplus, placing them highabove the XX line. They also have moderate inflationary pressures (describedas “gathering” in the question, implying they are not yet very strong). This suggests that China is above the II line, but not too far above it. It wouldbe placed in Zone 1 (see below).b. China needs to appreciate the exchange rate to move down on the graph towardsbalance. (Shown on the graph with the dashed line down)c. China would need to expand government spending to move to the right and hitthe overall balance point. Such a policy would help cushion the negativeaggregate demand pressurethat the appreciation might generate.。
克鲁格曼《国际经济学》(第8版)课后习题详解(第7章国际要素流动)【圣才出品】第7章国际要素流动⼀、概念题1.外国直接投资(direct foreign investment)答:外国直接投资⼜称“海外直接投资”,是指⼀个国家或地区的投资者对另⼀国家或地区所进⾏的、以控制或参与经营管理为特征的跨国投资⾏为,是国际资本流动的⼀种重要形式。
跨国公司是最主要的直接投资主体之⼀。
外国直接投资有多种具体形式,常见的有直接在国外投资设⽴⼦公司或分公司、购买国外某公司全部或⼀定⽐例的股份并获得⼀定的控制权、通过与东道国企业签订各种合约或合同取得对该企业的某种控制权等。
2.跨国公司的分布及内部化动机(location and internalization motives of multinationals)答:内部化是指在企业内部建⽴市场,以企业的内部市场代替外部市场,从⽽解决由于市场不完全⽽带来的不能保证供需交换正常进⾏的问题的⾏为过程。
内部化理论认为,由于市场存在不完全性和交易成本上升,因此企业通过外部市场的买卖关系不能保证企业获利,并导致许多附加成本。
因此,建⽴企业内部市场即通过跨国公司内部形成的公司内市场,就能克服外部市场和市场不完全所造成的风险和损失,给技术转移和垂直⼀体化带来好处。
3.要素流动(factor movements)答:要素流动是指⽣产要素在不同国家之间的流动。
具体包括劳动⼒流动、国际借贷和证券投资等形式的短期资本流动,以及跨国公司进⾏的长期投资等。
就经济本⾝⽽⾔,⽣产要素的国际流动和商品的国际流动(国际贸易)没有本质的不同,⼆者在⼀定程度上是可以相互替代的;但在现实⽣活中,由于社会、政治和⽂化传统等⽅⾯的差异,⽣产要素的国际流动远⽐商品的国际流动困难和复杂。
如今,商品的国际流动越来越便捷,但⽣产要素的国际流动还有很多限制:⼤多数国家仍对移民做出严格的限制,东道国对国际资本短期流动的投机性和冲击⼒提⾼了警惕,⼤多数国家对跨国公司进⾏直接投资的领域和股权⽐例做出了限制性规定等。
克鲁格曼《国际经济学》第八版课后答案(英文)-Ch06Chapter 6Economies of Scale, Imperfect Competition, and International TradeChapter OrganizationEconomies of Scale and International Trade: An OverviewEconomies of Scale and Market StructureThe Theory of Imperfect CompetitionMonopoly: A Brief ReviewMonopolistic CompetitionLimitations of the Monopolistic Competition ModelMonopolistic Competition and TradeThe Effects of Increased Market SizeGains from an Integrated Market: A Numerical ExampleEconomies of Scale and Comparative AdvantageThe Significance of Intraindustry TradeWhy Intraindustry Trade MattersCase Study: Intraindustry Trade in Action: The North American Auto Pact DumpingThe Economics of DumpingCase Study: Anti-Dumping as ProtectionReciprocal DumpingThe Theory of External EconomiesSpecialized SuppliersLabor Market PoolingKnowledge SpilloversExternal Economies and Increasing Returns22 Krugman/Obstfeld ?International Economics: Theory and Policy, Eighth EditionExternal Economies and International TradeExternal Economies and the Pattern of TradeTrade and Welfare with External EconomiesBox: Tinseltown EconomicsDynamic Increasing ReturnsEconomic Geography and Interregional TradeSummaryAppendix: Determining Marginal RevenueChapter OverviewIn previous chapters, trade between nations was motivated by their differences in factor productivity or relative factor endowments. The type of trade which occurred, for example of food for manufactures, is based on comparative advantage and is called interindustry trade. This chapter introduces trade based on economies of scale in production. Such trade in similar productions is called intraindustry trade, and describes, for example, the trading of one type of manufactured good for another type of manufactured good. It is shown that trade can occur when there are no technological or endowment differences, but when there are economies of scale or increasing returns in production.Economies of scale can either take the form of (1) external economies, whereby the cost per unit depends on the size of the industry but not necessarily on the size of the firm; or as (2) internal economies, whereby the production cost per unit of output depends on the size of the individual firm but not necessarily on the size of the industry. Internal economies of scale give rise to imperfectly competitive markets, unlike the perfectly competitive market structures that were assumed to exist in earlier chapters. This motivatesthe review of models of imperfect competition, including monopoly and monopolistic competition. The instructor should spend some time making certain that students understand the equilibrium concepts of these models since they are important for the justification of intraindustry trade.In markets described by monopolistic competition, there are a number of firms in an industry, each of which produces a differentiated product. Demand for its good depends on the number of other similar products available and their prices. This type of model is useful for illustrating that trade improves the trade-off between scale and variety available to a country. In an industry described by monopolistic competition, a larger market—such as that which arises through international trade—lowers average price (by increasing production and lowering average costs) and makes available for consumption a greater range of goods. While an integrated market also supports the existence of a larger number of firms in an industry, the model presented in the text does not make predictions about where these industries will be located.It is also interesting to compare the distributional effects of trade when motivated by comparative advantage with those when trade is motivated by increasing returns to scale in production. When countries are similar in their factor endowments, and when scale economies and product differentiation are important, the income distributional effects of trade will be small. You should make clear to the students the sharp contrast between the predictions of the models of monopolistic competition and the specific factors and Heckscher-Ohlin theories of international trade. Without clarification, some students may find the contrasting predictionsof these models confusing.Another important issue related to imperfectly competitive markets is the practice of price discrimination, namely charging different customers different prices. One particularly controversial form of price discrimination is dumping, whereby a firm charges lower prices for exported goods than for goods sold domestically. This can occur only when domestic and foreign markets are segmented. The economicsChapter 6 Economies of Scale, Imperfect Competition, and International Trade 23 of dumping are illustrated in the text using the example of an industry which contains a single monopolistic firm selling in the domestic and foreign market. Reverse dumping can also occur, whereby a producer sells a product at lower prices in the domestic market than in the foreign market. While there is no good economic justification for the view that dumping is harmful, it is often viewed as an unfair trade practice.The other type of economies of scale, external economies, has very different economic implicationsthan internal economies. Since external economies of scale occur at the industry level rather than the firm level, it is possible for there to be many small competitors in an industry, in contrast to the structure which develops under internal economies of scale. Under external economies, trade may not be beneficial to all countries and there may be some justification for protectionism. Dynamic scale economies, which arise when unit production costs fall with cumulative production over time, rather than with current levels of production, also provide a potential justification for protectionism. External economies of scale can also be important for explaining interregional trade (trade within a country). While some industries need to belocated near a particular factor (e.g., a natural resource), for others, the factors (e.g., skilled labor) are fairly mobile. Historical accidents may help explain the patterns then. This study of the patterns of economic interactions across space—either within or across countries—is known as economic geography.Answers to Textbook Problems1. Cases a and d reflect external economies of scale since concentration of the production of an industryin a few locations reduces the industry’s costs even when the scale of operation of individual firms remains small. External economies need not lead to imperfect competition. The benefits of geographical concentration may include a greater variety of specialized services to support industry operations and larger labor markets or thicker input markets. Cases b and c reflect internal economies of scale and occur at the level of the individual firm. The larger the output of a product by a particular firm, the lower its average costs. This leads to imperfect competition as in petrochemicals, aircraft, and autos.2. The profit maximizing output level of a monopolist occurs where marginal revenue equals marginalcost. Unlike the case of perfectly competitive markets, under monopoly marginal revenue is not equal to price. Marginal revenue is always less than price under imperfectly competitive markets because to sell an extra unit of output, the firm must lower the price of all units, not just the marginal one.3. By concentrating the production of each good with economies of scale in one country rather thanspreading the production over several countries, the world economy will use the same amount of labor to produce more output. In the monopolistic competition model, such aconcentration of labor benefits the host country, which can also capture some monopoly rents, while it may hurt the rest of the world which could then face higher prices on its consumption goods. In the external economies case, such monopolistic pricing behavior is less likely since imperfectly competitive markets are less likely.4. Although this problem is a bit tricky and the numbers don’t work out nicely, a solution does exist.The first step in finding the solution is to determine the equilibrium number of firms in the industry.The equilibrium number of firms is that number, n, at which price equals average cost. We know that AC= F/X+c, where F represents fixed costs of production, X represents the level of sales by each firm, and c represents marginal costs. We also know that P= c+ (1/bn), where P and b represent price and the demand parameter. Also, if all firms follow the same pricing rule, then X= S/n where S equals total industry sales. So, set price equal to average cost, cancel out the c’s and replace X by S/n.Rearranging what is left yields the formula n2= S/Fb. Substitute in S= 900,000 + 1,600,000 +3,750,000 = 6,250,000, F= 750,000,000 and b= 1/30,000. The numerical answer is that n= 15.8 firms.However, since you will never see 0.8 firms, there will be 15 firms that enter the market, not 16 firms since the last firm knows that it can not make positive profits. The rest of the solution is straight-forward. Using X= S/n, output per firm is 41,666 units. Using the price equation, and the fact that c= 5,000, yields an equilibrium price of $7,000.24 Krugman/Obstfeld ?International Economics: Theory andPolicy, Eighth Edition5. a. 17,000 + 150/n= 5,000,000,000n/S+ 17,000. With S US= 300 million, the number of automakersequals three. With S E= 533 million, the number of automakers equals four.b. P US= 17,000 + 150/3, P US= $17,050. P E= 17,000 + 150/4, P US= $17,037.50.c. 17,000 + 150/n= 5,000,000,000n/S+ 17,000. With S US+E= 833 million, the number of totalautomakers now equals five. This helps to explain some of the consolidation that has happenedin the industry since trade has become more free in recent decades, e.g., Ford acquiring Jaguar,Daimler-Benz acquiring Chrysler, etc.d. Prices fall in the United States as well as Europe to $17,030. Also, variety increases in bothmarkets: in the United States, consumers were able to choose between three brands before freetrade; now they can choose between five. In Europe, consumers were able to choose betweenfour brands before free trade; now they can also choose between five brands.6. This is an open-ended question. Looking at the answer to Question 11 can provide some hints. Twoother examples would be: Biotechnology and Aircraft design. Biotechnology is an industry in which innovation fuels new products, but it is also one where learning how to successfully take an idea and create a profitable product is a skill set that may require some practice. Aircraft design requires both innovations to create new planes that are safer and or more cost efficient, butit is also an industry where new planes are often subtle alterations of previous models and where detailed experience with one model may be a huge help in creating a new one.7. a. The relatively few locations for production suggest external economies of scale in production.If these operations are large, there may also be large internal economies of scale in production.b. Since economies of scale are significant in airplane production, it tends to be done by a smallnumber of (imperfectly competitive) firms at a limited number of locations. One such locationis Seattle, where Boeing produces airplanes.c. Since external economies of scale are significant in semiconductor production, semiconductorindustries tend to be concentrated in certain geographic locations. If, for some historical reason, a semiconductor is established in a specific location, the export of semiconductors by that countryis due to economies of scale and not comparative advantage.d. “True” scotch whiskey can only come from Scotland. The production of scotch whiskey requiresa technique known to skilled distillers who are concentrated in the region. Also, soil and climacticconditions are favorable for grains used in local scotch production. This reflects comparativeadvantage.e. France has a particular blend of climactic conditions and land that is difficult to reproduceelsewhere. This generates a comparative advantage in wine production.8. The Japanese producers are price discriminating across United States and Japanese markets, so thatthe goods sold in the United States are much cheaper than those sold in Japan. It may be profitable for other Japanese to purchase these goods in the United States, incur any tariffs and transportation costs, and resell the goods in Japan. Clearly, the price differential across markets must be non-trivial for this to be profitable.Chapter 6 Economies of Scale, Imperfect Competition, and International Trade 25 9. a. Suppose two countries that can produce a good are subject to forward-falling supply curves and are identical countries with identical curves. If one country starts out as a producer of a good,i.e., it has a head start even as a matter of historical accident, then all production will occur in thatparticular country and it will export to the rest of the world.b. Consumers in both countries will pay a lower price for this good when external economies aremaximized through trade and all production is located in a single market. In the present example, no single country has a natural cost advantage or is worse off than it would be under autarky. 10. External economies are important for firms as technology changes rapidly and as the “cutting edge”moves quickly with frequent innovations. As this process slows, manufacturing becomes moreroutine and there is less advantage conferred by external economies. Instead, firms look for low cost production locations. Since external economies are no longer important, firms find little advantage in being clustered, and it is likely that locations other than the high-wage original locations are chosen.11. a. i. Very likely due to the need to have a common pool of labor with such skills.ii. Somewhat likely due to the need for continual innovation and learning.b. i. Unlikely since it is difficult to see how the costs of a single firm would fall if other firms arepresent in the asphalt industry.ii. Unlikely because they are industries in which technology is more stable than in other industries such as software services or cancer research.c. i. Highly likely because having a great number of support firms and an available pool of skilledlabor in filmmaking are critical to film production.ii. Highly likely because film making is an industry in which learning is important.d. i. Somewhat likely in that it may be advantageous to have other researchers nearby.ii. Highly likely because such research builds on itself through a learning-by-doing process.e. i. Unlikely because it is difficult to see how the existence of another timber firm with lowercosts to another timber firm.ii. Unlikely due to the relatively stable technology involved in timber harvesting.。
第3章劳动生产率和比较优势:李嘉图模型一、概念题1.绝对优势(absolute advantage)答:绝对优势论是指由英国古典经济学的奠基人亚当·斯密提出的贸易理论,即各国以生产成本的绝对差异为基础、发挥各自的优势进行国际分工,并通过自由贸易增进共同利益的国际贸易理论斯密认为,国际贸易和国际分工的原因及基础是各国间存在的劳动生产率和生产成本的绝对差别。
一国如果在某种产品上具有比别国高的劳动生产率,就称该国在这一产品上就具有绝对优势。
2.贫民劳动论(pauper labor argument)答:贫民劳动论是指在国际贸易中,如果来自外国的竞争是建立在低工资的基础上,那么这种竞争是不公平的,而且会损害其他参与竞争国家的利益。
因此,贫民劳动论认为,为了保护本国利益,国内产业没有必要与低效率低工资的外国产业展开贸易。
但是,克鲁格曼却认为,贫民劳动论是对李嘉图比较优势的误解,因为本国决定进行贸易还是自己生产,关键是用本国自己的劳动力来衡量,与外国的低工资率并没有多大关系。
3.比较优势(comparative advantage)答:比较优势理论认为,国际贸易的基础并不限于劳动生产率上的绝对差别。
只要各国之间存在着劳动生产率上的相对差别,就会出现生产成本和产品价格的相对差别,从而使各国在不同的产品上具有比较优势,使国际分工和国际贸易成为可能。
根据李嘉图的比较优势贸易理论,每个国家都应集中生产并出口其具有“比较优势”的产品,进口其具有“比较劣势”的产品。
4.生产可能性边界(production possibility frontier)答:生产可能性边界又称“生产可能性曲线”或“产品转换曲线”,是指在技术不变和资源充分利用的情况下,社会或单个厂商把全部资源充分地和有效率地用于生产商品所能获得的最大产量的各种组合的曲线。
生产可能性边界用于说明减少一种商品的产出量可以增加另一种商品的产出量的可能性。
在曲线之外的任何点都是不可能得到的,资源不可能实现这种配置,曲线内的点都可以得到,资源容易实现这种配置,只有曲线上的点代表资源充分利用下的最优效率。
克鲁格曼《国际经济学》第8版笔记和课后习题详解第22章发展中国家:增长、危机和改革22.1复习笔记1.发展中国家的结构特征(1)四种收入类型的国家根据人均年收入水平,世界各国可分为四种主要类型:低收入国家、中低收入国家、中高收入国家和高收入国家。
前三类国家相对于发达国家而言处于一个落后的发展阶段。
(2)发展中国家的结构特征①存在政府对经济进行广泛和直接控制的历史,包括对国际贸易的限制、政府对大型工业企业的所有权或控制权、政府对国际金融交易的直接控制,以及政府消费占GNP的高比例。
②存在高通货膨胀的历史。
在许多国家,政府无法仅仅通过税收来支付其沉重的支出和国有企业的亏损,逃税行为盛行,许多经济活动转入地下,所以最简单的办法就是印制钞票。
当政府连续扩大货币供应以提取较高水平的铸币税时,发展中国家就会发生通货膨胀甚至恶性通货膨胀。
③在国内金融市场自由化的国家,信贷机构往往比较脆弱。
银行会频繁地把借入的资金贷给不良的或者有很大风险的项目。
贷款的发放可能是建立在私人关系而不是未来收益的基础上,政府防范金融风险的措施,往往由于不能胜任、没有经验和直接的欺诈而失效。
④一般倾向于实行钉住汇率,或者至少是在政府大量干预下的管理浮动。
政府限制汇率波动的措施不仅体现了政府控制通货膨胀的愿望,也体现了政府对于浮动汇率可能会使得发展中国家的货币汇率在相对脆弱的市场上发生大幅度波动的担忧。
⑤自然资源或农业产品是许多发展中国家出口的重要组成部分。
⑥规避政府控制、税收和管制的动因会使得行贿和勒索等腐败行为在许多发展中国家盛行。
在某些情况下,地下经济活动的发展可以通过恢复一定程度上基于市场的资源配置而有助于提高经济效率,但是数据表明腐败和贫困是交织在一起的。
(3)发展中国家五种主要的外部融资渠道①债券融资。
发展中国家有时会通过向外国居民个人出售债券来为其赤字融资。
②银行融资。
20世纪70年代初到80年代末,发展中国家从发达国家的商业银行直接借入了大量资金。
Overview of Section II:International Trade PolicySection II of the text is comprised of four chapters:Chapter 8The Instruments of Trade PolicyChapter 9The Political Economy of Trade PolicyChapter 10Trade Policy in Developing CountriesChapter 11Controversies in Trade Policyn Section II OverviewTrade policy issues figure prominently in current political debates and public policy discussions. Thefirst two chapters of this section of the text are concerned with the instruments of trade policy andthe arguments for free trade and managed trade. The second two chapters considerthese concepts in the context of specific sets of countries that face common problems. Throughout, the use of case studies provides the student with real world examplesthat clearly illustrate the theoretical arguments.Chapter 8 discusses various instruments of trade policy including tariffs, quotas, voluntary export restraints, and local content requirements. The effects of these policies on prices and trade volumes are determined in the context of a partial equilibrium framework. The chapter reviews the analytical toolsof consumer and producer surplus, and uses these tools to consider the welfareeffects of various protectionist measures. The specific incidents of traderestrictions presented as case studies include import quotas on sugar entering United States markets, voluntary export restraints on Japanese autos,and oil import quotas.Chapter 9 presents the set of ideas known as the political economy of trade theory. These ideas enableyou to understand why certain trade restrictions exist, despite the force of general economic arguments which suggest that they reduce aggregate welfare. Possible motivations for trade restrictions are identified as those which increase national welfare, such as the optimum tariff, and those which foster either incomeredistribution or the preservation of status quo. While sometimes politically popular, these motivations for trade restrictions ignore the possibility of retaliation and usually fail tests based upon basic welfare analysis. Trade agreements of the 1990s are discussed, including the Uruguay Round, and distinctionsare made between Free Trade Areas and Customs Unions as well as between tradecreation and trade diversion.Chapter 10 considers the possible uses of trade policies to promote the growth of developing economies. The chapter reviews the relative successes of different development strategies. It examines arguments for and the results of import-substituting industrialization. It also discusses the decline of import-substituting industrialization and the increase in trade liberalization in developing countries since the mid-1980s. The chapter concludes with a discussion of export led growth and the experience of the high performing Asian economies.Chapter 11 considers recent controversies in trade policy. The first part of the chapter considers thenotion of strategic trade policy, which first arose in the 1990s. Strategic trade policy refers to the use of trade (and other) tools for channeling resources to sectors targeted for growth by industrial country governments. The chapter presents some commonly voiced arguments for intervention in particular sectors of the economy, and then shows how these arguments are critically flawed. The second part of the chapter introduces more sophisticated arguments for strategic trade policy. The most persuasive of these is the existence of some form of market failure. The third part of the chapter considers the impact of rising trade on workers in developing countries, and more broadly, the debate over globalization. This debate has been argued in academia and policy circles, but also on the streets of Seattle, Genoa, and other cities hosting global economic summits. Finally, the chapter considers links between trade and the environment.Chapter 8The Instruments of Trade Policyn Chapter OrganizationBasic Tariff AnalysisSupply, Demand, and Trade in a Single IndustryEffects of a TariffMeasuring the Amount of ProtectionCosts and Benefits of a TariffConsumer and Producer SurplusMeasuring the Costs and BenefitsOther Instruments of Trade PolicyExport Subsidies: TheoryCase Study: Europe’s Common Agricultural PolicyImport Quotas: TheoryCase Study: An Import Quota in Practice: U.S. SugarVoluntary Export RestraintsCase Study: A Voluntary Export Restraint in Practice: Japanese Autos Local Content RequirementsBox: American Buses, Made in HungaryOther Trade Policy InstrumentsThe Effects of Trade Policy: A SummarySummaryAppendix I: Tariff Analysis in General EquilibriumA Tariff in a Small CountryA Tariff in a Large CountryAppendix II: Tariffs and Import Quotas in the Presence of Monopoly The Model with Free TradeThe Model with a TariffThe Model with an Import QuotaComparing a Tariff with a Quota nChapter OverviewThis chapter and the next three focus on international trade policy. Students will have heard various arguments for and against restrictive trade practices in the media. Some of these arguments are sound and some are clearly not grounded in fact. This chapter provides a framework for analyzing the economic effects of trade policies by describing the tools of trade policy and analyzing their effects on consumers and producers in domestic and foreign countries. Case studies discuss actual episodes of restrictive trade practices. An instructor might try to underscore the relevance of these issues by having students scan newspapers and magazines for other timely examples of protectionism at work.The analysis presented here takes a partial equilibrium view, focusing on demand and supply in one market, rather than the general equilibrium approach followed in previous chapters. Import demand and export supply curves are derived from domestic and foreign demand and supply curves. There are a number of trade policy instruments analyzed in this chapter using these tools. Some of the important instruments oftrade policy include specific tariffs, defined as taxes levied as a fixed charge for each unitof a good imported; ad valorem tariffs, levied as a fraction of the value of the imported good; export subsidies, which are payments given to a firm or industry that ships a good abroad; import quotas, which are direct restrictions on the quantity of some good that may be imported; voluntary export restraints, which are quotas on trading that are imposed by the exporting country instead of the importing country; and local content requirements, which are regulations that require that somespecified fraction of a good is produced domestically.The import supply and export demand analysis demonstrates that the imposition of a tariff drives a wedge between prices in domestic and foreign markets, and increases prices in the country imposing the tariffand lowers the price in the other country by less than the amount of the tariff. This contrasts with most textbook presentations which make the small country assumptionthat the domestic internal priceequals the world price times one plus the tariff rate. The actual protection provided by a tariff willnot equal the tariff rate if imported intermediate goods are used in the productionof the protected good. The proper measurement, the effective rate of protection, is described in the text and calculated for a sample problem.The analysis of the costs and benefits of trade restrictions require tools of welfare analysis. The text explains the essential tools of consumer and producer surplus. Consumer surplus on each unit sold is defined as the difference between the actual price and the amount that consumers would have been willing to pay for the product. Geometrically, consumer surplus is equal to the area under the demand curve and above the price of the good. Producer surplus is the difference between the minimum amount for which a producer is willing to sell his product and the price which he actuallyreceives. Geometrically, producer surplus is equal to the area above the supply curve and below the price line. These tools are fundamental to the stu dent’s understanding of the implications of trade policies and should be developed carefully.The costs of a tariff include distortionary efficiency losses in both consumption and production. A tariff provides gains from terms of trade improvement when and if it lowers the foreign export price. Summing the areas in a diagram of internal demand and supply provides a method for analyzing the net loss or gain from a tariff.Other instruments of trade policy can be analyzed with this method. An export subsidy operates inexactly the reverse fashion of an import tariff. An import quota has similar effects as an import tariffupon prices and quantities, but revenues, in the form of quota rents, accrue to foreign producers of the protected good. Voluntary export restraints are a form of quotas in which import licenses are held by foreign governments. Local content requirements raise the price of imports and domestic goods and do not result ineither government revenue or quota rents.Throughout the chapter the analysis of different trade restrictions are illustrated by drawing upon specific episodes. Europe’s common agricultural policy provides and example of export subsidies in action. The case study corresponding to quotas describes trade restrictions on U.S. sugar imports. Voluntary export restraints are discussed in the context of Japanese auto sales to the United States. The oil import quota in the United States in the 1960’s provides an example of a local content scheme.There are two appendices to this chapter. Appendix I uses a general equilibrium framework to analyzethe impact of a tariff, departing from the partial equilibrium approach taken in the chapter. When a small country imposes a tariff, it shifts production away from its exported good and toward the importedgood. Consumption shifts toward the domestically produced goods. Both the volume of trade and welfare of the country decline. A large country imposing a tariff can improve its terms of trade by an amount potentially large enough to offset the production and consumption distortions. For a large country, a tariff may be welfare improving.Appendix II discusses tariffs and import quotas in the presence of a domestic monopoly. Free trade eliminates the monopoly power of a domestic producer and the monopolist mimics the actions of a firm in a perfectly competitive market, setting output such that marginal cost equals world price. A tariff raises domestic price.The monopolist, still facing a perfectly elastic demand curve, sets output such that marginal cost equals internal price. A monopolist faces a downward sloping demand curve under a quota. A quota is not equivalent to a tariff in this case. Domestic production is lower and internal price higher when a particular level of imports is obtained through the imposition of a quota rather than a tariff.n Answers to Textbook Problems1. T he import demand equation, MD, is found by subtracting the home supply equationfrom the home demand equation. This results in MD 80 40 P. Without trade, domestic prices and quantities adjust such that import demand is zero. Thus, the price in the absence of trade is 2.2. a. Foreign’s export supply curve, XS, is XS 40 40P. In the absenceof trade, the price is 1.b. When trade occurs, export supply is equal to import demand, XS MD. Thus,using the equations from Problems 1 and 2a, P 1.50, and the volume oftrade is 20.3. a. The new MD curve is 80 40 (P t) where t is the specific tariff rate,equal to 0.5. (Note: In solving these problems, you should be careful aboutwhether a specific tariff or ad valorem tariff is imposed. With an ad valoremtariff, the MD equation would be expressed as MD 80 40 (1 t)P.)The equation for the export supply curve by the foreign country is unchanged.Solving, we find that the world price is $1.25, and thus the internal price at home is $1.75. The volume of trade has been reduced to 10, and the totaldemand for wheat at home has fallen to 65 (from the free trade level of 70).The total demand for wheat in Foreign has gone up from 50 to 55.b. andc. The welfare of the home country is best studied using the combinednumerical and graphical solutions presented below in Figure 8.1.Figure 8.1where the areas in the figure are:a.55(1.75 1.50) 0.5(55 50)(1.75 1.50) 13.125b. 0.5(55 50)(1.75 1.50) 0.625c. (65 55)(1.75 1.50) 2.50d. 0.5(70 65)(1.75 1.50) 0.625e. (65 55)(1.50 1.25) 2.50Consumer surplus change: (a b c d ) 16.875. Producersurplus change: a 13.125. Government revenue change: c e 5.Efficiency losses b d are exceeded by terms of trade gain e. (Note: In the calculations for the a, b, and d areas, a figure of 0.5 shows up. This isbecause we are measuring the area of a triangle, which is one-half of the area of the rectangle defined by the product of the horizontal and vertical sides.)4. U sing the same solution methodology as in Problem 3, when the home country isvery small relative to the foreign country, its effects on the terms of trade are expected to be much less. The small country is much more likely to be hurt by its imposition of a tariff. Indeed, this intuition is shown in this problem. The free trade equilibrium is now at the price $1.09 and the trade volume is now $36.40.With the imposition of a tariff of 0.5 by Home, the new world price is $1.045, the internal home price is $1.545, home demand is 69.10 units, home supply is50.90, and the volume of trade is 18.20. When Home is relatively small, theeffect of a tariff on world price is smaller than when Home is relatively large.When Foreign and Home were closer in size, a tariff of 0.5 by home lowered world price by 25 percent, whereas in this case the same tariff lowers world price by about 5 percent. The internal Home price is now closer to the free trade price plus t than when Home was relatively large. In this case, the government revenues from the tariff equal 9.10, the consumer surplus loss is 33.51, and the producer surplus gain is 21.089. The distortionary losses associated with the tariff(areasb d) sum to 4.14 and the terms of trade gain (e) is 0.819. Clearly, in thissmall country example, the distortionary losses from the tariff swamp the terms of trade gains. The general lesson is the smaller the economy, the larger the losses from a tariff since the terms of trade gains are smaller.5. E RP (200 1.50 200)/100 100%6. T he effective rate of protection takes into consideration the costs of importedintermediate goods. Here, 55% of the cost can be imported, suggesting with nodistortion, home value added would be 45%. A 15% increase in the price of ethanol, though, means home value added could be as high as 60%. Effective rate ofprotection (V t V w)/V w, where V t is the value added in the presence of trade policies, and V w is the value added without trade distortions. In this case, we have (60 45)/45 33% effective rate of protection.7. W e first use the foreign export supply and domestic import demand curves todetermine the new world price. The foreign supply of exports curve, with aforeign subsidy of 50 percent per unit, becomes XS 40 40(1 0.5) P.The equilibrium world price is 1.2 and the internal foreign price is 1.8. Thevolume of trade is 32. The foreign demand and supply curves are used to determine the costs and benefits of the subsidy. Construct a diagram similar to that in the text and calculate the area of the various polygons. The government must provide(1.8 1.2) 32 19.2 units of output to support the subsidy. Foreignproducers surplus rises due to the subsidy by the amount of 15.3 units of output.Foreign consumers surplus falls due to the higher price by 7.5 units of the good.Thus, the net loss to Foreign due to the subsidy is 7.5 19.2 15.3 11.4 units of output. Home consumers and producers face an internal price of 1.2 as a result of the subsidy. Home consumers surplus rises by 70 0.3 0.5 (6 0.3)21.9, while Home producers surplus falls by 44 0.3 0.5(6 0.3) 14.1,for a net gain of 7.8 units of output.8. a. False, unemployment has more to do with labor market issues and the businesscycle than with tariff policy.b. False, the opposite is true because tariffs by large countries can actuallyreduce world prices which helps offset their effects on consumers.c. This kind of policy might reduce automobile production and Mexico, but alsowould increase the price of automobiles in the United States, and wouldresult in the same welfare loss associated with any quota.9. A t a price of $10 per bag of peanuts, Acirema imports 200 bags of peanuts. Aquota limiting the import of peanuts to 50 bags has the following effects:a. The price of peanuts rises to $20 per bag.b. The quota rents are ($20 $10) 50 $500.c. The consumption distortion loss is 0.5 100 bags $10 per bag $500.d. The production distortion loss is 0.5 50 bags $10 per bag $250.10. The reason is largely that the benefits of these policies accrue to a small groupof people and the costs are spread out over many people. Thus, those that benefit care far more deeply about these policies. These typical political economyproblems associated with trade policy are probably even more troublesome inagriculture, where there are long standing cultural reasons for farmers andfarming communities to want to hold onto their way of life, making the interests even more entrenched than they would normally be.11. It would improve the income distribution within the economy since wages inmanufacturing would increase, and real incomes for others in the economy would decrease due to higher prices for manufactured goods. This is true only under the assumption that manufacturing wages are lower than all others in the economy. If they were higher than others in the economy, the tariff policies would worsen the income distribution.(注:素材和资料部分来自网络,供参考。