LabVIEW中实现Oracle大对象数据存储的一种方法
- 格式:pdf
- 大小:301.35 KB
- 文档页数:3
LABVIEW数据文件的存储与回放
一、实验目的
(1)了解并掌握虚拟仪器中常用的数据文件格式和特点。
(2)掌握数据文件操作的基本步骤,学习灵活操作文件中数据的常用技巧和方法。
二、实验设备
1、安装有LabVIEW 7 Express计算机
2、安装有NI-DAQ 7的计算机
3、支持的数据采集设备(DAQ)(以NI公司提供的NI6014数据采集卡为例)。
三、实验任务描述
1、利用LabVIEW编程,设计出若干个子VI,利用它们分别完成不同类型数据的写入。
要求程序能够实现单个数据写入还是连续写入的切换功能。
2、设计主程序,主程序运行时首先弹出窗口请求输入数据保存格式,然后根据选择的格式运行不同的分支子程序,分支子程序采用SubPanel子面板的方法动态调用。
3、设计程序保存和读取二维或多维数组,要求保留维数信息。
(可使用头信息的方式或采用spreadsheet表单的数据格式保存)
四. 实验原理
完成LabVIEW程序,使其具备数据写入与读取功能,文件格式和数据类型能够在二进制和文本两种之间切换。
单独的实现方法可以参考任务书附带的范例。
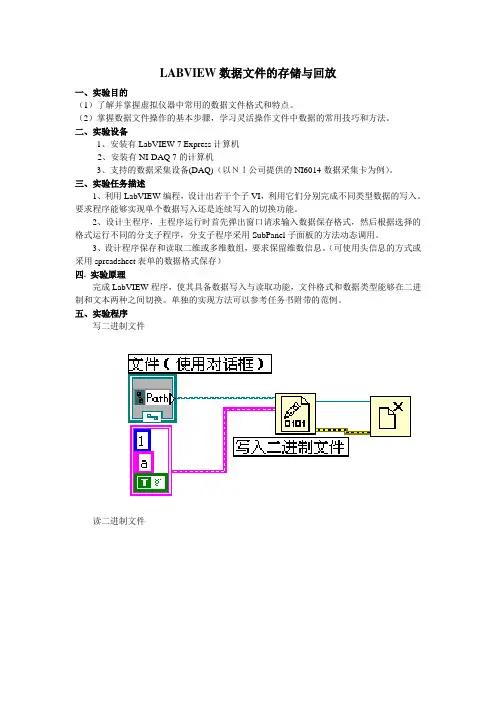
五、实验程序
写二进制文件
读二进制文件
写文本文件
读文本文件。
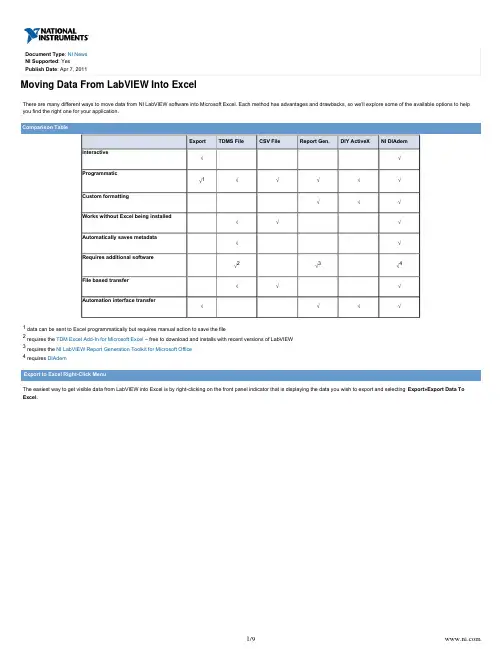
Document Type NI News:You can use the method with any graph, chart, table, array, or digital data control. Graphs and charts export only the visible data, meaning you can use the graph tools tozoom in on a region of interest and export only the data you care about. Tables export only the currently selected data, whereas arrays export all of the data in the array.You can also use an Invoke Node to programmatically call the and methods. The following code snippet graphs a generated sine wave and thenExport Data to Excel Export Plot Data To ExcelExport Plot Data To Excelexports the plot data to Excel twice in order to show the two different methods. The difference between the two methods is that the method exports only the specifiedExport Data to Excelplot, whereas the method exports data from all plots. This simple example has only one plot, so both methods yield identical results.If you use this technique, note that Excel must be installed on the same machine as LabVIEW and there is no programmatic access to save the Excel file. Consequently, this approach is best suited to applications where you are interactively investigating data and looking for a quick way to send the data to Excel for analysis or distribution.Note: The Export To Excel feature was introduced in LabVIEW 2010 and is not available in earlier versions.NI defined the file format in response to the need for a fast, efficient way of saving well-documented measurement data. Although TDMS is not Technical Data Management Streaming (TDMS)natively supported by Excel, there is a free Excel add-in that you can use to import your data into Excel.The easiest way to create a TDMS file is to use the Express VI located in the palette.Write To Measurement File File I/OAs with all Express VIs, you will see a configuration dialog when you drop the VI on your block diagram. This particular Express VI can save to more than just TDMS, so be sure to select Binary (TDMS)File Formatin the section. You have several options for how to save the file and what to do when the selected file already exists.Settings…You can save to a series of files using a time- or file-size-based schedule by clicking on the button.This results in a very simple block diagram:LabVIEW also provides an API for writing to TDMS files without using the Express VI for those who prefer more manual control.TDM Excel Add-In for Microsoft ExcelOnce you have some data stored in a TDMS file, you need to make sure you have the . You may have installed the add-in when you installed LabVIEW, if not,Open With»Excel Importeryou can always download it for free. With the add-in installed, you can simply right-click on a TDMS file and select ,then Excel opens and displays your data.The first worksheet in Excel always contains the file properties and other metadata.Each group of channels is loaded as a separate worksheet and each channel of data is shown in its own column.ExcelTDM DataPluginso you are free to share your workbook with any Excel user.The (CSV) file format is widely supported, so you can open the file in Excel, but also import it into other spreadsheet, database, or analysis tools. CSV files are comma-separated valueshuman-readable text files with columns separated by commas and rows separated by newlines. This normally requires us to do a little data manipulation in LabVIEW to get the measurement data into an appropriate format because we cannot use complex data types such as waveforms, nor can we store numbers in the more efficient binary formats used internally by LabVIEW and TDMS files.Write To Spreadsheet File File I/OYou can use the VI, found in the palette, to create CSV files to open in Excel.For a simple 1D array of numbers, you don’t actually need to do any additional processing. By default, the VI uses a tab (/t) as its delimiter so you just need to specify aWrite To Spreadsheet Filecomma (,) as its delimiter instead.A more complex example involves writing the data returned by an Express VI, such as the or , to a CSV file with time in one column and the measured value in theDAQ Assistant Simulate Signalnext. The code snippet below shows how you might convert the dynamic data into an array of waveforms; then and then for each waveform in the array convert all of the measured values toWrite To Spreadsheet Filestrings; then formulate a time string for each sample; and finally build a 2D array of these strings to pass to the VI.You can open the CSV file with Excel and you will see your data correctly split out into columns and rows.world that Excel was created for. To fix this, you have to format the cells containing time data with a custom format as shown below.One of the drawbacks is that you cannot save this formatting information in the CSV file so it must be manually repeated every time you bring a new file into Excel. Although once in Excel, you can save the data as an Excel file to preserve the formatting for subsequent use.NI LabVIEW Report Generation Toolkit for Microsoft OfficeThe gives you a lot of flexibility when it comes to sending data to Excel. One of the big advantages is that you can create a template workbook in Excel and save it as an .xltx or .xlt file and then use LabVIEW to populate your template with data when your VI runs. This code snippet shows how you can use the MS Office ReportExpress VI to populate such a template.When you create the template, you can customize the formatting just like any other Excel workbook. You then name the cells where you will put data (for tables or arrays you just need to name thetop-left cell).print the Excel file.often used to automate complete reports instead of just sending simple data to Excel.In addition to the Express VI, the Report Generation Toolkit gives you a full API you can use to automate Excel. The example code below creates output similar to the example above but does not require a template workbook. Also, instead of using an image of a LabVIEW graph, it uses the Excel charting tool to draw a graph.Running the above example yields the following output:The Report Generation Toolkit is built on top of the Excel ActiveX interface. You can use this API either through direct ActiveX calls or the Microsoft.Office.Interop.Excel .NET assembly to automatically create Excel files. The code snippet below produces essentially the same result as the Report Generation Toolkit example but instead uses a .NET interop assembly to communicate with Excel. As you can see, the code ends up a little more complex but anyone with a background in ActiveX/.NET programming should feel right at home.Here is the output of the above code snippet:DIAdem as an AlternativeIf you have more advanced data needs, whether it be larger datasets, an abundance of files, or particular reporting requirements, you should also consider DIAdem. DIAdem is a tool for quickly locating, analyzing, and reporting measurement data and is often better suited to the many demands engineers have of their data tools.To learn more about gaining productivity by using DIAdem rather than Excel, .read moreLegalThis material is protected under the copyright laws of the U.S. and other countries and any uses not in conformity with the copyright laws are prohibited, including but not limited to reproduction,DOWNLOADING, duplication, adaptation and transmission or broadcast by any media, devices or processes.。
壹这里说的测试测量数据是指配合NI的硬件,如PXI卡采集所得的测试测量数据。
对其他的测试测量应用场景我还不熟悉。
NI原先是缺乏一个比较优秀的测试测量数据存储方案的,NI后来也意识到了这个问题,于是在德国收购了一家公司,这家公司专做数据存储(也包括显示、报表等),于是NI在数据的采集、存储、显示这方面的产品线已经比较齐全了。
NI现在主推的一个数据存储逻辑模型叫做TDM(Technical Data Management),具体的方案可见:NI TDM Data Model这个模型的特点可以简单概括为:清晰的层次结构以及支持各层次的描述性信息。
具体来讲,一个TDM模型的数据文件可以分为三层,分别为文件(File)、组(Group)和通道(Channel),在每个层次上,都有NI定义好的一些属性,同时,用户也可以自定义属性。
这样的一种数据模型很容易被理解和接受。
比较符合实际的应用需求。
比如用NI的采集卡采集电压数据。
一块卡上一共8个通道。
每个通道每次采集的数据都可以保存为一个“通道(channel)”,8个通道一次采集的数据可以组成一个组(group),每天采集一次,n天就形成n个组,每个组都有8个通道,所有的数据都写在同一个文件(file)里。
其他卡采集的数据放在不同的文件中。
除了直接采集到的数据(可称乊为Raw Data)乊外,总要写点其他信息的,比如采集卡到底是什么型号,每次采集都是谁来完成,采集的是电压还是电流,单位是伏特还是千伏等等。
这些信息就称为描述性信息(Meat Data)。
这些信息写在别的文件里面总不太容易管理,最好写在一个文件中。
因此TDM模型也支持将这些描述性信息写在同一个文件中。
注意一下,我在这里说的是TDM的“逻辑”模型,幵不是指他的物理存储结构。
在NI,有数种文件栺式都支持TDM的模型,但是他们的物理存储方式大相径庭,这个以后再写。
这种TDM模型的测试测量数据文件,是NI软件平台中通用的文件,除了LabVIEW外,很多其他的NI软件产品都支持这种模型,比如DIAdem、CVI、Singal Express等等。
LabVIEW中的数据存储和数据库连接在使用LabVIEW进行数据存储和数据库连接方面,有几种常见的方法。
LabVIEW是一个用于控制和测量应用程序的图形化编程环境,可以方便地将数据存储到本地文件或连接到数据库以进行数据分析和管理。
一、数据存储在LabVIEW中,可以使用多种方式将数据存储到本地文件中。
以下是几种常见的方法:1. 本地文件保存:LabVIEW提供了多个函数和工具,可以将数据保存到本地文件,例如将数据以文本形式写入到文本文件中,或者以二进制形式写入到二进制文件中。
可以使用"Write to Text File"或"Write Binary File"函数来实现这一功能。
2. TDMS文件存储:TDMS(Technical Data Management Streaming)是一种二进制数据格式,可以有效地存储和管理大量的测量数据。
LabVIEW中提供了TDMS文件读写函数,可以方便地将数据保存为TDMS格式文件,并可以随时读取和处理这些数据。
3. 数据库存储:LabVIEW可以通过连接到数据库,将数据保存到数据库中。
根据具体的需求和数据库类型,可以选择不同的数据库连接方式,如ODBC、等。
通过适当的配置和调用数据库相关的函数,可以方便地将数据保存到数据库表中。
二、数据库连接LabVIEW支持与多种类型的数据库进行连接,例如MySQL、SQLite、Oracle等。
以下是几种常见的数据库连接方式:1. ODBC连接:ODBC(Open Database Connectivity)是一种通用的数据库访问接口,可以让应用程序与不同类型的数据库进行连接。
在LabVIEW中,可以使用ODBC驱动程序连接到各种支持ODBC的数据库。
通过配置ODBC数据源,可以方便地进行数据库连接和数据操作。
2. 连接:是一种用于访问数据库的.NET框架组件,可以连接到各种类型的数据库。
LabVIEW中的数据存储和数据库连接技术数据存储和数据库连接是LabVIEW中非常重要的技术,它们为LabVIEW开发者提供了方便快捷的数据处理和分析能力。
本文将详细介绍LabVIEW中的数据存储和数据库连接技术,包括数据文件的存储和读取、数据处理和分析、数据库连接和操作等方面。
一、数据文件的存储和读取在LabVIEW中,数据文件的存储和读取非常简便,可以使用各种文件格式进行保存和加载。
LabVIEW支持的常见文件格式包括文本文件(.txt)、电子表格文件(.xls、.xlsx)、二进制文件(.dat)等。
使用这些文件格式可以将数据方便地保存到本地硬盘,并在需要时进行读取和处理。
LabVIEW提供了丰富的文件I/O函数和工具,使得数据文件的存储和读取变得非常容易。
通过使用文件I/O函数,可以实现对数据文件的打开、读取、写入和关闭等操作。
同时,LabVIEW还提供了对文件属性和元数据进行访问和修改的功能,使得对数据文件的管理更加方便。
二、数据处理和分析LabVIEW作为一款强大的数据处理和分析工具,提供了丰富的函数和工具库,可以进行各种数据处理和分析操作。
无论是简单的数据过滤、平滑和插值,还是复杂的信号处理、频谱分析和图像处理,LabVIEW都可以提供相应的函数和工具来满足需求。
在LabVIEW中,数据处理和分析一般通过模块化的方式进行。
通过将不同的处理步骤封装成子VI(Virtual Instruments),可以实现对复杂数据处理和分析流程的模块化和重用。
这种方式能够提高开发效率和代码的可读性,使得数据处理和分析变得更加简单和易于维护。
三、数据库连接和操作LabVIEW提供了多种方式来连接和操作数据库,使得LabVIEW与各种数据库系统进行无缝集成。
在LabVIEW中,可以使用数据库连接工具包(Database Connectivity Toolkit)来实现对常见数据库系统(如MySQL、SQLite、Oracle等)的连接和操作。
LabVIEW与数据存储实现数据的采集存储与查询数据在现代科学研究与工程领域中起着至关重要的作用。
采集、存储和查询数据是研究人员和工程师日常工作的一个重要组成部分。
本文将介绍LabVIEW与数据存储技术相结合的方式,实现数据的采集、存储和查询。
1. 简介LabVIEW(Laboratory Virtual Instrument Engineering Workbench)是一种图形化编程环境,它可以帮助用户轻松地采集、分析和可视化各种数据。
LabVIEW具有使用简单、功能强大和广泛应用等特点,因此成为了许多科学研究和工程领域的首选工具。
2. 数据采集LabVIEW提供了丰富的工具和函数,用于实现数据的采集。
用户可以使用传感器、仪器或其他设备连接到计算机,并使用LabVIEW搭建数据采集系统。
通过拖拽和连接各种功能模块,用户可以创建一个定制的测量和采集系统。
LabVIEW支持的硬件种类繁多,包括但不限于模拟输入/输出、数字输入/输出、数据采集卡等。
3. 数据存储在数据采集的过程中,数据的存储是必不可少的。
LabVIEW提供了多种数据存储的方法。
其中,最常用的方式之一是将数据保存在本地文件中。
LabVIEW支持多种文件格式,如文本文件、电子表格文件和二进制文件等。
用户可以根据自己的需要选择合适的文件格式。
此外,LabVIEW还支持将数据存储到数据库中,如Microsoft SQL Server、MySQL等。
通过使用数据库工具箱,用户可以方便地将采集到的数据存储到数据库中,并进行灵活的查询和管理。
4. 数据查询LabVIEW提供了许多灵活的工具和函数,用于数据查询和分析。
用户可以使用内置的查询工具进行数据的筛选、排序和统计。
此外,还可以使用自定义的查询语句对数据进行高级查询。
LabVIEW支持使用SQL(Structured Query Language)进行数据库查询,用户可以根据自己的需要编写SQL语句,灵活地对数据进行查询和分析。
LabVIEW中的文件操作和数据存储LabVIEW是一种用于实时数据采集、处理和分析的高级编程语言和开发环境。
它在科学研究、工程控制以及实验室和工业自动化等领域广泛使用。
在LabVIEW中,文件操作和数据存储是非常重要的功能,本文将介绍LabVIEW中的文件操作和数据存储的相关知识。
一、LabVIEW文件操作在LabVIEW中,文件操作是指对文件进行读取、写入、创建和删除等操作。
通过文件操作,我们可以实现将程序生成的数据保存到文件中,或者从文件中读取数据进行处理和分析。
1. 文件读取在LabVIEW中,我们可以使用“Read From File”函数来读取文件中的数据。
这个函数可以读取文本文件、二进制文件以及其他格式的文件。
2. 文件写入与文件读取相反,LabVIEW中的“Write To File”函数可以将数据写入文件中。
我们可以选择写入文本文件或者二进制文件,具体写入的格式可以根据实际需要选择。
3. 文件创建如果需要创建新的文件,可以使用“Create File”函数。
该函数可以创建一个新的文本文件或者二进制文件,并指定文件的名称和路径。
4. 文件删除在LabVIEW中,删除文件可以使用“Delete File”函数。
这个函数可以指定要删除的文件的名称和路径,从而实现删除操作。
二、LabVIEW数据存储数据存储是指将生成的数据保存在内存中或者保存到磁盘上的过程。
在LabVIEW中,我们可以使用数组、矩阵和表格等结构来存储和管理数据。
1. 数组数组是LabVIEW中最常用的数据结构之一。
我们可以使用数组来存储一维或者多维的数据。
LabVIEW提供了丰富的数组操作函数,可以对数组进行排序、过滤、查找等操作。
2. 矩阵与数组类似,矩阵也是一种存储和处理数据的结构。
在LabVIEW 中,我们可以使用矩阵进行矩阵运算、线性代数等相关操作。
LabVIEW提供了一系列矩阵操作函数,可以方便地进行矩阵运算。
LabVIE W如何在内存中保存数据布尔数据LabVIE W用8位二进制数保存布尔数据。
如值为零,则布尔值为F ALSE。
所有非零的值都表示TR UE。
单字节整型单字节整数(有符号和无符号)为8位二进制格式。
双字节整型双字节整数(有符号和无符号)为16位二进制格式。
长整型长整数(有符号和无符号)为32位二进制格式。
64位整型64位整数(有符号和无符号)为64位二进制格式。
定点定点数(有符号和无符号)为64位二进制格式。
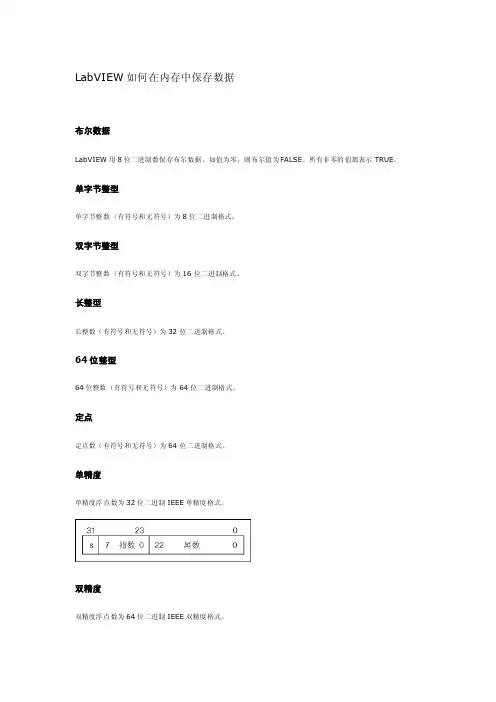
单精度单精度浮点数为32位二进制IEE E单精度格式。
双精度双精度浮点数为64位二进制IEE E双精度格式。
扩展精度扩展精度浮点数为IEE E 80位扩展格式。
注:在某些情况下,扩展精度浮点数可能为64位、96位或128位IEE E扩展精度格式。
具体情况因计算机处理器而异。
最常见的是80位。
单精度复数单精度浮点复数由32位二进制IE EE单精度的实数和虚数组成。
双精度复数双精度浮点复数由64位二进制IE EE双精度的实数和虚数组成。
扩展精度复数扩展精度浮点复数由IE EE扩展精度的实数和虚数组成。
扩展精度浮点数为IEE E 80位扩展格式。
在浮点数和复数中,s为符号位(0代表正,1代表负),指数为偏移指数(底数为2),而尾数为[0,1]范围内的数。
时间标识LabVIE W将时间标识保存为一个含四个整数的簇,其中前两个带符号整数(64位二进制)表示自1904年1月1日周五凌晨[01-01-1904 00:00:00]以来无时区影响的所有秒数。
后两个不带符号整数(64位二进制)表示小数秒部分。
关于时间标识的更多信息,请访问ni.com的NI开发者园地。
数组LabVIE W将数组保存为句柄(即指向指针的指针),包含以32位二进制整数表示的维度大小,随后是数组数据本身。
基于Labview的数据保存The date consersation based on LabVIEW杨建伟 郑琼华 沈昱明(上海理工大学,上海 200093)摘 要:在单片机—PC机的串口通信中, 以LABVIEW为开发平台,根据PC侧对串口采集到数据的显示、保存、回读的不同需要,提出了相应的解决办法,编写了PC侧的程序。
关键词:虚拟仪器 串口通信 数据保存Abstract:Microcontroller communicate with computer based on LabVIEW platform,according to the different need of display、conservasion and review of data.Give the relevant way to solve the problem , and compile the programme of computer.Keywords:LabVIEW RS232 Data conservasion0 引言LabVIEW是一种基于图形编程语言的开发环境。
它与传统编程语言有着诸多相似之处,如相似的数据类型、数据流控制结构、程序调试工具等。
但二者最大的区别在于: 传统编程语言是用文本语言编程, 而LabVIEW 用图形语言( 即各种图标、图形符号、连线等) 编程 ,编程简单方便, 界面形象直观, 具有强大的数据可视化分析和仪器控制能力。
Labview有丰富的文件操作函数库,可以方便地进行文件的读写。
Labview可以读写文本文件、数据报表文件、二进制文件和测试文件。
主程序中从VISA read的read buffer 端读上来的数据需要转换成表格数据进行保存,数据的保存分为两个阶段。
第一阶段,通过表单形式(带时间头)显示在主程序界面,方便用户直观查看测试参数是否已满足要求。
第二阶段,把表单数据保存到Excel文件中,可供用户打印查询。
LabVIEW中的数据存储与数据库连接LabVIEW是一种专业的可视化编程语言和开发环境,广泛应用于工程、科学和教育领域。
在LabVIEW中,数据的存储和数据库的连接是非常重要的功能。
本文将介绍如何使用LabVIEW进行数据存储和数据库连接。
一、数据存储在LabVIEW中,可以使用多种方式进行数据存储,包括本地文件存储和远程服务器存储。
下面将介绍两种常用的数据存储方法。
1. 本地文件存储LabVIEW提供了丰富的文件操作函数和工具,可以方便地进行数据的读写和存储。
可以使用文件I/O函数进行文件的创建、打开、读取和写入操作。
首先,通过使用"Create File"函数创建一个文件,然后使用"Write to Binary File"函数将数据写入文件中。
需要注意的是,要确保数据的格式与文件的格式相匹配,以便正确读取和解析数据。
此外,LabVIEW还提供了"Read from Binary File"函数用于从文件中读取数据。
2. 远程服务器存储如果需要在LabVIEW应用程序中远程存储数据,可以使用网络通信功能,将数据传输到远程服务器中进行存储。
LabVIEW支持各种网络通信协议,如TCP/IP、UDP等。
通过使用TCP/IP协议,可以与远程服务器建立连接,并使用"TCP Write"函数将数据发送到服务器,服务器接收数据后进行存储。
类似地,可以使用"TCP Read"函数从服务器读取数据。
二、数据库连接除了本地文件存储,LabVIEW还支持与数据库进行连接,以实现数据的存储和查询。
下面将介绍两种常用的数据库连接方法。
1. 使用ODBC连接ODBC(Open Database Connectivity)是一种用于访问数据库的标准接口。
在LabVIEW中,可以使用ODBC函数库进行数据库的连接和操作。
LabVIEW中的数据存储和数据库操作LabVIEW(Laboratory Virtual Instrument Engineering Workbench)是一种图形化编程环境,常用于数据采集、控制系统和实验室自动化等应用。
在LabVIEW中,数据存储和数据库操作是非常关键的功能。
本文将介绍LabVIEW中的数据存储和数据库操作的方法和技巧。
一、数据存储在LabVIEW中,数据存储可以通过不同的方式实现,包括文本文件、二进制文件和TDMS文件等。
1. 文本文件存储文本文件存储是最基本和常见的数据存储方式。
在LabVIEW中,可以使用Write to Text File和Read from Text File等函数来实现文本文件的写入和读取。
通过这些函数,可以将数据以文本形式保存到文件中,并在需要时读取出来进行处理。
2. 二进制文件存储二进制文件存储可以更高效地保存和读取数据。
LabVIEW提供了Write Binary File和Read Binary File等函数来实现二进制文件的写入和读取。
与文本文件存储不同的是,二进制文件存储可以直接保存变量的二进制值,而无需进行数据类型转换和解析。
这使得二进制文件存储更加快速和高效。
3. TDMS文件存储TDMS(Technical Data Management Streaming)文件是LabVIEW中提供的一种特殊的数据存储格式。
相比于文本文件和二进制文件,TDMS文件具有更好的可扩展性和兼容性。
通过使用TDMS文件,可以将多个通道的数据以层次结构的方式进行存储,并且可以方便地进行数据筛选和导入导出操作。
二、数据库操作除了文件存储外,LabVIEW还提供了与数据库进行交互的功能。
通过数据库操作,可以将实验数据保存到数据库中,并且可以方便地进行查询和分析。
1. 连接数据库在LabVIEW中,可以使用Database Connectivity Toolkit来连接各种类型的数据库,如MySQL、SQLite和Microsoft SQL Server等。
第22卷 第1期2007年3月 北京机械工业学院学报Journal of Beijing I nstitute ofM achineryVol.22No.1Dec.2007文章编号:1008-1658(2007)01-0009-03基于LabV I E W的数据存储及报表设计方法谷玉海,张桂彬,胡宪能(北京机械工业学院 机电系统测控北京市重点实验室,北京100085)摘 要:大型旋转机组状态检测及故障诊断系统除了要求设计美观的软件组太界面,同时也要求保存大量的数据及输出报表。
使用图形化开发环境Lab V I E W能够高效快捷的开发虚拟仪器软件系统,但用其进行大容量监测数据的管理及输出报表存在一定难度。
因此提出了一种在LabV I E W环境下,通过使用ADO技术实现对数据库的操作,完成数据的存储及管理,以及使用Ac2 tiveX技术生成Excel数据报表的方法。
关 键 词:LabV I E W;数据库;报表中图分类号:TP311.52 文献标识码:AA m ethod of da t a storage and report desi gn ba sed on LabV I E WG U Yu2hai,ZHANG Gui2bin,HU Xian2neng(Beijing key Laborat ory:Measurement and Contr ol of Mechanical and Electrical Syste m,Beijing I nstitute of Machinery,Beijing100085,China)Abstract:State monit oring and diagnosis syste m of the large r otary sets usually needs perfect p r o2 gra m interface,mass data st orage and data reports.Graphical p r ogra mm ing language LabV I E W can devel2 op virtual instru ment s oft w are system.But it is difficult t o manage the massmonit oring data and out put re2 ports with it.A method is p r oposed t o operate the database by ADO technol ogy and generate Excel reports by ActiveX technol ogy under Lab V I E W envir on ment.Key words:Lab V I E W;database;report f or m 虚拟仪器(V irtual I nstru ment,缩写V I)是现代计算机技术和仪器技术深层次结合的产物,也是当今计算机辅助测试(CAT)领域的一项重要技术。
LabVIEW数据记录和存储(三)—二进制文件(Binary File)LabVIEW程序设计札记2009-10-12 09:34:30 阅读326 评论2 字号:大中小在文件存储的逻辑上,二进制文件基于值编码,而不是字符编码,其占用空间小,读取/写入速度快,但是译码比较复杂,不利用数据共享。
根据具体编码方式的不同,二进制的使用方式也有所不同,如对bmp格式,规定了文件各个字节段/块的含义,只需要按照相应的编码方式进行解码就可以得到bmp文件的内容。
因此,使用记事本是无法查看bmp的内容的(无法解码bmp文件),只能使用专门的图像查看软件。
事实上,任何程序员都可以按照自己的方式自定义二进制文件的编码方式,并提供相应的解码模块将信息从二进制文件中提取出来即可。
与文本文件的读写方式类似,LabVIEW中的二进制文件的读写采用图10所示的两个函数完成:“Write To Binary File”和“Read From Binary File”。
这两个函数是多态函数,可以接受File Refnum和File Path两种输入。
其使用方式也与文本文件的两个VI类似,本文不再赘述,仅仅说明其特殊的参数和使用方法。
图10 File I/O选板图11所示为利用Write To Binary File.vi函数将一个数组以二进制文件存储。
首先,程序使用10次的FOR循环以产生0~9的数列并将其转换为U8类型的数组;然后将这个数组存入二进制文件中。
图11 使用Write To Binary File.vi函数如果计算该文件的大小,可以很容易的得到:10*1 Byte(U8)=10 Bytes,即10字节。
打开该文件的“属性”对话框,如图12所示,显示文件大小为14字节。
那么多余的4字节是怎么产生的呢?这与Write To Binary File.vi函数的“prepend array or string size (T)”参数有关,它表示当输入端的数据类型是数组或字符串时是否在文件头包含该数组的大小或字符串的长度,默认是True。
LabVIEW与数据存储优化大数据处理与存储在当今信息化时代,大数据的处理与存储成为了一个重要的挑战。
随着科学技术的快速发展,各类实验室在数据采集、处理和存储方面面临着越来越大的挑战。
而LabVIEW作为一款强大的图形化编程语言和开发环境,为大数据处理与存储提供了优化的解决方案。
本文将探讨LabVIEW在大数据处理与存储中的优势和应用。
1. LabVIEW的图形化编程优势LabVIEW通过图形化的编程界面,使得数据处理与存储的流程直观易懂。
相较于传统的文本式编程语言,LabVIEW的数据流图能够直观地描述数据的传递和处理过程,减少代码量,提高代码的可读性和可维护性。
2. LabVIEW在大数据处理中的应用LabVIEW具备强大的信号处理和数据分析能力,能够有效地处理大量的实验数据。
例如,在物理实验中,LabVIEW可以实现实时数据采集和分析,实现对实验结果的快速反馈。
此外,LabVIEW还提供了丰富的工具和算法,用于数据降噪、滤波、特征提取等操作,帮助科研人员快速准确地分析数据。
3. LabVIEW在大数据存储中的优化在大数据存储方面,LabVIEW提供了多种高效的存储方式。
首先,LabVIEW支持多种数据格式,包括二进制、文本和数据库等,可以根据数据的特点选择适合的存储方式。
其次,LabVIEW提供了数据压缩、存储优化等功能,能够降低数据存储的容量和传输的带宽占用。
此外,LabVIEW还支持数据的快速读写操作,能够满足实时性要求较高的应用场景。
4. LabVIEW在大数据处理与存储中的案例以某实验室为例,该实验室使用LabVIEW进行水质监测。
LabVIEW通过采集仪器的传感器数据,并进行实时处理和存储,帮助实验人员实时了解水质状况。
同时,LabVIEW还提供了数据分析和报告生成功能,帮助实验室研究人员进行数据挖掘和分析。
在总结中,LabVIEW作为一款强大的图形化编程语言和开发环境,在大数据处理与存储方面具备诸多优势和应用。