英语作文模板图表作文教学提纲
- 格式:doc
- 大小:16.50 KB
- 文档页数:1
图表类的英语作文模板Title: A Template for Writing English Essays on Graphs and Charts。
Introduction:Graphs and charts are essential tools for presenting data and illustrating trends in various fields. In this essay, we will explore a template for crafting well-structured essays based on graphs and charts.1. Overview of the Graph/Chart:Start by describing the type of graph/chart you are analyzing (e.g., bar graph, line graph, pie chart).Provide a brief summary of the data presented and its source.2. Key Trends or Patterns:Identify and discuss the main trends or patterns depicted in the graph/chart.Highlight any significant fluctuations, peaks, or valleys.3. Comparison and Contrast:If applicable, compare different data sets or elements represented in the graph/chart.Analyze similarities and differences between various categories or groups.4. Causes and Implications:Explore potential factors contributing to the observed trends or patterns.Discuss the implications of these findings on the subject matter or relevant stakeholders.5. Forecasting or Projection:Offer insights into future trends based on the data presented in the graph/chart.Discuss potential outcomes or scenarios that may arise.6. Limitations and Considerations:Acknowledge any limitations or constraintsassociated with the data or methodology used to create the graph/chart.Consider alternative interpretations or perspectives.7. Conclusion:Summarize the main points discussed in the essay.Emphasize the significance of the findings and theirrelevance in the broader context.Example Essay Using the Template:Introduction:The following essay analyzes a bar graph depicting the annual sales revenue of a company over the past five years.Overview of the Graph:The bar graph illustrates the annual sales revenue of XYZ Company from 2019 to 2023. The data is sourced from the company's financial reports.Key Trends or Patterns:The graph reveals a steady increase in sales revenue from 2019 to 2022, with a peak in 2022. However, there was a slight decrease in revenue in 2023 compared to the previous year.Comparison and Contrast:Comparing the sales revenue across the five years, it is evident that the growth rate was highest between 2020 and 2022. Furthermore, there is a notable contrast between the substantial increase in revenue from 2021 to 2022 and the subsequent decline in 2023.Causes and Implications:The significant growth in sales revenue from 2020 to 2022 can be attributed to several factors, including expanded market presence, successful product launches, and strategic partnerships. However, the decline in 2023 may be linked to economic downturns or increased competition. This downturn raises concerns about the company's future profitability and market position.Forecasting or Projection:Based on the trends observed, it is projected that the company may experience continued challenges in maintainingrevenue growth in the coming years. Addressing competitive pressures and adapting to changing market dynamics will be critical for sustained success.Limitations and Considerations:It is important to note that the graph only provides a snapshot of the company's financial performance and does not account for external factors such as macroeconomic trends or industry-specific challenges. Additionally, fluctuations in revenue may be influenced by one-time events or seasonal variations.Conclusion:In conclusion, the analysis of the sales revenue graph highlights both positive and concerning trends for XYZ Company. While the growth trajectory from 2019 to 2022 is promising, the decline in 2023 underscores the need for strategic adjustments and proactive measures to ensure future profitability and competitiveness.This template provides a structured approach to effectively analyze and discuss graphs and charts in English essays. By following these guidelines, you can craft insightful and cohesive essays that demonstrate your understanding of data visualization and its implications.。
图表类英语作文范文扩展句:1、With _____, ____, the effect of which is not only discouraging, but also challenging.2、So my principle is to pay due attention to ___, but notjustto____.示范第一段:说明图表开篇句:As the bar chart shows, the number of people below the poverty line decreased dramatically during the years of 1978 to1997.扩展句:1、As early as 1978, about 250 million people were under the poverty line.2、Then seven years later, the number became three fifthsthatof1978.3、And arriving in the year 1997, the number was reducedto50millions.第二段:解释图表变化原因主题句:Several factors contribute to the sharp decrease of the below-poverty population.扩展句:1、The reform and opening following 1978 enabled the peasants to become much better off. (原因1)2、And with the development of Chinese economy, that policy also improved city dwellers lives greatly. (原因2)3、Furthermore, the high-tech introduced made it possible for the countrys economy as a whole to take off. (原因3)4、All these result in the great fall of the Chinesepopulationbelow the poverty line.第三段:提出解决办法结尾句: However, a further decrease in the number of poverty-stricken people is faced with some problems.扩展句:1、With quite few employees being laid off, the effect of which is not only discouraging, but also challenging.2、So my principle is to pay due attention to the newcomers, but not just to care for the poor, say, in remote mountain areas.范文As the bar chart shows, the number of people below the poverty line decreased dramatically during the years of 1978 to 1997. Asearly as 1978, about 250 million people were under the poverty line.Then sevenyears later, the number became three fifths that of 1978.And arriving in the year 1997, the number was reduced to 50 millions.Several factors contribute to the sharp decrease of the below-poverty population. The reform and opening following 1978 enabled the peasants to become much better off. And with the development of Chinese economy, that policy also improved city dwellers lives greatly. Furthermore, the high-tech introduced made it possible for the countrys economy as a whole to take off. All these result in the great fall of the Chinese population below the poverty line.However, a further decrease in the number of poverty-stricken people is faced with some problems. With quite few employees being laid off, the effect of which is not only discouraging, but also challenging. So my principle is to pay due attention to the newcomers, but notjust to care for the poor, say, in remote mountain areas.The past years have witnessed a mounting number of Chinese scholars returning from overseas. As is lively illustrated by the column chart, the number of returnees climbed from a mere 69.3 thousand in 2022 to over 272.9 thousand in 2022, at an annual increase rate of around 50%.A multitude of factors may have led to the tendency revealed by the chart, but the following are the critical ones from my perspective. First and foremost, along with the development of Chinese economy and society, the number of Chinese studying abroad has been soaring in the past years, which has provided an expanding base for the numberof returnees. In the second place, the government has enacted a series of preferential policies to attract overseas Chinese scholars back home. Last but not least, the booming economy, science and technology in this country have generated more attative job opportunites for scholars returning from overseas.The waves of returnees will definitely contribute to this nations development, since they have brought back not only advanced science and technology but also pioneering concepts of education and management. With more scholars coming back from overseas, and with the concerted efforts of the whole nation, we have reasons to expect a faster rejuvenation of this country.一、图表类型基本单词图表类型:table(表格)、chart(图表)、diagram(图标)、graph(多指曲线图)、column chart(柱状图)、pie graph(饼图)、tree diagram(树形图)、饼图:pie chart、直方图或柱形图:bar chart/histogram、趋势曲线图:line chart/curve diagram、表格图:table、流程图或过程图:flowchart/sequence diagram、程序图:processing/procedures diagram二、图表描述基本词语1、描述:show、describe、illustrate、can be seen from、clear、apparent、reveal、represent2、内容:figure、statistic、number、percentage、proportion三、常用的描述句型The table/chart diagram/graph shows (that)According to the table/chart diagram/graphAs (is) shown in the table/chart diagram/graphAs can be seen from the table/chart/diagram/graph/figures, figures/statistics shows (that)It can be seen from the figures/statisticsWe can see from the figures/statisticsIt is clear from the figures/statisticsIt is apparent from the figures/statisticstable/chart/diagram/graph figures (that)table/chart/diagram/graph shows/describes/illustrates。
英语作文模板一、图表作文框架As is shown/indicated/illustrated by the figure/percentage in the table(graph/picture/pie/chart), 作文题目的议题has been on rise/ decrease(goesup/increases/drops/decreases),significantly/dramati cally/steadily rising/decreasing from______ in _______ to ______ in _____. From the sharp/marked decline/ rise in the chart, it goes without saying that ________.There are at least two good reasons accounting for _____. On the one hand, ______. On the other hand, ______ is due to the fact that ________. In addition, _______ is responsible for _______. Maybe there are some other reasons to show ________. But it is generally believed that the above mentioned reasons are commonly convincing. As far as I am concerned, I hold the point of view that _______. I am sure my opinion is both sound and well-grounded.二、书信作文模板Your addressMonth,Date,yearReceiver's addressDear …,I am extremely pleased to hear from you. And I would like to writea letter to tell you that_____.……I will greatly appreciate a response from you at your earliest convenience/I am looking f0rward to your replies at your earliest convenience.Best regards for your health and success.S incerely yours,X X X三、话题作文Nowadays,there are more and more __ _ in __ _. It is estimatedthat ___. Why have there been so many ____? Maybe the reasonscan be listed as follows. The first one is ______. Besides,_____.The third one is _____. To sum up,the main cause of it is due to_____. It is high time that something were done upon it. For onething,_____. For another thing,_____. All these measures will certainly reduce the number of _____.一、英语作文的框机架对比观点题型(1)要求论述两个对立的观点并给出自己的看法。
一、图表作文框架As is shown by the figure/percentage in thetable(graph/picture/pie/chart) has been on rise/ decrease(increases/drops/decreases),(有表格或图像可以看出…… )significantly/dramatically/steadily rising/decreasingfrom______ in _______ to ______ in _____. From the sharp/marked decline/ rise in the chart,it goes without saying that______(毫无疑问地看出……).There are at least two good reasons accounting for ______(这里至少有两个原因可以对X X 作出解释). On the one hand,______( 一方面……). On the other hand, ______ is due to the fact that ________(另一方面……的原因是......)In addition(而且),_______ is responsible for _______. Maybe there are some other reasons to show______(也许有其他原因要展示……). But it is generally believed that the above mentioned reasons are commonly convincing. As far as I am concerned, I hold the point of view that _______.I am sure my opinion is both sound and well-grounded.二、书信作文模板Dear X X X(亲爱的X X X )I am extremely pleased to hear from you.(我很高兴收到你的来信) And I would like to write a letter to tell you that_____.(我很高兴写封信告诉你......) I will greatly appreciate a response from you at your earliest convenience/I am looking forward to your replies at your earliest convenience. (我希望你可以在空闲的时候尽快给我回信)Best regards for your health and success. (祝你身体健康万事如意)Sincerely yours,______(你最真诚的X X X)三、话题作文Nowadays(现在), there are more and more______ in______(名词). (在......方面有越来越多的......).It is estimated that______. (据估计......)Why have there been so many ____?(为什么有这么多...... )Maybe the reasons can be listed as follows.( 也许原因如下......)The first one is ______. (第一个原因是.......)Besides(而且......),_____. The third one is _____. (第三个原因是......)To sum up(总之), the main cause of it is due to _____.(最主要的原因是由于......) . It is high time that something were done upon it(是时候我们来改善它了. )For one thing,_____(一方面我们可以做......). For another thing,______(另一方面我们可以.......). All these measures will certainly reduce the number of _____. (所有的这些措施都可以确切地减少......)推荐用于写保护环境,爱护动物等作文。
高中英语图表型作文写作模板+优秀范文!图表型作文通常用图片、表格的方式反映出某一问题、现象或观点,该类作文要求考生第一对图表进行简单表述,然后点题并加以论证说明。
这几年高考英语作文通常以书信类应用文为载体,而不常考的图表型作文反而容易被大伙儿忽略,一旦考到,措手不及,今天小简老师就为大伙儿分享高中英语图表型作文的写作模板,期望大伙儿认真阅读经历。
图表作文是高中英语作文中较常见的类型,要求学生通过图中数据和提示内容写一短文,属于比较、对比类。
也可依照提示写为议论文。
通常我们采取三段式写法:第一段:描述图表,得出结论。
第二段:紧扣主题,依照图表比较分析缘故,论证结论。
第三段:发表议论,提出自己的看法。
必会词汇:表格(table)、柱形图(bar chart)、饼状图(pie chart)和折线图(diagram)常用句式:1.As can be seen from/in the chart/diagram/table/graph...从表格/图形中我们能够看到……2.According to/As is shown in the Table/Figure/Chart...如表格/图表中显示……3.It can be seen from the chart/diagram/table/graph/figures/statistics th at...从表格/图表/数据中我们能够看到……4.From the table/figures/data/results/information above,it can/may be seen/concluded/shown/estimated/calculated/inferred that...从以上的表格/图表/数据/结果/信息中,我们能够看到/总结/推测/运算/得出……5.The table shows the changes in the number of...over the period fr om...to...该表格描述了在……年之……年间……数量的变化。
高考英语作文写作各类型万能框架模板下面这些模板能帮助高三学生更直观的理解高考英语作文怎么写,从而突破作文难关。
1高考英语图表作文框架As is shown by the figure/percentage in the table/picture,____ has been on rise/ decrease, significantly/dramatically rising/decreasing from ____ in _____ to _____ in _____. From the sharp rise/decline in the chart, it goes without saying that _____.There are at least two good reasons accounting for _____. In one hand,____.In the other hand, _____ is due to the fact that ______.In addition, ______ is responsible for _____. Maybe there are some other reasons to show ______.But itis generally believed that the above mentioned reasons are commonly convincing.As far as I am concerned, I hold the point of view that _______. I am sure my opinion is both sound and well-grounded.2高考英语话题作文模板Nowadays, there are more and more __ _ in __ _. It is estimated that ___. Why have there been so many ____? Maybe the reasons can be listed as follows.The first one is ______. Besides,_____. The third one is _____. To sum up,the main cause of it is due to _____. It is high time that something were done upon it. For one thing,_____. For another thing, _____. All these measures will certainly reduce the number of _____.3高考英语对比观点作文模板(1) 要求论述两个对立的观点并给出自己的看法。
英文版作文提纲格式英文:When it comes to writing an essay outline, there are a few key things to keep in mind. Firstly, it's important to have a clear understanding of the topic you're writing about. This will help you to structure your essay in a logical and coherent way, and ensure that you're addressing all of the key points that need to be covered.Another important factor to consider when writing an essay outline is the audience you're writing for. Are you writing for a general audience, or for a specific group of people with a particular interest or expertise in the topic? This will impact the tone and style of your writing, aswell as the level of detail and technical language you use.When it comes to the format of your essay outline,there are a few different options to choose from. Some people prefer to use a traditional Roman numeral format,while others prefer a more free-form approach. Ultimately, the format you choose will depend on your personal preference and the requirements of your assignment.中文:谈到写作文提纲,有几个关键点需要记住。
1.单纯描述解释图表信息,按图表所示内容如实表达,不加评论。
2.通过叙述图表(或图画)中的内容和数字变化来分析原因,发表议论。
(一) 柱状图(BAR CHART)人们日常生活中事物的变化情况通常可以用宽度相等的柱状图形来表示,柱状图的高度差别用来说明事物的动态发展趋势,同时要注意图例说明和坐标刻度所提示的信息。
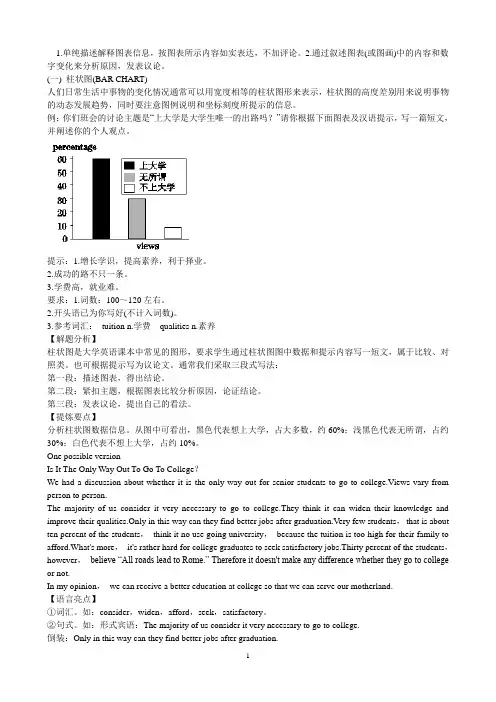
例:你们班会的讨论主题是“上大学是大学生唯一的出路吗?”请你根据下面图表及汉语提示,写一篇短文,并阐述你的个人观点。
提示:1.增长学识,提高素养,利于择业。
2.成功的路不只一条。
3.学费高,就业难。
要求:1.词数:100~120左右。
2.开头语已为你写好(不计入词数)。
3.参考词汇:tuition n.学费qualities n.素养【解题分析】柱状图是大学英语课本中常见的图形,要求学生通过柱状图图中数据和提示内容写一短文,属于比较、对照类。
也可根据提示写为议论文。
通常我们采取三段式写法:第一段:描述图表,得出结论。
第二段:紧扣主题,根据图表比较分析原因,论证结论。
第三段:发表议论,提出自己的看法。
【提炼要点】分析柱状图数据信息。
从图中可看出,黑色代表想上大学,占大多数,约60%;浅黑色代表无所谓,占约30%;白色代表不想上大学,占约10%。
One possible versionIs It The Only Way Out To Go To College?We had a discussion about whether it is the only way out for senior students to go to college.Views vary from person to person.The majority of us consider it very necessary to go to college.They think it can widen their knowledge and improve their qualities.Only in this way can they find better jobs after graduation.Very few students,that is about ten percent of the students,think it no use going university,because the tuition is too high for their family to afford.What's more,it's rather hard for college graduates to seek satisfactory jobs.Thirty percent of the students,however,believe “All roads lead to Rome.” Therefore it doesn't make any difference whether they go to college or not.In my opinion,we can receive a better education at college so that we can serve our motherland.【语言亮点】①词汇。
英语图标作文提纲I. 引言A. 引入图标作文的重要性B. 简述图标作文的常见形式II. 图标作文的组成部分A. 图表描述1. 描述图表类型(柱状图、饼图、折线图等)2. 描述图表数据和趋势B. 数据分析1. 比较不同数据点2. 分析数据变化原因C. 结论1. 总结图表所展示的趋势或特点2. 提出可能的预测或建议III. 图标作文的写作技巧A. 描述技巧1. 使用比较级和最高级2. 使用百分比和分数B. 数据分析技巧1. 运用逻辑连接词2. 避免使用绝对性词汇C. 结构安排1. 清晰的段落划分2. 合理的信息布局IV. 常见图表作文类型分析A. 柱状图作文1. 描述不同柱子代表的数据2. 分析柱子高度变化B. 饼图作文1. 描述各部分所占比例2. 分析各部分之间的关系C. 折线图作文1. 描述线条的起伏变化2. 分析趋势背后的原因V. 写作示例A. 柱状图作文示例1. 图表描述2. 数据分析3. 结论B. 饼图作文示例1. 图表描述2. 数据分析3. 结论C. 折线图作文示例1. 图表描述2. 数据分析3. 结论VI. 练习建议A. 定期练习图表作文B. 学习并运用多样化的描述词汇C. 阅读优秀作文,学习其结构和表达VII. 结语A. 强调图标作文在英语学习中的地位B. 鼓励学生通过实践提高写作能力请注意,这个提纲是一个指导性的框架,具体的写作内容需要根据实际的图表和数据来填充。
图表类英语作文提纲英文回答:Introduction:In the labyrinth of life, data often becomes the guiding compass, illuminating the path ahead. Charts and graphs, with their intricate lines and vibrant hues, offer a visual representation of the complexities that surround us. They possess the power to unlock insights, unravel patterns, and evoke emotions like no other form of communication can.Body:The allure of charts and graphs lies in their ability to transform raw data into a captivating tapestry of information. Like an artist's brushstrokes, lines dance across the canvas, revealing trends, connections, and anomalies that would otherwise remain hidden. Bar chartsrise and fall, painting a vivid picture of comparative values, while pie charts slice and dice data, exposing the proportions that shape our world.Beyond their visual appeal, charts and graphs also have an emotional resonance. They can evoke a sense of awe at the sheer scale of a phenomenon, or a pang of concern at a downward trend. By tapping into our innate desire to understand and make sense of our surroundings, they forge an intimate connection with the reader.Conclusion:Charts and graphs are not mere collections of numbers; they are portals to knowledge, gateways to discovery. They empower us to decipher the complexities of our world, inform our decisions, and expand our consciousness. As we navigate the ever-changing landscape of life, may we embrace the power of charts and graphs, allowing them to guide our path and ignite our imagination. For in their vibrant hues and intricate lines, we find not just data,but the very threads that weave the tapestry of our existence.中文回答:导言:在生命这座错综复杂的迷宫中,数据常常成为指引方向的指南针,照亮前方的道路。
高考英语作文复习--图表类作文专题讲解第一类:图表类作文写作步骤:1.点明图表所反映的主题。
常用词汇:table, chart, figure, graph, describe, tell,show, represent等2.分析数据差异及趋势或者描写数据代表内容。
注意层次。
常用词汇:rise,increase, drop, reduce, decrease, fall. but, on the contrary, however, the same as, be similar to, be different from 等3.归纳总结或发表自己看法。
常用词汇:in a word, in short, to sum up, We candraw the conclusion that……等。
重点句子:一.引入话题1.It can be seen from the table that….2.As is indicated in the chart,….3.From the sharp rise (上升n.) / decline (下降n.) in the chart, it goes withoutsaying that….(不用说…)4.It has gone up(上升) / fallen / dropped(下降) considerably in recent years.二.描述变化或原因1.表示递进what’s more, besides, in addition, furthermore, to makematters worse, what’s worse (更糟糕的是)2.表示解释account for , that is to say, mean, in other words3.表示变化---快速上升rise (increase / go up ) sharply (quickly, rapidly)Eg: The number sharply went up.---缓慢下降decrease (reduce/ come down/ decline/ drop/ fall) slowly---表示对比compare with , contrary to, on the contrary4.描述多重原因---There are several reasons behind the situation reflected in the above table. First of all, ……; More importantly,…….; Most importantly,……..;---There are at least two good reasons accounting for this phenomenon. On one hand,…….; On the other hand,………; In addition,…. is responsible for….三.总结或评论1.Personally speaking, in a word, in conclusion,2.It can be concluded that….(可以得出结论,)3.From the above discussion, we have enough reasons to predict what will happenin the near future.4.The trend described in the table will continue for quite a long time if necessarymeasures are not taken.5.As far as I’m concerned, I hold the view that……6.I’m sure my opinion is both sound and well-grounded. (既合理又理由充分)写作模版:1.分析图表数字代表内容Ascan be seen from the chart, _____________________(话题).Different people hold different opinions on this matter.Obviously, the majority of the people believe that ______________. However, others (20%) consider that_______________. Besides, another 5% hold the view that_______________.As far as I am concerned, we should pay more attention to __________. On one hand, ________________. On the other hand, __________________.2.分析数字反映的原因As can be seen from the chart, ____________________(话题). Different people hold different opinions. About 60% of the people ____________, while 25% of the people ______________.The least people, accounting for 15%, _______________.Various reasons are responsible for their different choices. To begin with, ___________. What’s more, ______________.Besides, _____________.As far as I am concerned, I am in favor of the view that_____________. I believe that ___________________.或As far as I am concerned, despite such problems, I hold the view that we should ________________. Only in this way can we _______________.图表类作文实战1:下面的图表显示了你们学校高三学生周末放假的学习生活情况。
提纲作文模板英文英文:Introduction:As a student, I have been asked to write many essays and reports. In this article, I will share with you a useful outline for writing an essay.Body:1. Introduction: In the introduction, you should introduce the topic of your essay and provide some background information. You should also state your thesis statement, which is the main argument of your essay.2. Body Paragraphs: The body of your essay should consist of several paragraphs, each discussing a different aspect of your topic. Each paragraph should begin with a topic sentence that introduces the main idea of theparagraph. You should then provide evidence and examples to support your argument.3. Counterarguments: In your essay, you should also address any potential counterarguments to your thesis statement. This shows that you have considered different perspectives and strengthens your argument.4. Conclusion: In the conclusion, you should summarize your main points and restate your thesis statement. You can also provide some final thoughts or recommendations.中文:介绍:作为一名学生,我写过很多论文和报告。
英语作文的题纲模板Title: The Importance of Time Management in Daily Life。
Time management is a crucial skill that everyone should possess in order to lead a balanced and successful life. In this article, we will explore the significance of time management in various aspects of daily life and discuss effective strategies for managing time efficiently.First and foremost, time management plays a vital role in achieving academic success. Students who are able to manage their time effectively are more likely to excel in their studies. By allocating specific time slots for studying, completing assignments, and preparing for exams, students can ensure that they are able to cover all the necessary material and avoid last-minute cramming. Additionally, effective time management allows students to balance their academic responsibilities with extracurricular activities, part-time jobs, and socializing, leading to a well-rounded and fulfilling college experience.In the professional world, time management is equally important. Employees who are able to prioritize tasks, set realistic deadlines, and avoid procrastination are more likely to meet their targets and contribute to the overall success of their organization. Effective time management also allows individuals to maintain a healthy work-life balance, reducing the risk of burnout and improving overall job satisfaction. Furthermore, time management skills are essential for entrepreneurs and business owners, as they must juggle multiple responsibilities and make strategic decisions within a limited timeframe.Time management is also crucial for maintaining a healthy lifestyle. By scheduling regular exercise, meal times, and relaxation periods, individuals can ensure that they prioritize their physical and mental well-being. This can help prevent stress, anxiety, and other health issues that may arise from neglecting self-care. Additionally, effective time management allows individuals to allocate time for hobbies, interests, and socializing, leading to a more fulfilling and enjoyable life outside of work or school.In personal relationships, time management can also play a significant role. By allocating quality time for family, friends, and loved ones, individuals can nurture and strengthen their relationships. This may involve scheduling regular family dinners, planning outings with friends, or setting aside time for date nights with a partner. By prioritizing these relationships and managing time effectively, individuals can maintain strong connections with the people who matter most to them.To effectively manage time, individuals can utilize various strategies and tools. These may include creating to-do lists, using calendars or scheduling apps, setting specific goals and deadlines, and learning to say no to non-essential tasks. Additionally, individuals can benefit from identifying their most productive times of day and allocating their most challenging or important tasks to these periods. By implementing these strategies, individuals can make the most of their time and achieve their goals more efficiently.In conclusion, time management is an essential skill that impacts various aspects of daily life. Whether in academics, the professional world, maintaining a healthy lifestyle, or nurturing personal relationships, effective time management can lead to greater success, fulfillment, and overall well-being. By prioritizing tasks, setting realistic goals, and utilizing effective strategies, individuals can make the most of their time and lead a balanced and rewarding life.。
图表描述英语作文模板推荐文章大学英语的好的作文热度:图表类英语作文范文热度:同等学力英语考试作文范文科技类热度:同等学力英语作文范文健康类热度:超级简单的英语儿歌热度:描述图表类,我们可以借用英语这类型写作的模板啊。
下面是店铺给大家整理的图表描述英语作文模板,供大家参阅!图表描述英语作文模板1According to the chart / graph / diagram / table, we clearly learn that _________. As early as _________,___________. Then,_________. Last,__________. In contrast, by _________,__________.There are many reasons accounting for _________. Firstly, _________.Secondly,__________. Finally,_________. As a result,_________.As far as I am concerned,_________. For one thing,__________. For another,________. In brief, I hold that__________.图表描述英语作文模板2As is shown in the chart / graph / diagram / table above, __________ has charged drastically in the past _________. While ___________,now the percentage of__________ is __________. Meanwhile, the number of _________ has soared up to ________.There are mainly two possible reasons contributing to the rapid changes. The first is that _________. Secondly,__________.In my point of view, the changes have a great influence on _________. At the same time,_______. To sum up ,_________.图表描述英语作文模板3What is shown in the chart / graph / diagram / table above indicates that in recent years, more and more people pay attention to _________. The number of those who _________ has increased ________, and furthermore,____________.There are two factors responsible for the changes. In the first place,_________. Moreover,__________. Yet, it is noticeable that __________.From the analysis, we can safely draw the conclusion that__________. It is possible that in the future, the tendency will__________.图表描述英语作文模板4The chart gives us an overall picture of the ____________(图表主题). The first thing we notice is that_______________(图表最大特点). This means that as __________, _________________(进一步说明).We can see from the statistics given that _______________(图表细节一). After ving_________(细节一中的第一个变化), the _____Ved+幅度+时间(紧跟着的变化). The figures also tells us that_________________________(图表细节二). (数据位置,如In the second column), we can see that ____________accounts for _______(进一步描述).Judging from these figures, we can draw the conclusion that___________(结论). The reason for this, as far as I am concerned is that_____________(给出原因). / It is high time that we Ved(发出倡议).图表描述英语作文模板5According to the bar chart / pie chart / line graph displays the changes in the number of____________(图表整体趋势). There was an increase in ____________(图表细节).At the point of ____________, ____________reaches its peak value of ____________(数据或变化). What has caused these changes? There are mainly three reasons. Firstly, ____________ (原因一).Secondly, ____________(原因二). The number of ____________ increased over the period. ____________ rose by _________ from ________ to ________________. And there were____________. Finally,____________(最后一个原因).In conclusion / We can safely draw the conclusion that ____________(结论). Therefore, ____________(进一步谈论更多个人想法). 图表描述英语作文模板6It seems to me that the cartoon / drawing is sending a message about ____________(图画内容),which reveals ____________(稍作评价).In my perspective of view, ____________ (表明个人观点)。
图表作文写作模板中考英语作文【 - 中考英语作文】图表作文至少包含描述图表与解释原因两个部分,而当前的图表作文大多还有第三个段落。
图表作文的规律性很强,不像图画式作文那样富于变化。
1.首段的写作图表作文有表格(table)、柱形图(bar chart)、饼状图(pie chart)和折线图(diagram)之分,后三种都是属于图表的范畴(chart)。
不管是chart还是table,都需要进行描述,一般放在文章的第一部分,长度宜适中。
描述数据我们要首先看看是几个变量(A),每个变量有几个数据(B),不妨以A*B表示。
如果只有一个变量,有三个数据,可以描述如下:From the chart we can see clearly that the average number of hours a student spends on Internet per week has increased from less than two hours in 1998 to nearly four hours in XX, and then to 20 hours in XX.如果是最常见的是2*3的情形,可以描述如下:From the chart, we can see clearly that in a big city in China, state?owned houses declined from 75% in 1990 to 60% in 1995 and then to 20% in XX, while private houses rose from 25% to 40% and then to 80% during the same period.这里用了while引起从句来突显对比,是一种非常好的办法,如果用两句话来描述,也完全可以。
如果是1*n(n>3)的情形,将头与尾描述出来即可,比较好的方法就是在句中描述最后一个与第一个相比变化了多少。
精品文档
图表分析作文1
As is clearly shown in the table/ figure/ graph / chart, 图表总体描述between 年代and 年代. Especially, 突出的数据变化. There are three reasons for 具体表示急剧上升、下降或特殊现象的词.
To begin with, 原因一. In addition / Moreover, 原因二. For example, 具体例证. Last but no least, 原因三. In short,总结上文.
As far as I am concerned, / For my part, / As for me,作者自己的观点. On the one hand, 理由一. On the other hand, 理由二. In brief,总结上文.
图表分析作文2
The table / figure / graph / chart shows that 图表总述from 年代to年代. It is self-evident that 突出的数据变化. Three possible reasons contribute to 具体表示急剧上升、下降或特殊现象的词或代词代替上文内容.
One reason is that原因一. Another reason is that原因二. For instance,举例证. What’s more原因三. As a result, 重述上文之趋势.
However, in my opinion 作者观点. For one thing,理由一. For another, 理由二. To sum up,总结上文.
图表分析作文3
It can be seen from the table / figure / graph / chart that图表总述between年代and年代. Especially,突出的数据变化. Why are there such great changes during 图表涉及的年头数years? There are mainly two reasons explaining具体表示急剧上升、下降或特殊现象的词或代词代替上文内容. First,原因一. In the old days,比较法说明过去的情况. But now,说明现在的情况. Second,原因二. As a result,总结上文.
In my viewpoint,作者自己的观点. On the one hand,论点一. On the other hand,论点二.
图表分析作文4
As the table / figure / graph / chart shows,图表总述in the past years年代. Obviously,突出的数据变化. Why are there such sharp contrasts during 图表涉及的年头years?
Two main factors contribute to具体表示急剧上升、下降或特殊现象的词或代词代替上文内容. First of all,原因一. In the past,比较法说明过去的情况. But now 说明现在的情况. Moreover,原因二. Therefore,总结上文.
As I see it,作者自己的观点. For one thing,论点一. For another,论点二.
图表作文补充句型
•As is shown in the graph… 如图所示…
•The graph shows that… 图表显示…
•As can be seen from the table,… 从表格中可以看出…
•From the chart, we know that… 从这张表中,我们可知…
•All these data clearly prove the fact that… 所有这些数据明显证明这一事实,即…
•The increase of …. In the city has reached to 20%. ….在这个城市的增长已达到20%.
•In 1985, the number remained the same. 1985年,这个数字保持不变.
•There was a gradual decline in 1989. 1989年,出现了逐渐下降的情况.
精品文档。