第七版曼昆经济学原理(宏观)第2章生活费用的衡量
- 格式:ppt
- 大小:4.00 MB
- 文档页数:8
宏观经济学第七版课后习题答案篇一:曼昆《宏观经济学》(第6、7版)课后习题详解(第2章宏观经济学的数据)曼昆《宏观经济学》(第6、7版)第2章宏观经济学的数据课后习题详解跨考网独家整理最全经济学考研真题,经济学考研课后习题解析资料库,您可以在这里查阅历年经济学考研真题,经济学考研课后习题,经济学考研参考书等内容,更有跨考考研历年辅导的经济学学哥学姐的经济学考研经验,从前辈中获得的经验对初学者来说是宝贵的财富,这或许能帮你少走弯路,躲开一些陷阱。
以下内容为跨考网独家整理,如您还需更多考研资料,可选择经济学一对一在线咨询进行咨询。
一、概念题 1.国内生产总值(gross domestic product,GDP)答:国内生产总值指一定时期(通常为一年)内,一个经济体生产的所有最终产品和服务的市场价值总和。
GDP一般通过支出法和收入法两种方法进行核算。
用支出法计算的国内生产总值等于消费、投资、政府购买和净出口之和;用收入法计算的国内生产总值等于工资、利息、租金、利润、间接税、企业转移支付和折旧之和。
GDP是一国范围内生产的最终产品的市场价值,因此是一个地域概念;而与此相联系的国民生产总值(GNP)则是一个国民概念,指某国国民所拥有的全部生产要素所生产的最终产品和劳务的市场价值总和。
2.国民收入核算(national income accounting)答:国民收入核算指用于衡量GDP和许多相关统计数字的核算体系,是以整个国民经济或社会再生产为对象的宏观核算。
它以一定的经济理论为指导,综合运用统计和会计的方法,对一个国家或地区在一定时期内国民经济运行过程进行系统科学的定量描述,为经济分析和国家实行宏观经济调控、制订经济政策或计划管理提供重要的客观依据。
国民经济核算一词最早出现于1941年。
荷兰经济学家范·克利夫在荷兰《经济学家》杂志1941年7月号和11月号上,先后发表两篇文章,首次使用了“国民经济核算”一词。
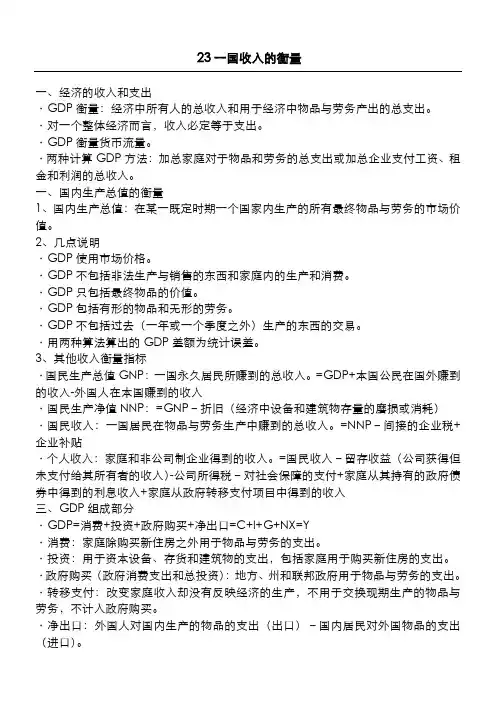
23一国收入的衡量一、经济的收入和支出·GDP衡量:经济中所有人的总收入和用于经济中物品与劳务产出的总支出。
·对一个整体经济而言,收入必定等于支出。
·GDP衡量货币流量。
·两种计算GDP方法:加总家庭对于物品和劳务的总支出或加总企业支付工资、租金和利润的总收入。
一、国内生产总值的衡量1、国内生产总值:在某一既定时期一个国家内生产的所有最终物品与劳务的市场价值。
2、几点说明·GDP使用市场价格。
·GDP不包括非法生产与销售的东西和家庭内的生产和消费。
·GDP只包括最终物品的价值。
·GDP包括有形的物品和无形的劳务。
·GDP不包括过去(一年或一个季度之外)生产的东西的交易。
·用两种算法算出的GDP差额为统计误差。
3、其他收入衡量指标·国民生产总值GNP:一国永久居民所赚到的总收入。
=GDP+本国公民在国外赚到的收入-外国人在本国赚到的收入·国民生产净值NNP:=GNP–折旧(经济中设备和建筑物存量的磨损或消耗)·国民收入:一国居民在物品与劳务生产中赚到的总收入。
=NNP–间接的企业税+企业补贴·个人收入:家庭和非公司制企业得到的收入。
=国民收入–留存收益(公司获得但未支付给其所有者的收入)-公司所得税–对社会保障的支付+家庭从其持有的政府债券中得到的利息收入+家庭从政府转移支付项目中得到的收入三、GDP组成部分·GDP=消费+投资+政府购买+净出口=C+I+G+NX=Y·消费:家庭除购买新住房之外用于物品与劳务的支出。
·投资:用于资本设备、存货和建筑物的支出,包括家庭用于购买新住房的支出。
·政府购买(政府消费支出和总投资):地方、州和联邦政府用于物品与劳务的支出。
·转移支付:改变家庭收入却没有反映经济的生产,不用于交换现期生产的物品与劳务,不计入政府购买。
曼昆《宏观经济学》(第7版)重点章节及重点课后习题I 曼昆《宏观经济学》重点章节或知识点一、导言(第1、2章)1、宏观经济学科学(第1章)(1)宏观经济学。
掌握宏观经济学的研究对象、三个重要的宏观经济变量(宏观经济学的核心,后面所有章节都是围绕这三个变量展开的)、本书框架(有利于加深对宏观体系的认识)。
(2)价格黏性与伸缩性。
短期和长期,价格情形,也是不同学派分析的角度或出发点。
(3)宏观经济学与微观经济学的关系。
了解下即可。
2、宏观经济学的数据(第2章)(1)国内生产总值(GDP、国民收入,总产出)。
重点掌握:概念和内涵;核算中的特殊处理;名义GDP、实际GDP和GDP平减指数;GDP核算指标的缺陷和改进。
(2)国民收入核算。
重点掌握:国民收入核算三种方法的区别和联系,GDP与其他国民收入指标(GNP、NNP、NI、PI、PPI)的关系。
(3)消费者价格指数(CPI)。
重点掌握:CPI的含义。
CPI与GDP平减指数的关系。
说明:第1、2章比较基础,初级宏观看过的考生,可以直接看讲义,教材直接略过就行。
二、古典理论:长期中的经济(第3、4、5、6章)重点章节在4、5、6。
其中,最最重要的章节在第4章。
1、国民收入:源自何处,去向何方(第3章)(1)国民收入的分配。
重点掌握:企业对要素需求的决定,欧拉定理。
(2)柯布—道格拉斯生产函数(C-D函数)。
该函数的性质必须掌握。
(3)总供给与总需求的均衡。
重点掌握:产品市场和金融市场均衡的条件、利用储蓄和投资曲线分析问题。
2、货币与通货膨胀(第4章)(1)货币数量论。
重点掌握:数量方程式和货币数量论,表达式及二者的区别和联系;利用数量方程式来解释通货膨胀。
(12年真题)(2)通货膨胀与利率。
重点掌握:费雪效应与费雪方程。
(3)名义利率与货币需求。
重点掌握:货币需求函数,货币、价格与利率的关系。
(4)通货膨胀的社会成本。
重点掌握:预期通货膨胀的成本VS未预期到的通货膨胀的成本。
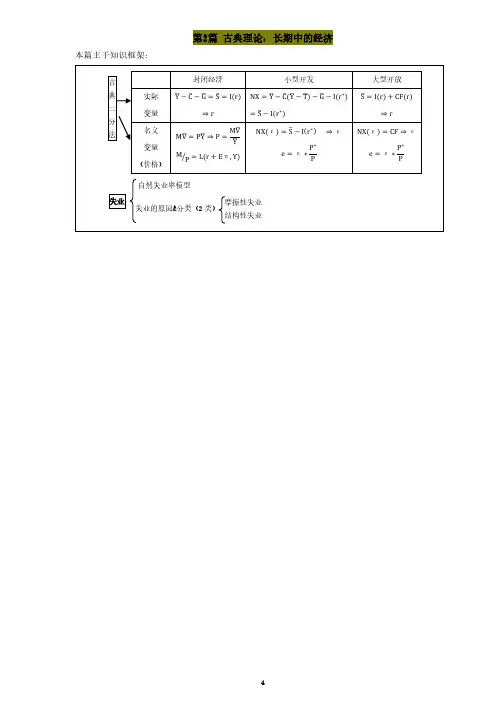
第2篇古典理论:长期中的经济本篇主干知识框架:第3章 国民收入:源自何处,去向何方(一般均衡模型)本章分析的出发点(教材图3-1)本章主干知识框架:3.1 什么决定了产品与服务的总生产(略) 3.2 国民收入如何分配给生产要素:新古典分配理论②对任何一种生产要素支付的价格都取决于该要素服务的供给和需求。
由于已假设供给是固定的,所以供给曲线是一条垂直线。
需求曲线向下倾斜。
两曲线的交点决定了均衡的要素价格。
为了理解要素价格和收入分配,必须考察生产要素的需求,为此我们从研究一个典型企业使用多少生产要素的决策问题开始。
②新古典分配理论,neoclassical theory of distribution.3.2.1 企业如何决策→要素需求→要素价格(一)竞争性企业面临的决策:利润=PF (K,L )−WL −RK假设企业是竞争性的,将产出和投入的价格都视为由市场条件决定(价格接受者)。
(二)MPL ↓⇒劳动需求曲线大多数生产函数具有边际产量递减的性质:在资本量不变的情况下,随着劳动量的增加,劳动边际产量递减。
企业多雇佣一单位劳动的利润变化是: ∆利润=P x MPL-W 。
竞争性企业对劳动的需求由下式决定:P x MPL=W 或者MPL=W/P (实际工资)为了使利润最大化,企业雇佣劳动,直到劳动的边际产量等于实际工资这一点为止。
由于MPL 随着L 增加而递减,故MPL 曲线向下倾斜。
企业雇用工人知道司机工资等于MPL 位置。
因此,MPL 曲线也就是企业的劳动需求曲线。
(三)资本MPK(↓)与资本需求:MPK=R/P (实际租赁价格) (四)总结:总之,竞争性的追求利润最大化的企业关于要素使用的决策都遵循着一个简单规划:企业需要每一种生产要素,直到该要素的边际产量减少到等于其实际要素价值为止。
3.2.2 国民收入的划分经济利润=Y −MPL ∗L −MPK ∗K 或,Y =MPL ∗L +MPK ∗K +经济利润经济利润有多少呢? 若生产函数具有规模报酬不变的性质,则经济利润必为零。

宏观经济学原理曼昆名词解释微观经济学(microeconomics),研究家庭和企业如何做出决策,以及它们如何在市场上相互影响。
宏观经济学(macroeconomics),研究整体经济现象,包括通货膨胀、失业和经济增长。
国内生产总值GDP(gross domestic product),在某一既定时期,一个国家内生产的所有最终物品与服务的市场价值。
消费(consumption),家庭除购买新住房之外,用于物品与服务的支出。
投资(investment),用于资本设备、存货和建筑物的支出,包括家庭用于购买新住房的支出。
政府购买(government purchase),地方、州和联邦政府用于物品与服务的支出。
净出口(net export),外国人对国内生产的物品的支出(出口),减国内居民对外国物品的支出(进口)。
名义GDP(nominal GDP),按现期价格评价的物品与服务的生产。
真实GDP(real GDP),按不变价格评价的物品与服务的生产。
(总之,名义GDP是用当年价格来评价经济中物品与服务生产的价值,真实GDP是用不变的GDP平减指数(GDP, deflator),用名义GDP与真实GDP的比率乘以100计算的物价水平衡量指标。
消费物价指数CPI(consumer price index),普通消费者所购买的物品与服务的总费用的衡量指标。
通货膨胀率(inflation rate),从前一个时期以来,物价指数变动的百分比。
生产物价指数(producer price index),企业所购买的一篮子物品运服务的费用的衡量指标。
指数化(indexation),根据法律或合同按照通货膨胀的影响,对货币数量的自动调整。
名义利率(nominal interest rate),通常公布的、未根据通货膨胀的影响,校正的利率。
真实利率(real interest rate),根据通货膨胀的影响校正过的利率。
c.Real GDP falls because with fewer workers on the job, firms produce less. Thisaccurately reflects a fall in economic well-being.d.Real GDP falls because the firms that lay off workers produce less. This decreaseseconomic well-being because workers’ incomes fall (the income side), and there are fewer goods for people to buy (the expenditure side).e.Real GDP is likely to fall, as firms shift toward production methods that producefewer goods but emit less pollution. Economic well-being, however, may rise. The economy now produces less measured output but more clean air; clean air is not traded in markets and, thus, does not show up in measured GDP, but is neverthe-less a good that people value.f.Real GDP rises because the high-school students go from an activity in which theyare not producing market goods and services to one in which they are. Economic well-being, however, may decrease. I n ideal national accounts, attending school would show up as investment because it presumably increases the future produc-tivity of the worker. Actual national accounts do not measure this type of invest-ment. Note also that future GDP may be lower than it would be if the students stayed in school, since the future work force will be less educated.g.Measured real GDP falls because fathers spend less time producing market goodsand services. The actual production of goods and services need not have fallen, however. Measured production (what the fathers are paid to do) falls, but unmea-sured production of child-rearing services rises.9.As Senator Robert Kennedy pointed out, GDP is an imperfect measure of economic per-formance or well-being. In addition to the left-out items that Kennedy cited, GDP also ignores the imputed rent on durable goods such as cars, refrigerators, and lawnmowers;many services and products produced as part of household activity, such as cooking and cleaning; and the value of goods produced and sold in illegal activities, such as the drug trade. These imperfections in the measurement of GDP do not necessarily reduce its usefulness. As long as these measurement problems stay constant over time, then GDP is useful in comparing economic activity from year to year. Moreover, a large GDP allows us to afford better medical care for our children, newer books for their education, and more toys for their play. Finally, countries with higher levels of GDP tend to have higher levels of life expectancy, better access to clean water and sanitation, and higher levels of education. GDP is therefore a useful measure for comparing the level of growth and development across countries.。
E conomics Principles ofN. Gregory MankiwThinking Likean EconomistSeventh EditionCHAPTER 2 W o j c i e c h (G e r s o n ((183111901)(W o j c i e c h (G e r s o n ((183111901)(In this chapter,look for the answers to these questions • What are economists’ two roles? How do they differ? • What are models? How do economists use them? • What are the elements of the Circular-Flow Diagram? What concepts does the diagram illustrate?• How is the Production Possibilities Frontier relatedto opportunity cost? What other concepts does it illustrate?• What is the difference between microeconomics andmacroeconomics? Between positive and normative?The Economist as Scientist! Economists play two roles:1. Scientists: try to explain the world2. Policy advisors: try to improve it! In the first, economists employ thescientific method,the dispassionate development and testing of theories about how the world works.3Assumptions & Models! Assumptions simplify the complex world,make it easier to understand.! Example: To study international trade,assume two countries and two goods.Unrealistic, but simple to learn andgives useful insights about the real world.! Model: a highly simplified representation ofa more complicated reality.Economists use models to study economic issues.4Our First Model:The Circular-Flow Diagram! The Circular-Flow Diagram: a visual model of the economy, shows how dollars flow through markets among households and firms! Two types of “actors”:! households! firms! Two markets:! the market for goods and services! the market for “factors of production”9Factors of Production! Factors of production: the resources the economy uses to produce goods & services, including! labor! land! capital (buildings and machines used inproduction)10Households:! Own the factors of production,sell/rent them to firms for income! Buy and consume goods & services FirmsHouseholds Firms:! Buy/hire factors of production,use them to produce goodsand services! Sell goods & services11Markets for Factors of Production HouseholdsFirms Markets for Goods & ServicesOur Second Model:The Production Possibilities Frontier ! The Production Possibilities Frontier (PPF): a graph that shows the combinations oftwo goods the economy can possibly produce given the available resources and the available technology! Example:! Two goods: computers and wheat! One resource: labor (measured in hours)! Economy has 50,000 labor hours per monthavailable for production.13A C T I V E L E A R N I N G1Points off the PPFA.On the graph, find the point that represents(100 computers, 3000 tons of wheat), label it F.Would it be possible for the economy to produce this combination of the two goods?Why or why not?B.Next, find the point that represents(300 computers, 3500 tons of wheat), label it G.Would it be possible for the economy to producethis combination of the two goods?The PPF: What We Know So Far Points on the PPF (like A – E)! possible! efficient: all resources are fully utilizedPoints under the PPF (like F)! possible! not efficient: some resources underutilized(e.g., workers unemployed, factories idle) Points above the PPF (like G)! not possible19The PPF and Opportunity Cost! Recall: The opportunity cost of an itemis what must be given up to obtain that item.! Moving along a PPF involves shifting resources (e.g., labor) from the production of one good to the other.! Society faces a tradeoff: Getting more of one good requires sacrificing some of the other.! The slope of the PPF tells you the opportunity cost of one good in terms of the other.20Economic growth shifts the PPF outward.The Shape of the PPF! The PPF could be a straight line or bow-shaped. ! Depends on what happens to opportunity costas economy shifts resources from one industryto the other.! If opp. cost remains constant,PPF is a straight line.(In the previous example, opp. cost of acomputer was always 10 tons of wheat.)! If opp. cost of a good rises as more of the goodis produced, PPF is bow-shaped….25At A, opp. cost of mtn bikes is low.B At B , opp. cost of mtn bikes is high.Why the PPF Might Be Bow-Shaped! So, PPF is bow-shaped when different workers have different skills, different opportunity costs of producing one good in terms of the other.! The PPF would also be bow-shaped when there is some other resource, or mix of resources with varying opportunity costs(E.g., different types of land suited fordifferent uses).29The PPF: A Summary! The PPF shows all combinations of two goods that an economy can possibly produce,given its resources and technology.! The PPF illustrates the concepts oftradeoff and opportunity cost,efficiency and inefficiency,unemployment, and economic growth.! A bow-shaped PPF illustrates the concept of increasing opportunity cost.31Microeconomics and Macroeconomics! Microeconomics is the study of how households and firms make decisions and how they interact in markets.! Macroeconomics is the study of economy-wide phenomena, including inflation, unemployment, and economic growth.! These two branches of economics are closely intertwined, yet distinct—they address different questions.32Summary• As scientists, economists try to explain the world using models with appropriate assumptions. • Two simple models are the Circular-Flow Diagram and the Production Possibilities Frontier.• Microeconomics studies the behavior of consumers and firms, and their interactions in markets. Macroeconomics studies the economy as a whole.• As policy advisers, economists offer advice onhow to improve the world.Graphing: a brief review! Graphs purposes:! Visually express ideas that might be less clear ifdescribed with equations or words! Powerful way of finding and interpreting patterns ! Graphs of a single variable! Pie chart! Bar graph! Time-series graph42Types of Graphs (a)Figure A-1The pie chart in panel (a) shows how the U.S. national income in 2011 was derivedfrom various sources.Figure A-1 Types of Graphs (b)The bar graph in panel (b) compares the 2011 average income in four countries.Types of Graphs (c)Figure A-1The time-series graph in panel (c) shows the productivity of labor in U.S.businesses from 1950 to 2010.Graphing: a brief review! Graphs of two variables: the coordinate system ! Display two variables on a single graph! Scatterplot! Ordered pairs of points! x-coordinate– Horizontal location! y-coordinate– Vertical location46Using the Coordinate SystemGrade point average is measured on the vertical axis and study time on thehorizontal axis. Albert E., Alfred E., and their classmates are represented by variouspoints. We can see from the graph that students who study more tend to get higher grades.Graphing: a brief review! Curves in the coordinate system! Data! Number of novels purchased! Price of novels! Income! Demand curve! Effect of a good s price! On the quantity of the good consumers want tobuy! For a given income48Table A-1Novels Purchased by EmmaThis table shows the number of novels Emma buys at various incomes and prices. For any given level of income, the data on price and quantity demanded can be graphed to produce Emmas demand curve for novels, as shown in Figures A-3 and A-4.Graphing: a brief review! Negatively related variables! The two variables move in opposite direction! Downward sloping curve! Positively related variables! The two variables move in the same direction! Upward sloping curve! Movement along a curve! Shifts in a curve50! Slope! Fairly flat upward-sloping line! Slope is a small positive number! Steep upward-sloping line! Slope is a large positive number! Downward sloping line! Slope is a negative number! Horizontal line! Slope is zero! Vertical line: infinite slope54。
第2章宏观经济学的数据2.1 复习笔记跨考网独家整理最全经济学考研真题,经济学考研课后习题解析资料库,您可以在这里查阅历年经济学考研真题,经济学考研课后习题,经济学考研参考书等内容,更有跨考考研历年辅导的经济学学哥学姐的经济学考研经验,从前辈中获得的经验对初学者来说是宝贵的财富,这或许能帮你少走弯路,躲开一些陷阱。
以下内容为跨考网独家整理,如您还需更多考研资料,可选择经济学一对一在线咨询进行咨询。
1.国内生产总值(GDP)国内生产总值指一定时期内(通常为一年),一个经济体生产的所有最终产品和服务的市场价值总和。
它是一个地域概念。
(1)核算GDP的两种方法:支出法和收入法从整个宏观经济体系来看,支出和收入必然相等,所以可以从支出和收入两个角度来对国内生产总值进行核算。
①支出法指从支出角度衡量的国内生产总值。
GDP是一个国家(或地区)在一定时期内消费、投资、政府购买以及净出口四方面支出的总和。
公式如下:=+++GDP C I G NX其中C为消费,I为投资,G为政府购买,NX为净出口。
②收入法指用要素收入即企业生产成本核算国内生产总值。
严格来说,最终产品市场价值除了生产要素收入构成的成本以外,还有间接税、折旧、公司未分配利润等内容。
公式如下:GDP=工资+利息+租金+利润+间接税和企业转移支付+折旧(2)实际GDP和名义GDP名义GDP是指用生产物品和劳务的当年价格计算的全部最终产品的市场价值,它没有考虑通货膨胀因素。
由于通货膨胀等原因,价格可能会发生强烈变化,故为方便比较而引入实际GDP的概念。
实际GDP是指用从前某一年的价格作为基期价格计算出来的当年全部最终产品的市场价值。
二者之间的关系式为:实际GDP=名义GDP÷GDP平减指数。
(3)国民收入核算恒等式国民收入核算恒等式:GDP Y C I G NX==+++。
其中C为消费,I为投资,G为政府购买,NX为净出口。
①消费指消费者个人购买的产品和服务的价值。
曼昆版经济学原理(宏观经济学分册)第七版课后题及答案1下列每种交易会影响CDP的哪一部分(如果有影响的话)?并解释之。
A.家庭购买了一台新冰箱。
答:家庭购买了一台新冰箱会增加GDP中的消费(C)部分,因为家庭用于家用电器的支出计算在消费的耐用品类中。
B.杰妮姑妈买了一所新房子。
答:杰妮姑妈买了一所新房子会增加GDP中的投资(1)部分,因为家庭住宅能长期供人居住,提供服务。
它比一般耐用消费品的使用寿命更长,因此把住宅房屋的投资计算在投资中。
C、福特汽车公司由其存货中出售了一部雷鸟牌汽车。
答:福利汽车公司由其存货中出售了一部雷鸟牌汽车会减少现期GDP中的投资,因为销售中间物品存货时,企业的存货投资就是负的,因而减少了当期的GDP。
C.您买了一个比萨饼。
答:我买了一个比萨饼会增加GDP中的消费(C),因为我用于购买食品的支出计算在消费的非耐用品类中。
D.加利福尼亚重新铺设了101号高速公路。
答:加利福尼亚重新铺设了101号高速公路增加了GDP中的政府购买(G),因为修建高速公路就是政府的行为。
E.您的父母购买了一瓶法国红酒。
答:我的父母购买了一瓶法国红酒会减少GDP中的净出口(NX),因为法国红酒就是进口食品,它的购买增加了美国的进口。
F.本田公司扩大其在俄亥俄州马利斯维尔的工厂。
答:本田公司扩大其在俄亥俄州马利斯维尔的工厂增加了GDP中的净出口(NX),因为本田公司就是一家日本企业,它在美国的投资减少了美国对日本本田汽车的进口,使NX增加2.GDP组成部分中的“政府购买”并不包括用于社会保障这类转移支付的支出。
想想GDP 的定义,解释为什么转移支付不包括在政府购买内?答:因为转移支付并不就是要交换现在生产的物品或劳务,从宏观经济的角度瞧,转移支付就像税收与回扣一样。
转移支付与税收一样改变了家庭收入,但并没有反映经济的生产。
由于GDP就是要衡量在某一既定时期一个国家从物品与劳务的生产中得到的收入,所以,不把转移支付包括在政府购买内。