地质聚合物参考幻灯片
- 格式:ppt
- 大小:976.00 KB
- 文档页数:29
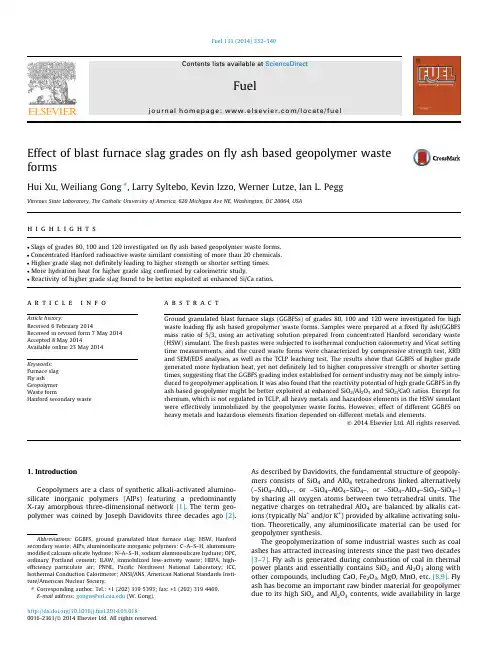
Effect of blast furnace slag grades on fly ash based geopolymer wasteformsHui Xu,Weiliang Gong ⇑,Larry Syltebo,Kevin Izzo,Werner Lutze,Ian L.PeggVitreous State Laboratory,The Catholic University of America,620Michigan Ave NE,Washington,DC 20064,USAh i g h l i g h t sSlags of grades 80,100and 120investigated on fly ash based geopolymer waste forms. Concentrated Hanford radioactive waste similant consisting of more than 20chemicals. Higher grade slag not definitely leading to higher strength or shorter setting times. More hydration heat for higher grade slag confirmed by calorimetric study.Reactivity of higher grade slag found to be better exploited at enhanced Si/Ca ratios.a r t i c l e i n f o Article history:Received 6February 2014Received in revised form 7May 2014Accepted 8May 2014Available online 23May 2014Keywords:Furnace slag Fly ashGeopolymer Waste formHanford secondary wastea b s t r a c tGround granulated blast furnace slags (GGBFSs)of grades 80,100and 120were investigated for high waste loading fly ash based geopolymer waste forms.Samples were prepared at a fixed fly ash/GGBFS mass ratio of 5/3,using an activating solution prepared from concentrated Hanford secondary waste (HSW)simulant.The fresh pastes were subjected to isothermal conduction calorimetry and Vicat setting time measurements,and the cured waste forms were characterized by compressive strength test,XRD and SEM/EDS analyses,as well as the TCLP leaching test.The results show that GGBFS of higher grade generated more hydration heat,yet not definitely led to higher compressive strength or shorter setting times,suggesting that the GGBFS grading index established for cement industry may not be simply intro-duced to geopolymer application.It was also found that the reactivity potential of high grade GGBFS in fly ash based geopolymer might be better exploited at enhanced SiO 2/Al 2O 3and SiO 2/CaO ratios.Except for rhenium,which is not regulated in TCLP,all heavy metals and hazardous elements in the HSW simulant were effectively immobilized by the geopolymer waste forms.However,effect of different GGBFS on heavy metals and hazardous elements fixation depended on different metals and elements.Ó2014Elsevier Ltd.All rights reserved.1.IntroductionGeopolymers are a class of synthetic alkali-activated alumino-silicate inorganic polymers (AIPs)featuring a predominantly X-ray amorphous three-dimensional network [1].The term geo-polymer was coined by Joseph Davidovits three decades ago [2].As described by Davidovits,the fundamental structure of geopoly-mers consists of SiO 4and AlO 4tetrahedrons linked alternatively (–SiO 4–AlO 4–,or –SiO 4–AlO 4–SiO 4–,or –SiO 4–AlO 4–SiO 4–SiO 4–)by sharing all oxygen atoms between two tetrahedral units.The negative charges on tetrahedral AlO 4are balanced by alkalis cat-ions (typically Na +and/or K +)provided by alkaline activating solu-tion.Theoretically,any aluminosilicate material can be used for geopolymer synthesis.The geopolymerization of some industrial wastes such as coal ashes has attracted increasing interests since the past two decades [3–7].Fly ash is generated during combustion of coal in thermal power plants and essentially contains SiO 2and Al 2O 3along with other compounds,including CaO,Fe 2O 3,MgO,MnO,etc.[8,9].Fly ash has become an important raw binder material for geopolymer due to its high SiO 2and Al 2O 3contents,wide availability in large/10.1016/j.fuel.2014.05.0180016-2361/Ó2014Elsevier Ltd.All rights reserved.Abbreviations:GGBFS,ground granulated blast furnace slag;HSW,Hanford secondary waste;AIPs,aluminosilicate inorganic polymers;C–A–S–H,aluminium-modified calcium silicate hydrate;N–A–S–H,sodium aluminosilicate hydrate;OPC,ordinary Portland cement;ILAW,immobilized low-activity waste;HEPA,high-efficiency particulate air;PNNL,Pacific Northwest National Laboratory;ICC,Isothermal Conduction Calorimeter;ANSI/ANS,American National Standards Insti-tute/American Nuclear Society.⇑Corresponding author.Tel.:+1(202)3195393;fax:+1(202)3194469.E-mail address:gongw@ (W.Gong).quantities,sound property of the hardened products,low cost in comparison to those of traditional calcined natural clays,as well as significant environmental benefits including natural resource preservation,low energy consumption and reduced CO2emission [10–13].However,former studies have also revealed that,gener-ally,the dissolution offly ash at room temperature had not com-pleted before thefinal hardened structure was formed[5,6,14]. The relatively low reactivity offly ash usually led to slow setting of the fresh paste and poor compressive strength of the hardened material[15,16].In many cases,forfly ash based geopolymers, an elevated curing temperature of40–85°C is needed to favor a better compressive strength gain[17,18].In order to compensate the disadvantages offly ash in geopoly-merization,ground granulated blast furnace slag(GGBFS)has been incorporated intofly ash based geopolymers[19,20].GGBFS is an amorphous by-product of the steel industry with a latent hydraulic reactivity,which can be catalyzed by proper activators to form cementitious materials[21,22].The incorporation of calcium-rich GGBFS intofly ash based geopolymers may improve the setting time and compressive strength of the geopolymer by forming alu-minium-modified calcium silicate hydrate(C–A–S–H)gel in addi-tion to the sodium aluminosilicate hydrate(N–A–S–H)gel (geopolymer gel)[23,24]and compacting the microstructure[25].On the other hand,GGBFS has been recognized as one of the major cementitious materials in ordinary Portland cement(OPC) concretes[26].For the cement industry,an ASTM C989standard has been established,which classifies GGBFS into three strength grades,i.e.80,100and120[27].According to ASTM C989,the strength grades of GGBFS are determined by their slag activity indexSlag activity index;%¼SP=PÂ100where SP represents average compressive strength of the slag-refer-ence cement cubes consisting of50wt%slag and50wt%Portland cement,and P is the average compressive strength of the reference cement cubes of100wt%Portland cement.The ASTM C989stan-dard is briefed in Table1.Although incorporation of different amounts of one GGBFS into fly ash and/or metakaolin based geopolymers has received inten-sive investigation[19,20,25,28],the implication of the GGBFS grad-ing index to geopolymer synthesis remains poorly understood. Besides,to the authors’best knowledge,no study on effect of GGBFSs of different grades on chemical durability offly ash based geopolymer waste forms has ever been published.The present study,therefore,investigated the effect of GGBFSs of grades80,100and120onfly ash based geopolymer waste forms.A concentrated Hanford secondary waste(HSW)stream simulant containing5mol/L sodium and spiked with100mg/L NaReO4(as an analogue for radionuclide99Tc)was employed to prepare the alkaline activating solution.The geopolymer waste forms were cured at room temperature and characterized by iso-thermal conduction calorimetry,setting time and compressive strength measurements,X-ray diffractography(XRD),scanning electron microscopy(SEM),energy dispersive X-ray spectrum (EDS),as well as the toxicity characteristic leaching procedure (TCLP)leach test[29].2.Materials and methods2.1.Raw materialsThe major raw binder materials used in this study are class Ffly ash from Brandon Shores Power Plant provided by Separation Technologies LLC,GGBFS grades80and120provided by Lafarge North America Inc.,and GGBFS grade100provided by Holcim US Inc.An amorphous silica fume,obtained from Norchem Inc.,was employed at8.67wt%of the sum of thefly ash and GGBFS as par-tial replacement of thefly ash and GGBFS in some samples.A Type 5A8Â12mesh molecular sieve(Zeolite5A),obtained from Delta Enterprises,was ground tofine powders and used as an additive at1wt%of the paste.Chemical compositions of the raw materials as analyzed by X-rayfluorescence(XRF)are given in Table2.Par-ticle size distributions of thefly ash and GGBFSs are shown in Fig.1.2.2.Hanford secondary waste simulantsLiquid Hanford secondary waste(HSW)simulant S1was used to prepare the alkaline activating solution for thefly ash based geo-polymer waste forms.The HSW simulant S1represents the base-line for the immobilized low-activity waste(ILAW)off-gas caustic scrubber effluent downstream of the high-efficiency partic-ulate air(HEPA)filters at the Hanford Site,WA.The composition of HSW simulant S1,as provided by Pacific Northwest National Labo-ratory(PNNL),indicates a1mol/L sodium concentration[30].In this study,the sodium concentration for HSW simulant S1was increased to5mol/L.It is assumed that radionuclide technetium-99will occur in the HSW waste stream in its most soluble form, i.e.pertechnetate TcO4À[30].Therefore,rhenium was spiked as NaReO4into the simulant as an analogue for technetium-99in its soluble form99TcO4À.The recipe for a10L batch of the HSW simu-lant S1prepared in this study is presented in Table3.2.3.Geopolymer preparationThe activating solution was prepared from the HSW simulant S1 without additional water.Under mechanical stirring,sodium hydroxide was dissolved into the simulant.After cooled to room temperature,the solution was mixed with solid binder materials on a Lancaster K-Lab mixer for several minutes.Most of the obtained paste was cast into5.08Â10.16cm cylindrical plastic molds,whereas a small portion of the fresh paste was subjected to the setting time test.The molded samples were immediately placed on a vibrating table for about two minutes to remove entrapped air bubbles.Then,the samples were sealed with lids and cured at room temperature for designated ages.For all the GGBFSs,two formulations,A and B,were designed to prepare thefly ash based geopolymer waste forms.While formula-tion A is a simplefly ash-GGBFS system containing1.0wt%addi-tive of zeolite5A,formulation B replaces8.67wt%of the sum of thefly ash and GGBFS by soluble silica fume.However,thefly ash/GGBFS mass ratios were kept constant at5/3throughout the study.A summarized recipe for the geopolymer waste forms of the two formulations is presented in Table4.Each recipe was tai-lored for a6.2kg batch of fresh geopolymer paste,usually yielding fourteen tofifteen cylindrical samples.The nomenclature used for geopolymer sample ID is given in Table5.Table1ASTM C989standard for the classification of different grade slag.Day index GradetypeMinimum slag activity index%Average of lastfiveconsecutive samplesAny individualsample7days Grade80––Grade1007570Grade120959028days Grade807570Grade1009590Grade120115110H.Xu et al./Fuel133(2014)332–3403332.4.Methods of analysisHeat evolutions of fresh geopolymer waste form pastes were measured at25°C on a TAM Air Model3116Isothermal Conduc-tion Calorimeter(ICC).Initial andfinal setting times of the pastesSetting time is an important parameter in practice for cementi-tious pastes,which determines the time available for transport, placing and compaction of the materials.In this study,the initial andfinal setting times of the fresh geopolymer pastes were mea-sured on a Humboldt vicat apparatus.The results are given in Table6.The major factors influencing geopolymer setting times may include the chemical and phase compositions of raw binder mate-rials,nature of alkaline activating solution,water-to-geopolymer solids ratio,fineness of the solids,as well as curing temperature [4,31].Since the class Ffly ash,alkaline activating solution, water-to-geopolymer solids ratio and curing temperature were kept constant throughout this work,the compositions andfineness of the GGBFS are believed to be responsible for the differences in the setting times.Chindaprasirt has reported that higher reactive contents andfiner particle size of the raw binder material led to faster reaction and setting of the geopolymer pastes[32].Forfly ash-furnace slag based geopolymers,Kumar has observed that the reaction at27°C was dominated by activation of the GGBFS, whereas that at60°C was due to combined interaction offly ash and GGBFS[25].As presented in Table6,for thefly ash based geopolymer sam-ples of both A and B formulations,GGBFS grade120established the shortest initial andfinal setting times,whereas GGBFS grade100 held the longest initial andfinal setting times.As revealed by the results of XRF analysis(Table1),the GGBFS grade120contains the highest calcium contents(40.90wt%as oxide);GGBFS grade 80,the second(37.38wt%as oxide);and GGBFS grade100,the lowest(36.62wt%as oxide).Thus the obtained setting times areTable2Chemical compositions of raw materials as determined by X-rayfluorescence(wt%).Composition Ground blast furnace slag Fly ash Silica fume Zeolite5A Grade80Grade100Grade120Al2O39.597.269.9727.250.1626.30 BaO0.150.060.110.100.000.01 CaO37.3836.4840.720.700.4510.96 Fe2O30.550.360.48 3.060.07 1.01 K2O0.540.420.44 3.260.430.54Fig.1.Particle size distributions offly ash and ground granulated blast furnaceslags of grades80,100and120.Table3Recipe for a10L batch of Hanford secondary waste(HSW)stream simulant S1containing5mol/L sodium and100mg/L rhenium.Order of addition Analyte Targetmol/LReagent Assay Targetmass(g)1Ag 1.30EÀ05AgNO30.9990.0321As 6.96EÀ05Na2HAsO4Á7H2O 1.0000.3261Al 1.88EÀ01Al(OH)30.990221.8381Cd 3.14EÀ06Cd(NO3)2Á4H2O0.9850.0151CO32À 4.56EÀ02Na2CO3 1.00072.4721Cr 4.06EÀ04Na2Cr2O7Á2H2O0.990 1.8321PO43À 1.37EÀ02Na2HPO4Á7H2O0.99055.7591Si 3.76EÀ03Na2SiO30.9807.0211SO42À8.82EÀ03Na2SO40.99018.9711NO3À 6.56EÀ01NaNO30.980851.3181NO2À 2.40EÀ02NaNO20.98025.3321Cl 4.50EÀ02NaCl0.98040.2331F 1.11EÀ03NaF0.9900.6821K 1.17EÀ03KNO30.990 1.7851Pb 1.80EÀ05Pb(NO3)20.9900.0901TOC 1.67EÀ01Na2C2O40.980343.0561TOC 2.05EÀ02(COOH)2Á2H2O0.98039.4402H2O 5.29E+01H2O 1.00014288.1273OH7.94EÀ01NaOH0.987482.7844Tc 2.69EÀ04HReO40.562 1.781Spiking level:Re=100mg/L Total16447.521334H.Xu et al./Fuel133(2014)332–340in well accordance with thefindings of Chindaprasirt and Kumar. In addition to the highest calcium content,the GGBFS grade120 has thefinest particle size(Fig.1),which may also contribute to the shortest setting times[31,32].For each GGBFS,it can be found from Table6that formulation B gave longer setting times than formulation A,with thefinal setting time of sample GEO120B as the only exception.For geopolymers,increased setting times have been linked to a high SiO2/Al2O3molar ratio by De Silva[33]. Therefore,the longer setting times of formulation B may be attrib-uted to the higher molar ratios of Si/Al(as shown in Table5),which developed the highest28-day compressive strength of74.4MPa, which is more than40%higher than49.7MPa for GEO80B and 52.5MPa for GEO100B.In addition,all formulation B samples dis-played better strength development than their formulation A coun-terparts.The28-day compressive strengths of samples GEO80B, GEO100B and GEO120B are28.1%,39.2%and108.4%higher than those of GEO80A,GEO100A and GEO120A,respectively.Although GGBFS grade100was supposed to be more reactive than GGBFS grade80,no significant difference between the com-pressive strengths of samples GEO100B and GEO80B was observed at all curing ages,partly due to the similar CaO contents and par-ticle sizes of the two slags as shown in Fig.1and Table2.It is well accepted that the easiness of alkali-activation and hydration of slag strongly depend on the chemistry and mineralogy of the slag,including the particle size and degree of amorphicity, along with the nature and concentration of the alkaline activator as well the curing conditions[34–37].It is also known that the incorporation of calcium-rich GGBFS intofly ash based geopolymers may improve the compressive strength by forming C–A–S–H gel in the geopolymer matrix [24,25].Therefore,the highest calcium content(Table2)in GGBFSTable4Recipe forfly ash based geopolymer waste forms of formulations A and B.Order of addition Chemical and material Assay Target weight(g)Formulation A Formulation B1HSW simulant S1a 1.0001618.21610.3 2NaOH0.990320.3320.0 3Furnace slag 1.0001582.21445.9 3Fly ash 1.0002636.92409.9 3Zeolite5A 1.00062.162.1 4Silica fumefiller 1.0000.0365.7a HSW simulant S1containing5mol/L sodium and spiked with100mg/L rhenium.Table5Nomenclature for geopolymer sample ID.Sample ID GGBFS grade FormulationGEO80A80AGEO100A100AGEO120A120AGEO80B80BGEO100B100BGEO120B120Bpressive strength offly ash based geopolymer waste forms.H.Xu et al./Fuel133(2014)332–340335significantly enhanced compressive strength ofples may be attributed to the addition of the acted as a reactivefiller and providedthe geopolymer pastes.From theview,all geopolymer samples investigated in the waste form acceptance criteria of at least 3.3.Isothermal conduction calorimetryGeopolymerization is a complex process steps such as dissolution,precipitation, condensation,which are largely coupled and [25].In order to record the early stage of the terms of heat evolution,six small batches pastes were prepared within30min,and required after placement of the samples in cally45min,was significantly shortened to time has been adjusted for each samplemixing and the results of the calorimetric test are shown in Figs.3 and4.It is well known that,at room temperature,geopolymerization offly ash is extremely slow and the calorimetric response is typical of a dissolution–precipitation reaction[5,6,25].Thus the early stage heat evolution of alkali-activatedfly ash and GGBFS mixtures is believed to be majorly contributed by hydration of GGBFS. Besides,it should be kept in mind that the heatflow curve repre-sents several overlapping chemical reactions[25,41].It was reported by Shi and Day[42]that,for alkali-activated slag at 25°C,a small initial peak appeared just after the addition of the activator solution,which might followed immediately by an addi-be better exploited by addition of reactive silica source,which is supported by the compressive strength data(Section3.2).It was also found that the addition of silica fume extended the times for the heatflow peaks to occur,suggesting longer setting times for samples with silica fumefiller,which is in consistence with the Vicat test results(Table6)and the report by De Silva[33].3.4.X-ray diffractographyThe XRD patterns of the major raw materials and geopolymer waste forms are shown in Figs.5and6,respectively.In Fig.5,a diffuse halo peak is seen for each of the XRD pattern, indicating that all the major raw materials are predominately X-ray amorphous.No distinct crystalline peak was observed for the GGBFS grades100and120.For the GGBFS grade80,a minor level of calcium silicate(Ca2SiO4)(PDF#00-033-0303)was found, which was also identified by Tossavainen et al.and Luxán et al. different furnace slags[43,44].The XRD pattern of thefly ash reveals two major crystalline phases,i.e.quartz(SiO2)(PDF#00-046-1045)and mullite(Al6Si2O13)(PDF#00-015-0776).BothFig.3.Effect of different ground granulated blast furnace slags on heat evolution ash based geopolymer waste forms without silica fumefiller.Fig.4.Effect of different ground granulated blast furnace slags on heat evolution ash based geopolymer waste forms with silica fumefiller.5.X-ray diffraction patterns of class Ffly ash,ground granulated blast furnaceand silica fume.Q=quartz(SiO2);M=mullite(Al6Si2O13);and C=calcium silicate(Ca2SiO4).336the phases are typical for class F fly ash [18,23,24].A considerable amount of amorphous material in the fly ash is indicated by the broad diffuse hump at 15–30deg (2h ).The amorphous nature of the silica fume is confirmed by the broad diffuse hump centered at around 21deg (2h ).For all the GGBFSs,the similar hump at the same 2h region suggests that the major amorphous phases in the three GGBFSs may possibly be the same.As shown in Fig.6,the XRD patterns for all the geopolymer waste forms are quite similar.No substantial difference was observed among the XRD patterns for all the six samples with slags of different grades.The amorphous nature of geopolymer is revealed by the broad diffuse humps at 15–38deg (2h ).The crys-talline phases of the geopolymer waste forms include quartz and mullite,which are the major crystals present in the fly ash (Fig.5).By comparing the XRD patterns in Figs.5and 6,two new crystalline phases,i.e.cancrinite (Na 6Ca 2Al 6Si 6O 24(CO 3)2Á2H 2O)(PDF #00-046-1332)and nitratine (NaNO 3)(PDF #00-036-1474),were identified in all the geopolymer waste form samples.The formation of cancrinite was also observed in an alkali-activated metakaolin-slag waste form by Chen et al.[45]and in an alkali-activated fly ash by Singh et al.[46].It is also a reflection of the notable amount of sodium carbonate in the HSW stream simulant in this study as shown in Table 3.The presence of nitra-tine in all the geopolymer waste form samples investigated is attributed to the remarkable inventory of sodium nitrate in the waste simulant (Table 3).It is,however,difficult to identify the N–A–S–H and C–A–S–H gels formed with XRD techniques due to their amorphous and semi-crystalline nature,respectively [47,48].3.5.SEM micrographs and EDS spectraSEM micrographs of all the geopolymer samples are shown in Fig.7.Fig.7b,d and f shows a generally more condense gel struc-ture for formulation B in comparison to that for formulation A in Fig.7a,c and e.This suggests that samples of formulation B may develop higher compressive strengths than those of formulation A [7],which is consistent with the results of compressive strength test (Fig.2).Besides,Fig.7displays a very similar heterogeneousbinding matrix with particles of various shapes and sizes for all the geopolymer samples.Take Fig.7f for example,the light gray angular particle and the gray spherical particle marked in Fig.7f were identified as unre-acted residues of the GGBFS grade 120and fly ash,respectively [20].Both of the unreacted GGBFS and fly ash are distinct from the porous binder [23].Heterogeneously distributed cavities were found both inside and outside the remnant fly ash particles,indi-cating a more porous microstructure for fly ash geopolymer [24,49].The EDS spectrum of the GGBFS particle (not shown herein)revealed 36.3wt%CaO,37.5wt%SiO 2,and 8.8wt%Al 2O 3at the testing spot,which are in acceptable agreement with the results of the elemental analysis in Table 2(40.9wt%CaO,37.3wt%SiO 2,and 10.0wt%Al 2O 3).For the fly ash pellet marked in Fig.7f,the sil-icon and aluminium contents obtained by EDS analysis are 56.5wt%SiO 2and 30.9wt%Al 2O 3,which are close to 61.2wt%SiO 2and 27.6wt%Al 2O 3in Table 2,respectively.The bright sphere partially shown in Fig.7f,containing 76.4wt%Fe as indicated by the EDS data,is an iron-rich particle,which may be attributed to the ferrite spinels present in the fly ash [24].Fig.8presents the SEM micrograph and EDS spectra of sample GEO120B,showing the heterogeneous nature of the binder gel.The results of EDS analyses for spectra 1and 2were summarized in Table 7.As shown in Fig.8and Table 7,the EDS spectrum 1revealed a molar ratio of M T /M Al =0.18,where M T =M Na +M K +2-M Ca ,indicating the formation of N–A–S–H gel.For the spectrum 2,a much higher M T /M Al of 4.38was found,suggesting the pres-ence of a hybrid of N–A–S–H and C–A–S–H gels in the geopolymer matrix.The N–A–S–H gel area of spectrum 1exhibits a notably different morphological feature compared to the N–A–S–H and C–A–S–H hybrid gel area of spectrum 2,which is associated with the different mineralogy and shapes of fly ash and GGBFS particles,and in particular the differences in solubility and reaction product gel nature between fly ash geopolymer and alkali-activated slag precursors [24].3.6.Toxicity characteristic leaching procedure (TCLP)The TCLP leaching test on the fly ash based geopolymer waste forms was conducted after 28days of curing under room temper-ature,and the results are presented in Table 8.As shown in Table 8,the concentrations of Cd,Ag and As in the TCLP leachates are all lower than their respective detection limits,except for that of Cd from sample GEO80B,which just reached its detection limit.Thus Cd,Ag and As were effectively immobilized by any of the geopolymer waste forms.In both A and B formula-tions,Cr was best stabilized by samples with GGBFS grade 120and Pb was best fixed by samples with GGBFS grade 100.For for-mulation A,sample GEO100A revealed best fixation on Pb,Ba and Re.However,in formulation B,only Pb was best fixed by sam-ple GEO100B.The relatively high Pb concentration in the TCLP leachate was attributed to the relatively high Pb inventory in the raw material (fly ash).For all the waste form samples,the best fix-ation of Cr and Re were achieved by GEO120A and GEO100A,where as Pb and Ba were best immobilized by GEO100B and GEO120B,respectively.In general,the effect of GGBFS of different grades on immobilization of the hazardous elements and Re by the fly ash based geopolymer waste forms differed for different ele-ments.Besides,the replacement of small portion of fly ash and GGBFS by amorphous silica fume also played a role on the hazard-ous elements and Re fixation through altering the host matrices of the waste forms [50].However,the use of the silica fume did not give rise to an overall advantage on fixation of the hazardous ele-ments and Re.Except for Re,which is not regulated in TCLP and better determined by the American National StandardsInstitute/6.X-ray diffraction patterns of geopolymer waste forms.Q =quartz (SiO mullite (Al 6Si 2O 13);C =cancrinite (Na 6Ca 2Al 6Si 6O 24(CO 3)2Á2H 2O);and N =(NaNO 3).133(2014)332–340337American Nuclear Society(ANSI/ANS)-16.1leaching test[30],all the hazardous elements have been effectively immobilized by any of thefly ash based geopolymer waste forms as per the US EPA limit.image offly ash based geopolymer waste forms for a.GEO80A,b.GEO80B,c.GEO100A,d.GEO100B,e.GEO120A,andimage and EDS spectra offly ash based geopolymer waste form GEO120B,showing the coexistence of N–A–S–H gel and C–A–S–H gel in one geopolymer4.ConclusionsEffect of ground granulated blast furnace slags(GGBFSs)of dif-ferent grades,i.e.,grades80,100and120,onfly ash based geopoly-mers waste forms was investigated forfixation of a concentrated Hanford secondary waste(HSW)stream simulant.The results show that higher grade GGBFS generated more hydration heat, suggesting higher reactivity for higher grade GGBFS in geopoly-merization.However,the incorporation of GGBFS of higher grade infly ash based geopolymer may not definitely lead to shorter set-ting time and higher compressive strength.The potential of higher grade GGBFS for compressive strength development could be bet-ter exploited with the presence of additional amorphous silica source.The setting time and compressive strength offly ash based geopolymer incorporated with GGBFS are believed to be deter-mined by the coexistence of sodium aluminosilicate hydrate (N–A–S–H)gel(geopolymer gel)and aluminium-modified calcium silicate hydrate(C–A–S–H)gel,which is supported by the XRD/EDS results.Although the effect of GGBFS of different grades on chem-ical durability of thefly ash based geopolymer waste forms differed for different hazardous elements,the results of the TCLP leaching test indicate that all geopolymer waste forms investigated in this work have met the US EPA limits for immobilization of toxic heavy metals and hazardous elements.AcknowledgmentsLafarge North America Inc.,Holcim US Inc.,Separation Technol-ogies LLC and Norchem Inc.are gratefully appreciated for providing the furnace slags,Class Ffly ash and silica fume,respectively. References[1]Provis JL,van Deventer JSJ.Geopolymerisation kinetics. 1.In situ energy-dispersive X-ray diffractometry.Chem Eng Sci2007;62:2309–17.[2]Davidovits J.Mineral polymers and methods of making Patent;1982,4349386.[3]Gong W,Lutze W,Chen C,Pegg IL.Reactivity offly ash in strongly alkaline Patent;2011,0052921A1.[4]Chindaprasirt P,Rattanasak U.Utilization of blendedfluidized bed combustion(FBC)ash and pulverized coal combustion(PCC)fly ash in geopolymer.Waste Manage2010;30:667–72.[5]Chen C,Gong W,Lutze W,Pegg IL,Zhai J.Kinetics offly ash leaching in stronglyalkaline solutions.J Mater Sci2011;46:590–7.[6]Chen C,Gong W,Lutze W,Pegg IL.Kinetics offly ash geopolymerization.JMater Sci2011;46:3073–83.[7]Xu H,Li Q,Shen L,Zhang M,Zhai J.Low-reactive circulatingfluidized bedcombustion(CFBC)fly ashes as source material for geopolymer synthesis.Waste Manage2010;30:57–62.[8]Li F,Zhai J,Fu X,Sheng G.Characterization offly ashes from circulatingfluidized bed combustion(CFBC)boilers cofiring coal and petroleum coke.Energy Fuel2006;20:1411–7.[9]Li Q,Xu H,Fu X,Chen C,Zhai J.Effects of circulatingfluidized bed combustion(CFBC)fly ashes asfiller on the performances of Pac J Chem Eng 2009;4:226–35.[10]Duxson P,Provis JL,Lukey GC,van Deventer JSJ.The role of inorganic polymertechnology in the development of‘green concrete’.Cem Concr Res 2007;37:1590–7.[11]Andini S,CioffiR,Colangelo F,Grieco T,Montagnaro F,Santoro L.Coalfly ash asraw material for the manufacture of geopolymer-based products.Waste Manage2008;28:416–23.[12]Li F,Li Q,Zhai J,Sheng G.Effect of zeolitization of CFBCfly ash onimmobilization of Cu2+,Pb2+,and Cr3+.Ind Eng Chem Res2007;46: 7087–95.[13]Chindaprasirt P,Jaturapitakkul C,Chalee W,Rattanasak parative studyon the characteristics offly ash and bottom ash geopolymers.Waste Manage 2009;29:539–43.[14]Somna K,Jaturapitakkul C,Kajitvichyanukul P,Chindaprasirt P.NaOH-activated groundfly ash geopolymer cured at ambient temperature.Fuel 2011;90:2118–24.[15]Puertas F,Martı´nez-Ramı´rez S,Alonso S,Vázquez T.Alkali-activatedfly ash/slag cements:strength behaviour and hydration products.Cem Concr Res 2000;30:1625–32.[16]Kirschner A,Harmuth H.Investigation of geopolymer binders with respect totheir application for building materials.Ceram-Silik2004;483:117–20. [17]Bakharev T.Geopolymeric materials prepared using Class Ffly ash andelevated temperature curing.Cem Concr Res2005;35:1224–32.[18]Palomo A,Grutzeck MW,Blanco MT.Alkali-activatedfly ashes:a cement forthe future.Cem Concr Res1999;29:1323–9.[19]Li Z,Liu S.Influence of slag as additive on compressive strength offly ash-based geopolymer.J Mater Civ Eng2007;19:470–4.[20]Escalante Garcia JI,Campos-Venegas K,Gorokhovsky A,Fernández A.Cementitious composites of pulverised fuel ash and blast furnace slag activated by sodium silicate:effect of Na2O concentration and modulus.Adv Appl Ceram2006;105:201–8.[21]Shi C.Steel slag-its production,processing,characteristics,and cementitiousproperties.J Mater Civ Eng2004;16:230–6.[22]Lecomte I,Henrist C,Liégeois M,Maseri F,Rulmont A,Cloots R.(Micro)-structural comparison between geopolymers,alkali-activated slag cement and Portland cement.J Eur Ceram Soc2006;26:3789–97.[23]Bernal SA,Provis JL,Walkley B,San Nicolas R,Gehman JD,Brice DG,et al.Gelnanostructure in alkali-activated binders based on slag andfly ash,and effects of accelerated carbonation.Cem Concr Res2013;53:127–44.[24]Ismail I,Bernal SA,Provis JL,San Nicolas R,Hamdan S,van Deventer JSJ.Modification of phase evolution in alkali-activated blast furnace slag by the incorporation offly ash.Cem Concr Compos2014;45:125–35.[25]Kumar S,Kumar R,Mehrotra SP.Influence of granulated blast furnace slag onthe reaction,structure and properties offly ash based geopolymer.J Mater Sci 2010;45:607–15.[26]Osborne GJ.Durability of Portland blast-furnace slag cement concrete.CemConcr Compos1999;21:11–21.[27]American Society for Testing and Materials,ASTM,C989-99.[28]Bernal SA,Provis JL,Rose V,Mejía de Gutiérrez R.Evolution of binder structurein sodium silicate-activated slag-metakaolin blends.Cem Concr Compos 2011;33:46–54.[29]EPA Method1311:Toxicity characteristic leaching procedure(TCLP).1992.[30]Gong W,Lutze W,Pegg IL.DuraLith alkali-aluminosilicate geopolymer wasteform testing for Hanford secondary waste.PNNL-20565;2011.[31]Chindaprasirt P,Chareerat T,Hatanaka S,Cao T.High-strength geopolymerusingfine high-calciumfly ash.J Mater Civ Eng2011;23:264–70.[32]Chindaprasirt P,Homwuttiwong S,Sirivivatnanon V.Influence offly ashfineness on strength,drying shrinkage and sulfate resistance of blended cement mortar.Cem Concr Res2004;34:1087–92.[33]De Silva P,Sagoe-Crenstil K,Sirivivatnanon V.Kinetics of geopolymerization:role of Al2O3and SiO2.Cem Concr Res2007;37:512–8.[34]Ben Haha M,Lothenbach B,Le Saout G,Winnefeld F.Influence of slagchemistry on the hydration of alkali-activated blast-furnace slag–Part I:effect of MgO.Cem Concr Res2011;41:955–63.[35]Ben Haha M,Lothenbach B,Le Saout G,Winnefeld F.Influence of slagchemistry on the hydration of alkali-activated blast-furnace slag–Part II: effect of Al2O3.Cem Concr Res2012;42:74–83.[36]Bernal SA,San Nicolas R,Myers RJ,Mejía de Gutiérrez R,Puertas F,vanDeventer JSJ,et al.MgO content of slag controls phase evolution and structuralTable7Summary results of EDS analyses for geopolymer waste form sample GEO120B(atomic%).Elements Spectrum1Spectrum2Al16.14 5.57Ca0.278.04Fe0.760.52K 1.34 1.19Mg0.72 1.37Na0.997.20O57.5850.50Si22.2025.62Total100.00100.00Table8TCLP leaching test results for heavy metals,hazardous elements and rhenium.Sample ID Concentration in TCLP leachate(mg/L)aCd Cr Pb Ag As Ba ReGEO80A<0.030.170.84<0.07<0.20 2.200.56GEO100A<0.030.180.70<0.07<0.20 1.400.46GEO120A0.030.11 1.00<0.07<0.20 1.500.51GEO80B<0.030.160.67<0.07<0.20 1.750.50GEO100B<0.030.170.54<0.07<0.20 2.160.81GEO120B<0.030.140.77<0.07<0.20 1.240.67EPA limit b 1.00 5.00 5.00 5.00 5.00100N/Aa Note:concentration below detection limit is presented as<0.XX,where0.XX isthe detection limit value.b N/A:not available.H.Xu et al./Fuel133(2014)332–340339。

Electrical and mechanical properties of aluminosilicate inorganic polymer composites with carbon nanotubesKenneth J.D.MacKenzie ÆMatthew J.BoltonReceived:2December 2008/Accepted:27February 2009/Published online:25March 2009ÓSpringer Science+Business Media,LLC 2009Abstract The DC electrical conductance of potassium aluminosilicate inorganic polymers (geopolymers)con-taining up to 6wt%single-wall carbon nanotubes has been determined as a function of temperature up to 340°C.After removal of the processing water during the first heating cycle,the conductance in subsequent heating cycles increases as a function of carbon nanotube content and temperature from 9.75910-4to 1.87910-3S m -1in the composites containing 0and 0.2wt%carbon nanotubes,respectively,at 290°C.By comparison,the electrical conductance of potassium inorganic polymer composites containing graphite was generally lower.The conductance activation energies of the carbon nanotube and graphite composites were similar,and decreased from about 55to 5kJ mole -1with increasing carbon content.The tensile strengths of carbon nanotube and graphite-containing potassium geopolymer composites,determined by the Brazil method on 10–12replicates,were about 2MPa,and showed little change with increasing carbon nanotube content up to 0.3wt%.By contrast,the tensile strengths of an analogous set of sodium composites were up to four times greater,possibly reflecting the necessity for less processing water in the synthesis of the sodium samples.IntroductionAluminosilicate inorganic polymers,also called geopoly-mers,were first described by Davidovits [1]as beingformed under highly alkaline conditions from a solid alu-minosilicate (typically thermally dehydroxylated kaolinitic clay)and an alkali silicate solution.The product,which hardens at ambient temperatures,is amorphous to X-rays and contains a random tetrahedral network of silicon and aluminium atoms,with charge neutrality being achieved by the presence of the alkali cations [2].These products rap-idly attain strength and are heat-resistant,making them potential substitutes for Portland cement-based building materials and for fireproof panels in buildings and vehicles.For these structural applications,additional strength can be imparted by the use of fibre reinforcement,employing a variety of fibres including carbon,graphite,basalt,ara-mide,or glass [1,3].Aluminosilicate inorganic polymers would be expected to display both thermal and electrical properties typical of more conventional aluminosilicate ceramics,but few detailed studies have been reported of the electrical prop-erties of these materials apart from an observation [4]that the electrical resistivity of several sodium aluminosilicate geopolymers ranges from 105to 1012X cm and depends on the moisture content of the material;samples pre-heated at 300°C and left in the air were observed gradually to pick up surface moisture in a 90%RH atmosphere,with a concomitant decrease in their electrical resistivity from 1012to about 1010X cm.over a period of 230min [4].Carbon nanotubes are known to possess interesting electrical properties,showing a wide spectrum of both metallic and non-metallic properties depending on their diameter and the helicity of their carbon atoms [5].Typical resistivities of individual carbon nanotubes fall in the range 10-4–10-6X cm,but show abrupt jumps as the tempera-ture is varied [5].The electrical behaviour of single-wall carbon nanotubes (SWCNTs)differs from that of multiwall nanotubes,the former showing a metallic–non metallicK.J.D.MacKenzie (&)ÁM.J.BoltonMacDiarmid Institute for Advanced Materials andNanotechnology,School of Chemical and Physical Sciences,Victoria University of Wellington,P.O.Box 600,Wellington,New Zealande-mail:kenneth.mackenzie@ J Mater Sci (2009)44:2851–2857DOI 10.1007/s10853-009-3377-ztransition at280K and the temperature dependence of the latter along the tube axis similar to a graphene sheet[6]. Multi-wall nanotubes prepared by spark plasma sintering (SPS)show anisotropic electrical conductance at high temperatures[7],and the electrical behaviour of thinfilms of nanotubes above room temperature has been explained in terms of randomly disordered nanotube networks[8]. The effect of electron-beam irradiation on the DC electrical conductivity of single-wall and multi-wall carbon nano-tubes has also been reported[9].In view of these interesting electrical properties,a number of studies have been reported of the electrical properties of composites containing carbon nanotubes. These include nanocomposites with polyester[10]and polythiophene conducting polymer[11].The electrical properties have also been reported of composites of carbon nanotubes with inorganic systems including titanium nitride[12],silica[13]and stabilized zirconia[14].In addition to their electrical properties,carbon nano-tubes combine high stiffness with resilience and the ability to buckle and collapse reversibly[15],and both single-wall and multi-wall carbon nanotubes are reported to show tensile strengths of50–60GPa and Young’s moduli of about1TPa[16].The addition of carbon nanotubes to inorganic polymer systems may therefore bestow both interesting and useful electrical and mechanical properties on the resulting composite.The incorporation of0.5–1.0wt%of carbon nanotubes into Portland cement pastes has been reported[17]to result in slight increases in strength(8.7–13.1%increase in com-pressive strength and 1.8–2.1%increase inflexural strength).The incorporation of SWCNTs into nanocrys-talline alumina by SPS at1,150°C is reported to result in a nearly three-fold increase in the fracture toughness of the composite[18].Despite these promising results in other inorganic sys-tems,the electrical and mechanical properties of aluminosilicate inorganic polymers containing carbon nanotubes have not been reported.The aim of the present study was therefore to investigate the effect of incorpo-rating up to6wt%SWCNTs on the electrical and mechanical properties of aluminosilicate inorganic poly-mers.Since the sample sizes were limited by the amount of SWCNTs available,the tensile strengths were determined by the Brazil method,in which small cylindrical samples are broken across their diameter,and the carbon content of these samples was limited to0.3wt%.The DC electrical conductivities of similar-sized samples were determined as a function of temperature up to340°C.For comparison,a series of composites containing graphite was also investi-gated,and the effect on the mechanical strength of changing the alkali metal from potassium to sodium was studied.ExperimentalThe potassium inorganic polymer matrix was synthesized from New Zealand halloysite clay(Imerys Premium Grade)dehydroxylated at600°C for12h,mixed with a solution of potassium silicate(Ineos Silicas,UK,Type66), reagent-grade potassium hydroxide and water in propor-tions giving a composition with the following molar ratios: SiO2:Al2O3=3.16,H2O:K2O=16.2,K2O:SiO2=0.34. For the purpose of the strength tests,a corresponding set of sodium-based composites was prepared using O-type sodium silicate solution(Fernz Chemical Co.,NZ,SiO2: Na2O=3.2,40.0wt%solids)and reagent-grade NaOH (Scharlau,Australia)in proportions giving the following composition:SiO2:Al2O3=3.18,H2O:Na2O=11.1, Na2O:SiO2=0.29.The uncured mixtures were blended with0.2–6wt%SWCNTs(approximately90%single-walled,kindly supplied by Sigmar Roth,Max Planck Institut,Stuttgart).The limited availability of these high-quality SWCNTs restricted the upper limit of their addition to6wt%in the samples for electrical measurements,and to0.3%in the samples for Brazil tensile strength testing, for which10–12replicate samples were used to provide acceptable statistics.The samples were cast into15mm diameter circular plastic moulds,vibrated to remove entrapped air bubbles,wrapped in plasticfilm,hardened overnight in an oven at60°C then unwrapped and dried at 60°C.The samples for strength measurements were7-mm thick but the conductivity measurements were made on 3-mm thick samples.For comparison,an analogous series of samples containing0.2–6wt%graphite(BDH reagent grade)was prepared for testing.Samples of good homo-geneity were obtained by thoroughly blending the dry components(clay and carbon)before adding the silicate solution and water and all the composites cured and hardened to form mechanically stable pellets.Samples of the resulting products were powdered and examined by XRD(Philips PW1700computer-controlled goniometer with Co K a radiation and a graphite mono-chromator)and solid-state27Al and29Si MAS NMR (Varian Unity500spectrometer at afield of11.7T using 4mm and5mm Doty MAS probes spun at10–12kHz for 27Al and5–6kHz for29Si under the following conditions:27Al:spectrometer frequency130.224MHz with a1l s pulse and a1s delay,the spectra referenced to Al(H2O)63?.29Si:spectrometer frequency99.296MHz with a6l s pulse and a60s delay,the spectra referenced to TMS.Scanning electron microscopy was carried out on Au-coated samples using a JEOL JSM-6500F microscope operated at15.0kV.Elemental analysis was carried out using an EX23000BU energy dispersive X-ray analyzer.The flat faces of the pellets on which the electrical measurements were made were smoothed with 1,000grit silicon carbide paper and coated with platinum paint (Gwent Electronic Materials Ltd.,UK)to give good con-tact with the platinum electrodes of the measurement cell,which was enclosed in an infrared furnace (Delta Model 9023).The DC conductivity measurements were made using a Keithley Model 230programmable voltage source and a Keithley Model 485picoammeter.The furnace was heated at a linear heating rate of 2°C min -1to a maximum temperature of 340°C,determined by thermal analysis experiments in air (TA Instruments TGA/DSC Model Q600),which indicated the onset of thermal breakdown of the SWCNTs in the composites was about 400°C (by contrast,the graphite-containing composites were ther-mally stable to [1,000°C).The conductance results reported here were made during a second heating cycle,an initial heating cycle of the as-synthesized samples to 340°C having been made to eliminate the effect of the absorbed moisture and hydration water.The tensile strength measurements were made by breaking the pellets across their diameter using an Instron 25tonne TTKM universal testing machine at a crosshead speed of 1mm/min.Ten to twelve replicates of each sample were tested and their tensile strengths were calcu-lated according to the equation [19]:r ¼2P =p Dt ðÞð1Þwhere P is the breaking load,t and D the thickness and diameter of the pellet,respectively,measured using digital vernier calipers.Results and discussionFigure 1shows typical XRD traces and 29Si NMR and 27Al spectra of the SWCNT and graphite-containing geopoly-mers.All samples show the characteristic X-ray amorphous XRD trace (Fig.1a)expected for a well-cured geopolymer[2],with small sharp peaks corresponding to the SiO 2polymorphs quartz (PDF file no.33-1161)and cristobalite (PDF file no.11-695),both present as impurities in the clay starting material.The strong,superimposed sharp graphite reflection (PDF file no.12-212)seen in the graphite-con-taining composites has its major reflection coincident with the major quartz reflection (Fig.1a).The 29Si NMR spectra of the K-geopolymer composites (Fig.1b)show single broad resonances at about -87to -88ppm,in the chemical shift range of metakaolin-based geopolymers [2],with similar spectra being recorded for the corresponding Na-geopolymer composites (not shown here).The 27Al NMR spectra of all the geopolymer composites (Fig.1c)indicate Al in solely tetrahedral coordination as expected,with only slight traces of octahedral Al at about 2ppm.SEM micro-graphs (Fig.2a)show a homogeneous distribution of carbon nanotubes twisting randomly throughout the sam-ples.SEM micrographs of the samples containing graphite (Fig.2b)show irregularly shaped carbon grains in a range of sizes up to 800l m.The homogeneity of carbon distri-bution in both the SWCNT and graphite-containing samples was confirmed by elemental mapping of carbon.The indi-vidual SWCNTs are difficult to image,but a few associated multi-wall nanotubes can be seen to be distributed throughout the nanotube-containing composites (Fig.2c).Electric conductance measurementsAs expected,the initial electrical conductance of all the as-synthesized samples increases sharply with temperature up to about 40°C (Fig.3),thereafter dropping rapidly as the hydration water is lost from the sample.The depletion of the mobile charge-carrying hydrous species is complete at about 80°C,whereupon other charge-carrying mecha-nisms become significant,especially in the samples containing carbon (Fig.3a).Since the primary object of this study was to determine the effect of the carbon allo-tropes on the conductance,the effect of water on the low-temperature conductance behaviour was eliminated duringG+QCQC-87.8-87.30 -50 -100 -150 -200100 50 0 -50(c)(b)(a)58.659.21.910 30 50 70O 2θCo K α29Si shift w.r.t TMS27Al shift w.r.t Al(H 2O)63+Fig.1XRD,29Si and 27Al solid-state NMR characteristics of potassium geopolymer composites containingSWCNTs (lower )and graphite (upper ).Key to the XRD peaks:C cristobalite (PDF no.11-695),Q quartz (PDF no.33-1161),G graphite (PDF no.12-212)the first heating cycle up to the maximum measurement temperature (340°C)and making the measurements during a second heating cycle.The conductivities on a logarithmic scale of the resulting thermally pre-treated potassium inorganic polymer samples containing carbon nanotubes are shown in Fig.4,with the corresponding plots for graphite-containing composites shown in Fig.5.The conductivities of all samples (apart from that containing 0.2%graphite)are higher than the carbon-free control sample,and that in general the con-ductivities increase as expected with increasing carbon content,except for the samples containing higher concen-trations of SWCNTs,of which the 0.6%and 1.5%SWCNT samples cross over at about 275°C,and the trend in the 3%and 6%SWCNT samples is reversed over the whole tem-perature range (Fig.4).The conductivities of the samples containing SWCNTs are generally greater than those con-taining the same content of graphite;at 290°C,the conductivities of samples containing 0.2wt%carbon are 1.87910-3S m -1for SWCNTs and 7.81910-5S m -1for graphite.At this temperature,the conductivity of the control sample without carbon is 9.75910-4S m -1.The conductivity behaviour of the sample containing SWCNTs is as would be expected for a material composed of conducting a conducting phase in a relativelyless-Fig.2Scanning electron micrographs of potassium geopolymer composites containing:a SWCNTs,b graphite,c close-up of a multiwall CNT associated with the SWCNTs in micrograph aTemperature (oC)0501001502002503003500.0030.0020.0010.0010.002Conductivity (S.m -1)C o n d u c t i v i t y (S .m -1)ABFig.3DC conductivity of as-synthesized potassium geopolymers as a function of temperature during the first heating cycle.a Geopolymer composite containing SWCNTs and b carbon-free control sampleconducting matrix (the inorganic polymer).The tempera-ture dependence of the conduction processes in the two phases may be different,particularly if one of the com-ponents is behaving as a metallic conductor and the other is a semi-conductor,but at a given temperature an increase in the proportion of the more conducting component will result in an overall increase in conductivity with increasing contact between the conducting grains.This leads to the interesting question whether these results reflect aniso-tropic conduction behaviour in the carbon component.As noted above,the conductivity of SWCNTs is anisotropic,and ranges from 106to 108S m -1[5],but graphite parti-cles are also reported to exhibit anisotropy [20,21],the conductance in the plane of their hexagonal layers (3.79102S m -1)being much greater than perpendicular to this plane (1.7910-1S m -1).The degree of anisot-ropy is reported to vary with the degree of perfection andtwinning of the graphite crystals,the c -axis conductivity being more variable than that of the a -axis [21].The conductance of the present composites containing graphite might be expected to reflect the behaviour of graphite perpendicular to the hexagonal layers due to a degree of preferred orientation during sample preparation,whereas the anisotropy in the conductance of SWCNTs may be offset by their more random orientation in the composites.This could explain the generally higher conductivity of the SWCNT-containing composites,although the relative conductance of these materials could be complicated by the possible presence of other factors with different tempera-ture dependences.An example of one possible compli-cating factor in the graphite composites is the intercalation of alkali metal compounds into the graphite under the highly alkaline synthesis conditions [22].The occurrence of this reaction to even a very limited extent would produce a significant increase in the conductivity of the graphite-containing samples,since the reported room temperature conductivities of these intercalation compounds are 1.389107S m -1and 2.69107S m -1in the a and c directions,respectively [22].An example of a factor that may affect the conductance of the SWCNT-composites is the ability of the nanotube components to take up water into their inner space,leading to an increase in their elec-trical conductivity [23].Although the present experimental data provide no evidence for the operation of these mechanisms,they illustrate the difficulty of deriving pre-cise conduction mechanisms in these systems.The activation energies for conductance in the various samples are shown in Fig.6as a function of carbon con-tent.Although the points corresponding to nanotubes and graphite cross over at various carbon contents,both groups100300Temperature (oC)-4-8-12l n (c o n d u c t i v i t y )200Fig.4DC conductivity (on a logarithmic scale)as a function of temperature for the second heating cycle of potassium geopolymer composites with varying SWCNT contents100300Temperature (oC)-4-8-12l n (c o n d u c t i v i t y )200Fig.5DC conductivity (on a logarithmic scale)as a function of temperature for the second heating cycle of potassium geopolymer composites with varying graphite contentsCarbon content (wt%)60402000.20.6 1.5 3.0 6.012.0graphitenanotubesConduction activation energies for potassium geopolymer composites with SWCNTs and graphite as a function of carbonof samples follow the expected general trend for the acti-vation energy to decrease with increasing carbon content,reflecting the difference in the temperature dependence of the conduction mechanism in the more highly conducting species and that of the aluminosilicate matrix.Tensile strength measurementsFigure 7shows the tensile strengths,derived from Brazil test measurements on a minimum of 12replicates,as a function of carbon content,for both SWCNT and graphite-containing samples.Results for both K-and Na-geopoly-mer composites are shown.The considerably higher strengths of the Na-geopolymer series are probably due to the need for less water in the processing of these samples.In addition,the water demand in the synthesis step of both the SWCNT and graphite composites increases with increasing carbon content,especially in the case of the SWCNTs,which are approx-imately 16times less dense than the graphite.This militated against the use of a standardized water content,and necessitated the addition of a minimum amount of additional water to make the raw mixtures workable and secure a homogeneous distribution of the carbon through the samples.Although the presence of this additional processing water had no effect on the electrical measure-ments,which were made on pre-heated samples,it is expected to influence the strength measurements.Figure 7shows that for the K-geopolymer series,the tensile strength is not significantly improved by presence of either SWCNTs or graphite up to 0.3wt%carbon addition.The Na-geopolymer series shows more variation,with additions of up to 0.25wt%SWCNTs imparting greater strength than graphite.These disappointing results may be related to the amount of added carbon,which was limited by the availability of the SWCNTs;any additional strength that may be gained by increasing the content of addedcarbon may,however,be limited by its acting as a filler or diluent,or by its introduction of voids or imperfections from which cracks could form or propagate.The small size of the present samples,dictated by the quantity of SWCNTs available,made it necessary to measure tensile strengths rather than compressive strengths more frequently quoted.However,the following linear relationship between the tensile strength r t and the com-pressive strength r c can be derived from data for conventional porcelain ceramics [24]:r t ¼0:091r c À4:4:ð2ÞThis relationship,derived for a material consisting of a glassy matrix in which crystalline phases are embedded,may also approximate to the present geopolymer compos-ites,suggesting that their compressive strengths could be approximately 11times larger than their tensile strengths.On this basis,the tensile strengths of the present compos-ites containing SWCNTs would approximate to compres-sive strengths of 22and 88MPa for the potassium-and sodium-nanotube composites,respectively.Thus,the compressive strength values for the Na-series are very good,but the relatively poorer results for the K-series may be due to the effect of the additional processing water,as discussed above.ConclusionsComposites of potassium aluminosilicate inorganic poly-mers (geopolymers)with up to 6wt%SWCNTs have been synthesized and their DC electrical conductance measured as a function of temperature to below the decomposition temperature of the nanotubes (340°C),with the following results.1.During the initial heating,the conductance increases,then decreases rapidly due to the depletion of water.2.During subsequent heating cycles,the conductivities of the SWCNT-containing samples are all greater than the control sample without nanotubes,and generally increase with increasing nanotube content.By com-parison,the electrical conductivities of potassium composites containing the same amounts of graphite were generally lower that those of the SWCNT-containing samples.3.The conduction activation energies are similar for both the nanotube and graphite-containing potassium geo-polymer samples,and decrease with increasing carbon content.4.The tensile strengths of potassium samples containing up to 0.3wt%nanotubes are not significantly different from samples without carbon (2MPa)and slightly less than samples containing the same content of graphite.86420.20.25Carbon content (wt%)T e n s i l e s t r e n g t h (M P a )K-geopolymersNa-geopolymersnanotubesgraphitegraphite nanotubes0.3Fig.7Tensile strengths of potassium geopolymer composites with SWCNTs and graphite (lower )and the corresponding sodium geopolymer composites (upper )as a function of carbon contentBy contrast,a series of sodium-geopolymers contain-ing SWCNTs have much higher tensile strengths (8MPa at0.25wt%carbon content),possibly reflect-ing the lower water content needed in the synthesis of these samples.On the basis of known strength relationships for other ceramic materials,these tensile strengths would approximate to compressive strengths of22and88MPa for the potassium-and sodium-nanotube composites,respectively. Acknowledgements We are indebted to Thomas Borrmann and Sigmar Roth for kindly supplying the high-quality SWCNTs,to David Flynn for assistance with the electron microscopy,to Ross Fletcher for assistance with the strength measurements and to Jeremie Barrel for advice on the electrical measurements.This work was supported byfinancial assistance from the MacDiarmid Institute for Advanced Materials and Nanotechnology.References1.Davidovits J(1991)J Therm Anal37:16332.Barbosa VFF,MacKenzie KJD,Thaumaturgo C(2000)Int JInorg Mater2:3093.Porte A,Jazet M(2008)Fr.Patent02904677/Fr-A14.Davidovits J(2008)Institut Ge´opolyme`re,St.Quentin,France5.Ebbesen TW,Lezec HJ,Hiura H,Bennett JW,Ghaemi HF,ThioT(1996)Nature382:546.Sun Y,Miyasato T,Kirimoto K,Kusunoki M(2005)Appl PhysLett86:2231087.Quin C,Shi X,Bai SQ,Chen LD,Wang LJ(2006)Mater Sci EngA420:2088.Astorga HR,Mendoza D(2005)Opt Mater27:12289.Gupta S,Patel RJ,Smith N,Giedd RE,Hui D(2007)Diam RelatMater16:23610.Simsek Y,Ozyuzer L,Tugrul Seyhan A,Tanoglu M,Schulte K(2007)J Mater Sci42:9689.doi:10.1007/s10853-007-1943-9 11.Eren San S,Yerli Y,Okutan M,Yilmaz F,Gunaydin O,Hames Y(2007)Mater Sci Eng B138:28412.Jiang L,Gao L(2006)J Am Ceram Soc89:15613.Guo S,Sivakumar R,Kitazawa H,Kagawa Y(2007)J Am CeramSoc90:166714.Shi S-L,Liang J(2006)J Am Ceram Soc89:353315.Zhao Q,Buongiorno M,Bernholc J(2002)Phys Rev B65:14410516.Wei C,Cho K,Srivastava D(2003)Phys Rev B67:11540717.Nochaiya T,Tolkidtikul P,Singjai P,Chaipanich A(2008)AdvMater Res55–57:54918.Zhan G-D,Kuntz JD,Wan J,Mukherjee AK(2003)Nature Mater2:3819.Kerber MK,Wereszczak AA,Jenkins MG(1998)Fracturestrength.Marcel Dekker,NY,p14720.Primak W,Fuchs LH(1956)Phys Rev103:54121.Primak W(1956)Phys Rev103:54422.He´rold C,He´rold A,Lagrange P(2004)Solid State Sci6:12523.Maniwa Y,Matsuda K,Kyakuno H,Ogasawara S,Hibi T,Kadowaki H,Suzuki S,Achiba Y,Kataura H(2007)Nature Mater6:13524.Karpilovskii LP,Letskaya NV(1978)Steklo Keram9:29。