HW5 Urban Transportation Planning
- 格式:docx
- 大小:776.00 KB
- 文档页数:26

城市规划urban planning定义:研究城市的未来发展、城市的合理布局和管理各项资源、安排城市各项工程建设的综合部署。
在中国,城市规划通常包括总体规划和详细规划两个阶段。
城市规划城市规划是一门自古就有的学问,每个民族都有其独特的知识组成。
城市规划(Urban Planning)研究城市的未来发展、城市的合理布局和综合安排城市各项工程建设的综合部署,是一定时期内城市发展的蓝图,是城市管理的重要组成部分,是城市建设和管理的依据,也是城市规划、城市建设、城市运行三个阶段管理的龙头。
概念1、国际苏联(《城市规划原理》):在社会主义条件下的城市规划就是社会主义国民经济计划工作与分布生产力工作的继续和进一步具体化。
日本(强调技术性):城市规划是城市空间布局、建设城市的技术手段,旨在合理地、有效地创造出良好的生活与活动环境。
英国《不列颠百科全书》:城市规划与改建的目的,不仅仅在于安排好城市形体——城市中的建筑、街道、公园、公用事业及其它的各种要求,而且更重要的在于实现社会与经济目标。
美国(国家资源委员会):城市规划是一门科学、一种艺术、一种政策活动,它设计并指导空间的和谐发展,以满足社会和经济的需要。
2、国内城市规划是为了实现一定时期内城市的经济和社会发展目标,确定城市性质、规模和发展方向,合理利用城市土地,协调城市空间布局和各项建设所作的综合部署和具体安排。
城市规划是建设城市和管理城市的基本依据,在确保城市空间资源的有效配置和土地合理利用的前提和基础,是实现城市经济和社会发展目标的重要手段之一。
城市规划建设主要包含两方面的含义,即城市规划和城市建设。
所谓城市规划是指根据城市的地理环境,人文条件,经济发展状况等客观条件制定适宜城市整体发展的计划,从而协调城市各方面发展,并进一步对城市的空间布局、土地利用、基础设施建设等进行综合部署和统筹安排的一项具有战略性和综合性工作。
所谓城市建设是指政府主体根据规划的内容,有计划地实现能源、交通、通讯、信息网络、园林绿化以及环境保护等基础设施建设,是将城市规划的相关部署切实实现的过程,一个成功的城市建设要求在建设的过程中实现人工与自然完善结合,追求科学与美感的有机统一,实现经济效益、社会效益、环境效益的共赢。


修改稿美国交通规划体制中的大都市区规划组织*程楠1,2、荣朝和1、盛来芳1(1北京交通大学经济管理学院2 清华大学交通研究所,北京,100028)摘要:本文介绍了上世纪60年代以来出现的美国大都市区规划组织(MPO),分析了该组织的形成背景、发展历程、机构职能、作用及局限性。
MPO是美国城市化、运输化进程与原有州、郡县及市镇行政体制产生矛盾,因而在行政组织上进行必要调整的反映,也是美国社会自治制度与交通规划所需要的综合性、合作性与连续性原则得到结合的体现。
关键词:美国,大都市区,交通规划,规划体制,MPO一、大都市区规划组织出现的背景美国的政府结构分为联邦(federal)、州(state)和地方(local)三级,其中地方政府由各州自主设立,一般包括郡县(county)及其以下的市(city)和乡镇(town)政府。
美国目前共有50个州、3044个郡县、18517个市和16991个镇,市镇构成了美国的基层政府。
绝大多数美国的市并不大,早期设市时只是比乡镇的城市化程度高一些。
美国各州原来普遍设立郡县,然而随着工业化和城市化的持续发展,原有的郡县体制逐渐无法适应,于是有的州便将一些郡县撤销,还有的州将郡县与城市合并,并成立了若干地域面积大一些的大城市政府,例如最典型的纽约市就是包括5个区(各自相当于原来郡的范围),陆地面积789平方公里的大型市。
但绝大多数美国的市仍只是后来由于城市化形成的各都市区内的组成部分,而且往往只是很小的组成部分。
也就是说,美国在初期建立的地方行政体制更多是为适应当时农业社会形态的需要,由此逐渐出现了不适应。
进入20世纪以后美国的城市化过程加快,人口集中、地域连片、经济比重畸高的大都会已成为趋势,都市特别是大都市覆盖的地域迅速冲破了地方性市镇、郡县甚至州的行政边界。
例如,纽约大都市区到上世纪60年代已包括纽约市域范围的5个区、周边纽约州的其他5个郡、新泽西州的9个郡和康涅狄格州的6个城市化地区(该州未设郡县),总面积17405平方公里(目前都市区总人口约1900万,比纽约本市人口多出约1100万);波士顿大都市区的范围包括了马萨诸塞州东部的101个市镇,总面积11684.7平方公里(波士顿市本身的面积只有232.1平方公里);西雅图大都市区是由华盛顿州的四个郡及其管辖内的82个市镇组成;而首都华盛顿的大都市区则涵盖了华盛顿特区及其周边马里兰和佛吉尼亚两州的6个郡。

Effective Transit Route and Stop Planning with TBESTEffective Transit Route and Stop Planningwith TBESTTerry Bills, EsriRodney Bunner, ServiceEdge SolutionsSmart Cities ChallengeRequires Solving our Transportation and Mobility IssuesKey Public Transport Challenges:•How to Think Differently / How to Design More Effective Service in Response to Rapidly Changing Mobility •New Data Sources•Better Coordination Across Modes•Better Design of Our Cities: Breaking Down the Silos •SustainabilityKey Public Transport Challenges:How to Provide Optimal Service at the Most Efficient Cost High Levels of Customer Service (On-Time Performance, Meeting Customer Needs)Maximizing Ridership, Accessibility, EquityAll with the Lowest Passenger SubsidyTBEST FOR TRANSIT PLANNINGTerry Bills, Esri Global Transportation Industry ManagerRodney Bunner, Manager, ServiceEdge SolutionsTBEST DEVELOPMENT TEAM Public SponsorshipResearch-based MethodologiesSoftware Development, Implementation andTechnical SupportINTRODUCTIONWhat is TBEST?Software tool providing transit data analytics and insights to support Transit Service Planning and Strategic Transportation Planning initiativesWhat are the core TBEST features?§Transit Demand Estimation§Market Analysis§Transit Operational Analysis§Equity Analysis§Accessibility Analysis§Jurisdictional AnalysisWho Maintains TBEST?§FDOT manages TBEST development and provides TBEST data products for all Florida agencies §Agencies outside of Florida are welcome to utilize TBEST§Software download on the TBEST website ()WHY TBEST?Transit Planning Software GapOperationsTrapeze Others…Short andmid-termTBESTLong RangeCUBESTOPSOthers…Data Integration –national, regional and local data Agency Policies –embed local policies and operating conditions Transit Focus -address transit-specific planning issues Scenario Planning -quickly build transit service alternatives Efficiency -consistent, streamlined and repeatable analysis workflows Communication –dashboards, maps, tables, charts -> decision-makers Cost Effective -free software; documentation and training videos provided; internal agency toolset TBEST –SOFTWARE OBJECTIVES 1234567TBEST TRANSIT PLANNING SUPPORT§Transit Development Plans §Route Optimization Studies §Operational Analysis (COA’s) §Regional Modeling§BRT Modeling §Title VI Triennial Reports §Title VI Disparate Analysis §Grant Applications§Corridor AnalysisTBEST FRAMEWORK TECHNOLOGY§Standalone desktop software with embedded ESRI technology §Requires ArcGIS to be locally installed (Basic license-level)§Compatible with ArcGIS versions 10.2 to 10.6.1 (not 10.6)§Microsoft SQL Server LocalDB(installed with TBEST)§Microsoft Visual Studio Express (optional model scripting)Technology FoundationGTFS NETWORK INTEGRATIONNetworkGTFS Network Import Tool§Import GTFS routes and service into TBESTscenarios§Input GTFS data can be for base year service orproposed service§Select representative Weekday, Saturday andSunday service days§With minimal review, the GTFS network isready for TBEST modeling and analysis§Add APC stop-level ridership data for TBESTapplication (stop_ridership.txt)TBEST TRANSIT NETWORK EDITORNetworkConstruct Alternative Service Networks§Service organized by Route§Add/Edit/Remove Routes, Patterns, Segmentsand Stops§Trip Editor to modify Vehicle Trips and TravelTimes§Assign Stop Amenities, Special Generators,Transfer Stations§Intuitive, ArcGIS-based map editorcomponents§Configurable Base Map (AGOL & MXD)§Export TBEST network to GTFS, shapefiles,KMZ, FGDBScenario -MPO GrowthProjectionsTBEST Base Socio-Economic Data DemographicCensus 2010 and ACS 5-YearParcel Land Use (optional)Trip generation by land use typeSocio-EconomicEmploymentLEHD, Zonal or Address-Based NATIONAL, REGIONAL, LOCAL AND COMMERCIALSocio-Economic TBEST PARCEL EDITORCreate Parcel Scenarios§Edit parcels (add, move, delete)§Edit land use distributions within adefined geography to reflect theplanned land use mix (TransitOriented Development)§Option to auto-generate parcelsbased on specified parcel countsand building area by land use typeTBEST RIDERSHIP ESTIMATIONEstimation ModelTBEST Stop-Level Ridership EstimationModel responds to:§service-level adjustments§route re-structuring§fare changes§transfers§walk markets§destination markets§BRT Characteristic ScoringModel Validation ToolsTBEST creates adjustment factors to apply toscenario alternativesTBEST SERVICE AND PERFORMANCEPerformanceCompare Base Conditions withScenario Alternatives:§Route and System Comparison§Direct and Transfer Boardings§Boardings per Service Mile, Hour,Trip§Service Levels§Route Cost§Fleet EstimatesTBEST MARKET ANALYSISMarkets Walk Market§Define: Stops + Segments + Patterns + Routes +User Geography§Summarize socio-economic market distributions§Land Use trip potential per parcel (ITE TripGeneration)§Compare across scenarios and with service areatotals (x% of service area population within ½mile of park-n-ride stops)Markets TBEST MARKET ANALYSISNetwork Accessible Markets§Define Networking Parameters§Define Accessibility to/from:§Single Stop§Multiple Stops§Corridor, Activity Center, CBD, orany input geography§Summarize Accessible Markets viaTransit Travel Time + Walk Time +Number of TransfersWorkflow Support Tools Folder§Wizard-driven tools to streamlinecommon agency tasks§Input scenario networks and taskspecific parameters§User can run multiple analysis withvaried networks/parameters and storeas result sets§Compare results TBEST WORKFLOW SUPPORT TOOLSTBEST Explorer –Workflow Support ToolsTBEST OPERATIONAL ANALYSISPerformance COA AnalysisDensity Service and Performance§Route Performance by Socio-Economic Density (High,Medium and Low)§Groups Route Service by Density Areas§Multiple socio-economic density variables§Density by Jurisdiction (Municipalities, Flex Zones,Corridors, etc.)TBEST OPERATIONAL ANALYSISPerformance COA AnalysisJurisdictional Service and PerformanceSummarize transit service and performance by user-definedinput areas such as:§Rural vs. Non-Rural (5311)§Taxable Areas (Transit Funding Sources)§Municipalities§Corridors§Counties§Flex ZonesEquity TBEST EQUITY MEASURESTitle VI Analysis Workflow Support Tool§Intended for Triennial Reporting§Calculates System % Disadvantaged Populations (Minority,Low Income, LEP)§Route-level % Disadvantaged Populations§Calculates Minority and Low Income Routes§Minority and Low Income Revenue Miles and Stop Arrivals§Reports and Maps styled based on FTA Circular guidance§Comparison Reports to evaluate System, Route andJurisdictional differences between scenario alternativesEquity TITLE VI DISPARATE ANALYSISTitle VI Disparate Analysis WorkflowSupport Tool§Directly compares service changebetween two TBEST scenarios§Uses FTA 4/5ths rule or local Title VIpolicy§Evaluates disparate impacts of majorsystem service changes to minorityand low income populations using“People Trips”§Notifies that user of disparateimpactEquity TITLE VI DISPARATE ANALYSISRoute Comparison ReportTBEST ACCESSIBILITY MEASURESAccessibilitySystem Accessibility WorkflowSupport Tools§Total System Accessibility§To Transit (Walk Access)§Via Transit (Network Access)§Communicate Access to Jobs,People and Land Use…with asingle number§Comparative reporting betweenscenario accessibilitysummaries1EXAMPLE TBEST IMPLEMENTATIONMaintains an active, validated TBEST model for service and strategic planning Developed TBEST tools for meeting regulatory compliance by measuringadditional trips related to localized developmentDeveloped grant application for SunRail Feeder service using TBEST ridership estimationSupported recent TDP, COA and Route Optimization studiesLYNX FTA Title VI reporting policy includes TBEST as the methodology and output2345LYNX -OrlandoOTHER AGENCY TBEST APPLICATIONS *Most Florida AgenciesNashville WeGo UTA (Salt Lake) Foothill Transit RVTD (Medford, OR) GRTC (Richmond, VA) PART (NC)CET (Bend, OR)HRT (Hampton Roads, VA) Transfort(Ft. Collins) GTA (Greensboro)Long Beach Transit Many others…TBEST AGENCY IMPLEMENTATION STEPSInstallation -install TBEST on local, in-house machines Socio-Economic Configuration (outside of Florida)–utilize FDOT Guidance documents and templates to configure national, state, regional or local socio-economic dataValidation –develop base transit service and socio-economic conditions and validate TBEST ridership estimations with observed ridershipApplication -planners develop alternative scenarios, maps, charts, reports to support specific projects including TDP development, service plans, grant applications, etc.Sharing –TBEST data products are shared with other planners or the public via TBEST GIS data exports to ArcGIS or ArcGIS Online and/or GTFS exports. 12345TBEST RESOURCESTBEST Website ()q Software Download(/downloads/?dl_cat=13)q User Guide (/downloads/?dl_cat=10)q Video Tutorials(/video/TBESTTrainingVideos.htm)q SE Data Config Guidance and Templates(/downloads/?dl_cat=12)q Technical Assistance Contact InformationTBEST CONTACTSRodney Bunner, ServiceEdge SolutionsEmail: ***************************Phone: (727) 455-4059© 2017 Esri. All rights reserved.。

城市通勤出行链模式选择行为研究摘要:通勤出行是城市居民最基本和最重要的出行,对其进行研究是进行交通规划、设计与管理的一项不可缺少的基础工作,因此本文开展了基于2008年东莞城市居民出行调查数据和多项Logistic模型建立居民通勤出行链模式选择模型的研究工作。
本文中的通勤出行链模式选择模型将通勤出行链模式细分为五类(HWH、HWHWH、HWH+、HWHWH+、HW+WH),并考虑了出行方式对出行链模式的影响作用。
通过对模型结果的分析,总结了通勤出行链模式的显著影响因素以及通勤出行链模式选择中的特征。
研究内容对于建立基于活动的交通需求预测模型、制定交通管理政策具有重要借鉴作用。
关键词:通勤出行链出行链模式选择多项Logistic模型Abstract:Commuting trips are the basic and the most important trips in urban transport,and study on the Commuting trips is the basic work in the transportation planning,design and management.Therefore,this paper made study on the commuting trip chain pattern choice based on the household survey data and multi-logistic model.The commuting trip chain patterns are divided into five classes(HWH,HWHWH,HWH+,HWHWH+,HW+WH)and the influences of the mode choice are considered in the commuting trip chain pattern choice model.By analyzing the model results,this paper summarized the significant influencing factors and characteristics of the commuting tripchain pattern choice,which is of importance in the establishment of the activity-based travel demand forecast model and making traffic management policies.Key words:commuting trip chain;trip chain pattern choice;Multi-Logistic model目前,我国的城市化进程迅速加快,社会经济、科技、文化的发展日新月异,这些变化都深刻影响着城市形态的发展以及城市居民的交通出行,我国城市正面对着日趋复杂严峻的城市交通局面,尤其是工作日的通勤出行及其所带来的交通拥堵是城市管理与决策者们所面临的主要问题,这就需要以出行者的通勤出行行为研究为基础制定政策、管理好城市居民日常的交通出行、解决城市的交通拥堵问题。

urban planning在国外所指的范围Urban planning is a concept that refers to the design and organization of cities and towns. It encompasses the development of land use and infrastructure, including transportation systems, housing, and public spaces, to create sustainable and livable environments for residents. Urban planning also involves considering the social, economic, and environmental impact of development and implementing policies to address these issues.In many countries around the world, urban planning is a critical function of government at various levels, including local, regional, and national. The scope of urban planning varies from country to country, depending on factors such as population density, economic development, and cultural traditions. However, the overarching goal of urban planning is to create cities and towns that are functional, attractive, and inclusive for all residents.In some countries, such as the United States, urban planning is primarily the responsibility of local governments, with input from state and federal agencies. Local planning departments work with developers, community groups, and other stakeholders to create comprehensive plans for land use, zoning, and transportation. These plans are often guided byprinciples such as smart growth, and seek to balance the needs of different stakeholders, including residents, businesses, and environmental advocates.In other countries, such as China and India, urban planning is a more centralized function of the national government. These countries have faced rapid urbanization in recent decades, and have sought to manage this growth through large-scale infrastructure projects, such ashigh-speed rail lines and new cities. These efforts have been criticized for their top-down approach and lack of input from local residents, but they also reflect the enormous challenges of managing urbanization in densely populated countries.In Europe, urban planning is often more decentralized, with significant autonomy given to local governments. Many European cities have a long history of urban planning, dating back to the medieval period and the rise of city-states. These cities have evolved over time through a mix of public and private investment, with a focus on creating vibrant public spaces, efficient transportation networks, and mixed-use development. European cities are often known for their pedestrian-friendly streets, historic preservation, and strong social safety nets.In developing countries, urban planning faces unique challenges related to poverty, informal settlement, and rapid population growth. Many cities in Africa, Asia, and Latin America are struggling to provide basic services such as clean water, sanitation, and education to their residents. Informal settlements, or slums, are common in these cities, and are often located in areas prone to natural disasters, such as floods and landslides. Urban planners in these countries must balance the urgent need for basic infrastructure with long-term goals such as environmental sustainability and social equity.The concept of urban planning has evolved over time, reflecting changes in technology, culture, and governance. In the late 19th and early 20th centuries, urban planning was heavily influenced by the emergence of modern engineering and architecture, as well as social reform movements such as the Garden City and City Beautiful movements. These movements sought to create cities that were more efficient, healthy, and beautiful, by separating industrial and residential areas, creating parks and boulevards, and improving public health and sanitation.In the mid-20th century, urban planning was shaped by the rise of the automobile and the highway system. Many cities in the United States andEurope were redesigned to accommodate the car, with wide highways, parking lots, and suburban sprawl. This approach to planning led to a decline in public transportation, increased air and noise pollution, and the loss of historic neighborhoods and public spaces.In recent decades, urban planning has shifted towards more sustainable and inclusive models. Planners are increasingly focused on creating walkable, transit-oriented communities, promoting mixed-use development, and preserving historic buildings and cultural landscapes. They are also addressing issues such as climate change, social inequality, and public health through policies such as green infrastructure, affordable housing, and public transit.One of the key challenges facing urban planners today is the impact of globalization and technological innovation. Cities around the world are grappling with the effects of rapid economic change, such as the rise of the knowledge economy, the decline of traditional manufacturing, and the growth of the gig economy. These changes are reshaping the physical form of cities, as well as their social and cultural dynamics. Urban planners must respond to these changes by fostering innovation, encouraging entrepreneurship, and creating spaces that are flexible and adaptable.At the same time, urban planners are also contending with new forms of technology such as autonomous vehicles, drones, and smart sensors. These technologies have the potential to revolutionize urban transportation, public safety, and environmental monitoring. However, they also raise questions about privacy, equity, and governance. Urban planners must grapple with these issues in order to ensure that technology serves the public interest and enhances the quality of urban life.Overall, urban planning is a complex and dynamic field that encompasses a wide range of disciplines, from architecture and engineering to sociology and economics. It requires a deep understanding of history, culture, and the natural environment, as well as the ability to anticipate and respond to change. Urban planners play a critical role in shaping the future of cities and towns, and their work has far-reaching implications for public health, economic development, and social justice. As the world continues to urbanize, the importance of urban planning will only grow, making it an essential field for policymakers, professionals, and citizens alike.。
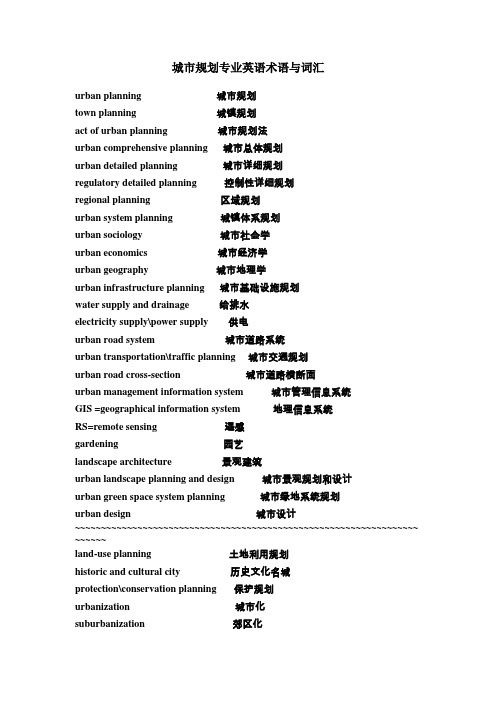
城市规划专业英语术语与词汇urban planning 城市规划town planning 城镇规划act of urban planning 城市规划法urban comprehensive planning 城市总体规划urban detailed planning 城市详细规划regulatory detailed planning 控制性详细规划regional planning 区域规划urban system planning 城镇体系规划urban sociology 城市社会学urban economics 城市经济学urban geography 城市地理学urban infrastructure planning 城市基础设施规划water supply and drainage 给排水electricity supply\power supply 供电urban road system 城市道路系统urban transportation\traffic planning 城市交通规划urban road cross-section 城市道路横断面urban management information system 城市管理信息系统GIS =geographical information system 地理信息系统RS=remote sensing 遥感gardening 园艺landscape architecture 景观建筑urban landscape planning and design 城市景观规划和设计urban green space system planning 城市绿地系统规划urban design 城市设计~~~~~~~~~~~~~~~~~~~~~~~~~~~~~~~~~~~~~~~~~~~~~~~~~~~~~~~~~~~~~~~~~~ ~~~~~~land-use planning 土地利用规划historic and cultural city 历史文化名城protection\conservation planning 保护规划urbanization 城市化suburbanization 郊区化public participation 公众参与sustainable development 可持续性发展over-all urban layout 城市整体布局pedestrian crossing 人行横道human scale 人类尺度street furniture 街道小品sculpture and fountain 雕塑和喷泉traffic and parking 交通与停车landscape node 景观节点-----------------------------------------------------------------------archaeological 考古学的habitat 住处aesthetics 美学geometrical 几何学的moat 护城河vehicles 车辆,交通工具mechanization 机械化merchant class 商人阶级urban element 城市要素plaza 广场avenue 林荫道---------------------------------------------- adaptable 适应性强的organism 有机体department stores 百货商店opera 歌剧(院)symphony 交响乐cathedral 教堂density 密度circulation 循环treatment measures 处理措施three dimensional form 三维condemn 谴责rural area 农村地区regional planning agencies 区域规划机构reference standard 参考标准water area 水域alteration 变更inhabitant\resident 居民motorway 高速公路abstract 摘要key words 关键词reference 参考资料----------------------------------------dimension 大小employment 就业recreation 消遣transportation 交通urban fringes 城市边缘sewage treatment plant 污水处理厂brain drain 人才流失drainage area 汇水面积traffic flow 交通流(量)traffic concentration\density 交通密度traffic control 交通管制traffic bottleneck 交通瓶颈地段traffic island 交通岛(转盘)traffic point city 交通枢纽城市urban redevelopment 旧城改造urban revitalization 城市复苏------------------------------------------urban fabric 城市结构(肌理)urban form 城市形态warehouse 仓库material processing center 原料加工中心religious building 宗教建筑correctional institution 教养院transportation interface 交通分界面CBD=central business district 中心商业区public agencies of parking 停车公共管理机构energy conservation 节能individual building 单体建筑mega-structures 大型建筑megalopolis 特大城市green space 绿地corporation 公司accessibility 可达性service radius 服务半径=------------------------------------------------urban landscape 城市景观topography 地形visual landscape 视觉景观visual environment 视觉环境visual landscape capacity 视觉景观容量tourist industry 旅游业service industry 服务业relief road 辅助道路rural population 乡村人口roofline 屋顶轮廓线-----------------------------------------------urban design 城市设计nature reserve 自然保护区civic enterprise 市政企业artery 动脉,干道,大道land developer 土地开发商broad thorough-fare 主干道---------------------------------------------------urban water supply system 城市给水系统storage reservoir 蓄水库distribution reservoir 配水库distribution pipes 配水管water distribution system 配水系统catchment area 汇水面积open channel 明渠sewerage system 污水系统separate system 分流制combined system 合流制rainfall 降水domestic waste 生活垃圾industrial sewage 工业污水stream flow 河流流量runoff 径流treatment plant 处理厂-------------------------------------------------- spatial structure 空间结构labor force 劳动力biosphere 生物圈biodiversity 生物多样性blueprint 蓝图monument 纪念物high-rise building 高层建筑物lawn 草地pavement 人行道sidewalk 人行道winding path 曲径---------------------------------------- metropolis 大都市construction work 基建工程slums 贫民区alleys 大街小巷gothic 哥特式renaissance 文艺复兴。


Educational Plan for Professional MasterDegree Programin Transportation Engineering Major(code: 085222 confer engineering master degree)I Educational Targetsa)Be equipped with strong engineering background; to grasp the basic research methods andskills; to have a certain capability to solve practical problems.b)To be proficient in a foreign language.c)To have practical, realistic, and scientific learning attitude and work style.d)To have capability to do the related work in the field.II Research Orientationsa)Road engineeringb)Traffic control theory and applicationc)Transportation planning theory and applicationd)Design, organization and monitoring of the regional transport systeme)Design and operation management of the public transport systemf)Transport economics and policiesIII Educational Mode and DurationThe number of school years for a master student to get degree is 2.Training method is totally off-job, combined by course study, specializ ed internship and thesis.IV Credit Requirement and AllocationA master student must take 32 credits of courses at least, including 18 credits of degree courses atV Curriculum and Credit AllocationVI Practice SegmentThe practice report is required, with the assessment advice signed by the person in charge of the appropriate practical aspects.After passing the examination by the faculty, you can obtain the corresponding credits.a) Engineering issues research: it is required to participate in a specific research project, the whole process of research and design, including the program development of the research and design, completion and project summary.It is required to submit the summary report of project research, design and calculation.The inspection advice signed by the person in charge of the project is required.You will get the 2 credits if you pass the inspection.b) Specialized courses practice (with report): an internship program is required to submit, and an internship summary report after the internship is required.An evaluation assignment signed by principal is required before the check and then you can get 4 credits.c) Professional internship (with report): aninternship in enterprises for more than 1month is required.A summary report (withenterprise’s stamp) is required before thecheck and then you can get 4 credits.VII Thesisa) Dissertation form: the content of thesis can be engineering design report, research report, special investigation etc.But the format should be consistent with the basic format of the institute dissertation.The thesis should have certain innovation and workload, reflecting the ability of the integrated use of theories, methods and techniques to solve engineering problems.Theoretical basis, advancement and utility are required also.b) Topic selection: The selection of the dissertation should fulfill linking theory with practice,on reflection of s tudents’ ability of applying the theory and knowledge to solve to the theoretical and practical issues of Traffic and Transportation Engineering.Students should complete thesis proposal with literature review and investigation, make a report to the relevant experts.Then students start thesis work formally after defense.c) Mid-term examination of the thesis is prior to the end of the third semester.Students are required to submit a mid-term examination report and their postgraduate tutors write evaluations of the completion of finished research work.d) Thesis defense: Students can defend thesis just after thesis reviews and tutor and school’s approval.VIII Awarding DegreeStudents who meeting the required credits, passing the dissertation defense and the validation of the Academic Degree Evaluation Committee will be awarded professional master degree in engineering field.。


未来城市发展规划与可持续交通系统设计1. 引言1.1 概述The development and planning of cities play a crucial role in shaping the future of our society. As urbanization continues to rise, it is essential to ensure that cities are designed in a sustainable manner to meet the needs of growing populations while minimizing their impact on the environment. One critical aspect of urban planning is the design of transportation systems, which have a significant influence on the livability and sustainability of cities.1.2 文章结构This article aims to explore the integration of future city development planning with sustainable transportation system design. The focus will be on understanding the current state of urban development, analyzing future trends, and emphasizing the importance of sustainable growth. Additionally, we will delve into the challenges faced by existing transportation systems and introduce concepts related to sustainable transportation. Moreover, we will discuss how intelligent transport systems can contribute to creating more efficient and eco-friendly cities.1.3 目的The purpose of this article is threefold:- To provide an overview and analysis of the current state of city development planning.- To examine future trends and their implications for urban growth.- To explore how integrating sustainable transportation systems into city development plans can contribute to a more environmentally friendly and livable future.By delving into these aspects, we aim to highlight the significance of proactive planning in addressing urbanization challenges while promoting sustainability in transport infrastructure design. This discussion will also shed light on relevant policy support required for such integration along with exploring potential social involvement strategies in achieving sustainable goals. Furthermore, we will address technological innovations and their potential impact on future urban developments.Through this comprehensive examination, we hope to convey a clear understanding of the crucial role that both city development planning and sustainable transportation system design play in building resilientand vibrant cities for generations to come.2. 城市发展规划:2.1 现状分析:在这一部分,我们将对当前城市发展的现状进行分析。


麻省理工学院 城市规划 交通工程 科研MIT Urban Transportation Planning Research 麻省理工学院(Massachusetts Institute of T echnology),创立于1861年,坐落于美国马萨诸塞州剑桥市(大波士顿地区),是世界著名私立研究型大学。
作为世界顶尖高校,麻省理工学院(MIT)尤其以自然及工程学享誉世界,位列2015-16年世界大学学术排名(ARWU)工程学世界第1、计算机科学第2,与斯坦福大学、加州大学伯克利分校一同被称为工程科技界的学术领袖。
截止2015年,先后有85位诺贝尔奖得主在麻省理工学院工作或学习过。
面向对象:以欲申请美国名校交通工程、城市规划、计算机、自动化等相关专业的高中生为主;科研主题:交通规划与决策、城市出行与交通系统、决策过程中的数据管理与使用、交通需求分析、城市活动系统分析、交通系统与项目评价、规划程序与项目实施等;软性背景:有一定的科研履历者优先;科研导师:MIT专业导师;科研地点:MIT 科研组实验室/会议室;科研起源在最新的世界学术水平排行榜中,绝大部分都是美国的大学。
由于美国大学与工商业、企业结合紧密,同时学校的教学资源、实验课题及实验设备都属于全球顶尖状态,从而成为众多留学生的梦想留学目的地。
目前中国学生申请赴美留学人数日益剧增,以往美国顶尖名校选择录取GPA高分学生,后来校方逐渐发现学生在学习中缺少创新和实操的能力,进而导致美国名校录取率的下降。
近些年,招生官对选择学生时更加看重的是自主创新、专业技能、思维创造才能等综合素质人才。
对于计划入读美国名校的学生,实际的科研经验无疑可以提升竞争力,从而大大增加被名校录取的概率。
MIT高端科研项目,坚持为更多有梦想的学生提供机会和平台。
科研主题城市是人类最伟大的发明与最美好的希望,城市的未来将决定人类的未来!而城市发展,交通先行:城市交通是城市发展的命脉。

Urban freight transport policies and planning in Europe: an overview and classification of policy measuresDr. J.G.S.N. VisserOTB Research Institute for Housing, Urban and Mobility Studies, Delft University of Technology, The NetherlandsAbstractAlthough delivery of goods is vitally important for residents and industries in urban areas, the presence and operations of goods transport vehicles in urban areas are often regarded more as a nuisance than an essential service. Local communities, on the one hand, have to facilitate the essential flows of goods in urban areas and on the other hand have to reduce the adverse impacts of urban goods on their communities being served.In Europe, with its historic city centres and dense living areas, the nuisance of freight traffic has been addressed to as problem for a long time now on a local level but also on the national and even the European level (EU-action 321 Urban Goods Transport). In 2003, the OECD published a report on urban freight transport with the title Delivering the Goods, 21st Century Challenges to Urban Goods Transport (OECD, 2003).In a period of more than 15 years, in European cities measures have been taken to reduce traffic by introducing vehicles restrictions or by promoting consolidation of goods flows. Also introduction of cleaner, smaller and more flexible freight vehicles are proposed.This paper presents a general overview of different public policies and planning in the field of urban freight transport, based on my involvement in different European Commission projects, in the making of the OECD-report and as member of the Institute for City Logistics.Different public measures and instruments are discussed and categorised, such as licensing and regulation, private and public initiatives to bundle good flows and different types of freight centres.1IntroductionWithin urban areas, different types of goods transport take place, from transport of bulk goods and containers to and from ports or industrial areas to consumer goods to retail or people’s homes.In this paper, I will only focus on goods transport related to consumer goods in urban areas, in particular the final stage in distribution and with its destination within the urban area.Although the following goods flows are considerable, goods transported through urban areas (through traffic), building and demolition traffic, and the provisioning of the wholesale trade, will not be the centre point of my attention in this paper.Consumer goods come in different forms and shapes and can be categorised by their physical characteristics (function, value, weight, etc.), shipment characteristics (packaging,homogenous/heterogeneous) or by the characteristics of goods flows (distribution and transport characteristics). The majority of products shipped into urban areas are produced elsewhere. The shipments are composed of products from different places, around the world and shipped from strategic locations to customers in urban areas.The complexity of operations and conflicting policy goals make urban goods transport a contentious area (OECD, 2003): “Urban goods transport plays an important role in the discussion of quality of life in urban areas, since a large share of the traffic moves take place in areas with a high density of population and mixed use of public space, where external costs are easily felt.”According to the OECD-report the various problems both encountered and caused by urban goods transport, can be categorised, as follows:•Accessibility and congestion problems. The main reasons for accessibility problems are: insufficient urban goods transport infrastructure, access restrictions and congestion.•Environmental issues. At local level, freight transport contributes to local air pollution, traffic noise and other forms of nuisance such as smell, vibration and physical hindrance. Also inglobal environment and sustainability discussions, regarding emissions which influenceclimate change, the depletion of natural resources and the dumping of waste materials, freight transport in general is an issue.•Safety issues. In particular, the size and weight of the vehicles make freight transport a traffic safety issue. The transport of dangerous good is also an issue as well as nowadays security. •Energy consumption.Particularly in cities with high urban densities in combination with old city centres, urban freight transport is an issue on the local policy agenda (see further). This is quite understandable, these areas are not equipped for receiving large and heavy vehicles. Modern cities are designed for today’s ways of transportation but even then it is not guaranteed that freight vehicles can move around freely without causing some sort of nuisance. Noise and air pollution (NO x, SPM, SO x) are typically freight vehicle related problems and that is why these vehicles are the main focus of local clean air acts.Figure 1.1 Policy objective for urban goods transportAs we will see in this paper, countries have different experiences and different approaches regarding urban freight transport policies. The country-reports in the OECD-report are a start to categorise the different measures and policy instruments (section 2). This categorisation does not present the full picture of possible measures. Therefore based on a systems approach, it is possible to give a broader overview of measures (section 3).2 Different countries, different experiences and approachesFor the OECD-report (OECD, 2003) information on urban freight transport policies in different OECD countries was collected (see annex). Let’s discuss some results. In many countries, urban freight transport is mainly a local policy matter. It is an issue only at the local level and in specific situations, such as in historical areas, based on environmental concern of when pedestrian zones within shopping areas are developed. On the other hand in some countries national policies have been established.The experiences in the OECD-countries show a broad spectrum of measures. These measures are categorised as follows:•Licensing, regulations and freight routes•Freight centres and consolidated delivery•Low-emission vehicles and alternative fuels2.1 Licensing, regulations and freight routesTime windows and weight restrictions are popular measures, implemented mainly in European cities and in Korea. New types of restrictions like eco-zoning are emerging. With eco-zoning, only low-emission vehicles can enter a specific zone.Table 2.1 Examples of different truck limits for city access delivery regulations in some large European citiesParis 16m2 and 24 m2tonnes Amsterdam 7.5tonnes London 18 Barcelona 3.5 tonnes / 5 tonnes / 16 tonnesMilan 3.5 tonnes / 15 tonnesSource: OECD, 2003The restrictions in time, weight and emissions-level differ between countries. In particular, within countries differences in restrictions between urban areas make the logistic operations for truck operators more difficult and are in some countries, like the Netherlands an issue. For truck manufacturers the variety of vehicle restrictions on an international level are of concern.2.2 Freight centres and consolidated deliveryFreight centres are essential for consolidation. In some countries local consolidated delivery, is practised, based on a private or local public initiative. In Germany experiences in many cities with consolidated delivery, named City-Logistik, a joint service by different transport companies for urban delivery, didn’t lead to successful implementation. In Monaco and the city of Fukuoka (Japan) co-operative delivery systems are operational with support from the local government2.3 Low-emission vehicles and alternative fuels for urban areasNew trucks in Europe need to meet Euro-4 and Euro-5 standards. The implementation have a considerable impact on emissions. The use of electric vehicles and trucks on alternative fuels, like CNG, LNG and LPG has been assessed in different countries. The experiments have led to implementation in urban areas on a small scale. These vehicles are adjusted to moving around in urban areas. They are smaller, highly flexible and make less noise. The down side is that at longer distances these vehicles are less efficient than large trucks. It’s therefore important that these vehicles only have to operate in urban areas.Although these measure show some results, there is no definite answer if the urban freight transport issues are going to be solved the next decade. Considering the higher emission standards in for instance Europe and the demand for cleaner trucks or otherwise to ban certain trucks out of urban areas, the problem is getting even more serious.Considering the economic, social and environmental interests it is important the have a long term perspective in mind, when developing urban freight transport policy. The OECD-report provides a wider picture and presents eleven recommendations. These recommendations will not be discussed here, but a relevant recommendation is that to find effective measures all interests have to be considered. Creating win-win situations is very important.Consolidation of cargo leads to more efficient transport in terms of economy, environmental and socially. A long term policy requires insight in best practices and a policy and analytic framework. Such an approach is known as City Logistics (see for more information: ). City logistics is an integrated approach for urban goods distribution based on systems approach. It promotes innovative schemes that reduce the total cost (including economic, social and environmental) of goods movement within cities. City logistics encourages collaboration between key stakeholders within a market based economy.The OECD-report provides best practices and policy guidelines. In the next chapter, an analytic framework is provided to analyse the effectiveness of measures.3 Systems approach to define more optionsHere, I’ll introduce the ‘layer scheme’ for the transport system, as applied to urban goods transport. This layer scheme enables a systematic analysis of the system and helps to define inefficiencies in the system. The scheme classifies the primary functions and services of the goods distribution system, identifies different roles and names the actors that can play these roles (see Van Binsbergen & Visser, 2001). In this paper, I focus on the use of the layer scheme to categorise policy measures and to show these measures improve the efficiency of the urban goods transport system.3.1 Layer schemeIn order to describe the freight transport system in detail, the system is subdivided into layers in alayer scheme. Historically, due to specialisation, consumers and producers became spatially separated, which made transport essential. In due time, goods transport was no longer carried out solely by consumers or producers, but became the responsibility of specialised carriers. The next phase of the process was the separation between the provision of the transport service (Transport ) and the actual movement of vehicles carrying the goods (Traffic ). Specialised actors now act as service desks, while the carriers concentrate on performing the actual transport. Economic and technical developments have enabled this kind of specialisation.With the introduction of each specialisation, new market situations have emerged. Each service layer represents such a market situation, in which a specific service is demanded and provided in order to act as one transport system. The market situations are referred to as Phenomena , while the associated service levels are referred to as ‘primary services’. The primary services or service layers represent the main transport functions.PRIMARY SERVICES PHENOMENAFigure 3.1 ‘Phenomena’, service layers and markets in the goods transport system (VanBinsbergen & Visser, 2001)3.2 EfficiencyInefficiencies occur in the different levels of operations in the transport system. For instance, the volume of goods we consume (or at least buy) is always less than the volume that is transported. This is due to the simple reason that we need packaging material and/or load units to transport these goods. The routing of goods through the logistic chain can cause inefficiencies: there is an almost natural difference between the Euclidean distance and the actual transport distance between the origin and destination of a flow of goods. Other inefficiencies are introduced by means of insufficient consolidation, which leads to a relatively high number of vehicle kilometres compared to the actual transport performance. Finally, inefficiencies can also occur because of the way the vehicles are operated, for instance, the use of oversized vehicles and deadheading.Figure 3.2 Defining efficiencies in the urban goods transport system (Van Binsbergen & Visser, 2001)Strategies to solve these inefficiencies can be defined at several levels in urban freight transport, as was described before as a layer system. Between each layer, a market inefficiency can be introduced, as shown in Figure 3.2. Some considerations must be taken into account when assessing‘inefficiencies’.First, trade-offs can occur between layers. An efficiency improvement at one level can lead to inefficiencies at another level, or vice-versa. In addition, trade-offs between economic and environmental efficiencies are possible, as are trade-offs between local and regional efficiencies. Second, efficiency improvements within a system can lead to inefficiencies outside that system, or vice versa. For instance, the reduction of the flow of waste packaging materials by using re-usable packaging materials can turn efficient, highly consolidated transport flows of waste materials into inefficient, hardly consolidated, return flows.In this section, we will specify the different types of efficiency that can be derived from the layer scheme (figure 3.2).Volume-efficiencyOne indicator of volume-efficiency is the handling factor. The handling factor is the quotient of the produced mass or volume and the transported mass or volume. The volume-efficiency is actually the reciprocal of the handling-factor. An illustration can be drawn based on the UK food and drink sector in the period 1983-1991 (McKinnon and Woodburn, 1995). The handling factor increased by 13 percent in that period, meaning that 13 percent of the weight was transported twice. A growth of consumed tonnes of 7.8 percent coupled with an increase in the handling factor with 13 percent should mean an increase of the transported tonnes of 21.8 percent. McKinnon and Woodburn (1995) concluded, however, that the transported tonnes increased by only 10 percent during that same period.10203040506070801970198019901998a v e r a g e t r i p d i s t a n c e [k m ]Figure 3.3 Average transport distance in domestic goods transport in the Netherlands between 1970and 1997 for goods trucks (source: CBS, 1999)Logistic efficiencyLogistic efficiency can be defined as the ratio between the transport volume (tonnes) and the transport performance (loaded tonne kilometres per year). It reproduces the reciprocal of the transported distance. The shorter this distance, the better the logistic efficiency. Figure 3.3 shows that in the Netherlands the average transport distance grew from 41 kilometres in 1970 to 70 kilometres in 1997.Transport efficiencyTransport efficiency can be defined as the ratio of traffic performance (in terms of vehicle kilometres per year) to transport performance (in terms of loaded tonne kilometres per year). It reproduces the reciprocal of the load factor and the loading capacity of a vehicle. shows the maximum loading capacity of different types of vehicles. The transport efficiency in figure 3.4 gives some indication of the development of the load factor of trucks in the Netherlands.Table3.1 Transport efficiency of different vehicles (source: Bouman et al., 1990)Year 1995Cars Vans [diesel]Light trucks Trucks ArticulatedtrucksMaximum loading capacity [tonnes/vehicles] 0.250.94-1.43 4.739.68-13.99 25.5-25.8Transport efficiency [veh.km/tonnekm] 40.7-1.060.210.07-0.1 0.04If we take a closer look at data on domestic freight transport in the Netherlands, it is clear that there is a decrease in the utilisation in terms of load factor of road transport. Figure 3.4 shows that there is a steady decrease in the ratio of the loaded tonne kilometres to the load capacity tonne kilometres. Two important factors are responsible for this: a decrease in load factor and an increase in empty vehicle kilometres. The situation in urban freight transport becomes worse when examining the national figures (the average load factor in 1997 was 41.8 percent). The reasons for this include: own transport has a relatively high share in urban freight transport, and the average load factor in own transport is relatively low compared to professional transport (35.9 percent and 43.8 percent, respectively, in 1997). In urban freight transport, the share of smaller trucks and vans is relatively high, while the average load factor of these vehicles is relatively low (25.3 percent for vans in 1997).0,390,400,410,420,430,440,450,460,470,480,491970198019901998r a t i o l o a d t o n n e k i l o m e t r e s /l o a d c a p a c i t y t o n n e k i l o m e t r e sFigure 3.4 The average load factor between the years 1970 and 1998, expressed in the ratio loaded tonne kilometres/ load capacity tonne kilometres (source: CBS, 1999)The ratio of loaded vehicle-kilometres to total vehicle-kilometres is another indicator of the efficient use of vehicles. If this ratio is high, it means that the total for vehicle-kilometres driven empty is rather low, and vice versa. Figure 3.5 shows that between 1970 and 1997, the percentage of loadedkilometres decreased from 73 to 72 percent. In 1990 it was at its lowest, at 70 percent. This means that vehicles, trucks in this case, are again increasing the number of kilometres driven while empty. Since 1992, the percentage has gone up to 72 percent.0,680,690,700,710,720,730,740,751970198019901998r a t i o l o a d e d v e h .k /t o t a l v e h .k mFigure3.5 Ratio loaded goods vehicle kilometres versus total vehicle kilometres between the years 1970 and 1999 in the Netherlands (CBS, 1999)Environmental efficiencyEnvironmental efficiency has many measurements, including the quantity of emissions. Table 3.2 shows the emission-efficiency of different vehicles. If we combine this with transport-efficiencies in table 3.1, then we are able to construct an integrated efficiency-coefficient. Thus, we can compare different vehicle types and even different logistic concepts. The following indicators must be elaborated for this methodology:• Transport cost efficiency. Transport costs are a simple indicator, but speed and reliability mustalso be included in some way;• Social cost efficiency. This is normally done by monetarisation of, for instance, emissions andnoise pollution.Table 3.2: Freight traffic in urban areas and emission indicators (Source: CBS 1996; Poppe, 1997)Year 1995 Cars Vans[diesel]Trucks ArticulatedtrucksTotalTraffic volume [mln veh.km] -5353483597 6400 Primary Energy [MJ/km] 3.5 4.116.019.7 6.4 CO2 [g/veh.km] 25429711741441 469 NO x [g/veh.km] 0.84 1.1313.5320.54 -SO2 [g/veh.km] 0.0690.248 1.139 1.401 0.422 VOC* [g/veh.km] 0.650.77 4.728.09 -CO [g/veh.km] 2.9 3.5 6.710.2 -Benzene [mg/veh.km 9291182182 98 Aerosols [g/veh.km] 0.0090.290.972 1.003 -Traffic safety[lethal accidents/mln veh.km]643029[severe injuries/mln veh.km] 7858106--* VOC: Volatile Organic Compounds3.3 How to improve the overall efficiencyMeasures to improve urban freight transport can be categorised by using the earlier defined layer system. Each measure serves a certain efficiency, as defined earlier. This is elaborated in the next figure 3.6. The following categories are used:•Transport prevention. This refers to solutions by the shipper to avoid or reduce the need for transportation•Logistic optimisation. This refers to logistic chain optimisation and different ways of consolidation.•Transport optimisation. A carrier can take measures to optimise his fleet use, like route-planning, use of standardised load units or adjust his vehicles.• Traffic optimisation. The infrastructure provider can improve the infrastructure, introduce access restrictions, road pricing or traffic management.•Protective strategies, like noise barriers.By connecting measures to a layer and by determining how it improves the efficiency of the transport system, it is possible to determine qualitatively or quantitatively the effectiveness, in terms of transport and environmental and social costs. In particular transport prevention and logistic optimisation have potentially considerable impacts in terms of improving efficiency. In the Netherlands, the national government supported in the nineties on a large scale efficiency scans at different transport generating companies, efficiency improvements between 10-15 percent turned out to be directly feasible, without doing any large investments.This approach is applied in a simplified form with determining the consequences or ICT and e-commerce for freight transport in urban areas (Visser & Nemoto, 2003)Figure 9 Impacts of ICT on urban logistics system + : increasing effect - : decreasing effect Figure 3.7: The consequences of ICT for freight transport in urban areas (Visser& Nemoto, 2003)4 ConclusionsUrban freight transport is vitally important for residents and industries in urban areas. At the same time, there are problems, relating to environment and accessibility.There are very different policy practices in different countries. There is no best solution, although consolidation in combination with cleaner vehicles is a promising but difficult solution.In order to develop a better analytical framework. A layer systems approach is proposed in combination with defining different types of efficiencies.Measure are categorised based on the layer approach. For each type of solution is determined how it influences the efficiency of the urban freight transport systemThis way an analytic framework for an integrated approach, as recommended by the OECD-report is created. The layer scheme approach is used in several transport studies in the Netherlands by TRAIL Research School and TNO and turns out to be a successful approach to model transport systems in more detail. The next step is to use this approach to optimise freight transport policies.ReferencesBinsbergen, Arjan van & Johan Visser (2001) Innovation Steps Towards Efficient Goods Distribution Systems for Urban Areas, TRAIL Thesis Series nr. T2001/5, Delft (DUP Science).Bouman, P.A., P.J.L. Kluit, Th.J.H. Schoemaker & J. v.d. Waard (1990) Goederenvervoer en leefmilieu. Inventarisatie van emissies en verstoring door goederenvervoer (in Dutch), Delft (Faculteit der Civiele Techniek, Vakgroep Verkeer, TU Delft).Centraal Bureau voor de Statistiek (1999) Statistiek van het binnenlands goederenvervoer 1998 (in Dutch), Voorburg/Heerlen (CBS).McKinnon, A.C & A. Woodburn (1995) Logistical restructuring and road traffic growth: An empirical assessment, Edinburgh (Herriot-Watt Business School).OECD, 2003, Delivering the Goods, 21st Century Challenges To Urban Goods Transport, OECD, Paris.Poppe, F., J.P.M. Tromp en L. Braimaister (1997) Risicocijfers naar voertuigcategorie (in Dutch), Leidschendam (SWOV).Visser, J.G.S.N & T. Nemoto, 2002, E-commerce and the consequences for freight transport, in: Taniguchi, E. & R. Thompson (ed.), 2003, Innovations in freight transport, WITpress, Boston, pp 165-193.。

城市交通设计中的可持续发展思路(英文中文双语版优质文档)In today's rapid urbanization process, the sustainable development of urban traffic design is becoming more and more important. On the one hand, the acceleration of urbanization makes the problem of urban traffic more prominent; on the other hand, the solution of urban traffic problem directly affects the sustainable development of the city. Therefore, the idea of sustainable development in urban traffic design is not only a thought, but also a kind of action, which is related to the future development direction of urban traffic.In urban traffic design, the core of the idea of sustainable development is how to achieve a balance between the convenience of traffic and environmental protection to achieve sustainable development. This involves the construction of transportation infrastructure, the selection of transportation means, the adjustment of travel modes, and urban traffic management.1. Construction of transportation infrastructureIn urban transportation design, the construction of transportation infrastructure is the most basic step. The construction of transportation infrastructure needs to take into account the convenience, safety and impact on the environment of people's travel in order to achieve sustainable development.First, attention should be paid to establishing a comprehensive and efficient urban transportation network so that people in different regions can easily connect with each other. At the same time, the urban transportation network should pay attention to the connection with public transportation, realize the complementary development of public transportation and personal travel, and further improve the sustainability of urban transportation.Secondly, the construction of transportation infrastructure should pay attention to environmental protection and reduce damage to the natural environment. For example, low-carbon and environmentally friendly materials can be used to build roads, bridges and other transportation infrastructure. At the same time, energy saving and emission reduction should be emphasized in the design of transportation infrastructure to reduce the impact on the environment.2. Selection of means of transportationIn urban traffic design, the selection of transportation is also very critical. For different travel needs, appropriate means of transportation should be selected to achieve sustainable development of urban transportation.For short-distance travel, people can be encouraged to choose low-carbon travel methods such as walking and cycling to reduce environmental pollution. For medium and long-distance travel, people can be encouraged to choose public transportation, such as subways, light rail, buses, etc., to achieve low-carbon travel while alleviating urban traffic congestion.In addition, when choosing a vehicle, attention should also be paid to the energy consumption and emissions of the vehicle. For example, the use of new energy vehicles, hybrid vehicles and other environmentally friendly vehicles can be promoted to reduce exhaust emissions, thereby protecting the environment and achieving sustainable development.3. Adjustment of travel modeIn addition to the construction of transportation infrastructure and the selection of transportation means, the adjustment of travel modes is also an important direction for the sustainable development of urban transportation. The sustainable development of urban transportation requires people to gradually change their travel methods, from traditional personal car travel to low-carbon travel methods such as public transportation, walking, and bicycles.First, people should be encouraged to reduce their personal car trips and choose public transportation or low-carbon travel methods such as walking and cycling. This can not only reduce traffic congestion, but also reduce exhaust emissions, protect the environment, and achieve sustainable development of urban traffic.Secondly, a series of measures can be taken to promote people's change of travel mode, such as improving the convenience and comfort of public transportation, improving the network of bicycle lanes, encouraging walking and so on. These measures can help people choose low-carbon travel modes more conveniently, so as to realize the sustainable development of urban transportation.4. Urban traffic managementUrban traffic management is also an important direction to realize the sustainable development of urban traffic. Urban traffic management needs to pay attention to traffic flow control, reasonable allocation of road rights, and prevention of traffic accidents, in order to achieve efficient operation and sustainable development of urban traffic.First of all, the technology and intelligence of traffic management should be strengthened, and advanced traffic management technology and equipment should be adopted to improve the efficiency and quality of traffic management, so as to realize the efficient operation of urban traffic.Secondly, urban traffic management needs to pay attention to fairness and justice, so as to realize the reasonable distribution of road rights and the prevention of traffic accidents. For example, a traffic credit system can be established to evaluate individuals based on their traffic behavior and punish uncivilized driving behaviors, thereby guiding people to travel in a civilized manner and reducing traffic accidents.In short, the idea of sustainable development in urban traffic design is an important direction of urban traffic development. Urban transportation design needs to pay attention to the construction of transportation infrastructure, the selection of transportation means, the adjustment of travel modes, and urban traffic management, so as to achieve the balance between transportation convenience and environmental protection, and promote the sustainable development of urban transportation. This requires the joint efforts of the government, enterprises and citizens to take comprehensive measures to improve the efficiency and quality of urban traffic, protect the urban environment, and create more convenient and comfortable travel conditions for people.在当今快速发展的城市化进程中,城市交通设计的可持续发展问题愈加重要。

Urban transportation PlanningAn urban transportation system is basic component of an urban area's social,economic,and physical structure. Not only does the design and performance of a transportation system provide opportunities for mobility,but over the long term,it influences patterns of growth and the level of economic activity through the accessibility it provides to land. Planning for the development or maintenance of the urban transportation system is thus an important activity,both for promoting the efficient movement of people and goods in an urban area and for maintaining the strong supportive role that transportation can play in attaining other community objectives.There are several basic concepts about an urban transportation system that should be kept in mind. Most important,a transportation system in an urban area is defined as consisting of the facilities and services that allow travel throughout the region,providing opportunities for:(I)mobility to residents of an urban area and movement of goods and (2) accessibility to land .Given this definition,an urban transportation system can be further characterized by three major components: the spatial configuration that permits travel from one location to another; the transportation technologies that provide the means of moving over these distances; and the institutional framework that provides for the planning, construction, operation, and maintenance of system facilities.The Spatial Configuration of a Transportation SystemOne way to describe the spatial dimension of an urban transportation system is to consider the characteristics of individual trips from an origin to a destination. For example, a trip can consist of several types of movement undertaken to achieve different objectives. Travelers leaving home might use a local bus system to reach a suburban subway station(a trip collection process),proceed through the station to the subway platform (a transfer process),ride the subway to a downtown station (a line-haul process),and walk to a place of employment (a distribution process). Similarly,one can view a home-to-work trip by car as consisting of similar segments,with the local street system providing the trip collection process, a freeway providing the line-haul capability,a parking lot in the central business district serving as a transfer point,and walking,as before,serving the distribution function.The facilities and services that provide these opportunities for travel,when interconnected to permit movement from one location to another,form a network. Thus,another way of representing the spatial dimension of an urban transportation system is as a set of road and transit networks. Even in the smallest urban areas,where mass transit is not available,the local street network provides the basic spatial characteristic of the transportation system.The transportation system of a city can influence the way in which the city's social and economic structure, often called the urban activity system,develops. At the same time,changes in this structure can affect the ability of the transportation system to provide mobility and accessibility. Thus , the transportation system is closely related to the urban activity system and; historically, has been an important determinant of urban form.Because of the relation between transportation and urban activities,many of the methods used by transportation planners depend on estimates of trips generated by specific land uses. The relation also suggests that the options available to public officials dealing with transportation problems should include not only those related directly to the transportation system, but also actions such as zoning that affect the distribution of land use, and thus influence the performance of the transportation system.The foregoing considerations point to two important principles for transportation planning: The transportation system should beConsidered as an integral part of the social and economic system in an urban area.Viewed as a set of interconnected facilities and services designed to provide opportunities for travel from one location to another.The Technology of Urban TransportationThe technology of urban transportation is closely related to the spatial configuration of the transportation system in that the design transportation networks reflects the speed, operating , and cost characteristics of the vehicle or mode of transportation being used. Technology includes the means of propulsion, type of support,means of guidance,and control technique.The development and widespread use of electric streetcars in urban areas during the late nineteenth century was a technological innovation that initiated the transformation of mostNorth American cities. The advent of the electric streetcar permitted urban areas to expand beyond the boundaries that had been dictated by previous transportation technologies (e. g.,walking,horse,horsecar),spawning `streetcar suburbs' with dramatically lower residential densities along streetcar lines radiating from the central city. Whereas many industries had decentralized along railroad lines leading from the central city,and workers initially had to live near these factories, the introduction of streetcars now permitted more distant living.The success of the streetcar in providing access from selected suburban areas to central business districts was followed by public acceptance of a second major technological innovation-the automobile,powered by the internal combustion engine. Increasing consumer preferences for lower-density living and for an ability to travel beyond established urban boundaries sparked a phenomenal growth in automobile ownership and usage,beginning in the 1920s . ④The automobile continues and accelerated the evolution of urban structure started by the electric streetcar. Its availability permitted further expansion of urban areas and, more important, provided access to land between the radial streetcar and railroad lines leading into the central city.The technology of the internal-combustion engine,however, also led to the decline of other transportation modes used in urban areas by providing a less expensive and more flexible replacement for rail-based modes. While the automobile provided new opportunities for personal mobility and urban growth, motor buses rapidly replaced electric streetcars, to the extent that only five North American cities today still operate large-scale streetcar systems-Boston, Philadelphia, Pittsburgh, Toronto, and San Francisco (although this trend has reversed somewhat in recent years with new `light rail' systems in operation in Edmonton, Calgary, San Diego, and Buffalo). At the same time, the growth of private automobile use has dramatically reduced the use of public transportation in general, particularly since the end of World War II. According to the latest census figures, in 1980, 62. 3 million Americans normally drove alone to work each day, another 19 million car-pooled, and 6 million used public transportation.The technologies and the resulting modes available today for urban transportation are common to most cities but are often applied in different ways to serve different purposes. It should be noted that certain types of modes are appropriate than others in serving different types of urban trips.The technological dimension of the urban transportation system suggests a third principle for urban transportation planning:Transportation planners must consider the transportation system as consisting of different modes , each having different operational and cost characteristics.From; Michael D. Meyer and Eric J. Miller "Urban Transportation Planning", 1984Traffic signalsIn the United States alone ,some 250,000 intersections have traffic signals , which are defined as all power-operated traffic-control devices except flashers,signs,and markings for directing or warning motorists, cyclists,or pedestrians.Signals for vehicular,bicycle,and pedestrian control are ‘pretimed’where specific times intervals are allocated to the various traffic movements and as 'traffic actuated' where time intervals are controlled in whole or in part by traffic demand.Pretimed Traffic Signals'Pretimed' traffic signals are set to repeat regularly a given sequence of signal indications for stipulated time intervals through the 24-hr day. They have the advantages of having controllors of lower first cost and that they can be interconnected and coordinated to vehicles to move through a series of intersections with a minimum of stops and other delays. Also, their operation is unaffected by conditions brought on by unusual vehicle behavior such as forced stops,which,with some traffic-actuated signal installations may bring a traffic jam. Their disadvantage is that they cannot adjust to short-time variations in traffic flow and often hold vehicles from one direction when there is no traffic in the other. This results in inconvenience, and sometimes a decrease in capacity.‘Cycle length’the time required for a complete sequence of indications, ordinarily falls between 30 and 120s. Short cycle lengths are to be preferred, as the delay to standing vehicles is reduced. With short cycles, however a relatively high percentage of the total time is consumed in clearing the intersection and starting each succeeding movement. As cycle length increases, the percentage of time lost from these causes decreases. With high volumes of traffic, it may be necessary to increase the cycle length to gain added capacity.Each traffic lane of a normal signalized intersection can pass roughly one vehicle each2.1s of green light. The yellow (caution) interval following each green period is usually between 3 and 6s,depending on street width,the needs of pedestrians, and vehicle approach speed. To determine an approximate cycle division, it is common practice to make short traffic counts during the peak period. Simple computations give the number of vehicles to be accommodated during each signal indication and the minimum green time required to pass them. With modern control equipment, it is possible to change the cycle length and division several times a day, or go to flashing indications to fit the traffic pattern better.At many intersections,signals must be timed to accommodate pedestrian movements. The Manual recommends that the minimum total time allowed be an initial interval of 4 to 7s for pedestrians to start plus walking time computed at 4 ft/s (1. 2m/s). With separate pedestrian indicators,the WALK indication(lunar white) covers the first of these intervals, and flashing DON'T WALK (Portland orange ) the remainder. The WALK signal flashes when there are possible conflicts with vehicles and is steady when there are none. Steady DON'T WALK tells the pedestrian not to proceed.If pedestrian control is solely by the vehicle signals,problems develop if the intersection is wide, since the yellow clearance interval will have to be considerably longer than the 3 to 5s needed by vehicles. This will reduce intersection capacity and may call for a longer cycle time. On wide streets having a median at least 6 ft (1. 8m)wide,pedestrians may be stopped there. A separate pedestrian signal activator must be placed on this median if pedestrian push buttons are incorporated into the overall control system.Coordinated MovementFixed-time traffic signals along a street or within an area usually are coordinated to permit compact groups of vehicles called `platoons’to move along together without stopping. Under normal traffic volumes,properly coordinated signals at intervals variously estimated from 2500 ft (0. 76km)to more than a mile (1. 6km) are very effective in producing a smooth flow of traffic. On the other hand,when a street is loaded to capacity,coordination of signals is generally ineffective in producing smooth traffic flow.Four systems of coordination-simultaneous, alternate,limited progressive, and flexible progressive-have developed over time. The simultaneous system made all color indications on a given street alike at the same time .It produced high vehicle speeds between stops but lowoverall speed. Because of this and other faults,it is seldom used today.The alternate system has all signals change their indication at the same time,but adjacent signals or adjacent groups of signals on a given street show opposite colors. The alternate system works fairly well on a single street that has approximately equal block spacing. It also has been effective for controlling traffic in business districts several blocks on a said, but only when block lengths are approximately equal in both directions. With an areawide alternate system,green and red indications must be of approximately equal length. This cycle division is satisfactory where two major streets intersect but gives too much green time to minor streets crossing major arteries. Other criticisms are that at heavy traffic volumes the later section of the platoon of vehicles is forced to make additional stops,and that adjustments to changing traffic conditions are difficult.The simple progressive system retains a common cycle length but provides 'go' indications separately at each intersection to match traffic progression. This permits continuous or nearly continuous flow of vehicle groups at a planned speed in at least one direction and discourages speeding between signals. Flashing lights may be substituted for normal signal indications when traffic becomes light.The flexible progressive system has a master controller mechanism that directs the controllers for the individual signals. This arrangement not only gives positive coordination between signals,but also makes predetermined changes in cycle length,cycle split,and offsets at intervals during the day. For example,the cycle length of the entire system can be lengthened at peak hours to increase capacity and shortened at other times to decrease delays.Flashing indications can be substituted when normal signal control is not needed. Also the offsets in the timing of successive signals can be adjusted to favor heavy traffic movements, such as inbound in the morning and outbound in the evening. Again,changes in cycle division at particular intersections can be made. The traffic responsive system is an advanced flexible progressive system with the capacity to adjust signal settings to measured traffic volumes.Where traffic on heavy-volume or high-speed arteries must be interrupted for relatively light cross traffic,semi-traffic-actuated signals are sometimes used. For them,detectors are placed only on the minor street. The signal indication normally is green on the main road and red on the cross street. On actuation, the indications are reversed for an appropriate intervalafter which they return to the original colors.Highway Capacity And Levels of ServiceCapacity DefinedA generalized definition of capacity is: The capacity of any element of the highway system is the maximum number of vehicles which has a reasonable expectation of passing over that section (in either one or both directions) during a given time period under prevailing roadway and traffic conditions. A sampling of capacities for modern highway elements is as follows:In treating capacity,TRB Circular 212 divides freeways into components: basic freeway segments and those in the zone of influence of weaving areas and ramp junctions. Capacities of expressways,multilane highways,and two- and three-lane facilities also have the two components: basic and those in the zone of influence of intersections. Each of these is treated separately below.Speed-Volume-Capacity Relationships for BasicFreeway and Multilane Highway SegmentsA knowledge of the relationships among speed,volume,and capacity is basic to understanding the place of capacity in highway design and operation. Figurel3.1,which gives such a relationship for a single freeway or expressway lane, is used for illustrative purposes.If a lone vehicle travels along a traffic lane,the driver is free to proceed at the design speed. This situation is represented at the beginning of the appropriate curve at the upperleft of Fig. 13.1. But as the number of vehicles in the lane increases, the driver's freedom to select speed is restricted. This restriction brings a progressive reduction in speed. For example,many observations have shown that,for a highway designed for 70 mph (113km/h),when volume reaches 1900 passenger cars per hour,traffic is slowed to about 43 mph (69km/h). If volume increases further, the relatively stable normal-flow condition usually found at lower volumes is subject to breakdown. This zone of instability is shown by the shaded area on the right side of Fig. 13. 1. One possible consequence is that traffic flow will stabilize at about 2000 vehicles per hour at a velocity of 30 to 40 mph (48 to 64km/h) as shown by the curved solid line on Fig. 13. 1. Often,however , the quality of flow deteriorates and a substantial drop in velocity occurs; in extreme cases vehicles may come to a full stop. In this case the volume of flow quickly decreases as traffic proceeds under a condition known as ‘forced flow.’ V olumes under forced flow are shown by the dashed curve at the bottom of Fig.13. 1. Reading from that curve,it can be seen that if the speed falls to 20 mph (32km/h),the rate of flow will drop to 1700 vehicles per hour; at 10 mph (16km/h) the flow rate is only 1000;and,of course,if vehicles stop,the rate of flow is 0. The result of this reduction in flow rate is that following vehicles all must slow or stop,and the rate of flow falls to the levels shown. Even in those cases where the congestion lasts but a few seconds, additional vehicles are affected after the congestion at the original location has disappeared. A ‘shock wave’develops which moves along the traffic lane in the direction opposite to that of vehicle travel. Such waves have been observed several miles from the scene of the original point of congestion,with vehicles slowing or stopping and then resuming speed for no apparent reason whatsoever.Effects of the imposition of speed limits of 60, 50, and 40 mph are suggested by the dotted lines on Fig. 13. 1. A 55-mph (88km/h) curve could also be drawn midway between the 60 and 50 mph dotted curves to reflect the effects of the federally imposed 55-mph limit, but this is conjectural since the level of enforcement varies so widely.Vehicle spacing,or its reciprocal, traffic density, probably have the greatest effect on capacity since it generates the driver's feeling of freedom or constraint more than any other factor. Studies of drivers as they follow other vehicles indicate that the time required to reach a potential collision point,rather than vehicle separation,seems to control behavior. However,this time varies widely among drivers and situations. Field observations haverecorded headways (time between vehicles) ranging from 0. 5 to 2 sec, with an average of about 1. 5s.Thus,the calculated capacity of a traffic lane based on this 1. 5 s average, regardless of speed,will be 2400 vehicles per hour. But even under the best of conditions, occasional gaps in the traffic stream can be expected,so that such high flows are not common. Rather, as noted,they are nearer to 2000 passenger cars per hour.The ‘Level of Service’ ConceptAs indicated in the discussion of the relationships of speed, volume or density, and vehicle spacing, operating speed goes down and driver restrictions become greater as traffic volume increase. ‘Level of service’ is commonly accepted as a measure of the restrictive effects of increased volume. Each segment of roadway can be rated at an appropriate level,A to F inclusive,to reflect its condition at the given demand or service volume. Level A represents almost ideal conditions; Level E is at capacity; Level F indicates forced flow.The two best measures for level of service for uninterrupted flow conditions are operating or travel speed and the radio of volume to capacity达到最大限度的广播,called the v/c ratio. For two- and three-lane roads sight distance is also important.Abbreviated descriptions of operating conditions for the various levels of service are as follows:Level A—Free flow; speed controlled by driver's desire,speed limits, or physical roadway conditions.Level B—Stable flow; operating speeds beginning to be restricted; little or no restrictions on maneuverability from other vehicles.Level C—Stable flow; speeds and maneuverability more closely restricted.Level D—Approaches unstable flow; tolerable speeds can be maintained but temporary restrictions to flow cause substantial drops in speed. Little freedom to maneuver,comfort and convenience low.Level E—V olumes near capacity; speed typically in neighborhood of 30 mph (48km/h); flow unstable; stoppages of momentary duration. Ability to maneuver severely limited.Level F—Forced flow,low-operating speeds,volumes below capacity; queues formed.A third measure of level of service suggested in TRB Circular 212 is traffic density. This is,for a traffic lane,the average number of vehicles occupying a mile (1. 6km) of lane at a given instant. To illustrate,if the average speed is 50 mph,a vehicle is in a given mile for 72 s. If the lane carrying 800 vehicles per hour,average density is then 16 vehicles per mile ;spacing is 330 ft (100m),center to center. The advantage of the density approach is that the various levels of service can be measured or portrayed in photographs.From: Clarkson H. Oglesby and R. Gary Hicks “Highway engineering”, 1982城市交通规划城市交通系统是市区的社会、经济、和物质结构的一个基本组成部分。

规划⼯程学课件Lecturenotes#6-UrbanTransportLecture Note #6: SUSTAINABLE URBAN TRANSPORTATION SYSTEMWhat is TransportationTransportation is the process of movement of people, goods or other things from one place to another. Urban Transport Transportation process in urban areas i.e. cities2Transport HistoryComponents of Urban Transportation ? Physical Infrastructure e.g. roads, rails, bridges, underground tunnels, skyways ? Modes: motorized, non-motorized ? Users: passengers ? Supporting System e.g. policies, programs, automated control system4Transport InfrastructureHighway Elevated Railway Underground RailwayBridge5Transport InfrastructureAirport Elevated RailwaySeaport6Transport Modes7Transport PolicyFuel Private TransportPublic Transport Multimodal Trans8Transit ProcessHome9Transportation Network and CitiesCities are formed as a result of complex interaction of many forces At early times, transportation defined location of ancient cities: e.g. cities close to waterways. ? Transportation network affects urban form shape of the urban area as a result of the development of transportation network. [PS:urban form – shape & transportation network, urban structure – distribution of land uses and pop density]10Transportation and Cities’ LocationFirst major significant transportation was exchange of goods, due to either surplus or deficiency of goods; Intensification of goods exchanges:– Formation of trading routes and markets – Establishment of inns, stores, and other servicesEventually a city was developed:– At trading routes or markets e.g. rivers or plains or other convenient places – Similar other process by other traders avoiding natural obstacles - clusters11Transportation and City SizeTransportation stimulates growth of cities i.e. good mobility within cities influences cities’ growth But, transportation can also act as constraints to cities particularly prior to invention of mechanized vehicles i.e. food and other supplies were limited by transportation ? However, transportation was not the only factor to influence urban growth (city size)12Transportation System PerformancePerformance of transportation system depends on public investment, policy and decisions made daily by travelers Travelers’ decisions are based on:– Travelers’ aim for value (most urban trips do not occur because of travelers enjoy the travel) – Travelers’ benefits (convenience, comfort, safety, reliability, speed) – Travelers’ costs (fuels, maintenance, tolls, parking, travel time) – most of them do not consider congested costs, environmental and other costs (externalities)13Sustainable Urban Transport:focuses on access and mobility rather than the movement of vehicles provides access for and to all groups in society in a manner which is within the environmental carrying capacity of a city or region in a manner which is affordable to both providers and users of transport systems ? allows for generating economic growth without compromising economic and social dimensions to a point beyond repair ? SUT systems combine technological and nontechnological measures to enhance the sustainability of transport systemsSUT ObjectivesTo reduce the motorized travel demand, by reducing the number of trips and trip lengths To maximize the use of sustainable transport modes i.e. walking, biking and other non-motorized transport ? To minimize the use of resources by promoting efficient transportation systems ? To increase transport energy efficiency and emission standards of motorized vehicles.Environmental Dimension of SUTPollution from transport should not exceed assimilative carrying capacity of the (local) environment (air, water and soil) Rate of use of non-renewable resources should not exceed the rate at which renewable substitutes are developed ? Air: both local urban pollution to be considered as well as greenhouse gasses.Social Dimension of SUTVision for road safety: no deaths and no injuries. Provide access to all sections of society including those below the poverty line ? There should be high class transport options available at an affordable end-price for all groups in society ? People do not feel threatened and their personal security is assuredThe Economic Dimension of SUTMarket mechanism to determine how to get there (no subsidies, no incentives) To incorporate full cost allocation of all external costs: life-cycle, social and environmental externalities ? Subsidies or incentives can be considered, they need to take into account equity considerations and environmental impacts ? Transport systems require the resources to sustain themselves and to allow for continual improvements.Governance of SUTImproved data collection SUT requires involvement of all stakeholders and full access to information SUT requires consistent political support and well coordinated transparent administrative structures and processes ? SUT requires proactive government involvement ? SUT requires a well organized public transport sector with a limited number of providers which operate in the formal economy。

Evaluationn.估价;评价Transportation facilities运输工具Code for design of automobile transportation facilities for petrochemical enterprises石油化工企业汽车运输设施设计规范Infrastructure基础设施; 基础建设Metropolitan大都会的; 大城市的; 宗主国的; 大主教教区的Decision-oriented approach决策导向方法Transit oriented development(TOD)以公共交通为导向的开发transit-oriented development,TOD是规划一个居民或者商业区时,使公共交通的使用最大化的一种非汽车化的规划设计方式。
Decision-making process决策程序,决策过程不同的人决策行为和习惯也存在很大的差异,但决策的整体过程来看,基本上会遵循以下五个步骤循环。
人类决策的五个步骤循环1) 需求确认2) 方案收集3) 方案评估4) 克服决策压力5) 方案执行Short-range planning短期规划Long range planning长期规划Demand for transport is derived交通需求是衍生性的Activityn.活动; 活跃,敏捷; 活动力; 教育活动;Aggregate model集计模型在传统的交通规划或交通需求预测中,通常首先将对象地区或群体划分为若干个小区或群体等特定的集合体,然后以这些小区或群体为基本单位,展开问题的讨论。
因此,在建立模型或将样本放大时,需要以这一类的集合体为单位对数据进行集计处理。
通过上述集计处理得到的数据称为集计数据,而用集计数据所建立的模型称为集计模型。
Disaggregate model交通需求预测的集计模型通常是将每个人的交通活动按交通小区进行统计处理、分析,从而得到以交通小区为单位的分析模型。