Abstract Toward A Completely Automatic Neural Network Based
- 格式:pdf
- 大小:426.36 KB
- 文档页数:35
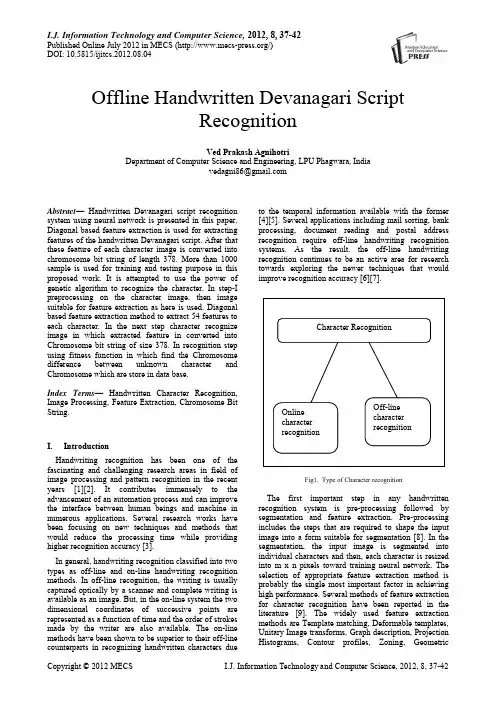
I.J. Information Technology and Computer Science, 2012, 8, 37-42Published Online July 2012 in MECS (/)DOI: 10.5815/ijitcs.2012.08.04Offline Handwritten Devanagari ScriptRecognitionVed Prakash AgnihotriDepartment of Computer Science and Engineering, LPU Phagwara, Indiavedagni86@Abstract—Handwritten Devanagari script recognition system using neural network is presented in this paper. Diagonal based feature extraction is used for extracting features of the handwritten Devanagari script. After that these feature of each character image is converted into chromosome bit string of length 378. More than 1000 sample is used for training and testing purpose in this proposed work. It is attempted to use the power of genetic algorithm to recognize the character. In step-I preprocessing on the character image, then image suitable for feature extraction as here is used. Diagonal based feature extraction method to extract 54 features to each character. In the next step character recognize image in which extracted feature in converted into Chromosome bit string of size 378. In recognition step using fitness function in which find the Chromosome difference between unknown character and Chromosome which are store in data base.Index Terms—Handwritten Character Recognition, Image Processing, Feature Extraction, Chromosome Bit String.I.IntroductionHandwriting recognition has been one of the fascinating and challenging research areas in field of image processing and pattern recognition in the recent years [1][2]. It contributes immensely to the advancement of an automation process and can improve the interface between human beings and machine in numerous applications. Several research works have been focusing on new techniques and methods that would reduce the processing time while providing higher recognition accuracy [3].In general, handwriting recognition classified into two types as off-line and on-line handwriting recognition methods. In off-line recognition, the writing is usually captured optically by a scanner and complete writing is available as an image. But, in the on-line system the two dimensional coordinates of successive points are represented as a function of time and the order of strokes made by the writer are also available. The on-line methods have been shown to be superior to their off-line counterparts in recognizing handwritten characters due to the temporal information available with the former [4][5]. Several applications including mail sorting, bank processing, document reading and postal address recognition require off-line handwriting recognition systems. As the result, the off-line handwriting recognition continues to be an active area for research towards exploring the newer techniques that would improve recognition accuracy [6][7].Fig1. Type of Character recognitionThe first important step in any handwritten recognition system is pre-processing followed by segmentation and feature extraction. Pre-processing includes the steps that are required to shape the input image into a form suitable for segmentation [8]. In the segmentation, the input image is segmented into individual characters and then, each character is resized into m x n pixels toward training neural network. The selection of appropriate feature extraction method is probably the single most important factor in achieving high performance. Several methods of feature extraction for character recognition have been reported in the literature [9]. The widely used feature extraction methods are Template matching, Deformable templates, Unitary Image transforms, Graph description, Projection Histograms, Contour profiles, Zoning, GeometricCharacter RecognitionOnlinecharacterrecognitionOff-linecharacterrecognition38Offline Handwritten Devanagari Script Recognitionmoments invariants, Zernike Moments, Spline curve approximation, Fourier descriptors, Gradients feature and Gabor features.An artificial neural network as the backend is used for performing classification and recognition tasks. In the off-line recognition system, the neural networks have emerged as the fast and reliable tools for classification towards achieving high recognition accuracy [10]. Classification techniques have been applied to handwritten character recognition since 1990s. These methods include statistical methods based on Bayes decision rule, Artificial Neural Networks (ANNs), Kernel Methods including, Support Vector Machines (SVM) and multiple classifier combination [11][12]. Handwritten character recognition is not a simple task. Character recognition is complex task, even after writing people are not able to understand but he/she written. So to reach 100% accuracy is very difficult job. Many researchers have done lots of work in this field but, 100% accuracy in not achieved.In this paper, a diagonal feature extraction scheme for the recognizing off-line handwritten characters is used. In the feature extraction process, resized individual character of size 90x60 pixels is further divided into 54 equal zones, each of size 10x10 pixels. The features are extracted from the pixels of each zone by moving along their diagonals. This procedure is repeated for all the zones leading to extraction of 54 features for each character. These features are converted into Chromosome bit string of size 378. Feature is extracted from each zone of size 10x10 is converted into 7 bit string so, there are 54 zone in each character image so, 54x7=378 bit string is used to represent each character image.The paper is organized as follows, in Section II; the proposed recognition system is presented. The feature extraction procedure adopted in the system is detailed in the section III. Section IV describes the classification and recognition. Section V presents the experimental results and finally, the paper is concluded in section VI. II.Application of Offline Handwritten Character Recognition SystemSome of the important applications of offline handwritten character recognition are listed in the following section:A.Cheque ReadingOffline handwritten Character recognition is basically used for cheque reading in banks. Cheque reading is very important commercial application of offline handwritten character recognition. Handwritten character recognition plays very important role in banks for signature verification and for recognition of amount filled by user. B.Postcode RecognitionHandwritten character recognition system can be used for reading the handwritten postal address on letters. Offline handwritten character recognition system used for recognition handwritten digits of postcode. HCR can be read this code and can sort mail automatically.C.Form processingHCR can also be used for form processing. Forms are normally used for collecting public information. Replies of public information can be handwritten in the space provided.D.Signature verification.HCR can also used for identify the person by signature verification. Signature identification is the specific field of handwritten identification in which the writer is verified by some specific handwritten text.III.Devanagari Script Recognition SystemIn this section, the proposed recognition system is described. A typical handwriting recognition system consists of pre-processing, segmentation, feature extraction, classification and recognition, and post processing stages. The schematic diagram of the proposed recognition system is shown in Fig.3A.Image AcquisitionIn Image acquisition, the recognition system acquires a scanned image as an input image. The image should have a specific format such as .jpeg, .bmp etc. This image is acquired through a scanner, digital camera or any other suitable digital input device.B.Pre-processingThe pre-processing is a series of operation performed on the scanner input image. It essentially enhances the image rendering it suitable for segmentation. The various tasks performed on the image in pre-processing stage shown in Fig. 2. Binarization process converts a gray scale image into a binary image using thresh holding technique. Detection of edges in the binarized image using canny technique, dilation the image are the operations performed in the last two stages to produce the pre-processed image suitable for segmentation [13].Fig. 2 Pre-processing of handwritten characterC. SegmentationIn the segmentation stage, an image of sequence of characters is decomposed into sub-images of individual character. In the proposed system, the pre-processed input image is segmented into isolated characters by assigning a number to each character using a labeling process. This labeling provides information about number of characters in the image. Each individual character is uniformly resized into 90x60 pixels for classification and recognition stage.Fig.3 Proposed recognition system.Preprocessing Algorithm1. start2. I=imre ad(…sample1.jpg‟); Read image usingimread(); method 3. I=im2bw(I,level) convert into binary image 4. Detecting Edge using Sobel Mehtod 5. Imwrite(I,‟sample.bmp‟,‟bmp‟); 6. EndIV. Feature Extraction MethodIn this stage, the features of characters that are crucial for classifying them at recognition stage are extracted. This is an important stage as its effective functioning improves the recognition rate and reduces the misclassification [14]. First of all try to understand Devanagari script, Devanagari script written left to right along a horizontal line. Its basic set of symbols consists of 34 consonants (…vyanjan‟) and 11 vowels (…svar‟). Characters are joined by a horizontal bar that creates an imaginary line when Devanagari text is suspended and no spaces are used between words. A single or double vertical line called …Puran Viram‟ was traditionally used to indicate the end of phrase or sentence. In part, Devanagari owns its complexity to its rich set of conjuncts. The language is partly phonetic in that a word written in Devanagari can only be pronounced in one way, but not all possible pronunciations can be written perfectly. Diagonal feature extraction scheme for recognizing off-line handwritten characters in proposed in this work. Every image of size 90x60 pixels is divided into 54 equal zones, each of size 10x10 pixels (Fig.4(c)). The features are extracted from each zone pixels by moving along diagonals of its respective 10x10 pixels. Each zone has 19 sub-features values are averaged to form a single feature value and placed in the corresponding zone (Fig. 4(b)). This procedure is sequentially repeated for the all the zones. There could be some zones whose diagonals are empty of foreground pixels. The feature values corresponding to these zones are zero. Finally, 54 features are extracted for each character.Divide Character Image into Zones Algorithm1. Start2. Read image I=imread(…sample.bmp‟);3. Resize image into 90x60 B=resize(I, [90 60]);4. Find number of row and column [c1c2]=size(B);5. Set bs=10; Block size (10x10)6. Set=nob=(c1/bs)*(c2/bs); Total number of10x10 block 7. Set k=0; kk=0; 8. For i=1:(c1/bs)a. For j=1:(c2/bs)b. K=k+1;c. Block(:,:,kk+j)=B((bs*(i-1)+1:bs*(i-1)+bs),(bs*(j-1)+1:bs*(j-1)+bs)); imwrite(Block(:,:,kk+j),strcat(int2str(k ),'.bmp'),'bmp');d. ende. kk=kk+(c1/bs);9. endScanned input ImageNoise Removing Binarization Edge Detection Dilation and Filling Processed Image for featureExtraction10. End (Dividing into Blocks and write each blockinto image)Fig. 4(a) Procedure for extracting feature from charactersFig. 4(b) Vowels and corresponding modifiersFig. 4(c) ConsonantV. Classification and RecognitionThe classification stage is the decision making part of a recognition system and it use the features extracted in the previous stage. It is very important stage, in this stage input is classified that in which class particular input is belong. Feature which are extracted from pervious stage are used to form chromosome, after that this chromosome bit string is used to recognize the Devanagari character image. This phase consists of two functions. 1) Chromosome function generation. 2) Chromosome fitness function.Each of function has the following details:-Chromosome function generation: - The Chromosome generation functions generate Devanagari character Chromosome of length 162 bit, by combining all feature extracted from pervious phase. The sample Chromosome for Devanagari Character“” is “011000011100000000011011011101010010110110011100100100110011000101011011101010010010001011011110100010001011011100010011100011101001001100100011110101101110101100” where 0s is show that none of feature is shown in character image, and 1s is showing that feature present in the character image.Chromosome String Generation Algorithm1. Start2. Clear global bitString;3. Set global bitString;4. For i=1:545. I=imread(strcat(int2str(i),‟.bmp‟));6. Set A=spdiags(I);7. Set Avg=0;8. Find Size of A [r c]9. For j=1:c 10.For k=1:r 11. Avg=Avg+A(k,j);12. End13. End14. DiagonalAverage(i)=ceil(Avg/19); 15.bitString=horzcat(bitString,dec2bin(DiagonalAverage(i),7)); 16. EndChromosome fitness function: - The Chromosome bit string from the Chromosome generation function is used to recognize Devanagari character by comparing the fitness value of an unknown character with all the Devanagari character which is store in database during training process. The highest fitness value is the recognition result. The fitness value is calculated as follow:(1)Where S is Chromosome bit strings which are store in Database and L is Chromosome bit string of unknown character.Fig. 5: User InterfaceVI.DesignThe HDCR system interface is shown in Figure 13. The interface has 2 panels. The first panel show unknown character which system try to recognize. The next one is result panel. This panel is used to show the picture of a character which is a result of recognition. The HDCR Interface contains 4 Buttons. First Button1 (Load Image) is used to upload scanned image which want to recognize and show on panel number 1. Button 2 (Pre-processing) performs pre-processing function so, it become easy to extract feature from image. Next Button 3 (Feature Extraction) extracts all essential features from the selected image and store in the form of bit String of size 162. At last Button 4(Recognition) recognize unknown character and show result in result panel as image.VII.Results and DiscussionThe recognition system has been implemented using Matlab 7.10.0 (R2010a). The scanned image is taken as dataset /input. The experiment is conducted on more than 1000 characters. The testing characters are separated into data sets, the training data set and testing data set. The training set contains 904 characters and testing set contains 204 characters. The precision of offline Devanagari system is 85.78% match, 13.35% mismatch.VIII.Issue Regarding SystemHandwritten Devanagari character recognition is discussed here. It has been found that recognition of handwritten Devanagari characters is very difficult task. Follow are main reasons for difficulty in recognition of Devanagari Characters:-∙Some Devanagari character similar in shape∙Different or even the same writer can write differently times depending upon pen or pencil.∙The character can be written at different location on paper or its window.∙Character can be written in different fontsIX.Future Work and ScopeA simple off-line handwritten Devanagari script recognition system using feature extraction, namely, diagonal feature extraction is used. The main objective in this research paper is to genetic algorithm technique in Devanagari Character recognition. In this research paper I use genetic algorithm to generate Chromosome bit string from the 54 feature which in extracted using diagonal based technique. The success of any recognition system is depends on feature and classifier which is used to classify the unknown input to well define class. So this need more complex method like mutation, etc. technique used to optimize the solution using genetic algorithm. Using genetic algorithm which is less use in Devanagari and any other Indian languages is more productive. But as the concern of handwritten character each person write character in its own way, so well define structure is not applicable in this type of problem. My future work is to recognize character of Devanagari script using Neural Network and recognize Devanagari word is step forward in Handwritten Word recognition.AcknowledgementWith deep sense of gratitude I express my sincere thanks to my esteemed and worthy supervisor Mr. Tejinder Thind in the Department of Computer Science and Engineering for his valuable guidance in carrying out this work under his effective supervision. My greatest thanks are to all who wishes me success especially my brother Dr. Anil Agnihotri whose support and care makes me complete this work. References[1]S. Mori, C.Y. Suen and K. Kamamoto,“Historicalreview of OCR research and development,” Proc.Of IEEE, vol. 80, pp. 1029-1058, July 1992.[2]S. Impedovo, L. Ottaviano and S.Occhinegro,“Optical character recognition”,International Journal Pattern Recognition andArtificial Intelligence, vol. 5(1-2), pp. 1-24, 1991.[3]V. K. Govindan and A.P. Shivaprasad,“CharacterRecognition-A review,” Pattern Recognition, vol.23, no. 7, pp. 671-683, 1990.[4]R. Plamondon and S. N. Srihari,“On-line and Off-line handwritten character recognition: Acomprehensive survey,” IEEE Transactions oPattern Analysis and Machine Intelligence, vol. 22,no. 1, pp. 63-84, 2000.[5]N. Arica and F. Yarman-Vural,”An Overview ofCharacter Recognition Focused on Off-lineHandwriting”,IEEE Transactions on Systems, Man,and Cybernetics, Part C: Applications and Reviews, 2001, 31(2), pp. 216-233.[6]U. Bhattacharya, and B. B.Chaudhuri,”Handwritten numeral databases ofIndian scripts and multistage recognition of mixednumerals,”IEEE Transaction on Pattern analysisand machine intelligence, vol. 31, no. 3, pp. 444-457, 2009.[7]U. Pal, T. Wakabayashi and F.Kimura,”Handwritten numeral recognition of sixpopular scripts,” Ninth International conference onDocument Analysis and Recognition ICDAR 07,vol. 2, pp. 749-753,2007.[8]R. G. Casey and E. Lecolinet,”A Survey ofMethods and Strategies in CharacterSegm entation,” IEEE Transactions on PatternAnalysis and Machine Intelligance, vol. 18, no. 7,pp. 690-706, july 1996.[9]Anil K. Jain and Torfinn Taxt,”Feature extractionmethods for character recognition-A Survey,”Pattern Recognition, vol. 29, no. 4, pp. 641-662,1996.[10]R. G. Casey and E. Lecolinet,”A Survey ofMethods[11]C. L. Liu, H. Fujisawa,”Classification and learningfor character recognition: Comparsion of methodsand remaining problems,” International Workshopon Neural Networks and Learning in DocumentAnalysis and Recognition, Seoul, 2005.[12]F. Bortolozzi, A. S. Brito, Luiz S. Oliveira and M.Morita,”Recent advances in handwrittenrecognition,” Document Analysis, Umapada Pal,Swapan K. Parui, Bidyut B. Chaudhuri, pp. 1-13. [13]Rafael C. Gonzalez, Richard E. woods and StevenL. Eddins, Digital Image Processing usingMATLAB, Pearson Education, Dorling Kindersley,South Asia, 2004.[14]S. V. Rajashekararadhya, and P. Vanajaranjan,”Efiiciency zone based feature extraction algorithmfor handwritten numeral recognition of fourpopular south-Indian scripts,” Journal ofTheoretical and Applied Information Technology,JATIT, vol. 4, no. 12, pp. 1171-1181,2008.Ved Prakash Agnihotri:VedPrakash Agnihotri a sciencegraduate from HPU, Shimla. He hasdone MCA from Punjabi University,Patiala in 2009. He is currently aresearch scholar of LPU, Phagwara.His interests are in MachineLearning, Pattern Recognition and Artificial Intelligence areas.。
Lecture 41.Linguistic characteristics of titles1.1 Titles should⏹Describe contents clearly and precisely, so that readers candecide whether to read the report⏹Provide key words for indexing⏹ABC principle: accuracy, brevity, clarity1.2 Titles should not⏹Include waste words such as "studies on," "an investigation of",“a Preliminary Study/Discussion on”, etc.⏹Use abbreviations and jargon/只有那些全称较长,缩写后已得到科技界公认,且在读者群中非常熟悉的,才可以使用。
如:LASER,DNA,AIDS,CT等等。
⏹Use "cute" language1.3 Length: disciplinary matter/题名不宜过长,国外科技期刊一般要求在10个词以内,不宜超过15个字。
如英国数学学会期刊要求每个题名不超过2个词,美国医学会规定题名不超过两行,每行不超过42个字符和空格。
1.4. Capitalization: all first words are capitalized; all words immediately following a colon arecapitalized; all other words are capitalized except for articles and prepositions (Agree or disagree?)1.5 目前世界上各大检索机构在题名上各有自己特有的要求,因机构不同而有所差异。
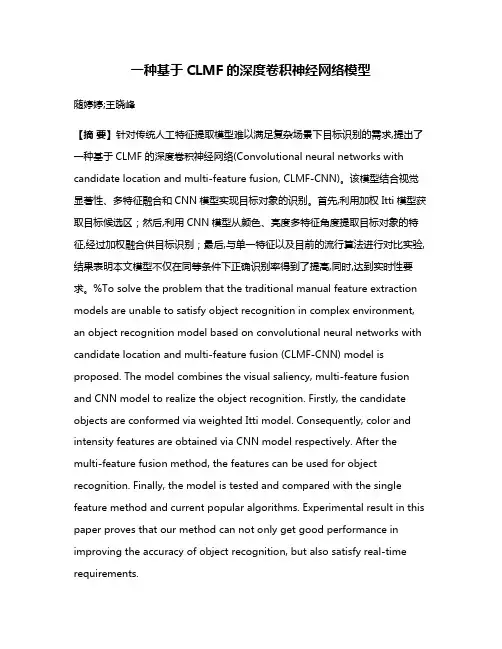
一种基于CLMF的深度卷积神经网络模型随婷婷;王晓峰【摘要】针对传统人工特征提取模型难以满足复杂场景下目标识别的需求,提出了一种基于CLMF 的深度卷积神经网络(Convolutional neural networks with candidate location and multi-feature fusion, CLMF-CNN)。
该模型结合视觉显著性、多特征融合和CNN模型实现目标对象的识别。
首先,利用加权Itti模型获取目标候选区;然后,利用CNN模型从颜色、亮度多特征角度提取目标对象的特征,经过加权融合供目标识别;最后,与单一特征以及目前的流行算法进行对比实验,结果表明本文模型不仅在同等条件下正确识别率得到了提高,同时,达到实时性要求。
%To solve the problem that the traditional manual feature extraction models are unable to satisfy object recognition in complex environment, an object recognition model based on convolutional neural networks with candidate location and multi-feature fusion (CLMF-CNN) model is proposed. The model combines the visual saliency, multi-feature fusion and CNN model to realize the object recognition. Firstly, the candidate objects are conformed via weighted Itti model. Consequently, color and intensity features are obtained via CNN model respectively. After the multi-feature fusion method, the features can be used for object recognition. Finally, the model is tested and compared with the single feature method and current popular algorithms. Experimental result in this paper proves that our method can not only get good performance in improving the accuracy of object recognition, but also satisfy real-time requirements.【期刊名称】《自动化学报》【年(卷),期】2016(042)006【总页数】8页(P875-882)【关键词】图像识别;深度学习;卷积神经网络;多特征融合【作者】随婷婷;王晓峰【作者单位】上海海事大学信息工程学院上海 201306;上海海事大学信息工程学院上海 201306【正文语种】中文引用格式随婷婷,王晓峰.一种基于CLMF的深度卷积神经网络模型.自动化学报,2016,42(6):875-882随着科学技术的飞速发展,图像识别技术已从简单的理论融入到了大众的日常生活之中[1-2].从手机、电脑、打卡机等使用指纹身份识别,到阿里巴巴发布的人脸识别支付技术,都离不开图像识别.然而,在这个信息量爆炸的时代,如何能够提高识别率意义重大,直接关系到图像识别的实用性和安全性.幸运的是,深度学习的出现解决了如何自动学习出“优质特征”的问题[2-3].它通过模仿人脑分析学习的机制,将分级信息处理过程引用到了特征表示上,通过逐层特征变换,将样本在原空间的特征表示变换到一个新特征空间,从而使分类识别更加容易.相比于人工构造特征的方法,利用深度学习方法来学习特征,能够更为丰富地刻画数据的内在信息[4].深度卷积神经网络(Convolutional neural networks,CNN)作为深度学习的常用模型,已成为众多科研领域的研究热点之一.受到Hubel-Wiesel生物视觉模型的启发,LeCun等于1989年首先提出了CNN模型,解决了小规模的图像识别问题[5-6].但对于大规模的图像无法得到较好的效果.直至2012年,Krizhevsky等在传统的CNN模型上提出了深度的理念,取得了不错的识别结果,推进了图像识别技术[7].与传统识别算法相比,它的输入不使用任何的人工特征,避免了复杂繁琐的手动特征提取过程,可实现自动特征学习,在处理大规模的图像识别时同样具有优势.目前,CNN模型被广泛应用于图像识别领域之中[4,7-9].Ji等通过延伸数据的空间维度,提出一种3D CNNs模型[10],用于人体运动行为的识别之中,取得了不错的识别效果.2013年,徐姗姗等[11]利用CNN模型对木材的缺陷进行识别,降低时间消耗的同时,获得了较高的缺陷识别精度.2014年,贾世杰等将CNN模型用于商品图像分类中[12],为电子商务软件提供了一种快捷、高效的分类过滤手段.这无不说明CNN模型在图像识别方面的优势,即高效特征抽取、权值共享、模型复杂度低的特点.故本文采用CNN模型作为图像特征提取的基础模型.然而,在目标识别的初期阶段需要对目标对象进行定位(Candidate location,CL),这是CNN模型所忽略的.近年来,神经科学方面的研究者发现,人类视觉系统具有快速定位兴趣目标的能力[13].显然,将这种能力引入CNN模型,无疑将提升目标识别的效率.目前,最具代表的是Itti模型[14-15],它能模拟视觉注意机制,利用颜色、亮度和朝向特征获取感兴趣区.故采用Itti模型实现CL阶段. 同时,CNN模型常采用灰度图像作为图像的输入,缺失了对于颜色、亮度特征的理解.而颜色特征对于图像的旋转、尺度变换和平移具有不错的稳定性[16].亮度是人类视觉系统较为敏感的图像特征.若融合颜色、亮度特征,能够更为完善地表达图像.因此,采用多特征融合的方法来表示图像具有一定的必要性.综上所述,为了能够使CNN模型更为快捷地实现CL阶段的目标定位,多特征信息的互补,本文以CNN模型为基础模型,添加Itti模型以及多特征融合思想,建立一种基于CLMF的深度卷积神经网络模型(Convolutional neural networks with candidate location and multi-feature fusion,CLMFCNN),以便快速地获取目标区域,提高目标识别效率和准确度.深度卷积神经网络是第一个成功训练多层神经网络的学习算法.由于该网络有效地避免了复杂的图像预处理,可以自主学习图像特征,所以得到了广泛的应用.CNN 模型通过对局部感受野卷积(Local connections)、权值共享、下采样和多网络层[17],实现NN(Neural network)结构的优化,不但减少了神经元和权值的个数.同时,利用池化操作(Pooling)使特征具有位移、缩放和扭曲不变性[17].典型的深度卷积网络结构如图1所示.第一层为图像输入层,然后由多个卷积层(Convolution,C层)和下采样层(Subsampling,S层)组成,最后一层为全连接层.1.1 C层的学习C层主要是利用卷积核抽取特征,实现对特征进行过滤和强化的效果.在每个卷积层中,将前一层输出的特征图与卷积核进行卷积操作[18],然后通过激活函数,即可输出该层的特征图,如式(1)所示.其中,f是激活函数,本文选用Sigmoid函数.t表示层数,ki,j是卷积核,∗表示2D卷积操作,bj是偏置,Pj表示所选择的输入特征图的集合.1.2 S层的学习S层主要通过下采样减少C层的特征维数,对S层中每个大小为n×n的池进行“池平均”或“池最大”操作[19],以获取抽样特征,如式(2)所示.其中,w为权重,down(·)为下采样函数,本文采用“池最大”操作.通过池化操作,不仅有效降低了C层的复杂度,抑制了过拟合现象,同时,提升了特征对微小畸变、旋转的容忍能力,增强了算法的性能和鲁棒性.为了使CNN模型能够在图像中快速搜索到目标对象,模仿人脑视觉系统,在CL阶段添加视觉注意模型,旨在快速获取目标对象.同时,从特征融合的角度,实现图像颜色、亮度的多特征表达.CLMFCNN的模型结构图如图2所示,由候选目标区获取和多特征融合两模块组成.2.1 基于视觉显著性的候选目标获取大量研究发现,人类的视觉系统能够快速搜索到兴趣目标,并进入视觉感知[20-21].受其启发,若在目标识别的CL阶段采用视觉显著性获取候选目标,能够有效地降低背景所带来的干扰.目前最具代表性的是Itti等于1998年提出的选择注意模型,该模型经过不断的改进,已经可以较好地应用于目标识别之中.其基本思想是采用自底向上的模式,通过构建不同尺度的高斯金字塔,并利用式(3)~式(5)获取亮度、颜色、朝向特征[15];然后,计算中央周边算子得到特征显著图;最后,通过归一化组合得到显著图,从而模拟人类视觉系统选择出显著区域. 其中,r、g、b为三个颜色分量.R=r-(g+b)/2;G=g-(r+g)/2;Y=(r+g)/2-|r-g|/2-b;c、s代表金字塔中央尺度和周边尺度.θ为Gabor滤波器的方向;⊖代表“中央—周边”算子.然而,Itti模型仅采用自底向上的机制,缺失了高级认知的指导[14-15].特别地,由其获取的显著图仅由各类特征叠加而成的,这违背了视觉系统的选择机制.在不同的环境下,视觉系统搜索不同目标时,对于各个特征的倚重应有所不同.故综合考虑各类特征对于目标定位的贡献度,赋予权重,通过特征与权重的乘积和确定显著区,如式(6)所示.其中,βj为显著特征权重,由式(7)获得.Sali代表显著值,SaliCo为颜色显著值、SaliIn为亮度显著值、SaliOr为朝向显著值,k代表不同的尺度.目前,对于显著区域的提取多由目标知识驱动,忽略了背景特征对于目标检测的抑制作用.而神经物理学实验表明,背景特征对于目标检测也具有重要意义[22].因此综合考虑目标和背景的概率知识,利用式(7)确定显著特征权重βr.其中,βr表示显著特征权重,P(O)表示目标O出现的先验概率;P(O|Fsalir)表示给定前景区的某一图像度量Fsalir时,目标O出现的条件概率;P(O|Bsalir)表示给定背景区某一图像度量Bsalir时,目标O出现的条件概率;图像度量包括颜色特征值SaliCo、亮度特征值SaliIn和朝向特征值SaliOr.2.2 多特征融合由于CNN模型在特征提取过程中使用的特征单一,忽略了颜色、亮度特征的影响,如图1所示.故本文在深度卷积神经网络的基础上,添加颜色、亮度特征提取的思想,使用B-Y颜色通道、R-G颜色通道以及亮度通道三通道对视觉图像进行特征提取.其中,B-Y和R-G颜色通道的图像表示可由式(8)和(9)获得.因此,CLMF-CNN模型不仅考虑了亮度特征,同时考虑了对象的颜色特征,使得特征向量更能表现目标对象的特性.然而,多特征的融合方法对于特征的表达能力具有一定的影响.目前,常用的多特征融合方法有简单叠加、串行连接等.但这些方法不仅较难体现各种特征的差异性,反而扩大了特征的维数,增加了计算量.因此,引出权重的概念,根据不同的特征在识别过程中的贡献度,在CNN的全连接层后添加一层各类特征的权重计算层.通常,特征的识别效果采用误差率表示,误差率越低则表示该类特征具有较强的区分能力.受此启发,从误差率的角度定义权重,如式(10)所示.其中,wn为特征n的权重,0 ≤wn ≤1且en表示特征n的误差率.由此可以发现,en越低的特征将获得越高的权重.因此,每个目标融合后的特征向量可表示为式(11).其中,N为特征类别数,表示特征n相应的特征向量.2.3 算法流程CLMF-CNN模型由学习阶段以及目标识别阶段两部分组成.具体步骤如下:1)学习阶段:步骤 1.根据学习样本,采用样本统计分析法计算样本图像内目标对象与背景的条件概率P(O|Fsalir)和P(O|Bsalir);步骤2.根据式(7)确定Itti模型内的权重βj;步骤3.利用CNN模型获取目标对象在B-Y颜色通道、R-G颜色通道以及亮度通道三通道的特征向量;步骤4.训练不同特征向量,获取各类特征的误差率en;步骤5.根据误差率en,利用式(10)获取不同特征的权重.2)目标识别阶段:步骤1.根据权重βj,利用加权Itti模型获取测试图像相应的候选目标区域;步骤2.利用CNN模型对候选目标进行B-Y颜色通道、R-G颜色通道以及亮度通道三通道的特征提取;步骤 3.根据式(11),结合不同特征的权重wn进行加权融合,形成候选目标的特征表达;步骤4.对候选目标进行识别,输出测试图像的类别.仿真实验平台配置为酷睿四核处理器2.8GHz,8GB内存,使用Caltech 101数据集,该数据库包含101类,每类大约包含40到800张彩色图片.然而,CNN模型需要建立在大量样本的基础上,故选取其中样本量较大的8类:飞机(Airplanes)、人脸(Faces)、钢琴(Piano)、帆船(Ketch)、摩托车(Motor)、手枪(Revolver)、手表(Watch)以及豹(Leopards),并利用Google对图库进行扩充,每种类别选用2000幅图像,本文方法的参数设置如表1所示,其中,学习率初始值设为0.1,并在迭代过程中线性下降以寻找最优值.同时,为了评估识别效果,采用十折交叉实验法进行验证,并利用识别精度作为评价标准,如式(12)所示.其中,PreV ali表示第i类图像的识别精度,PTi表示正确识别的样本数,FTi表示错误识别的样本数.3.1 CL阶段提取候选目标的作用由图3可以发现,利用改进的Itti模型可以有效地在CL阶段提取目标候选区,避免了背景的干扰,便于后续CLMF-CNN模型的特征提取.实验结果表明,平均每幅图像的处理时间约为62.76ms.显然,在目标候选区的提取上消耗了一定的计算时间,但是,相应地减少了30%~50%的伪目标区域,降低了识别干扰,反而提高了识别效率.从图4可以发现,利用Itti模型改进的CNN模型的确提升了目标的识别精度.为了进一步分析CL阶段目标定位的有效性,选用覆盖率(Overlap value,OV)评价目标对象区界定的成功率,如式(13)所示.其中,preboxij是图像i对应的第j个候选目标区域. objboxi是图像i对应的目标区域.由图5可以发现,由于文献[23]利用固定窗口遍历搜索的方法,所以对于脸、钢琴、手枪的定位效果较好.然而,对于飞机、帆船、豹等大小多变的目标对象,界定的效果产生了一定的影响.相反,本文方法充分考虑了各项特征的贡献率,能够较好地定位目标对象的区域,为后期的目标识别提供了一定的保证.3.2 识别时间消耗对比时间消耗无疑是对目标识别效果的一个重要评价指标.图6从目标识别所需时耗的角度对比了文献[23]方法和CLMF-CNN模型.由于文献[23]方法需要以固定大小的窗口遍历图像来实现目标的定位,因此定位的时耗十分受滑动窗口大小以及图像大小的限制.若以30×30的窗口遍历一幅N×N的图像时,文献[23]方法在定位时将进行(N-29)2个操作.若图像为256×256,则单幅图像在定位时的操作将超过5万次,无疑增加了图像识别过程中的时间消耗.相反,由于CLMF-CNN模型采用视觉显著性定位的方法,虽然在对单幅图像搜索目标时需要消耗时间用于定位显著区域,但可以快速滤除图像中的伪目标区域,大幅度地减少后期识别操作,反而降低了目标识别的时间消耗,十分有利于图像的快速识别.3.3 特征融合的作用在特征提取阶段,采用了多特征融合方法,利用各类特征的贡献度来分配权重.为了验证权重的作用,实验将本文的多特征融合方法与各类单一特征方法以及目前流行的多特征乘性融合方法[24]、多特征加性融合方法[25]进行对比.从图7可以发现,采用单一特征的CNN模型识别效果明显不佳,且不稳定,易受光照等外界因素的干扰.说明需要通过特征融合,使各类特征取长补短,才能实现更好的识别效果.文献[24]方法,可实现各类特征的融合,但该方法易放大噪声的影响,导致融合结果对噪声较为敏感.相反,文献[25]在一定程度能够抑制噪声,说明加性融合的确能较好地融合各类特征.然而其识别效果仍不理想,说明权重的分配对融合后特征向量的识别效果具有一定的影响.本文的方法具有较好的识别结果,原因在于:CLMF-CNN模型充分考虑了各项特征对于识别效果的贡献度,从误差率的角度分配各项权重,降低了对于噪声的敏感度,且提升了识别效果,增强了识别方法的鲁棒性.3.4 识别效果对比为了验证本文方法的有效性,实验将CLMFCNN模型和文献[26-28]的方法进行对比,如图8所示.其中,对于人脸、摩托车和手表这些目标对象,CLMF-CNN 模型具有一定的优势.原因在于,这些目标较为显著,对于CLMF-CNN模型更易找到目标对象区域.而对于文献[26-28]方法,由于过多的依赖固定窗口滑动搜索的方法,导致对目标区域的定位有一定的偏差.同时,本文的多特征融合方法能够充分地考虑各类特征的贡献度,合理地分配权重,使得各类特征扬长避短,更有效地表达目标对象.由图8可以发现,CLMF-CNN模型的识别效果基本优于其他方法,为目标识别提供了一种较为有效的方法.同时,为了进一步验证本文方法的识别效果,实验将CLMF-CNN模型运用于图像标注中.从表2可以发现,本文方法基本可以标注出预先学习的目标对象,说明CLMF-CNN模型可以较好地解决图像的自动标注问题.本文提出一种基于CLMF的卷积神经网络模型,并用于图像识别,取得了较为满意的实验结果.与现有方法相比,CLMF-CNN具有以下几个突出的特点:1)模仿人脑视觉认知的过程添加了CL阶段的候选目标区选取模块,确立了目标对象区,减少了由于伪目标区域所造成的计算时间消耗和识别干扰.2)利用多特征的加权融合降低了由单一特征不充分所引起的歧义,丰富了图像的特征表达.然而,图像质量对于目标识别具有一定影响.下一步工作的重点将从图像融合技术文献[29-30]的角度提高图像质量,进一步改善目标识别效果.1 Sarikaya R,Hinton G E,Deoras A.Application of deep belief networks for natural language understanding.IEEE/ACM Transactions on Audio,Speech,&Language Processing,2014,22(4):778-7842 Graves A,Mohamed A R,Hinton G.Speech recognition with deep recurrent neural networks.In:Proceedings of the 38th IEEE International Conference on Acoustics,Speech and Signal Processing.Vancouver,BC:IEEE,2013. 6645-66493 Liu Jian-Wei,Liu Yuan,Luo Xiong-Lin.Research and development on deep learning.Application Research of Computers,2014,31(7):1921-1930(刘建伟,刘媛,罗雄麟.深度学习研究进展.计算机应用研究,2014,31(7):1921-1930)4 Najafabadi M M,Villanustre F,Khoshgoftaar T M,Seliya N,Wald R,Muharemagic E.Deep learning applications and challenges in big dataanalytics.Journal of Big Data,2015,2:15 LeCun Y,Bottou L,Bengio Y,Haffner P.Gradient-based learning applied to document recognition.Proceedings of the IEEE,1998,86(11):2278-23246 LeCun Y,Boser B,Denker J S,Henderson D,Howard R E,Hubbard W,Jackel L D.Backpropagation applied to handwritten zip code recognition.Neural Computation,1989,1(4):541-5517 Krizhevsky A,Sutskever I,Hinton G E.ImageNet classification with deep convolutional neural networks.In:Proceedings of the Advances in Neural Information Processing Systems ke Tahoe,Nevada,USA:Curran Associates,Inc.,2012.2012-20208 Wang Xin,Tang Jun,Wang Nian.Gait recognition based on double-layer convolutional neural networks.Journal of Anhui University(Natural Science Edition),2015,39(1):32-36(王欣,唐俊,王年.基于双层卷积神经网络的步态识别算法.安徽大学学报(自然科学版),2015,39(1):32-36)9 Ouyang W,Wang X.Joint deep learning for pedestrian detection.In:Proceedings of the 2013 IEEE International Conference on Computer Vision.Sydney,Australia:IEEE,2013.2056-206310 Ji S W,Xu W,Yang M,Yu K.3D convolutional neural networks for human action recognition.IEEE Transactions on Pattern Analysis and Machine Intelligence,2013,35(1):221-23111 Xu Shan-Shan,Liu Ying-An,Xu Sheng.Wood defects recognition based on the convolutional neural network.Journal of Shandong University(Engineering Science),2013,43(2):23-28(徐姗姗,刘应安,徐昇.基于卷积神经网络的木材缺陷识别.山东大学学报(工学版),2013,43(2):23-28)12 Jia Shi-Jie,Yang Dong-Po,Liu Jin-Huan.Product image fine-grained classification based on convolutional neural network.Journal of Shandong University of Science and Technology(Natural Science),2014,33(6):91-96(贾世杰,杨东坡,刘金环.基于卷积神经网络的商品图像精细分类.山东科技大学学报(自然科学版),2014,33(6):91-96)13 Unuma H,Hasegawa H.Visual attention and object perception:levelsof visual features and perceptual representation. Journal of Kawamura Gakuen Womans University,2007,18:47-6014 Serre T,Wolf L,Poggio T.Object recognition with features inspired by visual cortex.In:Proceedings of the 2005 IEEE Computer Society Conference on Computer Vision and Pattern Recognition(CVPR).San Diego,CA:IEEE,2005.994-100015 Itti L,Koch C,Niebur E.A model of saliency-based visual attention for rapid scene analysis.IEEE Transactions on Pattern Analysis&Machine Intelligence,1998,20(11):1254-125916 Yao Yuan-Qing,Li Feng,Zhou Shu-Ren.Target tracking based on color and the texture puter Engineering&Science,2014,36(8):1581-1587(姚原青,李峰,周书仁.基于颜色–纹理特征的目标跟踪.计算机工程与科学,2014,36(8):1581-1587)17 LeCun Y,Bengio Y,Hinton G.Deep learning.Nature,2015,521(7553):436-4418 Huang F J,LeCun rge-scale learning with SVM and convolutional for generic object categorization.In:Proceedings of the 2006 IEEE Computer Society Conference on Computer Vision&Pattern Recognition.New York,USA:IEEE,2006.284-29119 Scherer D,M¨uller A,Behnke S.Evaluation of pooling operations in convolutional architectures for object recognition. In:Proceedings of the 20th International Conference on Artificial Neural Networks.Thessaloniki,Greece:Springer,2010.92-10120 Serences J T,Yantis S.Selective visual attention and perceptual coherence.Trends in Cognitive Sciences,2006,10(1):38-4521 Li Wan-Yi,Wang Peng,Qiao Hong.A survey of visual attention based methods for object tracking.Acta Automatica Siinica,2014,40(4):561-576(黎万义,王鹏,乔红.引入视觉注意机制的目标跟踪方法综述.自动化学报,2014,40(4):561-576)22 Maljkovic V,Nakayama K.Priming of pop-out:I.role offeatures.Memory&Cognition,1994,22(6):657-67223 Roos M J,Wolmetz M,Chevillet M A.A hierarchical model of vision (HMAX)can also recognize speech.BMC Neuroscience,2014,15(Suppl 1):18724 Li P H,Chaumette F.Image cues fusion for object tracking based on particle filter.In:Proceedings of the 3rd International Workshop on Articulated Motion and Deformable Objects.Palma de Mallorca,Spain:Springer,2004.99-11025 Wang X,Tang Z M.Modified particle filter-based infrared pedestriantracking.Infrared Physics&Technology,2010,53(4):280-28726 Zhu Qing-Sheng,Zhang Min,Liu Feng.Hierarchical citrus canker recognition based on HMAX puter Science,2008,35(4):231-232(朱庆生,张敏,柳锋.基于HMAX特征的层次式柑桔溃疡病识别方法.计算机科学,2008,35(4):231-232)27 Tang Yu-Jing.Classification and Recognition Research based on Human Visual Perception Mechanism[Master dissertation],Nanjing University of Science and Technology,China,2009.(汤毓婧.基于人脑视觉感知机理的分类与识别研究[硕士学位论文],南京理工大学,中国,2009.)28 Wang J,Yang J,Yu K,Lv F,Huang T,Gong Y.Localityconstrained linear coding for image classification.In:Proceedings of the 2010 IEEE Conference on Computer Vision and Pattern Recognition(CVPR).San Francisco,CA:IEEE,2010.3360-336729 Zhang Xiao-Li,Li Xiong-Fei,Li Jun.Validation and correlation analysis of metrics for evaluating performance of image fusion.Acta Automatica Sinica,2014,40(2):306-315(张小利,李雄飞,李军.融合图像质量评价指标的相关性分析及性能评估.自动化学报,2014,40(2):306-315)30 Yang Bo,Jing Zhong-Liang.Image fusion algorithm based on the quincunx-sampled discrete wavelet frame.Acta Automatica Sinica,2010,36(1):12-22(杨波,敬忠良.梅花形采样离散小波框架图像融合算法.自动化学报,2010,36(1):12-22)随婷婷上海海事大学信息工程学院博士研究生.2013年获得上海海事大学信息工程学院硕士学位.主要研究方向为深度学习,人工智能,数据挖掘与知识发现.本文通信作者.E-mail:****************(SUI Ting-Ting Ph.D.candidate at the College of Information Engineering,Shanghai Maritime University.She received her master degree from the College of Information Engineering,Shanghai Maritime University in 2013.Her research interest covers deep learning,artificial intelligence,data mining and knowledge discovery.Corresponding author of this paper.)王晓峰上海海事大学教授,博士.主要研究方向为深度学习,人工智能,数据挖掘与知识发现.E-mail:****************.cn(WANG Xiao-Feng Ph.D.,professor at Shanghai Maritime University.His research interest covers deep learning,artificial intelligence,data mining and knowledge discovery.)。
1、随机初始化训练SSD目标检测ScratchDetExploring to Train Single-Shot Object Detectors from Scratch.pdf使用ImageNet 预训练的网络模型能够帮助目标任务(物体检测、语义分割、细粒度识别等)快速收敛,然而使用预训练模型会带来诸多限制,其中一个问题就是改动特征提取网络的结构成本相对较高,需要耗时巨大的重新预训练来适应不同需求的任务。
那么,如果不使用预训练模型,进行随机初始化训练,达到较高准确率的某些必要条件是什么?本文介绍了我们今年的CVPR Oral 工作《ScratchDet: Exploring to Train Single-Shot Object Detectors from Scratch》,作者从优化的角度出发,通过实验解释了梯度稳定手段之一的BatchNorm 是如何帮助随机初始化训练一阶段检测器SSD,进而结合了ResNet 与VGGNet 来加强对小物体的检测。
文章的代码后续会公布到https:///KimSoybean/ScratchDet,并且contribute 到mmdetection 中。
2、离线语音识别Streaming End-to-end Speech Recognition For Mobile Devices摘要:根据给定输入语音直接预测输出字符序列的端到端(E2E)模型对移动端语音识别来说是不错的选择。
但部署E2E 模型的挑战也不少:为了应用到实际中,此类模型必须对语音进行流式的实时解码;它们必须稳健地支持长尾使用案例;它们必须能够利用用户特定的上下文(如联系人列表);此外,它们必须要非常准确。
在本文中,我们用循环神经网络转换器(RNN transducer)构建了E2E 语音识别器。
经过试验评估,我们发现在很多评估项目中,该方法在延迟和准确率方面远超基于CTC 的传统模型。
3、手势估计Hand Pose Estimation: A Survey摘要:深度卷积神经网络(CNNs)近年来在几乎所有计算机视觉任务中的成功,以及低成本消费者深度相机的普及,使得手势估计成为计算机视觉领域的一个热门话题。
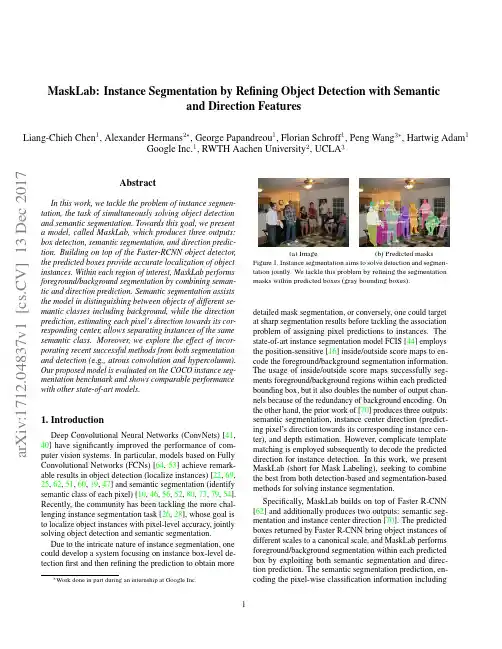
MaskLab:Instance Segmentation by Refining Object Detection with Semanticand Direction FeaturesLiang-Chieh Chen 1,Alexander Hermans 2∗,George Papandreou 1,Florian Schroff 1,Peng Wang 3∗,Hartwig Adam 1Google Inc.1,RWTH Aachen University 2,UCLA 3AbstractIn this work,we tackle the problem of instance segmen-tation,the task of simultaneously solving object detection and semantic segmentation.Towards this goal,we present a model,called MaskLab,which produces three outputs:box detection,semantic segmentation,and direction predic-tion.Building on top of the Faster-RCNN object detector,the predicted boxes provide accurate localization of object instances.Within each region of interest,MaskLab performs foreground/background segmentation by combining seman-tic and direction prediction.Semantic segmentation assists the model in distinguishing between objects of different se-mantic classes including background,while the direction prediction,estimating each pixel’s direction towards its cor-responding center,allows separating instances of the same semantic class.Moreover,we explore the effect of incor-porating recent successful methods from both segmentation and detection (e.g .,atrous convolution and hypercolumn).Our proposed model is evaluated on the COCO instance seg-mentation benchmark and shows comparable performance with other state-of-art models.1.IntroductionDeep Convolutional Neural Networks (ConvNets)[41,40]have significantly improved the performance of com-puter vision systems.In particular,models based on Fully Convolutional Networks (FCNs)[64,53]achieve remark-able results in object detection (localize instances)[22,69,25,62,51,60,19,47]and semantic segmentation (identify semantic class of each pixel)[10,46,56,52,80,73,79,54].Recently,the community has been tackling the more chal-lenging instance segmentation task [26,28],whose goal is to localize object instances with pixel-level accuracy,jointly solving object detection and semantic segmentation.Due to the intricate nature of instance segmentation,one could develop a system focusing on instance box-level de-tection first and then refining the prediction to obtain more∗Workdone in part during an internship at GoogleInc.(a)Image (b)Predicted masksFigure 1.Instance segmentation aims to solve detection and segmen-tation jointly.We tackle this problem by refining the segmentation masks within predicted boxes (gray bounding boxes).detailed mask segmentation,or conversely,one could target at sharp segmentation results before tackling the association problem of assigning pixel predictions to instances.The state-of-art instance segmentation model FCIS [44]employs the position-sensitive [16]inside/outside score maps to en-code the foreground/background segmentation information.The usage of inside/outside score maps successfully seg-ments foreground/background regions within each predicted bounding box,but it also doubles the number of output chan-nels because of the redundancy of background encoding.On the other hand,the prior work of [70]produces three outputs:semantic segmentation,instance center direction (predict-ing pixel’s direction towards its corresponding instance cen-ter),and depth estimation.However,complicate template matching is employed subsequently to decode the predicted direction for instance detection.In this work,we present MaskLab (short for Mask Labeling),seeking to combine the best from both detection-based and segmentation-based methods for solving instance segmentation.Specifically,MaskLab builds on top of Faster R-CNN [62]and additionally produces two outputs:semantic seg-mentation and instance center direction [70].The predicted boxes returned by Faster R-CNN bring object instances of different scales to a canonical scale,and MaskLab performs foreground/background segmentation within each predicted box by exploiting both semantic segmentation and direc-tion prediction.The semantic segmentation prediction,en-coding the pixel-wise classification information including 1a r X i v :1712.04837v 1 [c s .C V ] 13 D e c 2017Crop logits fromthe channel ofpredicted classDirection Poolingwithin each boxFigure2.MaskLab generates three outputs,including refined box predictions(from Faster-RCNN),semantic segmentation logits(logits for pixel-wise classification),and direction prediction logits(logits for predicting each pixel’s direction toward its corresponding instance center).For each region of interest,we perform foreground/background segmentation by exploiting semantic segmentation and direction logits.Specifically,for the semantic segmentation logits,we pick the channel based on the predicted box label and crop the regions according to the predicted box.For the direction prediction logits,we perform the direction pooling to assemble the regional logits from each channel. These two cropped features are concatenated and passed through another1×1convolution for foreground/background segmentation. background class,is adopted to distinguish between objectsof different semantic classes(e.g.,person and background),and thus removes the duplicate background encoding in[44].Additionally,direction prediction is used to separate objectinstances of the same semantic label.Our model employs thesame assembling operation in[16,44]to collect the direc-tion information and thus gets rid of the complicate templatematching used in[70].Furthermore,motivated by the recentadvances in both segmentation and detection,MaskLab fur-ther incorporates atrous convolution[11]to extract denserfeatures maps,hypercolumn features[29]for refining masksegmentation[21],multi-grid[71,20,12]for capturing dif-ferent scales of context,and a new TensorFlow operation[1],deformable crop and resize,inspired by the deformablepooling operation[20].We demonstrate the effectiveness of the proposed modelon the challenging COCO instance segmentation benchmark[48].Our proposed model,MaskLab,shows comparableperformance with other state-of-art models in terms of bothmask segmentation(e.g.,FCIS[44]and Mask R-CNN[31])and box detection(e.g.,G-RMI[35]and TDM[66]).Finally,we elaborate on the implementation details and provide de-tailed ablation studies of the proposed model.2.Related WorkIn this work,we categorize current instance segmenta-tion methods based on deep neural networks into two types,depending on how the method approaches the problem bystarting from either detection or segmentation modules.Detection-based methods:This type of methods ex-ploits state-of-art detection models(e.g.,Fast-RCNN[25],Faster-RCNN[62]or R-FCN[19])to either classify maskregions or refine the predicted boxes to obtain masks.Therehave been several methods developed for mask proposals,including CPMC[9],MCG[3],DeepMask[58],SharpMask[59],and instance-sensitive FCNs[16].Recently,Zhang andHe[76]propose a free-form deformation network to refinethe mask proposals.Coupled with the mask proposals,SDS[28,14]and CFM[17]incorporate mask-region features toimprove the classification accuracy,while[29]exploit hyper-column features(i.e.,features from the intermediate layers).Li et al.[43]iteratively apply the prediction.Zagoruyko etal.[75]exploit object context at multiple scales.The work ofMNC[18]shows promising results by decomposing instancesegmentation into three sub-problems including box local-ization,mask refinement and instance classification.Hayeret al.[30]improve MNC by recovering the mask boundaryerror resulted from box prediction.Arnab et al.[4,5]applyhigher-order Conditional Random Fields(CRFs)to refinethe mask results.FCIS[44],thefirst Fully ConvolutionalNetwork(FCN)[53]for instance segmentation,enriches theposition-sensitive score maps from[16]by further consider-ing inside/outside score maps.Mask-RCNN[31],built ontop of FPN[47],adds another branch to obtain refined maskresults from Faster-RCNN box prediction and demonstratesoutstanding performance.Segmentation-based methods:This type of methodsgenerally adopt a two-stage processing,including segmen-tation and clustering.Pixel-level predictions are obtainedby the segmentation module before the clustering processis applied to group them together for each object instance.Semantic SegmentationLogitsDirection Logits and Direction PoolingFigure 3.Semantic segmentation logits and direction prediction logits are used to perform foreground/background segmentation within each predicted box.In particular,segmentation logits are able to distinguish between instances of different semantic classes (e.g .,person and background),while direction logits (directions are color-coded)further separate instances of the same semantic class (e.g .,two persons in the predicted blue box).In the assembling operation,regional logits (the color triangular regions)are copied from each direction channel,similar to [16,44].For example,the region specified by the red triangle copies the logits from the red direction channel encoding instance direction from 0degree to 45degree.Note the weak activations in the pink channel encoding instance direction from 180degree to 225degree.Proposal-free network [45]applies spectral clustering to group segmentation results from DeepLab [10],while Zhang et al .[78]exploit depth ordering within an image patch.In addition to semantic and depth information,Uhrig et al .[70]further train an FCN to predict instance center direc-tion.Zhang et al .[77]propose a novel fully connected CRF [39](with fast inference by permutohedral lattice [2])to refine the results.Liu et al .[50]segment objects in multi-scale patches and aggregate the results.Levinkov et al .[42]propose efficient local search algorithms for instance seg-mentation.Wu et al .[72]exploit a localization network for grouping,while Bai and Urtasun [6]adopt a Watershed Transform Net.Furthermore,Liu et al .[49]propose to sequentially solve the grouping problem and gradually com-pose object instances.[38,36]exploit boundary detection information,while [55,23,8]propose to cluster instances w.r.t.the learned embedding values.In addition to the two categories,there is other interest-ing work.For example,[63,61]propose recurrent neural networks to sequentially segment an instance at a time.[37]propose a weakly supervised instance segmentation model given only bounding box annotations.Our proposed MaskLab model combines the advantages from both detection-based and segmentation-based meth-ods.In particular,MaskLab builds on top of Faster-RCNN [62]and additionally incorporates semantic segmentation (to distinguish between instances of different semantic classes,including background class)and direction features [70](to separate instances of the same semantic label).Our work is most similar to FCIS [44],Mask R-CNN [31],and the work of [70];we build on top of Faster R-CNN [62]instead of R-FCN [19](and thus replace the complicated template matching for instance detection in [70]),exploit semantic segmentation prediction to remove duplicate background en-coding in the inside/outside score maps,and we also simplify the position-sensitive pooling to direction pooling.3.MaskLabOverview:Our proposed model,MaskLab,employs ResNet-101[32]as feature extractor.It consists of three components with all features shared up to conv4(or res4x)block and one extra duplicate conv5(or res5x)block is used for the box classifier in Faster-RCNN [62].Note that the original conv5block is shared for both semantic segmenta-tion and direction prediction.As shown in Fig.2,MaskLab,built on top of Faster-RCNN [62],produces box prediction (in particular,refined boxes after the box classifier),seman-tic segmentation logits (logits for pixel-wise classification)and direction prediction logits (logits for predicting each pixel’s direction towards its corresponding instance center [70]).Semantic segmentation logits and direction prediction logits are computed by another 1×1convolution added after the last feature map in the conv5block of ResNet-101.Given each predicted box (or region of interest),we perform foreground/background segmentation by exploiting those two logits.Specifically,we apply a class-agnostic (i.e .,with weights shared across all classes)1×1convolution on the concatenation of (1)cropped semantic logits from the se-mantic channel predicted by Faster-RCNN and (2)cropped direction logits after direction pooling.Semantic and direction features:MaskLab generates semantic segmentation logits and direction prediction logits for an image.The semantic segmentation logits are used to predict pixel-wise semantic labels,which are able to separate instances of different semantic labels,including the back-ground class.On the other hand,the direction prediction logits are used to predict each pixel’s direction towards its corresponding instance center and thus they are useful to further separate instances of the same semantic labels.Given the predicted boxes and labels from the box predic-tion branch,we first select the channel w.r.t.the predicted la-bel (e.g .,the person channel)from the semantic segmentation logits,and crop the regions w.r.t.the predicted box.In orderConcatFigure4.Mask refinement.Hypercolumn features are concate-nated with the coarse predicted mask and then fed to another small ConvNet to produce thefinal refined mask predictions.to exploit the direction information,we perform the same assembling operation in[16,44]to gather regional logits (specified by the direction)from each direction channel.The cropped semantic segmentation logits along with the pooled direction logits are then used for foreground/background seg-mentation.We illustrate the details in Fig.3,which shows that the segmentation logits for‘person‘clearly separate the person class from background and the tie class,and the di-rection logits are able to predict the pixel’s direction towards its instance center.After assembling the direction logits, the model is able to further separate the two persons within the specified box region.Note that our proposed direction prediction logits are class-agnostic instead of having the log-its for each semantic class as in FCIS[44],yielding more compact models.Specifically,for mask segmentation with K classes,our model requires(K+32)channels(K for semantic segmentation and32for direction pooling),while [44]outputs2×(K+1)×49channels(2for inside/outside score maps and49for position grids).Mask refinement:Motivated by[21]which applies an-other network consisting of only few layers for segmentation refinement,we further refine the predicted coarse masks by exploiting the hypercolumn features[29].Specifically,as shown in Fig.4,the generated coarse mask logits(by only exploiting semantic and direction features)are concatenated with features from lower layers of ResNet-101,which are then processed by three extra convolutional layers in order to predict thefinal mask.Deformable crop and resize:Following Dai et al.[20], who demonstrate significant improvement in object detection by deforming convolution and pooling operations,we modify the key TensorFlow operation used for box classification,“crop and resize”(similar to RoIAlign in Mask R-CNN[31]), to support deformation as well.As shown in Fig.5,“crop and resize”first crops a specified bounding box region from the feature maps and thenbilinearlyresizes them to a specifiedsize(e.g.,4×4).We further divide the regions into several sub-boxes(e.g.,4sub-boxes and each has size2×2)and employ another small network to learn the offsets for each sub-box.Finally,we perform“crop and resize”again w.r.t. each deformed sub-box.In summary,we use“crop and resize”twice to implement the deformable pooling in[20].(a)Crop and resize(b)2×2sub-boxes(c)Deformed sub-boxes Figure5.Deformable crop and resize.(a)The operation,crop and resize,crops features within a bounding box region and resizes them to a specified size4×4.(b)The4×4region is then divided into4small sub-boxes,and each has size2×2.(c)Another small network is applied to learn the offsets of each sub-box.Then we perform crop and resize again w.r.t.to the deformed sub-boxes. 4.Experimental EvaluationWe conduct experiments on the COCO dataset[48].Our proposed model is implemented in TensorFlow[1]on top of the object detection library developed by[35].4.1.Implementation DetailsWe employ the same hyper-parameter settings as in[35, 67],and only discuss the main difference below.Atrous convolution:We apply the atrous convolution [34,27,64,57],which has been successfully explored in semantic segmentation[13,79,12],object detection [19,35]and instance segmentation[78,44],to extract denser feature maps.Specifically,we extract features with output=8(output stride denotes the ratio of input image spatial resolution tofinal output resolution).Weight initialization:For the1×1convolution applied to the concatenation of semantic and direction features,we found that the training converges faster by initializing the convolution weights to be(0.5,1),putting a slightly larger weight on the direction features,which is more important in instance segmentation,as shown in the experimental results.Mask training:During training,only groundtruth boxes are used to train the branches that predict semantic segmen-tation logits and direction logits,since direction logits may not align well with instance center if boxes are jittered.We employ sigmoid function to estimate both the coarse and re-fined mask results.Our proposed model is trained end-to-end without piecewise pretraining of each component.4.2.Quantitative ResultsWefirst report the ablation studies on a minival set and then evaluate the best model on test-dev set,with the metric mean average precision computed using mask IoU.Mask crop size:The TensorFlow operation,“crop and resize”,is used at least in two places:one for box classifi-cation and one for cropping semantic and direction features for foreground/background segmentation(another one for deformed sub-boxes if“deformable crop and resize”is used). In the former case,we use the same setting as in[35,67],Table ingsegmentation.(a)1bin(b)2bins(c)4binsFigure 6.We quantize the distance within each direction region.In (b),we split each original direction region into 2regions.Our final model uses 4bins for distance quantization as shown in (c).while in the latter case,the crop size determines the mask segmentation resolution.Here,we experiment with the effect of using different crop size in Tab.1and observe that using crop size more than 41does not change the performance significantly and thus we use 41throughout the experiments.Effect of semantic and direction features:In Tab.2,we experiment with the effect of semantic and direction features.Given only semantic segmentation features,the model attains an ********performance of 24.44%,while using only direction features the performance improves to 27.4%,showing that direction feature is more important than the semantic segmentation feature.When employing both features,we achieve 29.72%.We observe that the performance can be further improved if we also quantize the distance in the direction pooling.As illustrated in Fig.6,we also quantize the distance with different number of bins.For example,when using 2bins,we split the same direction region into 2regions.We found that using 4bins can further improves performance to 30.57%.Note that quantizing the distance bins improves more at high mAP threshold (cf .*******and ********in Tab.2).In the case of using x distance bins,the channels of direction logits become 8×x ,since we use 8directions by default (i.e .,360degree is quantized into 8directions).Thus,our model generates 32=8×4channels for direction pooling in the end.Number of directions:In Tab.3,we explore the effect of different numbers of directions for quantizing the 360degree.We found that using 8directions is sufficient to deliver good performance,when adopting 4bins for distance quantization.Our model thus uses 32=8×4(8for direction and 4for distance quantization)channels for direction pooling throughout the experiments.Mask refinement:We adopt a small ConvNetconsisting(4)52.26%30.57%Table 2.Effect of semantic and direction features.Direction fea-tures are more important than semantic segmentation features in the model,and the best performance is obtained by using both features and adopting 4bins to quantizethe distance in direction pooling.We show number of bins for distance quantization in parentheses.4253.51%33.80%4453.85%34.39%4654.10%34.86%4854.13%34.82%Table 3.Effect of different numbers of directions (i.e .,how many directions for quantizing the 360degree)when using four bins for distance quantization.using features from conv1and conv2(i.e .,last feature map in res2x block).Note conv3denotes the last feature map in res3x block.of three 5×5convolution layers with 64filters.We have experimented with replacing the small ConvNet with other structures (e.g .,more layers and more filters)but have not observed any significant difference.In Tab.4,we experi-ment with different features from lower-level of ing conv1(the feature map generated by the first convolu-tion)improves the ********performance to 32.92%from 30.57%,while using both conv1and conv2(i.e .,the last feature map in res2x block)obtains the best performance of 33.89%.We have observed no further improvement when adding more lower-level features.Multi-grid:Motivated by the success of employing a hierarchy of different atrous rates in semantic segmentation [71,20,12],we modify the atrous rates in (1)the last resid-ual block shared for predicting both semantic and direction features,and (2)the block for box classifier.Note that there are only three convolutions in those blocks.As shown in Tab.5,it is more effective to apply different atrous rates for the box classifier.We think current evaluation metric (mAP r )favors detection-based methods (as also pointed out by [6])and thus it is more effective to improve the detectionBox Classifier(1,1,1)(1,2,1)(1,2,4)Sem/Dir (4,4,4)34.82%35.59%35.35% (4,8,4)35.07%35.60%35.78% (4,8,16)34.89%35.43%35.51%Table5.Multi-grid performance(********).Within the parenthe-ses,we show the three atrous rates used for the three convolutions in the residual block.It is effective to adopt different atrous rates for the box classifier.Further marginal improvement is obtained when we also change the atrous rates in the last block that is shared by semantic segmentation and direction prediction logits. branch over the segmentation branch in our proposed model.Pretrained network:We experimentally found that it is beneficial to pretrain the network.Recall that we duplicate one extra conv5(or res5x)block in original ResNet-101for box classification.As shown in Tab.6,initializing the box classifier in Faster R-CNN with the ImageNet pretrained weights improves the performance from33.89%to34.82% (********).If we further pretrain ResNet-101on the COCO semantic segmentation annotations and employ it as feature extractor,the model yields about1%improve-ment.Thisfinding bears a similarity to[7]which adopts the semantic segmentation regularizer.Putting everything together:We then employ the best multi-grid setting from Tab.5and observe about0.7% improvement(********)over the one pretrained with segmentation annotations,as shown in Tab.6.Follow-ing[47,31],if the input image is resized to have a shortest side of800pixels and the Region Proposal Net-work adopts5scales,we observe another1%ing the implemented“deformable crop and re-size”brings extra1%improvement.Additionally,we em-ploy scale augmentation,specifically random scaling of in-puts during training(with shortest side randomly selected from{480,576,688,800,930}),and attain performance of 40.41%(********).Finally,we exploit the model that has been pretrained on the JFT-300M dataset[33,15,67],con-taining300M images and more than375M noisy image-level labels,and achieve performance of41.59%(********).Atrous convolution for denser feature maps:We employ atrous convolution,a powerful tool to control output resolution,to extract denser feature maps with output stride=8.We have observed that our performance drops from40.41%to38.61%(********),if we change output stride=16.Test-dev mask results:Afterfinalizing the design choices on the minival set,we then evaluate our model on the test-dev set.As shown in Tab.7,our MaskLab model out-performs FCIS+++[44],although FCIS+++employs scale augmentation and on-line hard example mining[65]during training as well as multi-scale processing and horizontalflippretrained model.Seg:Pretrain the whole model on COCO se-mantic segmentation annotations.MG:Employ multi-grid in last residual block.Anc:Use(800,1200)and5anchors.DC:Adopt deformable crop and resize.RS:Randomly scale inputs during training.JFT:Further pretrain the model on JFT dataset. during test.Our ResNet-101based model performs better than the ResNet-101based Mask R-CNN[31],and attains similar performance as the ResNet-101-FPN based Mask R-CNN.Our ResNet-101based model with scale augmen-tation during training,denoted as MaskLab+in the table, performs1.9%better,attaining similar mAP with Mask R-CNN built on top of the more powerful ResNeXt-101-FPN [47,74].Furthermore,pretraining MaskLab+on the JFT dataset achieves performance of38.1%mAP.Test-dev box results:We also show box detection results on COCO test-dev in Tab.8.Our ResNet-101based model even without scale augmentation during training performs better than G-RMI[35]and TDM[66]which employ more expensive yet powerful Inception-ResNet-v2[68]as feature extractor.All our model variants perform comparably or bet-ter than Mask R-CNN variants in the box detection task.Our best single-model result is obtained with scale augmentation during training,41.9%mAP with an ImageNet pretrained network and43.0%mAP with a JFT pretrained network. 4.3.Qualitative ResultsSemantic and direction features:In Fig.7,we visualize the‘person’channel in the learned semantic segmentation logits.We have observed that there can be some high ac-tivations in the non-person regions(e.g.,regions that are near elephant’s legs and kite),since the semantic segmenta-tion branch is only trained with groundtruth boxes without any negative ones.This,however,is being handled by the box detection branch whichfilters out wrong box predic-tions.More learned semantic segmentation and direction prediction logits are visualized in Fig.3.Deformable crop and resize:In Fig.8,we visualize the learned deformed sub-boxes.Interestingly,unlike the visualization results of deformable pooling in[20]which learns to focus on object parts,our sub-boxes are deformed in a circle-shaped arrangement,attempting to capture longer context for box classification.We note that incorporating context to improve detection performance has been used in, e.g.,[24,81,75],and our model is also able to learn this.MaskLab ResNet-10135.4%57.4%37.4%16.9%38.3%49.2%MaskLab+ResNet-10137.3%59.8%39.6%19.1%40.5%50.6%MaskLab+ResNet-101(JFT)38.1%61.1%40.4%19.6%41.6%51.4% Table7.Instance segmentation singlemodel mask mAP on COCO test-dev.MaskLab+:Employ scale augmentation during training.MaskLab ResNet-10139.6%60.2%43.3%21.2%42.7%52.4%MaskLab+ResNet-10141.9%62.6%46.0%23.8%45.5%54.2%MaskLab+ResNet-101(JFT)43.0%63.9%47.1%24.8%46.7%55.2% Table8.Object detection single model box mAP on COCO test-dev.MaskLab+:Employ scale augmentation during training.(a)Image(b)‘Person’LogitsFigure7.‘Person’channel in the predicted semantic segmentationlogits.Notethe highactivationsonnon-personregions,since thesemantic segmentation branch is only trained with groundtruthboxes.This,however,is being handled by the box detection branchwhichfilters out wrong box predictions.Predicted masks:We show some qualitative results pro-duced by our proposed model in Fig.9.We further visual-ize our failure mode in the last row,mainly resulting fromdetection failure(e.g.,missed-detection and wrong classprediction)and segmentation failure(e.g.,coarse boundaryresult).Figure8.Visualization of learned deformed sub-boxes.The49(arranged in a7×7grid)sub-boxes(each has size2×2)arecolor-coded w.r.t.the top right panel(e.g.,the top-left sub-box isrepresented by light blue color).Our“deformable crop and resize”tend to learn circle-shaped context for box classification.5.ConclusionIn this paper,we have presented a model,called MaskLab,that produces three outputs:box detection,semantic segmen-tation and direction prediction,for solving the problem ofinstance segmentation.MaskLab,building on top of state-of-art detector,performs foreground/background segmentationby utilizing semantic segmentation and direction prediction.We have demonstrated the effectiveness of MaskLab on thechallenging COCO instance segmentation benchmark andshown promising results.。
藏汉神经网络机器翻译研究李亚超;熊德意;张民;江静;马宁;殷建民【摘要】Neural machine translation(NMT),which is a new machine translation method based on sequence-to-se-quence learning via neural network,has surpasses statistical machine translation(SM T)in several language pairs gradually.This paper conducted experiment of attention based NMT on Tibetan-Chinese translation task,and adopted transfer learning to overcome the data sparsity problem.Experimental results show that the transfer learn-ing method proposed is simple andeffective,resulting 3 BLEU score improvement compared with the phrase-based SM T.Analysis of translations is also conducted to discusses the merits and shortcomings of NM T.%神经网络机器翻译是最近几年提出的机器翻译方法,在多数语言对上逐渐超过了统计机器翻译方法,成为当前机器翻译研究前沿热点.该文在藏汉语对上进行了基于注意力的神经网络机器翻译的实验,并采用迁移学习方法缓解藏汉平行语料数量不足问题.实验结果显示,该文提出的迁移学习方法简单有效,相比短语统计机器翻译方法,提高了三个BLEU值.从译文分析中可以看出藏汉神经网络机器翻译的译文比较流畅,远距离调序能力较强,同时也存在过度翻译、翻译不充分、翻译忠实度较低等神经网络机器翻译的共同不足之处.【期刊名称】《中文信息学报》【年(卷),期】2017(031)006【总页数】7页(P103-109)【关键词】藏语;神经网络机器翻译;注意力机制;循环神经网络;迁移学习【作者】李亚超;熊德意;张民;江静;马宁;殷建民【作者单位】甘肃省民族语言智能处理重点实验室(西北民族大学),甘肃兰州730030;苏州大学计算机科学与技术学院,江苏苏州215000;苏州大学计算机科学与技术学院,江苏苏州215000;苏州大学计算机科学与技术学院,江苏苏州215000;甘肃省民族语言智能处理重点实验室(西北民族大学),甘肃兰州730030;甘肃省民族语言智能处理重点实验室(西北民族大学),甘肃兰州730030;潍坊北大青鸟华光照排有限公司,山东潍坊261000【正文语种】中文【中图分类】TP3910 引言机器翻译研究如何利用计算机自动实现不同语言之间的相互转换,是自然语言处理的重要研究领域。
AbstractThe present paper describes an intelligent system AUTOPROMOD developed for automatic modeling of progressive die. The proposed system utilizes interfacing of AutoCAD and AutoLISP for automatic modeling of die components and die assembly. The system comprises eight modules, namely DBMOD, STRPRMOD, BPMOD, PPMOD, BBDSMOD, TBDSMOD, BDAMOD and TDAMOD. The system modules work in tandem with knowledge-based system (KBS) modules developed for design of progressive die components. The system allows the user firstly to model the strip-layout and then utilizes output data files generated during the execution of KBS modules of die components for automatic modeling of progressive die. An illustrative example is included to demonstrate the usefulness of the proposed system. The main feature of the system is its facility of interfacing die design with modeling. A semiskilled and even an unskilled worker can easily operate the system for generation of drawings of die components and die assembly. System modules are implementable on a PC having AutoCAD software and thus its low cost of implementation makes it affordable for small and medium sized stamping industries.本文描述了一种智能系统AUTOPROMOD开发级进模的自动建模。
矿产资源开发利用方案编写内容要求及审查大纲
矿产资源开发利用方案编写内容要求及《矿产资源开发利用方案》审查大纲一、概述
㈠矿区位置、隶属关系和企业性质。
如为改扩建矿山, 应说明矿山现状、
特点及存在的主要问题。
㈡编制依据
(1简述项目前期工作进展情况及与有关方面对项目的意向性协议情况。
(2 列出开发利用方案编制所依据的主要基础性资料的名称。
如经储量管理部门认定的矿区地质勘探报告、选矿试验报告、加工利用试验报告、工程地质初评资料、矿区水文资料和供水资料等。
对改、扩建矿山应有生产实际资料, 如矿山总平面现状图、矿床开拓系统图、采场现状图和主要采选设备清单等。
二、矿产品需求现状和预测
㈠该矿产在国内需求情况和市场供应情况
1、矿产品现状及加工利用趋向。
2、国内近、远期的需求量及主要销向预测。
㈡产品价格分析
1、国内矿产品价格现状。
2、矿产品价格稳定性及变化趋势。
三、矿产资源概况
㈠矿区总体概况
1、矿区总体规划情况。
2、矿区矿产资源概况。
3、该设计与矿区总体开发的关系。
㈡该设计项目的资源概况
1、矿床地质及构造特征。
2、矿床开采技术条件及水文地质条件。
Information is Protophysical Douglas J. MatzkeTexas InstrumentsDallas, Texasmatzke@Abstract:Thought experiments led Einstein to discovering that gravity and acceleration were identical, which lead to his famous theory of relativity. Thought experiments can also be used in critical thinking and understanding about the relationship between physics and computation. This paper will discus several computational oriented thought experiments related to spacetime (or gravity) that surfaced during the planning of the PhysComp 92 and PhysComp 94 conferences. Thought provoking questions will be developed from these thought experiments, as well as other questions people asked during this period. These thought experiments and questions will be discussed in light of actual research supporting those issues, and the result will be the view that information laws are topological constraints that precede physical laws and therefore are protophysical. 1.0 Introduction to information and spacetime:When Dr. Landauer argued that information was physical [1] he turned the concept of information from a mathematical exercise into a physics reality. In principal therefore, information is just another kind of energy or matter (or visa versa). This notion of information does not exactly jive with the information theory view of information being a mathematical measurement for modeling communication systems or the computer engineering and computer architecture ideas that computation is defined as physical spatial (memory in Mbytes) and temporal (CPU in Mips) resources, with the actual energy cost a technological dependent variable.Computer science has traditionally been concerned with the abstract costs of computation, where as engineers have been concerned with the physical mechanisms and physical costs of computing. As computer technology continues to scale there will be less of a clean separation between the abstract and physical computational layers. Also as computer scientists continue to demand exponentially more computing resources for tough problems, we are faced with the reality of computing resource technology limits looming in the future. For these reason, many scientists are looking at quantum computing as a solution to providing more computing power than semiconductor scaling alone will provide. In a similar vein, perhaps computational leverage could also be obtained by looking at relativistic notions of space and time and observer frames.This approach of looking at relativity theory may not seem like the most obvious approach, but much work has been done combining relativity and information theory with quantum mechanics. For example, the black hole work of Schiffer and Bekenstein [2] led to the understanding that black holes are gigantic "bit buckets" with a bit being the intrinsic quantum increase of surface area. Likewise the generalization by Unruh [3] showed that gravitation fields, impact information transfer rates due to gravitationally induced thermal noise. Empty space itself also represents an intrinsic zero point energy potential to support quantum fluctuations, and must therefore also represent intrinsic computational potential since information and energy are related. Even the big bang must have started as a very special entropy state to allow the universe to keep running ever since then towards a thermodynamic oblivion of uniform heat death or big crunch.Connections between gravity and computation are expected if both deal intrinsically with spacetime and energy. Is it possible to take thiskind of thinking to the next step and find some connection between computation and gravity, where computation can be viewed as information dynamics? Hopefully this understanding would also generalize to include the non-standard spacetime metrics obtained by quantum computing leverage.Most of the unified field theories propose multiple dimensions of space to solve super symmetry constraints [4]. Interestingly, many of the most successful computer science concepts also deal with supporting higher dimensional semantics and mechanisms. For example, virtual memory pointers can be thought of as spatial microcode that allow representation of high dimensional topologies using the zero dimensional topology of virtual memory space. Likewise coding theory, content addressable memories, neural networks, and object oriented programming all deal with efficiently supporting mechanisms for high dimensional semantics. Again, it is no surprise that topology is the essence of gravity as well as information and computation theories.The major difference between gravitational and computational spacetime is the difference between actual physical spaces and simulated spaces. The most obvious is simulated spaces do not have real energy, or a simulation of a nuclear reactor would destroy the computer and building. Less obvious is that physical spaces have real "time" metrics and isotropy. Isotropy is the ability of a system to behave consistently independent of the axis of observation of movement. High dimensional simulated spaces will demonstrate anisotropic metrics when measured against physical time (vs. virtual time metrics).With this introduction the rest of the paper will discuss several thought experiments and many thought provoking questions to elicit more understanding about the relationship between computation and spacetime.2.0 Spacetime Thought Experiments Conventional thinking about exponential algorithms leads to the classical understanding of NP-complete problems known today. If this thinking is put into the context of a physics thought experiment the following description applies. NP-complete problems are those problems that scale exponentially based on the number of elements in the solution. For very large problems, when one limits the amount of spatial resources (defined as the number of computing elements), the time to solve the algorithm takes more time that the predicted life of the universe. This outcome remains a fact independent of technology scaling.Another more interesting variant of this thought experiment was shared by a person contacted for PhysComp 92. His thought experiment turned this solution on it's side and suggested a time bound solution to the problem. Imagine an answer to a very hard computation problem is desired within a time T. Based on the speed of light, this time limit places an upper bound on the size of the computer based on the distance light can travel during that time. This time bound also determines the number of computing elements that must be used to produce the answer based on the exponential number of subsolutions. Assuming that each computing element has a mass, it is possible to define the total mass of this verysupercomputer. Fitting this mass inside the previous size constraint would result in exceeding the mass density limit for a black hole event horizon. No one will fund this effort.Spatially bounded solutions to exponential problems appear to have a mathematical interpretation but temporally bounded solutions seem to suggest a very strong physical interpretation. Both of these thought experiments actually have the same physical interpretation, namely that exponentially hard problem solutions do not fit into our physical universe. Leverage obtained by quantum computing is so interesting because it is based on superposition principles, which effectively exists outside of the spacetime of conventional deterministic computers.The second thought experiment, called the twin paradox, is an early relativity thought experiment regarding time dilation. This thought experiment involves a pair of twins in the space program. The first twin was onboard an advanced space ship and accelerated toward a distant star to a large percentage of the speed of light, then decelerated, turned around, and returned toearth in a similar fashion. The second twin stayed on earth. When the twin returns from his trip he has not aged very much compared to his now much older twin brother who stayed on earth. The inflight twin not only got to see the universe, but effectively aged more slowly as a result of it.The alternative version of this thought experiment is to use twin computers. The stay at home computer will be working on a problem that will take the length of the trip. The other computer bound for space is also working on the same problem. When the inflight computer returns it is only partially complete and the stay at home twin has solved the problem already. It seems like an advantage for humans to stay younger but for computers remaining young is a disadvantage.The analysis of the twin computer paradox suggests that the optimal manner for computing an answer is to not go through any large accelerations. This leads to ask the question, "Is there any kind of motion that canaccelerate the computation rate of acomputer?"The answer to this question is to accelerate the rest of the universe away from the stationary computer. If this was done simultaneously for all three dimensional axis then the computer would be more efficient than another computer inside the universe. Of course to accomplish this, the universe would have to move on a higher dimensional axis orthogonal to our normal three dimensions of space. If this motion is completely relative, instinctively we can believe moving relative to the known 3 axis of space may give computational leverage. In other words, higher dimensional computers may be more efficient than lower dimensional computers, especially for mapping higher dimensional applications. This is certainly true in the limit of computer scaling [5]. This thought experiment begs the question regarding higher dimensional spaces, What are the time properties of higher dimensional spaces (most likely without mass since this is a property of 4space)? As demonstrated by time dilation for photons themselves and Bells theorem, it is obvious that higher dimensional systems (outside 4space) are comparatively atemporal.This is expected since our time emerges as a result of consistency constraints from relativity and quantum mechanics.Just as high dimensional semantics are important to computation, higher dimensions go one step farther beyond simulated spaces by reintroducing isotropy, redefining temporality, and also locality (since they are strongly linked notions). Compared to the energy metrics of4space, the atemporal and nonlocal notions of higher dimensional spaces appears to be more like an information metric, where every inertial frame and quantum interaction can be viewed asa large system of information constraints.3.0 Thought Provoking QuestionsOne of the earliest questions asked by a PhysComp colleagues was, “How heavy is a bit?” As a result of Bekenstein's work we can now answer that question as roughly Planck's area worth of energy/matter. The next version of that question is, if a bit is heavy, how many bits does it take to define each the primitive particles of physics?This question can be approached from a computer science perspective, as if each particle was a token of a message, and the particles defined the symbol set of nature. Unfortunately this abstract solution does not comprehend the complete picture, since these particles are not of equal probability in the message. (Physics experiments can be thought of as information dynamic simulations). Additionally, since information is physical, this approach must comprehend energy dynamics due to fields and also include Bekenstein's work. Lastly, quantum constraints and zero point energy constraints (energy potential of free space) must also be comprehended as information.This question is supported by the work of Noyes and Kauffman [6] where they start out with the assumption that physics laws are derived from discrete information dynamics. Supersymetry solutions are also topologically oriented and related to knot theory, which has a strong basis from topological constraints. All of these solutions are higher dimensional solutions. John Wheeler understood this relationship betweeninformation and gravity [7] and also proposed apregeometric way of thinking [8]. More work must be done to answer this question.The quantum probability solutions and higher dimensional solutions beg other questions besides atemporality. Can we have information encoding as topologies without usingmatter/energy structures? Another way to pose that same question is, What is the information encoding mechanism of quantum probability distributions (and other fields)? or, Can information be encoded directly as topological spacetime without thinking of them as a particle (i.e. graviton)?These questions are supported by the notion that spin is a property independent of energy properties, but effectively represents an informational oriented property that must be preserved in the face of black holes. Likewise, quantum coherency in EPR is like an acausal constraint, where either part can be influenced and effect the coherent whole. Just labeling new concepts such as Qubits and Ebits is useful, but what does it mean from an information encoding mechanism behind physics constraints? All conservation laws must be built on top of some more primitive consistency mechanisms, that must have topological properties and information dynamics.Another provoking question is the subtle aspect of simulating real spaces. In order to simulate the dynamics of relativity, a model of an inertial frame must be represented in the computer. In order to generate the relativistic view of other elements and fields, this data representation must contain information regarding velocity, direction, position, etc. to be used in the computation task. But more important, the inertial frame represents information state associated with the observer.Therefore, if information is physical, then inertial frames must also be physical. Unfortunately, physicists treat inertial frames as pure mathematical abstractions with no physical reality. This is simply proven by the fact that inertial frames can not be acted upon. Another observation is that inertial frames can not actually be used as an inertial frame for photons, as if the frame had some mass associated with it.This line of thinking is very fundamental, because inertial frames formally define the observer for relativity just as quantum collapse is the observation mechanism for quantum mechanics. Processes (running on CPUs) can be thought of as the observer frame for computation, causing the computation to unfold at decision points. Can all three notions of an observer be combined to make a comprehensive "observer" abstraction that is consistent with information, quantum, and relativity theories.It is clear that giving equal weight to information mechanics as well as energy mechanics within physics raises very interesting questions. This is very similar to the kind of process that happened initially with particle/wave duality at the beginning of this century. Information/energy duality will most likely be the dominant paradox that must be resolved next. Unified field theories that do not explicitly included computational and informational perspectives will most likely be incomplete.4.0 ConclusionsThis paper does not give many answers, but the questions raised about the intrinsic informational properties associated with spacetime, and physical "conservation" constraints supports that universe is a large constraint system. Physical laws must be supported by some information mechanism with topological properties that give rise to isotropy, 4space energy metrics, coherency, nonlocality, atemporality, and acausal characteristics. The exact mathematical solution is unclear at this time, but these thought experiments and questions suggest that unified theories using higher dimensional solutions must have an information metric orientation and not just more of the4space energy metric thinking. Therefore, information within 4space is physical, but information is protophysical for mechanisms outside our 4space bounded energy metric.5.0 References[1] Landauer, Rolf. 1992. "Information is Physical." Proceedings of the Workshop on Physics and Computation. IEEE Computer Science Press.[2] M. Schiffer, 1993, “The interplay between Gravitation and Information Theory”, Proceedings of the Workshop on Physics and Computation, PhysComp 92, IEEE Computer Society Press.[3] Unruh, W. G. 1976, “Notes on black-hole evaporation”, Phys. Rev. D14, 870[4] Kaku, Michio. 1994. Hyperspace, A Scientific Odyssey Through Parallel Universes, Time Warps, and the Tenth Dimension. Oxford University Press[5] Franco Preparata, May 1993, “Horizons of Parallel Computation”, Brown University, Technical Report No. CS-93-20.[6] L. Kauffman and H. P. Noyes, 1996,“Discrete Physics and the Derivation of the Electromagnetism form the formalism of Quantum Mechanics”, Proc. of the Royal Society A452, pp. 81-95[7] Wheeler, John. 1989. "It From Bit," Proceedings 3rd International Symposium on Foundations of Quantum Mechanics, Tokyo. [8] C Misner, K Thorne, J. Wheeler, Gravitation, pp. 1203-1212. W. H. Freeman and Company. New York.。
第33卷第3期2019年3月Vol.33,No.3Mar.,2019中文信息学报JOURNAL OF CHINESE INFORMATION PROCESSING文章编号:1003-0077(2019)03-0033-09基于HowNet的语义表示学习朱靖雯・杨玉基S许斌2,李涓子2(1.北京信息科技大学信息管理学院,北京100192;2.清华大学计算机系知识工程实验室,北京100084)摘要:HowNet是一个大规模高质量的跨语言(中英)常识知识库,蕴含着丰富的语义信息。
该文利用知识图谱领域的方法将HowNet复杂的结构层层拆解,得到了知识图谱形式的HownetGraph,进而利用网络表示学习以及知识表示学习方法得到了跨语言(中、英)、跨语义单位(字词、义项①、DEF_C()NCEPT②和义原)的向量表示,在词语相似度(word similarity)和词语类比(word analogy)任务上对中英文数据集进行了实验,实验结果显示该文提出的方法在词语语义相似度的任务上取得了最好效果。
关键词:HowNet;知识图谱:语义表示;表示学习中图分类号:TP391文献标识码:ASemantic Representation Learning Based on HowNetZHU Jingwen1,YANG Yuji2,XU Bin2,LI Juanzi2(1.School of Information Management,Beijing Information Science andTechnology University,Beijing100192,China;2.Knowledge Engineering Group,Department of Computer Science and Technology,Tsinghua University.Beijing100084,China)Abstract:HowNet is a large-scale and high-quality cross-lingual commonsense knowledge base,containing a wealth of semantic information.This paper disassembles HowNet s complex structure and obtains HownetGraph in the form of knowledge graph.Then Network Representation Learning and Knowledge Representation Learning methods are applied to obtain cross-lingual vector representation of different semantic units,i.e.,word,sense,DEF CON-CEPT and sememe.Two series of experiments(word similarity and word analogy)are conducted on Chinese and English datasets,and the results show the proposed method achieves the best results.Keywords:HowNet;knowledge graph;semantic representation;representation learningo引言近年来,词向量技术的进步极大地促进了自然语言处理领域的发展。
第35卷第2期2021年2月中文信息学报JO U R N A L OF CHINESE INFO R M A TIO N PROCESSINGVol. 35,No. 2 Feb.,2021文章编号:1003-0077(2021)02-0099-08U -N e t :用于包含无答案问题的机器阅读理解的轻量级模型孙付1,李林阳1,邱锡鹏1,刘扬黄萱菁1(1.复旦大学计算机学院,上海201210; 2.流利说硅谷人工智能实验室,美国旧金山94104)摘要:处理机器阅读理解任务时.识别其中没有答案的问题是自然语言处理领域的一个新的挑战。
该文提出U -N e t 模型来处理这个问题,该模型包括3个主要成分:答案预测模块、无答案判别模块和答案验证模块。
该模型用一个U 节点将问题和文章拼接为一个连续的文本序列,该U 节点同时编码问题和文章的信息,在判断问题是否 有答案时起到重要作用,同时对于精简U -N e t 的结构也有重要作用。
与基于预训练的B E R T 不同,U -N e t 的U 节 点的信息获取方式更多样,并且不需要巨大的计算资源就能有效地完成机器阅读理解任务。
在SQuAD 2.0中,11-他1的单模型['1得分72.6、£1^得分69.3,11-仏1的集成模型/;'|得分74.9、£\1得分71.4.均为公开的非基于大规模预训练语言模型的模型结果的第一名。
关键词:机器阅读理解;SQ uAD ;注意力机制 中图分类号:TP391文献标识码:AU-Net : Lightweight Model for Machine Reading Comprehensionwith Unanswerable QuestionsSUN Fu1 . LI Linyang1 . QIU Xipeng1 , LIU Yang2 , HUANG Xuanjing1(1. School of Computer Science, Fudan University,Shanghai 201210,China;2. Liulishuo Silicon Valley AI Lab, San Francisco 94104» USA)Abstract : Machine reading comprehension with unanswerable questions is a challenging task. In this paper, we propose a unified models called U-Net» with three important components : answer pointer^ no-answer pointer, and answer verifier. We introduce a universal node which processes the question and its context passage as a single contigu- ous sequence of tokens. The universal node encodes the fused information from both the quev s tion and passage» and plays an important role to predict whether the question is answerable and also greatly improves the conciseness of the U-Net. Different from the modeLs based on pre-trained B E R T , universal node fuses information from passage and question in a variety of ways and avoids the huge computation. T he single U-Net model achieves the F\ score of 72.6 and the EM score of 69.3 on SQuAD 2.0, and the ensemble version, 74.9 and 71.4» respectively. Both version of U-Net models rank top among the models without a large scale pre-trained language model.Keywords : machine reading comprehension;SQuAD;attention mechanism了丰硕的成果。
Toward A Completely Automatic Neural Network BasedHuman Chromosome Analysis
Boaz LernerUniversity of Cambridge Computer LaboratoryCambridge CB2 3QG, UK(email: boaz.lerner@cl.cam.ac.uk)Abstract
The application of neural networks (NNs) to automatic analysis of chromosome images is investigatedin this paper. All aspects of the analysis, namely segmentation, feature description, selection and extractionand finally classification, are studied. As part of the segmentation process, the separation of clusters ofpartially occluded chromosomes, which is the critical stage that state-of-the-art chromosome analyzersusually fail to accomplish, is performed. First, a moment representation of the image pixels is clustered tocreate a binary image without a need for threshold selection. Based on the binary image, lines connectingcut points imply possible separations. These hypotheses are verified by a multilayer perceptron (MLP) NNthat classifies the two segments created by each separating line. Use of a classification-driven segmentationprocess gives very promising results without a need for shape modelling or an excessive use of heuristics.In addition, an NN implementation of Sammon’s mapping using principal component based initialization isapplied to feature extraction, significantly reducing the dimensionality of the feature space and allowinghigh classification capability. Finally, by applying MLP based hierarchical classification strategies to awell-explored chromosome database, we achieve a classification performance of 83.6%. This is higherthan ever published on this database and an improvement of more than 10% in the error rate. Therefore,basing a chromosome analysis on the NN based techniques that are developed in this research leads towarda completely automatic human chromosome analysis.
Index Terms- Chromosomes, feature extraction, image classification, neural networks, partial occlusion, segmentationPublished in IEEE Transactions on Systems, Man, and Cybernetics Special issue on Artificail Neural Networks, vol. 28, pt. B,pp. 544-552, 1998.1. IntroductionHuman chromosome analysis is an essential task in cytogenetics, especially in prenatalscreening and genetic syndrome diagnosis, cancer pathology research and environmentallyinduced mutagen dosimetry [2]. Cells used for chromosome analysis are taken mostly fromamniotic fluid or blood samples. The stage at which the chromosomes are most suitable foranalysis is the metaphase (Fig. 1). One of the aims of chromosome analysis is the creation of akaryotype, which is a layout of chromosome images organised by decreasing size in pairs (Fig. 2).The karyotype is obtained by cutting chromosome images from a photograph of a cell, takenusing a microscope, and arranging the chromosomes into their appropriate places on the layoutaccording to their visual classification by the cytotechnician. Karyotyping is a useful tool fordetecting deviations from normal cell structure. Abnormal cells can have an excess or deficit of achromosome and/or structural defects, like breaks, fragments or translocations (exchange ofgenetic material between chromosomes). However, even today, chromosome analysis andkaryotyping are performed manually in most cytogenetic laboratories in a repetitive, timeconsuming and therefore expensive procedure.Great efforts to develop automatic chromosome classification techniques have been madeduring the last 25 years. However, all have had limited success and have yielded poorclassification results compared with those of a trained cytotechnician [2], [10]. Some of thereasons for the relatively poor performances are the inadequate use of expert knowledge andexperience, and insufficient ability to make comparisons and/or elimination among chromosomeswithin the same metaphase. In addition, the systems always require operator interaction toseparate touching and/or overlapping chromosomes and to verify the classification results.During recent years we have developed [14]-[17] a capability to deal with the most importantaspects of chromosome analysis, mainly through the application of NNs. The present study is anadditional step to extend this capability by solving the very complex problem of separating images