G_IELTS_Writing task 1 letter
- 格式:docx
- 大小:34.35 KB
- 文档页数:7

IELTS Task 1 Writing band descriptors (public version)Band Task Achievement Coherence and Cohesion Lexical Resource Grammatical Range and Accuracy9 fully satisfies all the requirements ofthe taskclearly presents a fully developedresponse uses cohesion in such away that it attracts noattentionskilfully managesparagraphinguses a wide range of vocabulary withvery natural and sophisticated control oflexical features; rare minor errors occuronly as ‘slips’uses a wide range of structures with fullflexibility and accuracy; rare minor errorsoccur only as ‘slips’8 covers all requirements of the tasksufficientlypresents, highlights and illustrates keyfeatures / bullet points clearly andappropriately sequences information andideas logicallymanages all aspects ofcohesion welluses paragraphingsufficiently andappropriatelyuses a wide range of vocabulary fluentlyand flexibly to convey precise meaningsskilfully uses uncommon lexical items butthere may be occasional inaccuracies inword choice and collocationproduces rare errors in spelling and/orword formationuses a wide range of structuresthe majority of sentences are error-freemakes only very occasional errors orinappropriacies7 covers the requirements of the task(Academic) presents a clear overviewof main trends, differences or stages(General Training) presents a clearpurpose, with the tone consistent andappropriateclearly presents and highlights keyfeatures / bullet points but could bemore fully extended logically organisesinformation and ideas; thereis clear progressionthroughoutuses a range of cohesivedevices appropriatelyalthough there may besome under-/over-useuses a sufficient range of vocabulary toallow some flexibility and precisionuses less common lexical items withsome awareness of style and collocationmay produce occasional errors in wordchoice, spelling and/or word formationuses a variety of complex structuresproduces frequent error-free sentenceshas good control of grammar andpunctuation but may make a few errors6 addresses the requirements of the task(Academic) presents an overview withinformation appropriately selected(General Training) presents a purposethat is generally clear; there may beinconsistencies in tonepresents and adequately highlights keyfeatures / bullet points but details maybe irrelevant, inappropriate orinaccurate arranges information andideas coherently and thereis a clear overallprogressionuses cohesive deviceseffectively, but cohesionwithin and/or betweensentences may be faulty ormechanicalmay not always usereferencing clearly orappropriatelyuses an adequate range of vocabularyfor the taskattempts to use less common vocabularybut with some inaccuracymakes some errors in spelling and/orword formation, but they do not impedecommunicationuses a mix of simple and complex sentenceformsmakes some errors in grammar andpunctuation but they rarely reducecommunication5 generally addresses the task; theformat may be inappropriate in places(Academic) recounts detailmechanically with no clear overview;there may be no data to support thedescription(General Training) may present apurpose for the letter that is unclear attimes; the tone may be variable andsometimes inappropriatepresents, but inadequately covers, keyfeatures / bullet points; there may be atendency to focus on details presents information withsome organisation but theremay be a lack of overallprogressionmakes inadequate,inaccurate or over-use ofcohesive devicesmay be repetitive becauseof lack of referencing andsubstitutionuses a limited range of vocabulary, butthis is minimally adequate for the taskmay make noticeable errors in spellingand/or word formation that may causesome difficulty for the readeruses only a limited range of structuresattempts complex sentences but these tendto be less accurate than simple sentencesmay make frequent grammatical errors andpunctuation may be faulty; errors cancause some difficulty for the reader4 attempts to address the task but doesnot cover all key features / bulletpoints; the format may be inappropriate(General Training) fails to clearlyexplain the purpose of the letter; thetone may be inappropriatemay confuse key features / bulletpoints with detail; parts may beunclear, irrelevant, repetitive orinaccurate presents information andideas but these are notarranged coherently andthere is no clearprogression in the responseuses some basic cohesivedevices but these may beinaccurate or repetitiveuses only basic vocabulary which may beused repetitively or which may beinappropriate for the taskhas limited control of word formationand/or spelling;errors may cause strain for thereaderuses only a very limited range of structureswith only rare use of subordinate clausessome structures are accurate but errorspredominate, and punctuation is oftenfaulty3 fails to address the task, which mayhave been completely misunderstoodpresents limited ideas which may belargely irrelevant/repetitive does not organise ideaslogicallymay use a very limitedrange of cohesive devices,and those used may notindicate a logicalrelationship between ideasuses only a very limited range of wordsand expressions with very limited controlof word formation and/or spellingerrors may severely distort the messageattempts sentence forms but errors ingrammar and punctuation predominate anddistort the meaning2 answer is barely related to the task has very little control oforganisational features uses an extremely limited range ofvocabulary; essentially no control of wordformation and/or spellingcannot use sentence forms except inmemorised phrases1 answer is completely unrelated to thetask fails to communicate anymessagecan only use a few isolated words cannot use sentence forms at all0 does not attenddoes not attempt the task in any waywrites a totally memorised response。

c10t2雅思小作文## Delving into the Depths of IELTS Writing Task 1: Unraveling the Mysteriesof c10t2 The IELTS Academic Writing Task 1, a seemingly straightforward endeavor, often presents a formidable challenge for test-takers. Among the various charttypes encountered, the enigmatic "c10t2" remains shrouded in a veil of mystery, demanding a meticulous approach and a keen eye for detail. As a seasoned veteranof the written word, I'm here to guide you through the labyrinthine complexitiesof this task, equipping you with the tools and insights necessary to conquer itwith finesse. Firstly, let's dispel the fog surrounding "c10t2." This crypticcode refers to a specific dataset within the Cambridge IELTS 10 practice test book, specifically Task 2 of the Academic Writing module. While the exact nature of the chart remains undisclosed, the principles and strategies I'm about to unveil will empower you to tackle any chart with confidence, regardless of its specific format. The cornerstone of a successful Task 1 response lies in a comprehensive analysisof the provided data. Scrutinize the chart meticulously, identifying key trends, patterns, and outliers. Pay close attention to the units of measurement, the time period covered, and any categories or groupings presented. This meticulous examination forms the foundation upon which your written response will be built. Next, embark on the journey of crafting a compelling introduction. Paraphrase the information presented in the chart's title and caption, avoiding direct copying. This demonstrates your ability to understand and synthesize information, a crucial skill assessed in the IELTS exam. Additionally, provide a succinct overview of the main trends or patterns you identified in your analysis. This sets the stage for a well-structured and informative essay. The body paragraphs form the heart of your response, where you delve into the intricacies of the data. Employ a variety of cohesive devices, such as transition words and phrases, to ensure a smooth flow of ideas. Comparisons are often essential in Task 1; use comparative language to highlight similarities and differences between data points. For instance, youmight say, "While category A experienced a steady increase, category B witnessed a dramatic decline." Quantify your observations whenever possible, using specificdata points to support your claims. Remember, the IELTS exam assesses yourability to effectively communicate information, not merely regurgitate numbers.Therefore, strive to present the data in a clear, concise, and engaging manner. Use a range of vocabulary to describe trends, such as "fluctuate," "peak," "plummet," or "plateau." Avoid monotony by varying your sentence structure and employing synonyms to prevent repetition. Finally, conclude your response by summarizing the key points discussed in the body paragraphs. Briefly reiterate the most significant trends or patterns, providing a sense of closure to your analysis. Avoid introducing any new information in the conclusion; its purpose is to provide a concise and impactful summary of your findings. Mastering the art of IELTS Writing Task 1 requires practice, perseverance, and a keen eye for detail. By implementing the strategies outlined above and diligently practicing with various chart types, you'll be well-equipped to unravel the mysteries of "c10t2" and any other chart that comes your way. Remember, the key lies in thorough analysis,clear communication, and a touch of finesse. With dedication and the right approach, you'll conquer this challenge and pave the way for a successful IELTS journey.。
雅思小作文真题范文剑桥12 Delving Deeper: An Analysis of IELTS Writing Task 1 Sample Essays from Cambridge 12 The IELTS Writing Task 1, while seemingly straightforward, often presents a challenge for test-takers. It requires not just accurate data interpretation and description but also a clear, concise, and well-structured presentation of information. To truly excel, one must go beyond simplyregurgitating data and delve deeper into the nuances of language and analysis.Let's explore how, by examining sample essays from Cambridge 12, we can elevateour writing to meet the demands of this task. Firstly, consider the language used in the sample essays. It's evident that vocabulary plays a crucial role in effectively conveying information. Words like "fluctuated," "peaked," and "plummeted" vividly depict trends and changes, while terms like "a marginal increase" and "a significant decline" offer precise measurements. Spice up your vocabulary (idiom, origin unknown) by actively seeking synonyms and exploring words that denote specific changes or comparisons. Furthermore, the use of cohesive devices is paramount in creating a smooth and logical flow of information. Phrases like "in contrast," "furthermore," and "similarly" guide the readerthrough the data, highlighting relationships and comparisons. Don't be a one-trick pony (idiom, origin unknown), relying solely on basic linking words like "and" or "but." Explore a variety of transition words to enhance the coherence of your writing. Another key aspect is the structure of the essays. Each sample follows a clear format, typically beginning with an introductory overview of the data, followed by detailed descriptions of key trends and comparisons. Thislogical progression ensures that the reader can easily follow the information presented. Keep it short and sweet (idiom, origin unknown) in your introduction, offering a concise summary of the main points. Remember, the body paragraphs are where you delve into the specifics. Moreover, the essays effectively utilize a range of grammatical structures. Complex sentences with multiple clauses allow for the presentation of detailed information in a concise manner. For instance, "While the number of cars remained relatively stable, the use of public transportation experienced a dramatic increase, suggesting a shift in commuting preferences." Variety is the spice of life (idiom, origin unknown) applies to sentence structureas well. Don't be afraid to experiment with different sentence lengths and structures to keep your writing engaging. Finally, the essays demonstrate a keen eye for detail. Specific data points are mentioned to support the overall analysis, lending credibility and depth to the writing. For instance, "The most significant increase in electricity consumption occurred between 2005 and 2010, rising from 25% to 40% of total energy use." The devil is in the details (idiom, origin: Medieval belief) highlights the importance of using specific data points to bolster your analysis. By carefully analyzing the sample essays in Cambridge 12, we can glean valuable insights into effective writing strategies for IELTS Task 1. Remember, practice makes perfect (idiom, origin unknown) - the more you write and analyze, the more comfortable and proficient you will become in tackling this task. So,roll up your sleeves (idiom, origin: preparing for physical work) and startcrafting essays that not only describe data accurately but also showcase your linguistic prowess and analytical skills.。
1、 How do you feel about writing in English?2 The marking criteria• Task achievement / Task response•Coherence and cohesion•Lexical resource•Grammatical range and accuracy3、In Task 1 of the IELTS Academic Paper you will be asked to describe a chart(bar/pie), line graphs(曲线图),table, diagram or map. You need to write at least 150 words. It’s best to spend 20 minutes on Task 1 to leave yourself enough time for Task 2 (remember Task 2 is worth more marks).Structure:1、topic2、the main trends3、significant data points which illustrate the main trend(notevery detail )4、conclusion(optional)建议:1、the reader should be able to see the chart in his mind when he reads your answer2、it is critical you select the right informationExaminers look for those essays identifying the significant and main trends as opposed to the mechanical description of all the data. Practice this skill by discussing the main points to be included in an essay with other students or friends in Chinese before worrying about expressing this in writing in English.Spend a few minutes with each question identifying 2-3 main and significant points in the diagram.Skill IYou should spend approximately 20 minutes planning and writing your task 1 answerBefore you begin writing your task 1 response, you need to spend 2-3 minutes analyzing the chart.If you do not do this, you may misinterpret the chart or miss out important main trends or detailsIf you analyse carefully, you help yourself to write a clear, thorough and well-planned answer.Follow these 4 key points:1 read and understand the topic2 check the time scale(时间标记) and the units of measurement (计量单位)3 find the main trends4 choose the significant data pointsRubric(题目)AutomateStandby power 待机电力1 what is the topic of this chart2 what are the units of measurement ?3 what is the time frame of this chart? Is it past, present and/or future or is it a fact chart(i.e. always true)? What verb tense should you use?4 what are the main trends?5 what are the significant data points?Skill 2 writing topic sentence and finding main trendsYour first sentence needs to describe the topic of the chart, and the following sentences should describe the main trends of the charts.You need to change the words used in the rubic. You can change the grammar or the words. Do not copy the chunks of the rubric exactlyRemember, your task is to make a clear and accurate picture for the reader. Writing a main trend sentence is an important part of creating a clear pictureMain trend sentence should go after your topic sentence. You should write one or two sentences about main trends.Skill 3After you have described the topic and the main trends, you need to write about the details of the chartCandidates who try to describe every data point do not get good scores on Task 1 writing answers. Remember , you are making a clear picture for the reader. Your job is to select the significant data points to do thisYou also need to group the data to help the reader to picture and understand the chart. Grouping the data is key to effective coherence in your writing.Skill 4 describing trendsIn the details paragraphs, you must summarise the information shown in the graph. You must include data, but also describe trends as you do so.Try to vary your sentence structures and vocabulary. Demonstrating a wide range of grammar and vocabulary, used at the right time and in the right way, is central to getting high scores in these two criteria.If you regularly repeat the same vocabulary and grammar, you will not get a high band score.Research and practice some different vocabulary and sentence structures. For example, activity 8 has provided you with a list of ways to express the idea of using something.Make your own lists of other useful language by studying other sample answers, and refer to these frequently.Learn a few items well. Do not try to learn too many structures without knowing how to use them appropriatelyLook for:Language to describe rising and fallingCompare and contrast(the sky of the equator appears more orderly than it does further south and further north)Average trends and unusual data points (far higher or lower than average)Skill 5 comparing and contrastingStructures for comparing and contrasting are very important when writing good task 1 answers.Some useful structuresComparative and superlative structuresBy far the most /the highest/the lowest……X is significantly greater /smaller than YX spent (50%/a great deal)more /less(time/money)on…..than YX spent the least /the most …on…SimilarBoth x and YX and y show a similar patternOppositeWhereas /while….illustrates a different trendHoweverIn contrast, onlyHere are some tips to help you with the task:•Read the question carefully and make sure you understand the graph, chart, table, diagram or map. Be clear about what you are describing.•Write a short introduction by paraphrasing the question (i.e.rewrite the question in your own words).•Be sure to give a summary (i.e. look at the big picture –what’s happening overall. There’s no need to mention any numbers in this part.)•Try to use a variety of sentence structures and vocabulary. •Separate your paragraphs.•Choose the key information to describe or compare.•Make comparisons where you can. Avoid simply stating what is in the question.•Describe specific details. Use the numbers in the chart, table or graph to help you describe the key points.•Divide your main description into 2 paragraphs. This will help you to have a clear structure and organisation; especiallyimportant when the question has two separate diagrams, tables or maps.A couple of things to avoid:•Describing every single detail – there are usually a lot of numbers. You don’t need to mention them all.•Giving reasons or sharing your opinions - the question will not ask you to do this.A Task 1 example复习评分标准For this task, students looked at a bar chart showing changes in average house prices in a number of cities over time. They were asked to summarise the information and make comparisons.Here’s the answer:The illustration presents data on shifts in average home worths between 1990 and 2002 in five various cities. It is contrasted with the average house prices in 1989. It is clear that there is an erratic pattern of variation between these periods.On the average, there is a negative deflection of prices from 1990 to 1995. Sixty percent of the five cities shows a lower than zero percentage change from the 1989 prices. The involved areas are New York, London and Tokyo. On the positive side, Madrid and Frankfurt gained an above zero change.From 1996 to 2002, most of the cities have an average house price above zero. The peak percentage change was reached with more than ten percent of the marks. Tokyo was the only city with a negative deflection in this time period.Among the five places, two cities showed a consistent positive change in the average house prices. On the other hand, Tokyo remained below negative in a twelve year period. This comprises 10% of the total areas.In conclusion, the average house prices in the period for 1990 to 2002 is varied. The percentage changes also differ in comparison from the 1989 prices.4、Academic Writing Task 2 - question types and essay formatsIn the Academic Task 2 essay you may be asked from a range of questions. Whatever the question, it’s good to have an essay structure in mind. A four-paragraph structure is the most common, and the easiest to adapt to different questions.Before you take the test, practice using the structure so you can plan your essay quickly on the day of the test.Here are some possible question types and four-paragraph structures to match:(1)Agree or DisagreeMany children these days have an unhealthy diet. Both schools and parents are equally responsible for solving this problem. To what extent do you agree or disagree with this statement?1 Introduction: paraphrase the question and give a general answerthat will summarise your opinion2 Main paragraph 1: I agree/disagree because … + supportingreasons3 Main paragraph 2: Another reason I agree / disagree is …4 Conclusion: paraphrase your argument and sum up.(2)Advantages or Disadvantages outweigh each otherIn some countries, governments are encouraging people to use their cars less and to take public transport instead. Do the advantages of this trend outweigh the disadvantages?1 Introduction: topic and give your opinion (more advantages ordisadvantages?)2 Main paragraph 1: Advantages3 Main paragraph 2: Disadvantages4 Conclusion: summarise your opinion in a different way from theintroduction(3)Problem and SolutionCrime rates tend to be higher in cities than in smaller towns. Explain some possible reasons for this problem and suggest some solutions.1 Introduction: topic and general answer to question2 Main paragraph 1: Give reasons for problem3 Main paragraph 2: Offer some solutions4 Conclusion: summarise (and paraphrase) your argument(4)Discuss two views plus your opinionSome people say children use technology too much these days. Others believe that using technology now will help them in the future. Discuss both these views and give your opinion.1 Introduction: topic and give your opinion2 Main paragraph 1: Discuss one view3 Main paragraph 2: Discuss second view4 Conclusion: summarise (and paraphrase) your opinion(5)Two-part questionsSome people think that history as a subject at school is not useful and should be replaced with a more practical subject. Why do you think it is important to learn about history? What would be the effect if children were not taught history?1 Introduction: topic and give an overall answer to both questions2 Main paragraph 1: Answer first question3 Main paragraph 2: Answer second question4 Conclusion: summarise both answersOne or two general points:•Introduce the topic by paraphrasing the question•Try to give two or three ideas in each paragraph•Always support your ideas with examples•Make sure examples are quite general – not personal examples •Conclude by summarising your opinion in a different way from the into (paraphrase)A Task 2 example2084 commentsNow look at an answer to a Task 2 question. In this question learners were asked to talk about job satisfaction. What does job satisfaction mean to the individual and what does it mean in a wider context?Here’s one student’s answer:As adults, many people find they have less time on their hands to spend on themselves. This usually occurs in adulthood because people tend to spend most of their time on working on their career. With all the hours put into building a career, it is important to have a job that can cater to a person’s needs.There are several factors that contribute to job satisfaction. First and foremost, it is important that there is a healthy work place environment. This is essential for keeping a person in a good state of mind and body. It is also vital for a person to love his or her job, whether it is writing for a newspaper or walking on the moon. When people are passionate about what they do, they will not have to work a day in their lives. However, it is important to keep in mind that money does matter. Though it would be idial to have a wonderful job and high salary, it is not always the case. It is important for these two elements to meet in the middle to have a truly satisfying job.Having job satisfaction can easily be achieved if a person remembers those three ideas. As long as a person has the right credentials, there will always be an opportunity to find a job he or she will love. Reaching job satisfaction is not impossible if a person shows great interest in his or her work, receives a good salary and has a good environment having a satisfying job is easy to do.What do you think about this answer? Share your comments.Cork - the thick bark of the cork oak tree (Quercus suber) - is a remarkable material. It is tough, elastic, buoyant, and fire-resistant, and suitable for a wide range of purposes. It has also been used for millennia: the ancient Egyptians sealed their sarcophagi (stone coffins) with cork, while the ancient Greeks and Romans used it for anything from beehives to sandals.And the cork oak itself is an extraordinary tree. Its bark grows up to 20cm in thickness, insulating the tree like a coat wrapped around the trunk and branches and keeping the inside at a constant 20°C all year round. Developed most probably as a defence against forest fires, the bark of the cork oak has a particular cellular structure - with about 40 million cells per cubic centimetre - that technology has never succeeded in replicating. The cells are filledwith air, which is why cork is so buoyant. It also has an elasticity that means you can squash it and watch it spring back to its original size and shape when you release the pressure.Cork oaks grow in a number of Mediterranean countries, including Portugal, Spain, Italy, Greece and Morocco. They flourish in warm, sunny climates where there is a minimum of 400 millimetres of rain per year, and not more than 800 millimetres. Like grape vines, thetrees thrive in poor soil, putting down deep roots in search of moisture and nutrients.Southern Portugal’s A lentejo region meets all of these requirements, which explains why, by the early 20th century, this region had become the world’s largest producer of cork, and why today it accounts for roughly half of all cork production around the world.Most cork forests are family-owned. Many of these family businesses, and indeed many of the trees themselves, are around 200 years old. Cork production is, above all, an exercise in patience. From the planting of a cork sapling to the first harvest takes 25 years, and a gap of approximately a decade must separate harvests from an individual tree. And for top-quality cork, it’s necessary to wait a further 15 or 20 years. You even have to wait for the right kind of summer’s day to harvest cork. If the bark is stripped on a day when it’s too cold - or when the air is damp - the tree will be damaged.Cork harvesting is a very specialised profession. No mechanical means of stripping cork bark has been invented, so the job is done by teams of highly skilled workers. First, they make vertical cuts down the bark using small sharp axes, then lever it away in pieces as large as they can manage. The most skilful cork-strippers prise away a semi-circular husk that runs the length of the trunk from just above ground level to the first branches. It is then dried on the ground for about four months, before being taken to factories, where it is boiled to kill any insects that might remain in the cork. Over 60% of cork then goes on to be made into traditional bottle stoppers, with most of the remainder being used in the construction trade. Corkboard and cork tiles are ideal for thermal and acoustic insulation, while granules of cork are used in the manufacture of concrete.Recent years have seen the end of the virtual monopoly of cork as the material for bottle stoppers, due to concerns about the effect it may have on the contents of the bottle. This is caused by a chemical compound called 2,4,6-trichloroanisole (TCA), which forms through the interaction of plant phenols, chlorine and mould. The tiniest concentrations - as little as three or four parts to a trillion - can spoil the taste of the product contained in the bottle. The result has been a gradual yet steady move first towards plastic stoppers and, more recently, to aluminium screw caps. These substitutes are cheaper tomanufacture and, in the case of screw caps, more convenient for the user.The classic cork stopper does have several advantages, however. Firstly, its traditional image is more in keeping with that of the type of high quality goods with which it has long been associated. Secondly - and very importantly - cork is a sustainable product that can be recycled without difficulty. Moreover, cork forests are a resource which support local biodiversity, and prevent desertification in the regions where they are planted. So, given the current concerns about environmental issues, the future of this ancient material once again looks promising.Passage TwoThe search for the anti-aging pillin government laboratories and elsewhere, scientist are seeking a drug able to prolong life and youthful vigor.Studies of caloric restriction are showing in get wayAs researchers on aging noted recently, no treatment on the market today has been proved to slow human aging - the build-up of molecular and cellular damage that increases vulnerability to infirmity as we grow older. But one intervention, consumption of a low-calorie* yet nutritionally balanced diet, works incredibly well in a broad range of animals, increasing longevity and prolonging good health. Those findings suggest that caloric restriction could delay aging and increase longevity in humans, too.*calorie: a measure of the energy value of foodUnfortunately, for maximum benefit, people would probably have to reduce their caloric intake by roughly thirty per cent, equivalent to dropping from 2,500 calories a day to 1,750.Few mortals could stick to that harsh a regimen, especially for years on end.But what if someone could create a pill that mimicked the physiological effects of eating less without actually forcing people to eat less?Could such a ‘caloric-restriction mimetic', as we call it, enable people to stay healthy longer, postponing age-related disorders (such as diabetes, arteriosclerosis, heart disease and cancer) until very late in life?Scientists first posed this question in the mid-1990s, after researchers came upon a chemical agent that in rodents seemed to reproduce many of caloric restriction's benefits. No compound that would safely achieve the same feat in people has been found yet, but the search has been informative and has fanned hope that caloric-restriction (CR) mimetics can indeed be developed eventually.The benefits of caloric restrictionThe hunt for CR mimetics grew out of a desire to better understand caloric restriction's many effects on the body. Scientists first recognized the value of the practice more than 60 years ago, when they found that rats fed a low-calorie diet lived longer on average than free-feeding rats and also had a reduced incidence of conditions that become increasingly common in old age. What is more, some of the treated animals survived longer than the oldest-living animals in the control group, which means that the maximum lifespan (the oldest attainable age), not merely the normal lifespan, increased. Various interventions, such as infection-fighting drugs, can increase a population's average survival time, but only approaches that slow the body's rate of aging will increase the maximum lifespan.The rat findings have been replicated many times and extended to creatures ranging from yeast to fruit flies, worms, fish, spiders, mice and hamsters. Until fairly recently, the studies were limited to short-lived creatures genetically distant from humans. But caloric-restriction projects underway in two species more closely related to humans - rhesus and squirrel monkeys - have made scientists optimistic that CR mimetics could help people.The monkey projects demonstrate that, compared with control animals that eat normally, caloric-restricted monkeys have lower body temperatures and levels of the pancreatic hormone insulin, and they retain more youthful levels of certain hormones that tend to fall with age.The caloric-restricted animals also look better on indicators of risk for age-related diseases. For example, they have lower blood pressure and triglyceride levels (signifying a decreased likelihood of heart disease), and they have more normal blood glucose levels (pointing to a reduced risk for diabetes, which is marked by unusually high blood glucose levels). Further, it has recently been shown that rhesus monkeys kept on caloric-restricted diets for an extended time (nearly 15 years) have less chronic disease. They and the other monkeys must be followed still longer, however, to know whether low-calorie intake can increase both average and maximum lifespans in monkeys. Unlike the multitude of elixirs being touted as the latest anti-aging cure, CR mimetics would alter fundamental processes that underlie aging. We aim to develop compounds that fool cells into activating maintenance and repair.How a prototype caloric-restriction mimetic worksThe best-studied candidate for a caloric-restriction mimetic, 2DG (2-deoxy-D-glucose), works by interfering with the way cells process glucose. It has proved toxic at some doses in animals and so cannot be used in humans. But it has demonstrated that chemicals can replicate the effects of caloric restriction; the trick is finding the right one. Cells use the glucose from food to generate ATP (adenosine triphosphate), the molecule that powers many activities in the body. By limiting food intake, caloric restriction minimizes the amount of glucose entering cells and decreases ATP generation. When 2DG is administered to animals that eat normally, glucose reaches cells in abundance but the drug prevents most of it from being processed and thus reduces ATP synthesis. Researchers have proposed several explanations for why interruption of glucose processing and ATP production might retard aging. One possibility relates to the ATP-making machinery's emission of free radicals, which are thought to contribute to aging and to such age-related diseases as cancer by damaging cells. Reduced operation of the machinery should limit theirproduction and thereby constrain the damage. Another hypothesis suggests that decreased processing of glucose could indicate to cells that food is scarce (even if it isn't) and induce them to shift into an anti-aging mode that emphasizes preservation of the organism over such ‘luxuries' as gr。

IELTS 11, TEST 1, WRITING TASK 1 sample answer BAND 7.5The charts below show the percentage of water used for different purposes in six areas of the world.Summarise the information by selecting and reporting the main features, and make comparisons where relevant.图表省略,请参照剑11, test 1, writing task 1The charts give information about how water is used across 6 areas in the world for different purposes, such as industrial use, agricultural use and domestic use.第一段:改写题目。
原文show 可替换成describe, illustrate, depict, tell, let us know 等等。
本文使用官方最喜欢的give information about 反客为主,有点意思。
The percentage of water used in... 改为how water is used... 避免重复。
原文in 可换成across + 不同地区。
For different purposes 改到最后写。
总之就要看起来不一样,但意思一样。
Generally speaking, water for agricultural use plays a dominant role(71%-88%) in 4 areas out of the 6, and it is still in the second place in the rest 2 areas, North America(39%) and Europe(32%), which use approximately half of their total water in industrial fields. On the contrary, the 4 areas mentioned above are ...第二段:把不同项目从大到小进行描述,有条理性。
IELTS 11, TEST 2, WRITING TASK 1 sample answer BAND 7.5The charts below show the proportions of British students at one university in England who were able to speak other languages in addition to English, in 2000 and 2010.Summarise the information by selecting and reporting the main features, and make comparisons where relevant.图表省略,请参照剑11, test 2, writing task 1These two pie charts reveal the percentages of UK students who could use other languages expect for English in 2000 and 2010.第一段:题目改写。
Pie chart, 饼图。
原文show 可替换成describe, illustrate, depict, reveal, tell, let us know 等等。
Proportion = percentage 注意复数。
British = UK. 原文speak 可替换成use, with, take, obtain, master 注意时态。
In addition to 替换为other than, except for.It is notable that in 2000 Spanish was a dominant second language(30%), while 20% students did not speak any other language. Other than that, 15% of British students used French as well as the same amount of those using another language. German speaking students and those with two other languages were only 10% respectively.第二段:陈述第一个饼图的内容,把项目从大到小进行说明。

雅思G类写作part1 书信基本格式:信首主体结尾1)信首不要求些收信人姓名,只要求写:Dear Sir or Madam2)主体是信函的中心内容。
3)结尾是在写完主体及客气的话以后写。
通常些:Yours sincerely,或: Yours faithfully,(注意不要忘记那个逗号)4)签名签在“Your sincerely”的下面。
不要求考生署名。
写作原则1)信件意思清楚,表达准确的意思2)所谈问题能让对方正确的理解,不要让对方再次询问你同样的问题。
3)拼写和标点都要准确。
4)言简意赅,不说与主题无关的话。
5)用尽量少的言辞表达尽量多的意思。
6)态度诚恳严肃认真。
态度不卑不亢,看你是收件人的话是否喜欢这封信。
7)无论是提要求或回答问题都要尽可能的给对方以选择的余地。
第一篇表扬信与感谢信1.开头语就写目的:表扬谁,感谢谁。
2.简明扼要地介绍表扬或感谢的人和事,写明时间,地点,人物,过程。
3.提出你要表扬或感谢的理由。
也可以提议嘉奖方法。
4.不用过头话,不牵扯无关情节,结尾用热情的话结尾。
题目:You should spend about 20 minutes on this task.You are a commuter. One morning on your way to work you suddenly fell ill and lost your consciousness. One gentleman on the same bus sent you to a hospital.Write a letter to the company where the gentleman works to extend your gratefulness.You should write at least 150 words.You do NOT need to write your address.Begin your letter as follows:Dear Sir or Madam,例文:你每天乘车上下班。

雅思写作考官范文雅思写作Task1曲线图考官范文(3)本文为大家收集了雅思写作Task1曲线图考官范文(3)。
认真研读一定的雅思范文及作文模板可以帮助我们检验自己的写作水平,并能很好地吸收和应用优秀范文里的优秀内容。
The line graph below shows the number of annual visits to Australia by overseas residents. The table below gives information on the country of origin where the visitors came from.Write a report for a university lecturer describing the information given.Sample Answer:The given line graph and table give data on the number of overseas visitors traveling to Australia in millions of people from the year 1975 to xx and shows the number of travellers from 6 different parts of the world.As is presented in the illustration, the number of visitors traveling to Australia raised steadily and the majority of these visitors came from Japan, South Korea and Europe. Almost 10 million people visited Australia in the year 1975 and this amount increased to over 15 million after 10 years. In the year 1995, the total visitor traveled Australia was approximately 24 million and finally in xx well over 30 million.The second table gives data on the number of visitors from 6 different regions who came to visit Australia in 2 different years with a 30 years interval. Both in 1975 and in xx, Australia had the largest number of Japanese tourists followed by South Korea. In xx, tourists from these 2 countries who came to visit Australia were about 20 million while 4.5 million tourists came from Europe and only 1.1 million from USA. The least number of tourists came to Australia during this period are from China which was only 0.3 million in 1975 and 0.8 million in xx. The statistics of the table shows that the total tourist visited Australia from 6 different parts of the world increased significantly in 300 years amounting well over 30 million in 1xx pared to the total number of 8.8 million 30 years earlier.(Approximately 250 words)Alternative Answer:The provided graphs and table shows data on the number of overseas travelers visited Australia from the year 1975 till xx and their origin where they came from. As is observed in the line graph, in 1975 8.8 million of foreign travelers visited Australia and this numberincreased steadily each year. In xx, this visitor’s number reached to 30.4 million which is almost double than the visitors’number in 1985.The highest number of tourists came from Japan. In 1975, more than 3 million tourists came from Japan which is more than the total tourists came from Europe, Britain, China and USA. This number reached to 12 million in xx which contributed one third of the total tourist of this year. Second largest tourist came to Australia from South Korea both in 1975 and in xx. From Chinese tourist are the lowest in number among the 6 regions.In short, the number of total tourist who came to visit Australia increased steadily and the highest number of tourist came from Asia, specifically from Japan and SouthKorea.(Approximately 177 words)雅思写作Task2考官范文:政府类(4)本文收集了雅思写作Task2考官范文:政府类(4)。
雅思小作文模板c17t3C17T3: 雅思小作文模板。
Introduction:In today's fast-paced world, the ability to communicate effectively in English has become increasingly important. As a result, the International English Language Testing System (IELTS) has gained popularity as a standardized test for assessing English language proficiency. This essay will discuss the C17T3 IELTS writing task 1 and task 2, providing a comprehensive template for candidates to follow.Task 1:The C17T3 IELTS writing task 1 requires candidates to write a report based on a given visual data, such as a graph, chart, or table. The report should include an overview of the information, as well as specific details and comparisons where relevant. To effectively structure the report, candidates can follow the following template:Introduction: Describe the visual data and provide an overview of the main trends or key points.Body Paragraph 1: Provide specific details about the data, such as the highest and lowest values, significant changes over time, or comparisons between different categories.Body Paragraph 2: Continue to provide specific details, focusing on additional trends or comparisons as necessary.Conclusion: Summarize the main points and restate the key findings from the visual data.By following this template, candidates can ensure that their report is well-organized and covers all the necessary information. Additionally, they should aim to use a range of vocabulary and grammatical structures to demonstrate their language proficiency.Task 2:The C17T3 IELTS writing task 2 requires candidates to write an essay in response to a specific question or statement. The essay should present a clear position on the given topic, supported by relevant examples and arguments. To effectively structure the essay, candidates can follow the following template:Introduction: Clearly state the topic and provide a thesis statement that outlines the candidate's position.Body Paragraphs: Present supporting arguments and examples, with each paragraph focusing on a single point. Use topic sentences to introduce each argument and provide evidence to support it.Counter-argument: Acknowledge and refute potential counter-arguments, demonstrating an awareness of different perspectives.Conclusion: Summarize the main points and restate the thesis statement, emphasizing the candidate's position on the topic.By following this template, candidates can ensure that their essay is well-structured and persuasive. They should aim to use a variety of sentence structures and cohesive devices to connect their ideas and create a coherent argument.Conclusion:In conclusion, the C17T3 IELTS writing task 1 and task 2 can be effectively approached using the templates provided above. By following these structures, candidates can ensure that their writing is well-organized, coherent, and demonstrates their English language proficiency. With practice and attention to detail, candidates can improve their performance in the IELTS writing test and achieve their desired scores.。
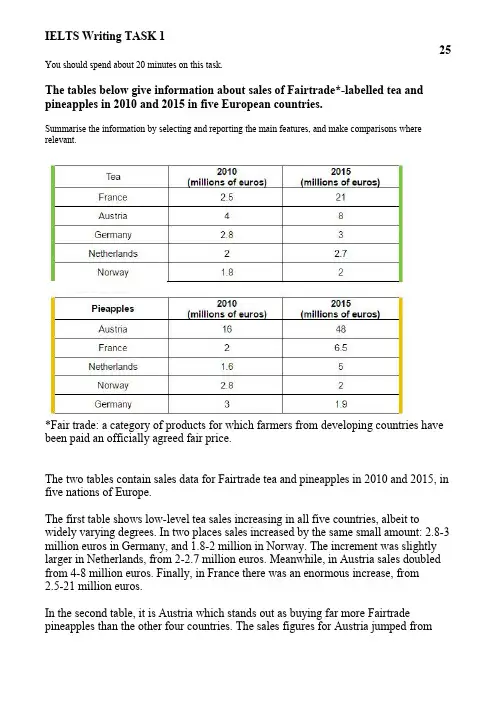
You should spend about20minutes on this task.The tables below give information about sales of Fairtrade*-labelled tea and pineapples in2010and2015in five European countries.Summarise the information by selecting and reporting the main features,and make comparisons where relevant.*Fair trade:a category of products for which farmers from developing countries have been paid an officially agreed fair price.The two tables contain sales data for Fairtrade tea and pineapples in2010and2015,in five nations of Europe.The first table shows low-level tea sales increasing in all five countries,albeit to widely varying degrees.In two places sales increased by the same small amount:2.8-3 million euros in Germany,and1.8-2million in Norway.The increment was slightly larger in Netherlands,from2-2.7million euros.Meanwhile,in Austria sales doubled from4-8million euros.Finally,in France there was an enormous increase,from2.5-21million euros.In the second table,it is Austria which stands out as buying far more Fairtrade pineapples than the other four countries.The sales figures for Austria jumped from16-48million euros across these five years,while in France and Netherlands sales only grew from2-6.5and from1.6-5million euros respectively.Norway and Germany showed a different pattern,with falls in pineapple sales from2.8-2and3-1.9million euros.Comparing the two tables,it is clear that in2010Fairtrade tea sales ranged from1.8-4 million euros in these five countries,while pineapple sales also mostly clustered between1.6and3million euros,with Austria the outlier at a huge16million euros. By2015,sales figures for both products had risen across the board,except for Norway and Germany which recorded drops in pineapple sales.(225words)。
雅思14tast1作文TEST 1WRITING TASK 1You should spend about 20 minutes on this task.The charts below show the average percentages in typical meals of three types of nutrients, all of which may be unhealthy if eaten too much.Summarise the information by selecting and reporting the main features, and make comparisons where relevant.Write at least 150 words.【答案解析】这是⼀道静态多饼图题,分析美国⼀常饮⼀(⼀⼀三餐和零⼀)中钠、饱和脂肪和糖类的含量占⼀。
多图题的分析原则是尽量⼀张图写完再写另外⼀张,不要来回跳着写,尤其是对于这种彼此之间没有明确关联的静态多图题⼀⼀,写作的过程中保证思路的清晰和逻辑的⼀致是最重要的。
单张饼图按照占⼀从⼀到⼀或从⼀到⼀进⼀描述。
题⼀中没有明确时间的话,整体时态采⼀⼀般现在时即可。
【参考答案】The three pie charts demonstrate average proportions of sodium, saturated fats and added sugars in typical meals eaten in the USA. Breakfast, lunch, dinner and snacks are involved in investigated meals.As for the absorption of sodium, nearly half of sodium is taken in dinner (43%), which is 14% larger than the share of sodium consumed in lunch. Breakfast and snacks both contain 14% of the sodium, half of the share of sodium in lunch.In terms of saturated fat, the share of it in dinner still ranks the first at 37%, followed by the figure in lunch at 26%. There is 21% of saturated fat in snacks, 5% larger than the figure in breakfast.For added sugar, its percentage in snacks is the largest at 42%, quite close to the share of sodium in dinner. The share of added sugar in dinner is 19% less than that in snacks, which is the same to the figure of sugar in lunch. Only 16% of added sugar can be found in breakfast.In conclusion, except added sugar, dinner contains the largest proportion of sodium and saturated fat compared to other three types of meals.。
ielts academic writing task1 教案教案:IELTS Academic Writing Task 1教学目标:- 了解和理解IELTS Academic Writing Task 1的要求和评分标准- 学习如何组织和写作各种类型的Task 1报告- 提高学生的数据分析和描述能力- 提高学生的写作和组织能力教学材料:- IELTS Academic Writing Task 1的样本题目和参考答案- 一些真实或模拟的数据表格、图表或图示(例如柱状图、折线图、饼图、流程图等)教学步骤:步骤1:介绍IELTS Academic Writing Task 1- 解释Task 1的要求和格式:学生需要写一篇150字左右的报告,对给定的图表、图示或表格进行描述和分析。
- 强调重要的写作技巧,例如选择最重要的数据和信息进行描述,使用适当的词汇和语法,确保句子的连贯性和一致性。
步骤2:讲解Task 1的不同类型和写作方法- 解释不同类型的Task 1问题,例如静态图表、动态图表、比例图、流程图等,以及相应的写作方法。
- 提供一些例子并进行详细的说明和讨论,让学生了解如何在不同类型的图表下撰写合适的报告。
步骤3:演示如何编写Task 1报告- 展示给学生一份Task 1问题和相应的数据表格、图表或图示。
- 演示如何仔细观察图表和提取关键信息,然后按照逻辑顺序编写报告。
- 强调使用适当的表达方式和连接词,例如使用比较级和最高级进行描述,使用过渡词进行句子和段落之间的连接。
步骤4:学生练习- 提供一些真实或模拟的Task 1问题和相应的数据表格、图表或图示,让学生独立完成报告的撰写。
- 学生可以在考试模拟环境下进行练习,或者在教师的指导下逐步完成。
步骤5:互相评估和讨论- 学生互相交换他们的报告,并对彼此的写作进行评估和讨论。
- 强调评估的标准,例如语言表达的准确性、句子结构的连贯性、数据描述的完整性等。
The chart and graph below give information about sales and share prices for Coca-Cola.Write a report for a university lecturer describing the information shown below.You should write at least 150 words.You should spend about 20 minutes on this task.Model answer:The pie chart shows the worldwide distribution of sales of Coca-Cola in the year 2000 and the graph shows the change in share prices between 1996 and 2001.In the year 2000, Coca-Cola sold a total of 17.1 billion cases of their fizzy drink product worldwide. The largest consumer was North America, where 30.4 per cent of the total volume was purchased. The second largest consumer was Latin America. Europe and Asia purchased 20.5 and 16.4 per cent of the total volume respectively, while Africa and the Middle East remained fairly small consumers at 7 per cent of the total volume of sales.Since 1996, share prices for Coca-Cola have fluctuated. In that year, shares were valued at approximately $35. Between 1996 and 1997, however, prices rose significantly to $70 per share. They dipped a little in mid-1997 and then peaked at $80 per share in mid-98. From then until 2000 their value fell consistently but there was a slight rise in mid-2000.Written by Rad DaneshThe chart below gives information about global sales of games software, CDs and DVD or video. Write a report for a university lecturer describing the information.You should write at least 150 words.You should spend about 20 minutes on this task.Model answer:The chart shows the changes in the sales of video material / DVDs, games software and CDs around the world in billions of dollars over a three-year period. It can be seen that the sales of videos / DVDs and games software have increased, while the sales of CDs have gone down slightly.Between 2000 and 2003, the sale of videos and DVDs rose by approximately 13 billion dollars. In 2000, just under 20 billion dollars worth of these items were sold, but in 2003, this figure had risen to a little over 30 billion dollars.The sales of games software also rose during this period, but less sharply. Sales increased from about 13 billion dollars in 2000 to just under 20 billion dollars three years later. By contrast, during the same time period, the sale of CDs fell from 35 billion dollars in 2000 to about 32.5 billion dollars in 2003.Written by Rad DaneshThe graphs below show the types of music albums purchased by people in Britain according to s3x and age.Write a report for a university lecturer describing the information shown below.You should write at least 150 words.You should spend about 20 minutes on this task.Model answer:The three graphs provide an overview of the types of music people purchase in the UK. At first glance we see that classical music is far less popular than pop or rock music.While slightly more women than men buy pop music, the rock market is dominated by men with 30% buying rock, compared to 17% of women. From the first graph we see that interest in pop music is steady from age 16 to 44 with 20% of the population continuing to buy pop CDs after the age of 45.The interest in rock music reaches its peak among the 25 to 34 year olds, though it never sells as well as pop. Interest also drops off after the age of 35 with an even sharper fall from age 45 onwards, a pattern which is the opposite to the classical music graph.雅思A类TASK1(图表)官方范文(4)You should spend about 20 minutes on this task.The graphs below show the numbers of male and female workers in 1975 and 1995 in several employment sectors of the republic of Freedonia.Write a report for a university teacher describing the information shown.You should write at least 150 words.The two decades between 1975 and 1995 brought significant changes in the representation of women in Freedonia's work force, according to the graphs.In 1975, for example, some 300 000 men and 250 000 women worked in the communications sector. Twenty years later, though the number of men remained unchanged, the number of women rose to 550 000.A similar situation was seen in the wholesale and retail trade sector, where the number of women rose from about 550 000 in 1975 to almost 800 000 two decades later. The number of men in this sector remained stable over the period, at around 700 000.Women also made gains in both the finance/banking industries and in the defence-related public sector. Whereas some 125 000 women worked in finance and banking institutions in 1975, the number increased to 450 000 by 1995. The number of men grew only marginally from 425 000 to 480 000 over the same period. In defence, the number of men declined from 225 000 to 200 000, while the number of women rose from 25 000 to over 100 000.Two sectors that retained stable employment numbers for both men and women were manufacturing, which had about 300 000 women and 650 000 men in both surveyed years, and the public sector (non-defence), which employed 650 000 women and 850 000 men.Thus, women appear to have made gains in the Freedonian work force but not at the expense of men.Written by Rad DaneshYou should spend about 20 minutes on this task.Eating sweet foods produces acid in the mouth, which can cause tooth decay. (High acid levels are measured by low pH values)Describe the information below and discuss the implications for dental health.You should write at least 150 words.model answer:Anyone who has visited a dentist has been told that eating excessive amounts of sweets risks harming the teeth. This is because sweets lower pH levels in the mouth to dangerous levels.When the pH level in the mouth is kept above 5.5, acidity is such that teeth are unlikely to be in danger of decay. Sweet foods, however, cause pH in the mouth to drop for a time, and the longer pH levels remain below 5.5, the greater the opportunity for decay to occur.By comparing fruit sugar, cane sugar and honey, which are all common ingredients of sweet foods, we find that cane sugar lowers pH levels for the longest period, thus producing the greatest risk of the three. Approximately five minutes aftfter consuming cane sugar, pH levels drop to as little as pH 3.5. They then begin to rise slowly, but do not rise above pH 5.5 until at least 30 minutes have elapsed. By contrast, fruit sugar, which causes the mouth's acidity to fall to just above pH 4, poses a danger for a shorter period: tooth decay is unlikely 20 minutes after consumption. Honey appears an even less risky substance. Though acidity falls to about pH 4.75 within five minutes of consumption, it returns to above pH 5.5 in under fifteen minutes.The implications, then, are that people who insist on eating sweet foods should be aware of the ingredients, and that fruit sugar or honey appear preferable to cane sugar.Written by Rad DaneshThe diagram below shows the typical stages of consumer goods manufacturing, including the process by which information is fed back to earlier stages to enable adjustment.Write a report for a university lecturer describing the process shown.You should write at least 150 words.You should spend about 20 minutes on this task.Model answer:Most consumer goods go through a series of stages before they emerge as finished products ready for sale.Raw materials and manufactured components comprise the initial physical input in the manufacturing process. Once obtained, these are stored for later assembly. But assembly first depends upon the production planning stage, where it is decided how and in what quantities the stored materials will be processed to create sufficient quantities of finished goods. The production planning stage itself follows the requirements of the goods' design stage that proceeds from extensive research. After assembly, the products are inspected and tested to maintain quality control l Those units that pass the inspection and testing stages are then packaged, despatched and offered for sale in retail outlets. The level of sales, which is the end point of the manufacturing process, helps determine production planning.A product's design is not only the result of product research, but is also influenced by testing and market research. If the testing stage (after assembly and inspection) reveals unacceptable problems in the finished product, then adjustments will have to be made to the product's design. Similarly, market research, which examines the extent and nature of the demand for products, has the role of guiding product design to suit consumer demands which may change with time. Market research, while influenced by product sales, also serves to foster future sales by devising suitable advertising for the goods.Thus the reality of consumer goods manufacturing goes well beyond a simple linear production process.Written by Rad Danesh雅思A类TASK1(图表)官方范文(7)The table below shows social and economic indicators for four countries in 1994, according to United Nations statistics.Describe the information shown below in your own words. What implications do the indicators have for the countries?You should write at least 150 words.Allow yourself 20 minutes for this task.雅思A类TASK1(图表)官方范文(8)The diagram below shows the average hours of unpaid work per week done by people in different categories. (Unpaid work refers to such activities as childcare in the home, housework and gardening.)Describe the information presented below, comparing results for men and women in the categories shown. Suggest reasons for what you see.You should write at least 150 words.You should spend about 20 minutes on this task.Model answer:The diagram reveals that the number of hours per week spent in unpaid work is unequally distributed between men and women.In households where there are no children, women are reported to work some 30 hours per week in such tasks as housework and gardening. Men's contribution to these unpaid jobs averages a considerably lower 18 hours.When children enter the household, however, the inequality becomes even more pronounced. In families of 1 - 2 children, men maintain approximately the same number of hours of unpaid work as in childless households, but the number of hours women work in the home rises to 52 per week, much of it, on doubt, due to childcare responsibilities.Interestingly, when there are three or more children in the household, men are found to work even fewer hours around the house than before the appearance of the third child. Whereas women'sunpaid hours rise to approximately 56 per week, the corresponding figure for men, 16, actually represents a decrease.The data suggest that the increased presence of women in the paid work force has yet to lead to an increased role for men in the home.Written by Rad Danesh雅思A类TASK1(图表)官方范文(9)The chart below shows the amount of leisure time enjoyed by men and women of different employment status.Write a report for a university lecturer describing the information shown below.You should write at least 150 words.Allow yourself 20 minutes for this task.Model answer:The chart shows the number of hours of leisure enjoyed by men and women in a typical week in 1998-9, according to gender and employment status.Among those employed full-time, men on average had fifty hours of leisure, whereas women had approximately thirty-seven hours. There were no figures given for male part-time workers, but female part-timers had forty hours of leisure time, only slightly more than women in full-time employment, perhaps reflecting their work in the home.In the unemployed and retired categories, leisure time showed an increase for both sexes, as mighthave been expected. Here too, men enjoyed more leisure time over eighty hours, compared with seventy hours for women, perhaps once again reflecting the fact that women spend more time working in the home than men.Lastly, housewives enjoyed approximately fifty-four hours of leisure, on average. There were no figures given for househusbands! Overall, the chart demonstrates that in the categories for which statistics on male leisure time were available, men enjoyed at least ten hours of extra leisure time.Written by Rad Danesh雅思A类TASK1(图表)官方范文(10)Write a report for a university lecturer describing the information in the graph below.You should write at least 150 words.Allow yourself 20 minutes for this task.Model answer:The graph compares the rate of smoking in men and women in Someland between the years 1960 and 2000. It can be clearly seen that the rate of smoking for both men and women is currently declining and that fewer women have smoked throughout the period.In 1960, 600 men in every 1,000 was smoking. This number decreased gradually to 500 by 1974 and continued to decrease but more steeply to 250 in 2000. In contrast, the rate of smoking in women in 1960 was very low at only 80 in every 1,000. By 1968 this increased to 170, and increased again but more steeply to 320 in 1977. The rate of female smokers then remained stable at 320 until 1984 at which point the figures began to decline and had dropped to 200 by 2000.In conclusion we can see that the rate of smoking in men dropped throughout the whole period but was always at a higher level than the female figures. The rate of smoking in women increased until 1977 but then decreased for the rest of the period.Written by Rad Danesh雅思A类TASK1(图表)官方范文(11)Write a report for a university lecturer describing the information in the graphs below.You should write at least 150 words.Allow yourself 20 minutes for this task.Model answer:The graphs compare the number of deaths caused by six diseases in Someland in 1990 with the amount of research funding allocated to each of those diseases. It can be clearly seen that the amount of research funding in many cases did not correlate with the seriousness of the disease in terms of numbers of deaths.In 1990 there were around 0.2 million deaths from AIDS, 0.1 million deaths from leprosy, 0.3 million deaths from tropical diseases, 0.5 million deaths from diarrhoea, 0.4 million deaths from malaria and 1.8 million deaths from TB. These figures can be contrasted with the amount of funding allocated for each disease. In 1990 AIDS received 180 million dollars in research funding, leprosy 80 million dollars in research funding, tropical diseases 79 million dollars in research funding, diarrhoea 60 million dollars in research funding, malaria 50 million dollars and TB 20 million dollars in research funding.In conclusion it is clear that funding allocation for disease research in Someland is not wholly determined by the number of deaths for which each disease is responsible in a given year.Written by Rad Danesh雅思A类TASK1(图表)官方范文(12)(2010-07-20 19:05:26)Write a report for a university lecturer describing the information in the two graphs below.You should write at least 150 words.Allow yourself 20 minutes for this task.Model answer:The pie charts compare the highest level of education achieved by women in Someland across two years, 1945 and 1995. It can be clearly seen that women received a much higher level of education in Someland in 1995 than they did in 1945.In 1945 only 30% of women completed their secondary education and 1% went on to a first degree. No women had completed post-graduate studies. This situation had changed radically by 1995. In 1995, 90% of women in Someland had completed secondary education and of those, half had graduated from an initial degree and 20% had gone on to postgraduate studies. At the other end of the scale we can see that by 1995 all girls were completing lower secondary, although 10% ended their schooling at this point. This is in stark contrast with 1945 when only 30% of girls completed primary school, 35% had no schooling at all and 35% only completed the third grade.In conclusion, we can see that in the 50 years from 1945 to 1995 there have been huge positive developments to the education levels of women in Someland.Written by Rad雅思A类TASK1(图表)官方范文(13)Write a report for a university lecturer describing the information in the table below.You should write at least 150 words.Allow yourself 20 minutes for this task.Model answer:The table shows how people in different age groups spend their leisure time in Someland over the course of a year. It can be clearly seen that the amount of leisure time available varies considerably across the age groups and that people of different age levels have very different ways of spending their leisure time.According to the figures, as people age in Someland their social lives reduce. Teenagers and people in their twenties spend on average 500 hours per year on socialising and 350 hours of that time is with a group of more than 4 people. Although the total hours of socialising in their 30s, 40s,50s and 60s is fairly constant (between 300-350), socialising with more than 4 people drops dramatically to 50 hours in the 30s and 40s age groups and only 25 from 50 years old. Group and individual exercise follow a similar pattern.People of all ages spend a good part of their leisure time on entertainment such as TV/video viewing and cinema. In both cases, teenagers and retired people spend around twice as much time as those who are at working age. Home entertainment ranges from just over a thousand hours for teenagers and retired people and an average of 600 hours for everyone else. Cinema accounts for 100 hours of the teenagers and retired people’s leisure time and 25-50 hours for the rest.In conclusion we can see there is a significant trend towards solitary and smaller group activities as people grow older and that teenagers and retired people spend a lot more time on entertainment than those of working age do.雅思A类TASK1(图表)官方范文(14)Write a report describing the information in the graph below.You should write at least 150 words.You should spend about 20 minutes on this task.Model answer:The chart shows striking differences in the level of computer and Internet penetration in the Arab world.The UAE and Kuwait are by far the most computerized countries, with Lebanon a distant third. The UAE has over 150 computers for every 1000 inhabitants, compared to Kuwait's 130 and Lebanon's 60. In contrast, countries such as Egypt, Morocco and Syria have less than 20 computers per 1000 inhabitants.There are also great differences in Internet use and availability. The UAE has by far the highest proportion of users, with more than one-third of its population using the Internet. Kuwait and Lebanon are second and third again, with 100 users per thousand in Kuwait and 80 in Lebanon. In some countries the number using the Internet is negligible: Saudi Arabia has less than 20 users per thousand, and there are fewer than 5 users per thousand in Syria.One unusual feature of the graph is that Internet use does not seem to be directly related to the number of computers. In several countries (the UAE, Lebanon, Jordan and Oman), there are more Internet users per thousand people than computers. However, in other countries, such as Kuwait, Saudi Arabia and Syria, the number of Internet users is lower than the number of computers.In summary, there are major differences between computer use and Internet use in the Arab world, but the UAE clearly leads the area in both number of computers and number of internet users per capita.雅思A类TASK1(图表)官方范文(15)The graph below shows the different modes of transport used to travel to and from work in one European city in 1960, 1980 and 2000.Write a report for a university lecturer describing the information below.You should write at least 150 words.You should spend about 20 minutes on this task.model answer:The graph shows the changing patterns in commuting by train, car, tube or bus for commuters in London in the years 1960, 1980 and 2000.The number of people using trains at first rose from just under 20% in 1960 to about 26% in 1980, but then fell back to about 23% in 2000.Use of the tube has been relatively stable, falling from around 27% of commuters in 1960 to 22% in 1980, but climbing back to reach 25% by 2000.On the other hand, the use of cars increased steadily from just over 5% in 1960 to 23% in 1980, reaching almost 40% by 2000, whereas the popularity of buses has declined since 1960, falling from just under 35% in 1960 to 27% in 1980 and only 15% in 2000.The graph indicates the growing use of cars for commuting to work between 1960 - 2000, and the corresponding decline in the popularity of buses from being the most popular mode of transport in 1960 to the least popular in 2000.雅思A类TASK1(图表)官方范文(16)Write a report for a university lecturer describing the information below.You should write at least 150 words.You should spend about 20 minutes on this task.Model answer:The graphs show health and education spending and changes in life expectancy and infant mortality in the UAE. Overall, as the percentage spent on health and education increases, infant mortality and life expectancy improve.Graph 1 shows the percentage of GDP spent on health and education between 1985 and 1993. There were big increases in both areas. Health spending stood at about 8% in 1985 but rose to 9% in 1990 and 10% in 1993. Spending on education was even higher. It was 10% in 1985, and shot up to 14% in 1990 and 15% in 1993, a 50% increase in just 8 years.Graph 2 shows improvements in life expectancy and infant mortality between 1970 and 1992. Lifeexpectancy was just 60 in 1970 but rose to almost 72 in 1992. In contrast, the number of babies dying dropped dramatically, from 60 per 1000 in 1970 to only 22 in 1992.In conclusion, people in the UAE are living longer and healthier lives because of the government's spending on education and medical facilities.Written by Rad Danesh雅思A类TASK1(图表)官方范文(17)Write a report for a university lecturer describing the information below.You should write at least 150 words.You should spend about 20 minutes on this task.Model answer:The graph shows weekly expenditure on fast food in Britain by food and income group. There are two main trends. First, the expenditure is directly related to income. Secondly, there are differences in the types of fast food eaten by each group.The amount of money spent on fast food is related to income. People in the high-income group spent the most - over 85 pence per person per week. People in the low-income group spent the least - less than half of what the high-income earners spent.The type of fast food eaten also depends on the group. High-income earners spent 3 times more onhamburgers than people in the low-income group. Pizza was generally the least favorite food. Fish and chips was the most popular food with the low-income group but consumption was fairly similar among all groups.Written by Rad Danesh雅思A类TASK1(图表)官方范文(18)Write a report for a university lecturer describing the information below.You should write at least 150 words.You should spend about 20 minutes on this task.Model answer:The pie charts show changes in American spending patterns between 1966 and 1996.Food and cars made up the two biggest items of expenditure in both years. Together they comprised over half of household spending. Food accounted for 44% of spending in 1966, but this dropped by two thirds to 14% in 1996. However, the outlay on cars doubled, rising from 23% in 1966 to 45% in 1996.Other areas changed significantly. Spending on eating out doubled, climbing from 7% to 14%. The proportion of salary spent on computers increased dramatically, up from 1% in 1996 to 10% in 1996. However, as computer expenditure rose, the percentage of outlay on books plunged from 6% to 1%.Some areas remained relatively unchanged. Americans spent approximately the same amount of salary on petrol and furniture in both years.In conclusion, increased amounts spent on cars, computers, and eating out were made up for by drops in expenditure on food and books.雅思A类TASK1(图表)官方范文(19)Write a report for a university lecturer describing the information below.You should write at least 150 words.You should spend about 20 minutes on this task.Model answer:The graph shows changes in the amount of fast food consumed in the UK between 1970 and 1990. Several trends are apparent. First, Britons are eating more and more fast food. Secondly, the type of fast food has changed.In 1970, the most popular fast food was fish and chips. Over 300g were consumed each week. By 1990, however, this had fallen to just over 200g - a 50% drop. Consumption of other fast foods such as pizza and hamburgers increased, however. The amount of pizza eaten shot up from about 20g a week to more than 270g, overtaking fish and chips in the late 1980s. Hamburger consumption also increased, rising from about 80g in 1970 to almost 300g in 1990.Accompanying this change in the choice of foods was an increase in the amount of fast food consumed. In 1970, British consumers ate about 450g a week of fast food. In 1990, on the other hand, this had more than doubled, to 1000g.Alternative answer:The graph shows the amount of fast food eaten between 1970 and 1990 in grams per person per week. Overall, the amount of fast food eaten more than doubled.The amount of fish and chips eaten declined slightly. In 1970, the consumption was about300g/week. This fell to 220g/week in 1990.In contrast, sales of hamburger and pizza rocketed. In 1970, very little pizza was eaten - less than 50g/week. This rose to 280g/week by 1990. In the same period, hamburger sales shot up by more than 500%, from 100g/week in 1970 to 500 grams in 1990.In conclusion, although there was a big increase in the consumption of pizza and hamburger, sales of fish and chips decreased.Written by Rad Danesh雅思A类TASK1(图表)官方范文(20)Write a report describing the information in the graph below.You should write at least 150 words.You should spend about 20 minutes on this task.model answer:The chart shows striking changes in the fertility rate of women in six Gulf countries – Saudi Arabia, the UAE, Oman, Qatar, Kuwait and Bahrain between 1990 and 2000.In the ten year period, there was a decline in the number of births per woman in all countries. The biggest declines were in two countries which had low fertility rates at the start of the decade, Bahrain and the UAE.Fertility rates vary greatly between the six countries. Oman and Saudi Arabia had the highest rates, with over seven births per woman in 1990. This compared with around 4 births per woman in Bahrain and the UAE, and just 3.75 in KuwaitBy 2000, the rate had fallen below three births per woman in Kuwait, Bahrain and the UAE, with a drop of over 25% in a decade in the UAE. However, in Saudi Arabia and Oman, the rates fell by just 20%, from 7.0 to 5.5.In summary, there were major decreases in birth rates in all countries, but some countries in the region have double the fertility rate of others.Written by Rad Danesh雅思A类TASK1(图表)官方范文(21)The chart below shows the amount spent on six consumer goods in four European countries. Write a report for a university lecturer describing the information shown below.You should write at least 150 words.You should spend about 20 minutes on this task.Model answer:The chart shows that Britain, among the four European countries listed, has spent most heavily on the range of consumer goods included. In every case, British spending is considerably higher than that of other countries; only in the case of tennis racquets does another country, Italy, come close.In contrast, Germany is generally the lowest spender. This Is most evident in photographic film, where Germany spends much less than Britain. Germany only spends more than another country, France, in two cases; tennis racquets and perfumes.Meanwhile, France and Italy generally maintain middle positions, averaging approximately similar spending overall. Specifically, France spends more on CDs and photographic film but less on tennis racquets than Italy does. Italys spending on personal stereos is only marginally greater than that of France, while spending on toys is equal between the two.。
You should spend about20minutes on this task.The charts below show the reasons why people travel to work by bicycle or by car.Summarise the information by selecting and reporting the main features,and make comparisons where relevant.The first chart shows the reasons why some people in the UK prefer to cycle to work.Conversely,the second chart gives reasons for those who choose to go to work by car.The highest percentage of those who favour cycling say that this is because riding a bicycle to work is healthier than driving.30%of them gave this as a reason.The same amount of people,30%say that they cycle to work because it causes less pollution.13%of people cycle to work because it is cheaper than driving.Surprisingly,a similar amount of people said that they cycled to work because it is faster than travelling by car.In contrast to this,the percentage who prefer to travel by car because it is more comfortable is40%.The two least important reasons for going to work by car,with14%and11%respectively,is that people need to carry things to work and that it is safer than cycling to work.Finally,16%say they prefer driving because it is faster than cycling.This contrasts with the cyclists who ride to work because it is faster than driving.In general,it seems that the majority of people who cycle to work do this for health and environmental reasons.By contrast,those who travel by car want to have a more comfortable journey over longer distances.(229words)。
IELTS TASK 1 Writing band descriptors (public version)Page 1 of 2BandTask AchievementCoherence and CohesionLexical ResourceGrammatical Range and Accuracy9fully satisfies all therequirements of the task clearly presents a fully developed responseuses cohesion in such a way that it attracts no attentionskilfully manages paragraphing uses a wide range of vocabulary with very natural and sophisticated control of lexical features; rare minor errors occur only as ‘slips’ uses a wide range of structures with full flexibility and accuracy; rare minor errors occur only as ‘slips’8covers all requirements of the task sufficientlypresents, highlights andillustrates key features/bullet points clearly and appropriatelysequences information and ideas logicallymanages all aspects of cohesion well uses paragraphing sufficiently and appropriatelyuses a wide range of vocabulary fluently and flexibly to convey precise meaningsskilfully uses uncommon lexical items but there may be occasional inaccuracies in word choice and collocationproduces rare errors in spelling and/or word formation uses a wide range of structuresthe majority of sentences are error-free makes only very occasional errors or inappropriacies7covers the requirements of the task(Academic) presents a clear overview of main trends, differences or stages(General Training) presents a clear purpose, with the tone consistent and appropriate clearly presents and highlights key features/bullet points but could be more fully extended logically organises information and ideas; there is clear progression throughoutuses a range of cohesive devices appropriately although there may be some under-/over-useuses a sufficient range ofvocabulary to allow some flexibility and precisionuses less common lexical items with some awareness of style and collocationmay produce occasional errors in word choice, spelling and/or word formationuses a variety of complex structures produces frequent error-free sentences has good control of grammar andpunctuation but may make a few errors6addresses the requirements of the task(Academic) presents an overview with information appropriately selected(General Training) presents a purpose that is generally clear; there may beinconsistencies in tone presents and adequately highlights key features/bullet points but details may be irrelevant, inappropriate or inaccuratearranges information and ideascoherently and there is a clear overall progressionuses cohesive devices effectively, but cohesion within and/or betweensentences may be faulty or mechanical may not always use referencing clearly or appropriatelyuses an adequate range of vocabulary for the taskattempts to use less common vocabulary but with some inaccuracymakes some errors in spelling and/or word formation, but they do not impede communicationuses a mix of simple and complex sentence formsmakes some errors in grammar and punctuation but they rarely reduce communicationPage 2 of 25generally addresses the task; the format may beinappropriate in places (Academic) recounts detail mechanically with no clear overview; there may be nodata to support the description (General Training) may present a purpose for the letter that is unclear at times; the tone may be variable and sometimes inappropriate presents, but inadequately covers, key features/bullet points; there may be atendency to focus on detail presents information with someorganisation but there may be a lack of overall progressionmakes inadequate, inaccurate or over-use of cohesive devicesmay be repetitive because of lack of referencing and substitutionuses a limited range of vocabulary, but this is minimally adequate for the taskmay make noticeable errors in spelling and/or word formation that may cause some difficulty for the readeruses only a limited range of structures attempts complex sentences but these tend to be less accurate than simple sentencesmay make frequent grammatical errors and punctuation may be faulty; errors can cause some difficulty for the reader4attempts to address the task but does not cover all key features/bullet points; the format may be inappropriate (General Training) fails to clearly explain the purpose of the letter; the tone may be inappropriate may confuse keyfeatures/bullet points with detail; parts may be unclear, irrelevant, repetitive or inaccuratepresents information and ideas but these are not arranged coherently and there is no clear progression in the responseuses some basic cohesive devices but these may be inaccurate or repetitiveuses only basic vocabulary which may be used repetitively or which may be inappropriate for the task has limited control of word formation and/or spelling;errors may cause strain for the readeruses only a very limited range of structures with only rare use of subordinate clausessome structures are accurate but errors predominate, and punctuation is often faulty3fails to address the task, which may have beencompletely misunderstood presents limited ideas which may be largely irrelevant/repetitivedoes not organise ideas logically may use a very limited range ofcohesive devices, and those used may not indicate a logical relationship between ideasuses only a very limited range of words and expressions with very limited control of word formation and/or spellingerrors may severely distort the messageattempts sentence forms but errors in grammar and punctuation predominate and distort the meaning2 answer is barely related to the taskhas very little control of organisational featuresuses an extremely limited range of vocabulary; essentially no control of word formation and/or spelling cannot use sentence forms except in memorised phrases1 answer is completely unrelated to the task fails to communicate any message can only use a few isolated wordscannot use sentence forms at alldoes not attenddoes not attempt the task in any way writes a totally memorised response。
IELTS 5 test 1 writing task 1The graph below shows the proportion of the population aged 65 and over between 1940 and 2040 in three different countries. Summarize the information by selecting and reporting the main features, and make comparisons where relevant.The line graph compares the percentage of people aged 65 or more in three countries over a period of 100 years.It is clear that the proportion of elderly people increases in each country between 1940 and 2040. Japan is expected to see the most dramatic changes in its elderly population.In 1940, around 9% of Americans were aged 65 or over, compared to about 7% of Swedish people and 5% of Japanese people. The proportions of elderly people in the USA and Sweden rose gradually over the next 50 years, reaching just under 15% in 1990. By contrast, the figures for Japan remained below 5% until the early 2000s.Looking into the future, a sudden increase in the percentage of elderly people is predicted for Japan, with a jump of over 15% in just 10 years from 2030 to 2040. By 2040, it is thought that around 27% of the Japanese population will be 65 years old or more, while the figures for Sweden and the USA will be slightly lower, at about 25% and 23% respectively. (Band: 9)IELTS 5 test 1 writing task 2Universities should accept equal numbers of male and female students in every subject. To what extent do you agree or disagree?[Answer 1]In my opinion, men and women should have the same educational opportunities. However, I do not agree with the idea of accepting equal proportions of each gender in every university subject.Having the same number of men and women on all degree courses is simply unrealistic. Student numbers on any course depend on the applications that the institution receives. If a university decided to fill courses with equal numbers of males and females, it would need enough applicants of each gender. In reality, many courses are more popular with one gender than the other, and it would not be practical to aim for equal proportions. For example, nursing courses tend to attract more female applicants, and it would be difficult to fill these courses if fifty per cent of the places needed to go to males.Apart from the practical concerns expressed above, I also believe that it would be unfair to base admission to university courses on gender. Universities should continue to select the best candidates for each course according to their qualifications. In this way, both men and women have the same opportunities, and applicants know that they will besuccessful if they work hard to achieve good grades at school. If a female student is the best candidate for a place on a course, it is surely wrong to reject her in favor of a male student with lower grades or fewer qualifications.In conclusion, the selection of university students should be based on merit, and it would be both impractical and unfair to change to a selection procedure based on gender. (Band: 9)[Answer 2]In modern world, people attempt to educate in some universities for getting knowledge, experience and establishing social environment for their future life but universities want to find more talent and creative students. Moreover, nowadays it is widespread belief that while university admissions choosing students they must keep in their mind preserving equality between men and women. There are many arguments supporting both views, those for and those against.On one hand, it is obvious that in the past, there was a discrimination between men and women and men excelled women in all positions of society. Thereby, women had difficulties for getting education. For instance, in the nineteenth century, in my country, they could not educate because of not being allowed by that time's mentality. But now this problem has been solved and equality has been established in between women and men. Because of this, giving fifty-fifty chance to both male and female students for getting higher education may be useful and helpful for keeping equality.On the other hand, it is equality but not justice. For example, there are a lot of people who want to study in some certain universities and deserve much more than their partners no matter being man or woman but if they are not accepted by universities which they have a desire for studying there they may lose their confidence and universities may also lose their potential successful students.Overall, taking into account of this two factors, despite of the keeping equality between male and female students, I personally take the view that while university admissions accepting candidate students they should bear in mind their potential, creativity, both practical and theoretical knowledge not their gender differences. (Band: 7.1)IELTS 5 test 2 writing task 1The charts show the main reasons for study among students of different age groups and the amount of support they received from employers. Summarize the information by selecting and reporting the main features, and make comparisons where relevant.[Answer 1]The information given by the bar charts is about the major causes of study among students in different age group and the amount of support they acquired from employers.The first graph shows that there is a gradual decrease in study for career reasons with age. Nearly 80% of students under 26 years, study for their career. This percentage declines by 10% -20% every decade. Only 40% of 40-49 year olds and 18% of over 49 year olds are studying for career reasons. Conversely, there are only 10% of under 26 year olds studying out of interest. The figure increases till the beginning of the fourth decade, and increases in late adulthood. However, 70% of over 49yr olds study for interest, about 4 times as many as that for career.The second graph shows that employer support is maximum (about 60%) for the under 26yr students. It drops rapidly to 32% up to the third decade of life, and then increases in late adulthood up to about 44%. It is unclear whether employer support is only for career-focused study, but the highest level is for those students who mainly study for career purposes.All in all, it is clear to see that there is an obvious difference in the distribution of reasons for study according to age group and most employers would like to give younger staff members time off and fees to continue academic study.[Answer 2]The bar charts compare students of different ages in terms of why they are studying and whether they are supported by an employer.It is clear that the proportion of students who study for career purposes is far higher among the younger age groups, while the oldest students are more likely to study for interest. Employer support is more commonly given to younger students.Around 80% of students aged under 26 study to further their careers, whereas only 10% study purely out of interest. The gap between these two proportions narrows as students get older, and the figures for those in their forties are the same, at about 40%. Students aged over 49 overwhelmingly study for interest (70%) rather than for professional reasons (less than 20%).Just over 60% of students aged under 26 are supported by their employers. By contrast, the 30-39 age group is the most self-sufficient, with only 30% being given time off and help with fees. The figures rise slightly for students in their forties and for those aged 50 or more. (Band: 9)IELTS 5 test 2 writing task 2In some countries, young people are encouraged to work or travel for a year between finishing high school and starting university studies. Discuss the advantages and disadvantages for young people who decide to do this.In some countries adolescences are prefer to work or to go aboard for a period between finishing high school and commencing university educations. Sometimes this situation have advantages as well as disadvantages. In further I will discuss both views and come to a final conclusion.Firstly, we have to choose a field we prefer before starting university studies. Furthermore in birth-hood some people think to be an engineers. In that case before entering to university studies, going to a work in that field will be an added advantage for their higher education. Most of the time in universities we can gain only theoretical parts but after completing degree and working in a field may be stuff. Moreover before appearing to higher education, young people should encourage to work or travel for year so they can identify the real situation. In further it will help them to take correct decision to choose their higher education.Secondly, this period also help them to get the idea about the society. In schools they were limited to same kind of age limits students only but if they work or travel after finishing high school and before commencing their university education, they can meet up different experiences with various types of people, cultures, attitudes, and cultures etc.In contrast, as same as advantages there are disadvantages too. In their student life they have less responsibilities and duties to do but when they released to society, they have to face more responsibilities and duties. Sometimes this may feel them more stress, home sickness, isolating problems from families and friends or fear to face society at once.In conclusion, by encouraging young people to work or travel between starting universities and finishing high school, will help them to build their future pathway successfully. Moreover it is help them to get general idea of the society, too.IELTS 5 test 3 writing task 1The map below is of the town of Garlsdon. A new supermarket (S) is planned for the town. The map shows two possible sites for the supermarket. Summaries the information by selecting and reporting the main features, and make comparisons where relevant.The map shows two potential locations (S1 and S2) for a new supermarket in a town called Garlsdon.The main difference between the two sites is that S1 is outside the town, whereas S2 is in the town center. The sites can also be compared in terms of access by road or rail, and their positions relative to three smaller towns.Looking at the information in more detail, S1 is in the countryside to the north west of Garlsdon, but it is close to the residential area of the town. S2 is also close to the housing area, which surrounds the town center.There are main roads from Hindon, Bransdon and Cransdon to Garlsdon town center, but this is a no traffic zone, so there would be no access to S2 by car. By contrast, S1 lies on the main road to Hindon, but it would be more difficult to reach from Bransdon and Cransdon. Both supermarket sites are close to the railway that runs through Garlsdon from Hindon to Cransdon. (Band: 9)IELTS 5 test 3 writing task 2Some people think that a sense of competition in children should be encouraged. Others believe that children who are taught to co-operate rather than compete become more useful adults. Discuss both these views and give your own opinion.[Answer 1]Some people view the world as a competitive place, and push their children to win. Others, however, value cooperation,and encourage their children to share, play and work together. In this essay, I will ask if winning always means that the other person loses, and whether teaching our children to win is the best preparation for life.Competition is undoubtedly good. First of all, it pushes us to do well, both as children and adults. Our physical limits are tested in competitive sports. Competition in business helps companies to produce new products and services, and competition in politics ensures that different opinions get heard and represented. For children, learning to compete is good preparation for the world. A second point is that competition does not just mean winning: children have to learn to lose well and to learn from their mistakes. In addition, competition does not just mean success for the individual. When competing as part of a team children learn the need to share and cooperate.However, a focus on competitiveness is not always beneficial for children. To begin with, very young children are naturally egocentric. As a result, they have to learn that there are others around them. Children have to be taught the skills of cooperation and sharing. A further point is that by learning to cooperate and work in teams, children learn to share responsibility when things go badly as well as when they go well. Finally, in our highly-interdependent knowledge society, very few breakthroughs happen as a resu lt of one person’s work or ideas. No matter how brilliant an individual is, his or her work is the result of working in a team or a community. In fact, many people now believe that all learning is social, rather than individual.In conclusion, it is almost impossible to separate these two strands of our lives. We are individuals but we are also social. In his book “The Seven Habits of Highly Effective People,” Steven Covey suggests we need to develop a “win-win” attitude. We need to be true to ourselves an d what we need, but also to think about the other person’s needs. If we can help our children to do this, we will be doing future generations a huge service. (Band: 9)[Answer 2]Nowadays, children often join many sorts of competitions, yet individual category is more often than team-work. Many people argue that children should be motivated to join competition. On the contrary, some people trust that children should be encouraged to co-operate instead of competing with others. However, in my opinion, children would be useful adults if they are given mixed skills both sense of competing and co-operating.There are many people who have faith that competition is the best way to make children to be better adults than others because of many reasons. Firstly, competition motivates children to be better than their peers even to be the best in their circumstances. For example, in the class, children strive to become the first rank and in the next period of their life, they who are used to competing would have pa ssion to keep joining competition. Secondly, competition could raise children’s self-esteem, especially when they win the competition they join. For instance, smart children, usually be the first in the class during elementary school, junior high school, or senior high school, and have high self-esteem in every stage of their life-cycle.On the other hand, there are many people who believe that cooperating has big influence to children instead of competing amongst them. People believe this idea because team-work could solve problems faster and make result better. Children who understand how to co-operate since in the childhood are used to measuring their problems faster because of their behavior in encouraging other people to solve it together. In their adult age, they would be easier to communicate with others in solving problems. Moreover, people believe that children who feel the function of working as a team would always practice it because the result of team-work is better than result done by individual.Nevertheless, it seems to me that mixed skills would help them a lot in children future life because different occasion needs different skill. For example, in the examination, children are not allowed to co-operate with their friends because cooperating during examination is cheating. In the contrast, cooperating is useful in the team assignments such as making clipping. It would be faster to finish, if it is done by teamwork than oneself.In conclusion, it seems to me that mixed skills between competing and cooperating would be the best way to make children more ready to face their real life in the adulthood. (Band: 7.6)IELTS 5 test 4 writing task 1The table below gives information about the underground railway systems in six cities. Summarize the information by selecting and reporting the main features, and make comparisons where relevant.The table demonstrates the features of the underground railway systems in 6 cities in three different aspects.First, the subway systems in the six cities were opened in time sequence with London being the earliest (in 1863) and Los Angeles the latest (in 2001). The underground railway system had their prime time in the 20th century, which saw the construction of 4 underground railway systems respectively in Paris (1900), in Tokyo (1927), in Washington DC (1976), and in Los Angeles (1981).Second, seen from London to Los Angeles, which happened to be in chronological order of subway construction, the above-mentioned six cities roughly revealed a trend of sharp decrease in the length of the subway route. London ranked No. 1 in this respect, with a length of 394km; Paris came next with 199km; Tokyo was No. 3 with 155km; Washington DC ranked No. 4 with 126 km. Kyoto and Los Angeles were the most interesting, with merely 11km and 28km respectively, nothing comparable with the top 4 cities.Third, we see some really unexpected figures about the number of passengers transported by the subway system in these six cities. Tokyo took the lead with 1.927 billion; Paris came next with 1.191 billion; London was No. 3 with 775 million; Washington DC was No. 4 with 144 million. Los Angeles and Kyoto had 50 million and 45 million respectively. Therefore, we can see the big difference as compared with other cities.Overall, the six cities revealed great differences in the history of subway construction, the length of subway lines and the yearly passenger transportation capability.IELTS 5 test 4 writing task 2Research indicates that the characteristics we are born with have much more influence on our personality and development than any experiences we may have in our life. Which do you consider to be the major influence?It is clear that, human personality is shaped under the effect of innate traits and characteristics that are gained through life experiences. This fact has always triggered debatable question, whether nature is more influential on personality compared to nurture or vice versa. To my mind, there are strong arguments on behalf of both sides. Therefore, before jumping to conclusion, this topic needs to be discussed.To begin with, human beings already have some traits coded in their genes which are impossible to change, when they areborn. For instance, if person has the innate sense of envy, for this person, that sense can be decreased to some extent, but completely removing it is not probable. That is why, regardless how we live or what we go through, our character is always affected by our nature.Nevertheless, while we grow up, we make friends, start to know people closely and those relationships teach us, what kind of features are welcomed, which ones are not. As a result, we attempt to promote our good sides and diminish bad sides. Furthermore, every person can face up to the big events which are known as the limestone of life, considering the fact that, such life experiences usually lead us to do big adjustments to our characteristics which cause big changes in our character.To sum it up, taking all the above mentioned points into ac count, I’m firmly convinced that, both nature and nurture are equally important in the formation process of human personality. Thus, according to my point of view, it would not be fair to give one of those discussed factors priority over the other one.General training test A (Task 1)Your neighbors have recently written to you to complain about the noise from your houselflat. Write a letter to your neighbors. In your letter.explain the reasons for the noise.apologise.describe what action you will takeDear Sir,I am writing to you regarding your compliant relating to excessive noise for my apartment. I completely understand you concern and apologize for the inconvenience.As you are aware, my apartment is a double story unit in which the bathroom on second floor is right above the bedroom underneath it. Recently, I noticed a leak from my bedroom ceiling. On getting it checked by the plumber, it was found that the water pipes of my bathroom had broken and needed immediate repair. It is the repair work that is causing all the noise.I am extremely apologetic for the disturbance caused by it and will ensure that you are not bothered by it going forward. I will instruct the plumber to do the repair work only during office hours when most of you are at work. Also, I will ensure that no repair works are done on the weekends, so that you can enjoy a peaceful weekend with your family at home.Once again, I express my regrets for the situation and appreciate your tolerance so far.Yours sincerely,Sharmistha SinghGeneral training test A (Task 2)Some people believe that children are given too much free time. They feel that this time should be used to do more school work. How do you think children should spend their free time?[Answer 1]Childhood is a very interesting period of our life. Children spend a long time for education and going to school. However, what should they do when they take a vacation? Should they keep studying? Or should they enjoy their time? I think enjoying is the priority to do. And it does not mean that time is not useful for them. I will express how the children can enjoy and benefit at the same time.Sports and hobbies are the most interesting activities that child can do. Playing football, tennis or handball make the kidrefresh and make him healthier. Because he training and tuning his muscles by making some physical movements. Also, drawing reading or even watching television are good for the mental health. These activities are improving the imagination of the students and make them more creative. And this will help them in their studying.On the other hand, children can spend their free time to learn something new…something is not academic. They can contribute to social service and learn how they can learn older people or poor people. These works make them charge the responsibility. Another non-academic activities are camping and ecotourism. In camping children are learning how they can deal with rough life and difficult situations. They also learn how to be independence. In Ecotourism, they can learn more about the environment and the history of some places. They may learn what their role toward the environment is.In my opinion free time is a great chance for children to be healthier physically and mentally. Also, it is a good opportunity to learn social and environmental skills.[Answer 2]Nowadays, children are facing more pressure during the school time than before. Some parents argue that children should put more efforts on their study even after school. However, in my opinion, spare time is a dispensable part for children to get relaxed, thus using it appropriately will not only enrich their daily life but also widen their horizons.Watching TV or surfing the internet are most children’s first choice in their free time. It cannot be denied that TV programs or online information are becoming more varied and informative. Children can absorb knowledge ranging from animals to human beings, geography to biology. However, spending too much time on watching TV may cause obesity and impair their eye sights. Therefore, children should under their parents’ guidance to shorten the time of watching TV or playing computers and avoid inappropriate contents.In addition, children should engage in more outdoor activities such as doing sports or volunteer works. Outdoor sports can not only enhance children’s fitness, but also promote the relationships with friends. And volunteer works can enlarge their life experience and foster their motivation of helping others. Moreover, elders need more concerns and care. Children can visit their grandparents during the free time chatting with them and being closer to their family members.Last but not least, various extracurricular activities / classes are flooding into childr en’s life. They can choose whatever they like to develop their hobbies. Music, language, drawing are the most popular classes. However, parents should treat these activities as their children’s hobbies and show due respect for their kids' personal interests and inclinations as regards their future careers.To conclude, I think children can learn much more during the spare time than in school. They should arrange the time reasonably to their comprehensive abilities in order to meet the demands of society.General training test B (Task 1)You have a full time job and are also doing a part time evening course. You now find that you cannot continue the course. Write a letter to your tutor. In your letter.describe the situation.explain why you cannot continue at this time.say what action you would like to takeDear Mr John,I am a current part-time student in your Introduction to Accounting evening class at Chisholm Institute. I am simultaneously working as a full-time teller at Sons Bank Ltd which explains why I have enrolled in an evening course.Unfortunately, as from the start of November, I will no longer be able to attend any of your lessons during the week as I have recently been promoted as an assistant manager. With the added responsibilities attached to the new position, I will be leaving work at 5.30pm instead of 4pm. As a result, I will be missing half of each class if I wish to continue the course.Nevertheless, I believe that the accounting lessons will be ben ...Dear Sir/MadamMy name is Namrata, a student of Microsoft office training batch T20 in your institute. I am writing this letter to let you know that I would not be able to attend classes from 20th June onwards. I am working with Optus and my timing is 9 AM to 5 PM.To meet deadlines and to complete my work, I need to stay back and do extra hours. I reach home at 7 PM every day and feel so tired. I do not get time to practice the lesson taught in institute. Also I am going my native (Canberra) middle of the next month, and before my vacation starts I have to finish my office work.Therefore I humbly request you to allow me to attend next available batch. This would be very helpful for me to manage office work and continue my training.Looking forward to hearing from you.Sincerely YoursNamrataGeneral training test B (Task 2)Nowadays we are producing more and more rubbish. Why do you think this is happening? What can governments do to help reduce the amount of rubbish produced?[Answer 1]In our highly industrialized era there is a growing awareness about the excessive amounts of trash people producing. We are about to be flooded by different types of garbage if certain measures will not be taken. This essay will explore some causes of this and propose ways to solve the problem.To begin with, different food producers decided that their products will be selling better if they will pack them in small-sized boxes and packets. These colorful and attractive packs go straight to the trashcan, the number of packs is growing along with the consuming growth.More consuming produces more waste. Government and businesses encourage consuming because it leads to high profits and development of state economy. They are not interested in the situation there a person is going to use something for a long time. Society is being bombarded with commercials, pleading to buy, for instance, a new mobile phone. Buying new things because throwing away old but good things.The problem of garbage is very complicated. As we can see, government is not interested of reducing consuming. Thus, the responsibility has to be taken by individuals and non-governmental organizations. Certain laws, regulating the percentage of packaging material per ton of product should be established. Moreover, interesting programs, involving people to participate can be developed. For example, bonuses for not asking for a plastic bag in supermarkets or for buying extra-large packs of food.。
Each kind of letter requires a different style of writing, a specific beginning and ending salutation, formal or informal expressions and varying types of grammatical forms. As you read through the sample IELTS letters below, take note of how they vary depending on the level of familiarity with the person being written to. Practice writing your own letters from sample letter topics, until you can produce all three kinds of letters easily and quickly. Then, you will be able to complete this task effectively and easily on the day of your IELTS exam.
Also, every General IELTS Writing Task 1 includes three bulleted points which you need to mention in your letter. Make sure you include these three points or else you will not get high marks, no matter how well you write.
Style Characteristics Opening Ending Formal To someone you have not met, whose name you don't know Dear Sir / Madam Yours faithfully
Semi-formal To someone you may or may not have met, whose last name you know & use Dear Mr Brown, Dear Ms Stone Yours sincerely
Informal To someone you know well, whose first name you know and use Dear John Dear Anita Best regards Warm wishes
General Training Writing sample task – Task 1 Sample Formal Letters Complaining to a Hotel Below is a sample letter response to Task 1 of the General IELTS Writing Section. It is a formal letter, which can be identified in several ways: the tone, which is official, business-like and serious the use of Dear Sir / Madam the absence of contractions the use of formal expressions (I am writing in connection with...) the closing salutation ( "Yours faithfully" instead of the more informal "Yours sincerely" or "Best regards")
GENERAL WRITING TASK 1 You should spend about 20 minutes on this task. You recently stayed in a hotel in a large city. The weather was very unusual for the time of year and the heating / cooling system in the hotel was quite inadequate. Write a letter to the manager of the hotel. In your letter: give details of what went wrong explain what you had to do to overcome the problem at the time say what action you would like the manager to take You should write at least 150 words. You do NOT need to write your own address. Begin your letter as follows: Dear __________ Dear Sir / Madam I am writing in connection with my recent stay at the Four Seasons in London, England. Unfortunately, due to a malfunctioning heater in my room, I spent three miserable nights at your hotel from April 26 – 29, 2010.
When I arrived in London, there was an unexpected snowstorm. I understand it does not usually snow inApril; however, when I got to my room, there was no heat. After complaining, a technician was sent up, who informed me they had to install a new heating unit. When I asked to be moved to another room, I was told the hotel was completely booked. Unfortunately, each night after work I returned to discover the problem had not been rectified. Eventually, I spent three horribly uncomfortable nights, wearing my coat to bed, wearing socks around the room and ending up with a bad cold from the unheated room. I had no time to complain as I had to catch a flight home right after my conference.
I am shocked by this terrible service. This is not what anyone expects for $400 a night! To compensate me for this tremendous inconvenience, I ask that you refund my money right away and offer me a free, more comfortable stay in one of your finer suites in the future. If not, I am prepared to take my complaint to a higher authority.
I look forward to hearing from you at the earliest, Yours faithfully, Mr John McFee (236 words)
Explaining to a Bank Below is a sample letter response to Task 1 of the General IELTS Writing Section. It is a formal letter, which can be identified in several ways: the tone, which is formal and business-like and serious the use of Dear Sir / Madam the absence of contractions the use of formal expressions ("Thank you kindly in advance.") the closing salutation ( "Yours faithfully", etc.)
You have received a letter from your bank, asking you to acknowledge receipt of a new bank card. However, the card was missing from the envelope. Write a letter to the bank's head office. In your letter: explain why you are writing express concern about the missing card ask them what they intend to do Write at least 150 words. You do NOT need to write any address. Begin your letter as follows: Dear __________