The Evolutionary Landscape of Alternative Splicing in Vertebrate Species
- 格式:pdf
- 大小:1.36 MB
- 文档页数:8
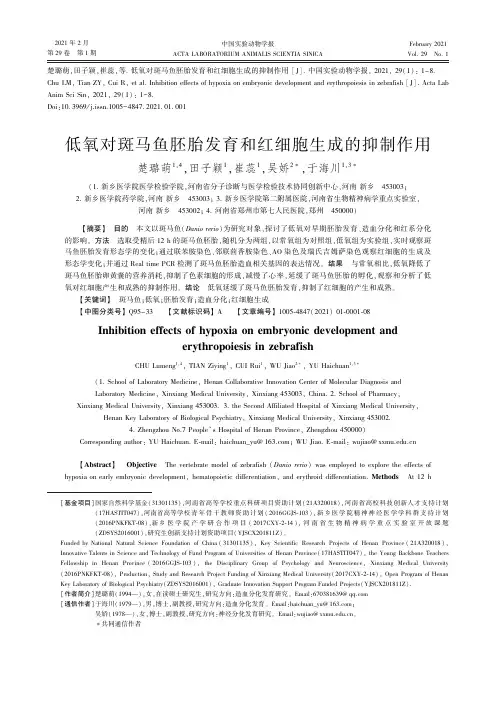
2021年2月第29卷㊀第1期中国实验动物学报ACTA LABORATORIUM ANIMALIS SCIENTIA SINICAFebruary 2021Vol.29㊀No.1楚璐萌,田子颖,崔蕊,等.低氧对斑马鱼胚胎发育和红细胞生成的抑制作用[J].中国实验动物学报,2021,29(1):1-8.Chu LM,Tian ZY,Cui R,et al.Inhibition effects of hypoxia on embryonic development and erythropoiesis in zebrafish [J].Acta Lab Anim Sci Sin,2021,29(1):1-8.Doi:10.3969/j.issn.1005-4847.2021.01.001[基金项目]国家自然科学基金(31301135),河南省高等学校重点科研项目资助计划(21A320018),河南省高校科技创新人才支持计划(17HASTIT047),河南省高等学校青年骨干教师资助计划(2016GGJS-103),新乡医学院精神神经医学学科群支持计划(2016PNKFKT-08),新乡医学院产学研合作项目(2017CXY-2-14),河南省生物精神病学重点实验室开放课题(ZDSYS2016001),研究生创新支持计划资助项目(YJSCX201811Z)㊂Funded by National Natural Science Foundation of China (31301135),Key Scientific Research Projects of Henan Province (21A320018),Innovative Talents in Science and Technology of Fund Program of Universities of Henan Province(17HASTIT047),the Young Backbone TeachersFellowship in Henan Province (2016GGJS-103),the Disciplinary Group of Psychology and Neuroscience,Xinxiang Medical University (2016PNKFKT-08),Production,Study and Research Project Funding of Xinxiang Medical University(2017CXY-2-14),Open Program of Henan Key Laboratory of Biological Psychiatry(ZDSYS2016001),Graduate Innovation Support Program Funded Projects(YJSCX201811Z).[作者简介]楚璐萌(1994 ),女,在读硕士研究生,研究方向:造血分化发育研究㊂Email:670381639@ [通信作者]于海川(1979 ),男,博士,副教授,研究方向:造血分化发育㊂Email:haichuan_yu@;吴娇(1978 ),女,博士,副教授,研究方向:神经分化发育研究㊂Email:wujiao@㊂∗共同通信作者低氧对斑马鱼胚胎发育和红细胞生成的抑制作用楚璐萌1,4,田子颖1,崔蕊1,吴娇2∗,于海川1,3∗(1.新乡医学院医学检验学院,河南省分子诊断与医学检验技术协同创新中心,河南新乡㊀453003;2.新乡医学院药学院,河南新乡㊀453003;3.新乡医学院第二附属医院,河南省生物精神病学重点实验室,河南新乡㊀453002;4.河南省郑州市第七人民医院,郑州㊀450000)㊀㊀ʌ摘要ɔ㊀目的㊀本文以斑马鱼(Danio rerio )为研究对象,探讨了低氧对早期胚胎发育㊁造血分化和红系分化的影响㊂方法㊀选取受精后12h 的斑马鱼胚胎,随机分为两组,以常氧组为对照组,低氧组为实验组,实时观察斑马鱼胚胎发育形态学的变化;通过联苯胺染色㊁邻联茴香胺染色㊁AO 染色及瑞氏吉姆萨染色观察红细胞的生成及形态学变化;并通过Real time PCR 检测了斑马鱼胚胎造血相关基因的表达情况㊂结果㊀与常氧相比,低氧降低了斑马鱼胚胎卵黄囊的营养消耗,抑制了色素细胞的形成,减慢了心率,延缓了斑马鱼胚胎的孵化,观察和分析了低氧对红细胞产生和成熟的抑制作用㊂结论㊀低氧延缓了斑马鱼胚胎发育,抑制了红细胞的产生和成熟㊂ʌ关键词ɔ㊀斑马鱼;低氧;胚胎发育;造血分化;红细胞生成ʌ中图分类号ɔQ95-33㊀㊀ʌ文献标识码ɔA㊀㊀ʌ文章编号ɔ1005-4847(2021)01-0001-08Inhibition effects of hypoxia on embryonic development anderythropoiesis in zebrafishCHU Lumeng 1,4,TIAN Ziying 1,CUI Rui 1,WU Jiao 2∗,YU Haichuan 1,3∗(1.School of Laboratory Medicine,Henan Collaborative Innovation Center of Molecular Diagnosis and Laboratory Medicine,Xinxiang Medical University,Xinxiang 453003,China.2.School of Pharmacy,Xinxiang Medical University,Xinxiang 453003.3.the Second Affiliated Hospital of Xinxiang Medical University,Henan Key Laboratory of Biological Psychiatry,Xinxiang Medical University,Xinxiang 453002.4.Zhengzhou No.7People s Hospital of Henan Province,Zhengzhou 450000)Corresponding author:YU Haichuan.E-mail:haichuan_yu@;WU Jiao.E-mail:wujiao@ ʌAbstract ɔ㊀Objective ㊀The vertebrate model of zebrafish (Danio rerio )was employed to explore the effects ofhypoxia on early embryonic development,hematopoietic differentiation,and erythroid differentiation.Methods ㊀At 12hpost-fertilization,zebrafish embryos were randomly divided into two groups.The normoxic group was used as the control group,and the hypoxic group was used as the experimental group.The morphological changes of zebrafish embryos were observed in real-time.Erythropoiesis and morphological changes were observed by benzidine,O-dianisidine,acridine orange,and May-Grunwald Giemsa staining.Real time PCR was used to analyze hematopoietic gene expression in zebrafish embryos.Results㊀Hypoxia reduced nutritional consumption of the yolk sac,inhibited the formation of pigment cells, slowed down the heart rate,and delayed the hatching of zebrafish embryos.Inhibitive effects of hypoxia on the production and maturity of red blood cells were observed.Conclusions㊀Hypoxia delays zebrafish embryonic development and inhibits the production and maturity of red blood cells.ʌKeywordsɔ㊀zebrafish;hypoxia;embryonic development;hematopoietic differentiation;erythropoiesis Conflicts of Interest:The authors declare no conflict of interest.㊀㊀斑马鱼(Danio rerio)是研究发育㊁造血和遗传学的强大模型[1],其具有体外受精发育㊁产卵量大㊁胚胎透明等多种优势[2-4]㊂斑马鱼与人类之间的遗传同源性达87%[5],同时具有遗传操作和再生能力[6],这使得斑马鱼成为目前研究脊椎动物胚胎发育和造血分化的优秀动物模型[7]㊂低氧是影响水生系统的最重要的压力源之一[8-9],目前有关低氧对斑马鱼胚胎发育的影响机制研究报道非常少㊂斑马鱼胚胎发育是一个复杂的㊁高度协同的过程㊂斑马鱼与人的造血分化是保守一致的,已经发现并克隆了造血过程中的阶段特异性表达基因,包括EPO㊁Globin和GATA1等[3,10]㊂研究发现红细胞生成受到低氧环境的影响,其中一个或多个异常可能导致不同类型的红细胞生成障碍[10]㊂本文采用联苯胺染色㊁邻联茴香胺染色及瑞氏吉姆萨染色来显示红细胞的生成及形态学变化,观察了低氧下斑马鱼胚胎的整个发育过程,并对常氧和低氧下的基因表达水平进行了比较,从而加深了低氧对脊椎动物影响的认识㊂目前涉及低氧对斑马鱼影响的详细研究很少,本研究为揭示低氧影响斑马鱼胚胎发育和红细胞生成的具体过程提供了新数据㊂1㊀材料与方法1.1㊀材料1.1.1㊀实验动物本实验得到新乡医学院动物实验伦理委员会的审批(XYLL-2020163),于河南省免疫与靶向药物重点实验室中进行实验,实验动物实验使用许可证号ʌSYXK(豫)2018-0014ɔ㊂约100对状态良好的生育期的AB品系斑马鱼养殖于上海海圣斑马鱼实验养殖系统中,光照/黑暗14h/10h,水温为28ħ㊂受精卵在28.5ħ下孵育,并根据Kimmel等[2]方法进行分期㊂1.1.2㊀主要试剂与仪器3,3 ,5,5 -四甲基联苯胺(MACKLIN,中国);瑞氏吉姆萨染液(Baso,中国);AO染液(索莱宝,中国);邻联茴香胺(Sigma,美国);TRIzol试剂(ambion,美国);逆转录试剂盒(诺唯赞,中国)㊂斑马鱼养殖系统(上海海圣生物实验设备有限公司,中国);YCP系列三气培养箱(长沙华曦电子科技有限公司,中国);ZEISS Discovery.V8体式荧光显微镜(ZEISS,德国);BX51正置荧光显微镜(Olympus,日本);PikoReal TM实时荧光定量PCR检测仪(Thermo Fisher Scientific,美国);Tanon-3500凝胶成像系统(上海天能公司,中国)㊂1.2㊀方法1.2.1㊀斑马鱼的繁殖和胚胎处理斑马鱼是根据已有文献的标准条件饲养和繁殖[11],交配和胚胎培养方法由中国斑马鱼资源中心提供㊂12hpf(hours post fertilization)后收集高质量的胚胎进行实验㊂将胚胎分为低氧和常氧培养组,低氧组的胚胎暴露于5%O2浓度下㊂每12h收集1次斑马鱼胚胎,鉴定胚胎的发育阶段㊂在不同发育时期,从常氧和低氧组各随机选取10个胚胎,用ZEISS ZEN软件计算卵黄囊的比例;用Image J软件分析体表色素沉着的比例;在体视显微镜下观察并计算胚胎个体的心率㊂1.2.2㊀联苯胺染色和邻联茴香胺染色联苯胺染色按照本实验室的方法进行[12],邻联茴香胺染色参照文献方法进行[13]㊂使用体式显微镜对各发育阶段的胚胎进行观察并拍照,用Image J 软件分析整个斑马鱼中染色部分的占比㊂图像至少是从3个独立的实验中获得,每组至少有6个胚胎或幼鱼㊂1.2.3㊀瑞氏吉姆萨染色对胚胎进行断尾处理收集血细胞,制备血涂片㊂斑马鱼预处理及瑞氏吉姆萨染色方法参照文献进行,并稍作改进[14-15]㊂使用BX51正置荧光显微镜观察并鉴定红细胞类型,并依据统计学方法计算红细胞在所有血细胞中的比例㊂1.2.4㊀AO染色随机收集10个胚胎/幼鱼移至包含1mL ddH2O的EP管中,然后加入30μL10μg/mL的AO染液,避光染色1h[16-17]㊂立即使用体式荧光显微镜观察并拍摄胚胎中的荧光㊂1.2.5㊀RNA提取和Real time PCR每组随机取50个胚胎/幼鱼,溶于TRIzol试剂中提取总RNA㊂使用逆转录试剂盒将总RNA逆转录为cDNA㊂使用特异性基因引物(见表1)进行常规RT-PCR和Real time PCR㊂表1㊀实时荧光定量PCR引物名称及序列Table1㊀Primer names and sequences of Real time PCR引物名称Primer names引物序列(5 -3 )Primer sequences(5 -3 ) Z-Globin-F TTTCCGCAAAGGACAAAGCGZ-Globin-R AGGAGAGTTGGGGCTTAGGTZ-GATA1-F TTTACGGCCCTTCTCCACACZ-GATA1-R GGTGGCACCACAATTCACACZ-l-plastin-F GATGTGGATGGGAACGGTCAZ-l-plastin-R ATGAACCACCTTGGCGAACTZ-scl-F CGGGCTGACAACTAGCGTATZ-scl-R TACCTGATGAGGCGTGGGTAZ-c-myc-F TATGCTGCAAGTGACCGGAGZ-c-myc-R GCTGGATGGAGTCGTAGTCGZ-NFIL3-F TAGCCCGATGTCCTTCCAGAZ-NFIL3-R TGGTGAGTCTGGACATTGCCZ-GAPDH-F TCACATTAAGGGTGGTGCAAZ-GAPDH-R GTGATGGCATGAACAGTGCT 1.3㊀统计学分析使用GraphPad Prism7软件对实验数据进行分析㊂计量资料以平均值ʃ标准差( xʃs)表示,采用t检验比较两组样本的均值,多组间的样本采用单因素方差分析㊂P<0.05为差异有统计学意义㊂2㊀结果2.1㊀低氧延迟斑马鱼胚胎发育依据前期实验结果,最终选定5%O2浓度作为低氧条件㊂将12hpf的斑马鱼胚胎(图1A)随机分为两组,分别在常氧和低氧下培养㊂24hpf,咽囊期原基-5期视网膜色素沉着和皮肤黑色素沉积较早,卵黄囊内出现红细胞,此时出现早期心脏搏动(图1B);36hpf,原基-25期,绒毛膜中的斑马鱼胚胎出现早期运动㊁尾部色素沉着和血液循环(图1C); 48hpf,长胸鳍期,卵黄囊开始变薄,侧边带出现黑素细胞,视网膜上的虹膜色素细胞丰富,头部出现黄色(图1D);60hpf,高胸鳍期,血液循环明显,视网膜虹膜色素细胞环加深(图1E);72hpf,孵化期的突口阶段,虹膜色素细胞覆盖眼睛,背部与头部相同颜色(图1F);84hpf,斑马鱼胚胎已经发育到幼鱼期(图1G)㊂低氧下,胚胎在24hpf时发育到卵裂期的20-体节阶段,在胚胎背侧区域共观察到20个体节,相当于在常氧下19hpf时的发育阶段(图1H)㊂同样,低氧下,36㊁48㊁60㊁72㊁84hpf的胚胎发育阶段分别为原基-6期㊁原基-25期㊁高胸鳍期㊁长胸鳍期和胸鳍期,分别与常氧下的25㊁36㊁42㊁48㊁60 hpf一致(图1I㊁1J㊁1K㊁1L㊁1M),即低氧在一定程度上延迟了斑马鱼胚胎的整体发育㊂2.2㊀低氧对于斑马鱼卵黄囊㊁色素沉着㊁胚胎孵化和心率的影响在相同发育阶段,低氧组斑马鱼的卵黄囊体积明显大于常氧组(图2A㊁2B);低氧组斑马鱼眼睛㊁头部㊁躯干和卵黄囊中的色素沉着明显低于常氧组(图2A㊁2C);在相同的长胸鳍阶段,常氧组胚胎完成了孵化,低氧组胚胎仍然包裹在绒毛膜中(图2A)㊂常氧组斑马鱼在24hpf时胚胎开始出现早期的心脏搏动,而此时低氧组未发现心脏搏动㊂从24 hpf开始,无论是否低氧培养,胚胎早期心率随时间变化趋势一致,约60hpf后心率趋于稳定,而在相同发育时间,低氧组斑马鱼胚胎心率明显低于常氧组(图2D)㊂另外,相同发育阶段,低氧下的胚胎心率明显低于常氧(图2E)㊂2.3㊀低氧减少斑马鱼早期胚胎发育红细胞的生成邻联茴香胺染色结果显示,经低氧处理的斑马鱼胚胎的邻联茴香胺的着色面积显著降低,染色部位主要位于卵黄囊,而常氧组斑马鱼胚胎的染色部位则逐渐从卵黄囊转移到心脏和头部(图3A-a,c, e,g)㊂联苯胺染色结果与邻联茴香胺染色基本一致,常氧下胚胎的主要染色部位逐渐从卵黄囊和大血管转移到心脏㊁大血管和节间血管,低氧下的染色部位逐渐从卵黄囊转移到心脏和血管,节间血管染色不明显(图3B)㊂使用Image J软件对联苯胺染色结果进行分析,在同一发育阶段,低氧下胚胎的着色面积比例明显低于常氧(图3C)㊂AO染色结果显示,低氧下斑马鱼胚胎卵黄囊的前部和上部有大量的凋亡细胞(绿色荧光颗粒);但其会随着斑马图1㊀斑马鱼胚胎发育代表性图片(ˑ150)Figure 1㊀Representative images of zebrafish embryonic development(ˑ150)注:A:斑马鱼胚胎的代表性图片(ˑ150);B㊁C:斑马鱼卵黄囊体积占比和色素沉着占比;D:不同发育时间斑马鱼胚胎的心率变化;E:相同发育阶段下斑马鱼胚胎的心率的差异㊂与常氧相比,∗P <0.05,∗∗P <0.01,∗∗∗P <0.001㊂(下图同)图2㊀低氧对于斑马鱼胚胎卵黄囊㊁色素沉着和心率的影响Note.A.Representative images of zebrafish embryos(ˑ150).B,C.The proportion of yolk sac volume and the proportion of pigmentation.D.The heart rate of zebrafish embryos under normoxic and hypoxic conditions at different developmental time.E.The heart rate of zebrafishembryos under normoxic and hypoxic conditions at the same developmental pared with normal oxygen,∗P <0.05,∗∗P <0.01,∗∗∗P <0.001.(The same in the following figures)Figure 2㊀Effects of hypoxia on yolk sac,pigmentation and heart rate of zebrafish embryos鱼胚胎的发育逐渐减少(图3A-b,d,f,h)㊂2.4㊀低氧抑制红细胞成熟瑞氏吉姆萨染色结果显示,同一发育时期,低氧下斑马鱼的总红细胞(包括幼稚红细胞和成熟红细胞)比例低于常氧(图4A㊁4B)㊂图4A 中,蓝色箭头处为未成熟红细胞,胞体呈圆形,胞质丰富,细胞核呈圆形或类圆形,蓝色,多居中;红色箭头处为成熟的红细胞,胞体比未成熟红细胞小,呈椭圆形,胞质丰富,细胞核呈椭圆形,深紫色㊂低氧下84hpf 的斑马鱼血液中只有未成熟的红细胞存在㊂但是同一发育阶段下常氧和低氧相比较,红细胞总数的比例没有统计学意义(图4C)㊂以往的研究表明,斑马鱼血液中的红细胞呈连续性年龄分布,成熟的红细胞血红蛋白含量较高[18]㊂这些结果表明低氧在一定程度上抑制了红细胞的成熟㊂2.5㊀低氧对于斑马鱼胚胎发育过程中造血相关基因表达的影响通过绘制斑马鱼胚胎发育早期的造血细胞分化发育图谱,我们选定了部分重要的造血相关基因进行表达检测㊂首先使用RT-PCR 的方法观察了在正常培养过程中斑马鱼胚胎发育6㊁12㊁24㊁48㊁72hpf 时一些重要造血相关基因的表达情况(图5A),在24hpf 之后,红系特异性造血因子GATA1和Globin 随着发育时间的增加其表达强度逐渐增加;注:A:斑马鱼胚胎的邻联茴香胺染色图片和AO 染色图片(ˑ150);B:斑马鱼胚胎的代表性联苯胺染色图片(ˑ100);C:联苯胺染色量化图㊂图3㊀低氧对斑马鱼胚胎血红蛋白的生成和细胞凋亡的影响Note.A.O-dianisidine staining pictures and Acridine orange staining pictures of zebrafish embryos(ˑ150).B.Representative benzidine staining of zebrafish embryos(ˑ100).C.Quantitative line chart of Benzidine staining.Figure 3㊀Effects of hypoxia on hemoglobin production and cell apoptosis of zebrafishembryos注:A:斑马鱼胚胎血细胞的瑞氏吉姆萨染色(ˑ1000);B:不同发育时期斑马鱼胚胎中红细胞的比例;C:在相同的发育阶段,斑马鱼胚胎中红细胞的比例㊂图4㊀低氧抑制红细胞成熟Note.A.May-Grunwald Giemsa staining of zebrafish embryonic blood cells(ˑ1000).B.The proportion of red blood cells in blood of zebrafish embryos at different developmental time.C.At the same developmental stage,the proportion of red blood cells in blood of zebrafish embryos.Figure 4㊀Hypoxia inhibits red blood cell maturity同时其他的与造血相关的基因c-myc㊁scl㊁GATA2和NFIL3等在斑马鱼胚胎发育早期,也随着发育时间呈逐渐升高的趋势,而l-plastin 在早期的表达更加明显㊂另外,Real time PCR 结果显示了常氧和低氧下一些红系相关基因的表达差异㊂Globin 在相同的发育时期低氧下的表达强度要明显低于常氧下的表达强度,与之相反Epo 基因在低氧下则显示较高,同时其他相关造血基因在某些发育阶段也显示出低氧下表达强度低于常氧下(图5B)㊂这些基因表达的变化情况证实并解释了先前观察到的低氧抑制斑马鱼胚胎早期红系分化的结果㊂注:A:RT-PCR 分析常氧条件下斑马鱼胚胎发育过程中的mRNA 表达水平;B:Real time PCR 分析比较常氧和低氧条件下造血相关mRNA 的表达差异㊂图5㊀低氧对于斑马鱼胚胎发育中基因表达的影响Note.A.Some mRNA level was analyzed by RT-PCR during embryonic development of zebrafish.B.Real time PCR was employed to analyze the differential expression of hematopoietic related mRNA.Figure 5㊀Effects of hypoxia on gene expression in embryonic development of zebrafish3㊀讨论为了探讨低氧对斑马鱼胚胎发育和造血作用的影响,我们使用了不同的低氧浓度和低氧处理时间㊂前期的实验结果表明当受精后的胚胎直接暴露于1%O 2浓度下超过24h,死亡率几乎是100%㊂我们最终选定了5%O 2浓度作为最适低氧浓度,而12hpf 作为最佳低氧处置时间㊂斑马鱼胚胎是一个 封闭系统 ,且发育早期不能合成血红蛋白来供应自身氧气的需求,只能通过外界氧气的被动扩散才能满足斑马鱼胚胎的正常生长发育,所以绒毛膜上的孔洞是氧气和营养物质从外部水环境运输到胚胎和清除废物所必需的[19],通过独特的绒毛膜结构,未孵化的胚胎感受到低氧并影响其发育,本研究发现低氧延缓了斑马鱼的孵化时间㊂卵黄囊的主要作用是为斑马鱼早期发育提供所需的营养物质,使发育不受外界干扰[20]㊂但有研究发现抵抗动物缺氧的最重要的防御机制之一是能量消耗的下调[21],本实验结果显示:低氧下斑马鱼胚胎卵黄囊的体积占比大于常氧,即实验证实低氧抑制卵黄囊的消耗㊂同时低氧减少了胚胎的体外色素沉着,这可能是由于低氧降低细胞色素P450的表达[22],或者因为低氧影响了酪氨酸酶的活性从而延迟了胚胎色素细胞的发育[23]㊂总之,低氧从整体上抑制了斑马鱼胚胎的发育过程,而持续的低氧不利于胚胎发育和生物学进化,在某些情况下甚至可能导致严重的疾病或死亡㊂鱼类心脏对多种环境因素敏感,其中之一就是低氧㊂在低氧状态下,由于外部氧气浓度较低,通过绒毛膜被动扩散进入斑马鱼胚胎的氧气含量无法满足斑马鱼胚胎心脏形成和发挥功能的需求,从而导致其出现持续性心动过缓,通过降低心率和能量消耗从而提高成活率[24]㊂与文献报道相一致,本研究发现低氧会导致斑马鱼心率发生复杂的变化,其确切的变化取决于发育阶段,并且在较小的程度上取决于饲养温度[25]㊂同时,以往文献显示,低氧导致斑马鱼胚胎出现一定程度的心包水肿,伴有卵黄囊水肿,胚胎血管系统发育不良,血液流速变缓[26-28]㊂我们的研究结果再一次证实了这一结果,心包水肿影响血液循环㊁心率,并很可能对血细胞生成有一定影响㊂低氧不仅影响斑马鱼胚胎的形态和心脏功能,造血分化和红细胞生成也受到了影响㊂斑马鱼是研究胚胎红细胞生成的理想系统[29]㊂红细胞的产生在许多水平上受到调节,包括基因表达的控制,环境条件的改变㊂本研究结果显示胚胎发育早期低氧对红细胞产生和成熟具有抑制作用㊂这可能是由于在胚胎发育的早期,低氧下卵黄囊前部和上部的血供不足引起的细胞凋亡,但在发育后期斑马鱼胚胎出现低氧耐受,凋亡模式发生改变,细胞凋亡数量减少㊂为了揭示低氧对红细胞生成过程中基因表达可能存在的调控机制,我们检测了一些重要的造血相关基因㊂有研究表明斑马鱼胚胎发育后期,12hpf胚胎血红蛋白的表达水平开始增加,并在孵化前后达到高峰,且胚胎血红蛋白基因水平一直保持在高水平,直到成年[30]㊂本实验的初步结果表明,常氧下12hpf,红系特异性造血因子Globin开始表达,随着发育时间的增加其表达强度逐渐增加,这与已有的研究报道结果是一致的;但是低氧下Globin的表达水平降低,及HiF1α的表达水平升高,提示在斑马鱼胚胎发育早期,低氧确实影响基因表达,但其分子机制尚不清楚㊂据报道,低氧可以通过调节斑马鱼胚胎的HIF通路,影响斑马鱼胚胎造血干细胞的产生和造血末期红细胞的终末分化[31-33]㊂综上所述,低氧延缓了斑马鱼胚胎的发育,抑制了红细胞的产生和成熟㊂我们的结果加深了人们对低氧诱导脊椎动物产生影响的认识,同时也提供了低氧对斑马鱼胚胎发育和红细胞生成的最新认识㊂由于斑马鱼相对于小鼠模型具有许多优势,斑马鱼疾病模型的进一步发展将加速我们对疾病各种病理㊁生理过程的了解㊂随着斑马鱼疾病模型的可用性和日益增加的多样性,该动物系统将为疾病诊断,有效治疗和预后提供强大的基础㊂在高海拔地区,低氧与中风或癌症等疾病相关[34]㊂所以此项研究在一定程度上为探索临床上低氧性疾病提供了新的认识和见解,但低氧究竟如何影响斑马鱼的胚胎发育和造血分化,还有待进一步研究㊂参㊀考㊀文㊀献(References)[1]㊀王小琦,孙岩,张洋,等.斑马鱼模型在常见骨疾病研究中的应用[J].中国比较医学杂志,2017,27(6):86-91.Wang XQ,Sun Y,Zhang Y,et al.Application of zebrafishmodels in the research on bone diseases[J].Chin J Comp Med,2017,27(6):86-91.[2]㊀Kimmel CB,Ballard WW,Kimmel SR,et al.Stages ofembryonic development of the zebrafish[J].Dev Dyn,1995,203(3):253-310.[3]㊀Gore AV,Pillay LM,Venero GM,et al.The zebrafish:Afintastic model for hematopoietic development and disease[J].Wiley Interdiscip Rev Dev Biol,2018,7(3):e312. [4]㊀王雪,韩利文,何秋霞,等.斑马鱼模型在糖尿病研究中的应用[J].中国比较医学杂志,2017,27(8):1-5.Wang X,Han LW,He QX,et al.Application of zebrafishmodels in research of diabetes[J].Chin J Comp Med,2017,27(8):1-5.[5]㊀Woo K,Shih J,Fraser SE.Fate maps of the zebrafish embryo[J].Curr Opin Genet Dev,1995,5(4):439-443. [6]㊀Brönnimann D,Annese T,Gorr TA,et al.Splitting of circulatingred blood cells as an in vivo mechanism of erythrocyte maturationin developing zebrafish,chick and mouse embryos[J].J ExpBiol,2018,221(15):184564.[7]㊀de Jong JL,Zon e of the zebrafish system to study primitiveand definitive hematopoiesis[J].Annu Rev Genet,2005,39:481-501.[8]㊀Fitzgerald JA,Jameson HM,Fowler VH,et al.Hypoxiasuppressed copper toxicity during early development in zebrafishembryos in a process mediated by the activation of the HIFsignaling pathway[J].Environ Sci Technol,2016,50(8):4502-4512.[9]㊀Kwong RW,Kumai Y,Tzaneva V,et al.Inhibition of calciumuptake during hypoxia in developing zebrafish is mediated byhypoxia-inducible factor[J].J Exp Biol,2016,219(24):3988-3995.[10]㊀Rasighaemi P,Basheer F,Liongue C,et al.Zebrafish as amodel for leukemia and other hematopoietic disorders[J].JHematol Oncol,2015,8:29.[11]㊀Varga ZM,Ekker SC,Lawrence C.Workshop report:zebrafishand other fish models-description of extrinsic environmentalfactors for rigorous experiments and reproducible results[J].Zebrafish,2018,15(6):533-535.[12]㊀Yu HC,Zhao HL,Wu ZK,et al.Eos Negatively regulateshumanγ-globin gene transcription during erythroid differentiation[J].PLoS One,2011,6(7):e22907.[13]㊀Liu C,Han T,Stachura DL,et al.Lipoprotein lipase regulateshematopoietic stem progenitor cell maintenance through DHAsupply[J].Nat Commun,2018,9(1):1310. [14]㊀Ghersi JJ,Mahony CB,Bertrand JY.bif1,a new BMP signalinginhibitor,regulates embryonic hematopoiesis in the zebrafish[J].Development,2019,146(6):164103.[15]㊀Bertrand JY,Kim AD,Violette EP,et al.Definitivehematopoiesis initiates through a committed erythromyeloidprogenitor in the zebrafish embryo[J].Development,2007,134(23):4147-4156.[16]㊀杨菲,华永庆,林紫薇,等.斑马鱼眼部细胞凋亡模型的建立[J].中国药理学通报,2019,35(9):1320-1325.Yang F,Hua YQ,Lin ZW,et al.Establishment of apoptoticmodel of zebrafish eye[J].Pharmacol Bulletin,2019,35(9):1320-1325.[17]㊀李梦婷,张慧琼,文瑞琪,等.基于斑马鱼研究附子脂溶性总生物碱的神经毒性[J].中药药理与临床,2019,35(6):63-66.Li MT,Zhang HQ,Wen RQ,et al.Study on the Neurotoxicity offat-soluble alkaloids from radix aconiti lateralis based on zebrafish[J].Pharmacol Clin Chin Mater Med,2019,35(6):63-66.[18]㊀Nikinmaa M.Environmental regulation of the function ofcirculating erythrocytes via changes in age distribution in teleostfish:Possible mechanisms and significance[J].Mar Genomics,2020,49:100717.[19]㊀Zhang Q,Kopp M,Babiak I,et al.Low incubation temperatureduring early development negatively affects survival and relatedinnate immune processes in zebrafish larvae exposed tolipopolysaccharide[J].Sci Rep,2018,8(1):4142. [20]㊀Fraher D,Sanigorski A,Mellett NA,et al.Zebrafish embryoniclipidomic analysis reveals that the Yolk cell is metabolically activein processing lipid[J].Cell Rep,2016,14(6):1317-1329.[21]㊀Ton C,Stamatiou D,Liew CC.Gene expression profile ofzebrafish exposed to hypoxia during development[J].PhysiolGenomics,2003,13(2):97-106.[22]㊀Shang EH,Wu RSS.Aquatic hypoxia is a teratogen and affectsfish embryonic development[J].Environ Sci Technol,2004,38(18):4763-4767.[23]㊀Cheng J,Flahaut E,Cheng SH.Effect of carbon nanotubes ondeveloping zebrafish(Danio rerio)embryos[J].Environ ToxicolChem,2007,26(4):708-716.[24]㊀Steele SL,Lo KH,Li VW,et al.Loss of M2muscarinic receptorfunction inhibits development of hypoxic bradycardia and alterscardiacβ-adrenergic sensitivity in larval zebrafish(Danio rerio)[J].Am J Physiol Regul Integr Comp Physiol,2009,297(2):R412-R420.[25]㊀Barrionuevo WR,Burggren WW.O2consumption and heart ratein developing zebrafish(Danio rerio):influence of temperatureand ambient O2[J].Am J Physiol,1999,276(2):505-513.[26]㊀Damalas DE,Bletsou AA,Agalou A,et al.Assessment of theacute toxicity,uptake and biotransformation potential ofbenzotriazoles in zebrafish(Danio rerio)larvae combiningHILIC-with RPLC-HRMS for high-throughput identification[J].Environ Sci Technol,2018,52(10):6023-6031. [27]㊀Antkiewicz DS,Geoffrey BC,Carney SA,et al.Heartmalformation is an early response to TCDD in embryonic zebrafish[J].Toxicol Sci,2005,84(2):368-377.[28]㊀Wu BJ,Chiu CC,Chen CL,et al.Nuclear receptor subfamily2group F member1a(nr2f1a)is required for vasculardevelopment in zebrafish[J].PLoS One,2014,9(8):e105939.[29]㊀Brownlie A,Hersey C,Oates AC,et al.Characterization ofembryonic globin genes of the zebrafish[J].Dev Biol,2003,255(1):48-61.[30]㊀Tiedke J,Gerlach F,Mitz SA,et al.Ontogeny of globinexpression in zebrafish(Danio rerio)[J].J Comp Physiol B,2011,181(8):1011-1021.[31]㊀Zhang Y,Jin H,Li L,et al.cMyb regulates hematopoietic stem/progenitor cell mobilization during zebrafish hematopoiesis[J].Blood,2011,118(15):4093-4101.[32]㊀Wang Y,Liu X,Xie B,et al.The NOTCH1-dependent HIF1α/VGLL4/IRF2BP2oxygen sensing pathway triggers erythropoiesisterminal differentiation[J].Redox Biol,2020,28:101313.[33]㊀Pelster B,Egg M.Hypoxia-inducible transcription factors in fish:expression,function and interconnection with the circadian clock[J].J Exp Biol,2018,221(13):jeb163709. [34]㊀Ward AC,McPhee DO,Condron MM,et al.The zebrafish spi1promoter drives myeloid-specific expression in stable transgenicfish[J].Blood,2003,102(9):3238-3240.[收稿日期]㊀2020-05-27。
ORIGINAL PAPEREctopic expression of FaGalUR leads to ascorbate accumulation with enhanced oxidative stress,cold,and salt tolerance in tomatoXiaofeng Cai •Chanjuan Zhang •Jie Ye •Tixu Hu •Zhibiao Ye •Hanxia Li •Yuyang ZhangReceived:7June 2014/Accepted:1October 2014ÓSpringer Science+Business Media Dordrecht 2014Abstract L -Ascorbic acid (vitamin C,AsA),is an essential component for collagen biosynthesis and the major antioxidant in human,mainly obtained from the diet.Strawberry as fruit with higher AsA concentration pro-cesses a distinct AsA biosynthesis pathway from tomato (Solanum lycopersicum )which dominants in D -mannose/L -galactose pathway.Firstly,the activity of D -galacturonic acid reductase (GalUR;EC =1.1.1.19)parallel to AsA accumulation in crude extract of tomato leaves and fruits was detected.Subsequently,transgenic tomato lines over-expressing strawberry FaGalUR gene resulted in twofold and 1.6-fold increase in AsA level in tomato fruit and leaf,respectively,which correlated positively with FaGalUR transcriptional abundance and GalUR activity.Further-more,FaGalUR -overexpressing plants showed enhanced tolerance to abiotic stresses induced by oxidization (methyl viologen),salt (NaCl)and cold as compared to the wild-type plants.Taken together,the present findings suggest that tomato might share the alternative D -galacturonate pathway for ascorbate biosynthesis,and abiotic stresstolerance as well as AsA accumulation in tomato can be enhanced by regulating strawberry GalUR gene.Keywords Tomato ÁAscorbic acid ÁAntioxidant ÁD -galacturonic acid reductase ÁAbiotic stressesAbbreviations AsA Ascorbate GalUR Galacturonic acid reductase D -GAL D -galacturonic acid GaLDH L -galactono-1,4-lactone dehydrogenase MiOX Myo-inositol oxygenase ROS Reactive oxygen species MV Methyl viologen CaMV Cauliflower mosaic virus PCR Polymerase chain reaction RT-PCR Reverse transcription-polymerase chainreactionQRT-PCR Quantitative reverse transcription PCR mRNA Messenger RNA NADPH Nicotinamide adenine dinucleotide phosphate HPLC High performance liquid chromatography FW Fresh weight MDA Malondialdehyde ORF Open reading frame DTT Dithiothreitol EDTA Ethylene diamine tetraacetic acidIntroductionL -Ascorbicacid (AsA,vitamin C),the most abundantwater-soluble redox compound in plants and eukaryotic algae,plays a multifunctional role in both plants andXiaofeng Cai and Chanjuan Zhang have contributed equally to thiswork.Electronic supplementary material The online version of this article (doi:10.1007/s10725-014-9988-7)contains supplementary material,which is available to authorized users.X.Cai ÁC.Zhang ÁJ.Ye ÁT.Hu ÁZ.Ye ÁH.Li (&)ÁY.Zhang (&)Key Laboratory of Horticultural Plant Biology (Ministry of Education),Huazhong Agricultural University,Wuhan 430070,Chinae-mail:hxli@ Y.Zhange-mail:yyzhang@Plant Growth RegulDOI 10.1007/s10725-014-9988-7animals.Humans and other primates are unable to syn-thesize AsA because the terminal enzyme in the animal pathway,L-gulono-1,4-lactone oxidase,has been mutated and non-functional.Accordingly,they depend on dietary intake to cover their requirements and mainly obtain from plant sources(Chatterjee1973).AsA functions as a major cellular antioxidant protecting plant tissues against damage caused by reactive oxygen species(ROS),which were induced by kinds of environ-mental stresses(Sanmartin et al.2003;Pavet et al.2005; Conklin et al.1996;Smirnoff and Wheeler2000;Smirnoff 1996).It also acts as an enzymatic cofactor for a range of hydroxylase enzymes,for instance1-aminocyclopropane-1-carboxylic acid oxidase(Ververidis and John1991).AsA also participates in the regulation of many fundamental cellular processes such as photosynthesis,photo-protection, cell cycle,cell expansion,programmed cell death and senescence(Potters et al.2002;Haroldsen et al.2011).In addition,AsA is a major substrate for synthesis of l-tar-taric,l-threonic,and l-oxalic acids using a combination of enzyme-catalysed and non-enzymic reactions(Potters et al. 2002;Davey et al.2000;Ishikawa et al.2006).The accumulation of ascorbic acid in plants may vary with species and their biosynthesis machineries.In plants, ascorbic acid biosynthesis occurs by four different path-ways,although it has been demonstrated that the D-man-nose/L-galactose or the Smirnoff–Wheeler pathway is a major AsA biosynthetic route in plants,which involves GDP-D-mannose,GDP-L-galactose,L-galactose and L-ga-lactono-1,4-lactone.The L-galactono-1,4-lactone is further oxidized to AsA by L-galactono-1,4-lactone dehydrogenase (GaLDH)enzyme(Wheeler et al.1998).An alternative pathway with an L-galactonic acid intermediate has been reported in strawberry,which proceeds via D-galacturonic acid(a component of cell wall pectin),L-galactonic acid, and L-galactono-1,4-lactone.L-galactono-1,4-lactone serves as the linkage between D-mannose/L-galactose pathway and L-galactonic acid pathway(Agius et al.2003). There are also alternative pathways of synthesizing ascor-bate through the intermediates of L-gulose(Wolucka and Van Montagu2003)and myo-inositol(Lorence et al. 2004).However,the myo-inositol pathway remains con-troversial due to lack of strong evidence.The AsA con-centration remains the same in wild-type and MiOX overexpression lines in Arabidopsis(Endres and Tenhaken 2009).Therefore,to improve the AsA accumulation from D-galacturonic acid pathway is effective process.In the D-galacturonic acid pathway,the conversion of D-galacturonic acid to L-galactonic acid is catalyzed by D-galacturonic acid reductase(GalUR).The GalUR gene wasfirst isolated from strawberry in2003,and the expression levels of FaGalUR correlated with ascorbate content during fruit ripening in strawberry.The overexpression of FaGalUR in transgenic Arabidopsisthaliana and potato results in a twofold to threefold and1.6-fold to twofold increases in AsA content in transgeniclines,respectively(Agius et al.2003;Hemavathi et al.2009),and the overexpression of FaGalUR in potato alsoenhances the tolerance to abiotic stresses induced bymethyl viologen(MV),NaCl or mannitol as compared tountransformed control plants(Hemavathi et al.2009).Overexpressing FaGalUR gene in tomato hairy roots led to2.5-fold increase in total AsA content in a transgenic hairyroots(Oller et al.2009).In tomato,feeding D-galacturonicacid to tomato fruit resulted in an increase in the AsAcontent in red ripe fruits,but not green fruits,and the twoenzymes,D-galacturonate reductase and aldonolactonase-specific activities were detectable in the insoluble fractionof red ripe fruits,besides an introgression line,IL12-4displayed high levels of ascorbate,accumulated AsA pos-sibly by increasingflux through the L-galactonic acidpathway(Di Matteo et al.2010),suggesting strongly thatthe alternative D-galacturonate pathway contributes to AsAaccumulation in ripe tomato fruits(Badejo et al.2012).Thegene expression and feeding assay indicated that tomatomay accumulate AsA via an alternative D-galacturonatepathway,while its genetic evidence is lacking.Tomato fruits are considered a major dietary source ofvitamin C in many countries,because it is consumed reg-ularly and in large quantities.Tomato also serves as a fruitmodel for other crops species withfleshy berry.Accord-ingly,it is very important to monitor and to increase thevitamin C content in tomato fruit,for meeting the con-sumer demand and health requirements for high nutrition(Garcia et al.2009).Several earlier reports have suggestedit is possible to produce transgenic plants with enhancedvitamin C contents in tomato,but the accumulation of highlevels of AsA using GalUR gene in tomato has not yet beenachieved.In this study,wefirst investigated the involve-ment of D-galacturonate pathway by enzymatic assay of D-galacturonic acid reductase(GalUR),and then ectopically expressed GalUR gene from high-AsA species,strawberry,in tomato to genetically engineer the AsA accumulation andprovide further evidence for D-galacturonate pathway. Materials and methodsPlant materials and growth conditionsTomato[Solanum lycopersicum cv.Ailsa Craig(AC)],supplied by Tomato Genetics Research Center(Universityof California,Davis,USA),was grown in a naturallyilluminated glasshouse with temperature of28°C day/24°C night and relative humidity of70–80%under nat-ural light.Strawberry(Fragaria9ananassa cv.Plant Growth RegulFenglaixiang)was obtained in the local supermarket. Tomato leaves and fruit tissues of AC plants were col-lected,and the leaves of control,75l M methyl viologen (MV),200mM NaCl,and low temperature(4°C)treat-ment plants were also collected from1-month-old tomato seedlings.Construction and tomato transformationGenomic DNA was extracted from young leaves of strawberry using the method described(Fulton et al.1995). Total RNA was extracted from ripe strawberry fruit and used to synthesize single-stranded cDNA using M-MLV reverse transcriptase(Toyobo,Osaka,Japan)according to the instructions manual.cDNA and gDNA were used as templates for FaGalUR amplification by PCR with primers GalURF and GalURR(Table1).Amplified product was isolated,gel-purified,and cloned into a pMD18-T vector (TaKaRa,Japan)to generate pTGalUR vector for further sequencing.The pTGalUR vector containing the complete ORFs of FaGalUR was double-digested with SalI and KpnI,and ligated into pMV expression vector under the CaMV35S promoter.The resultant expression vector harboring Ga-lUR was designated as pBGalUR,and confirmed by sequencing and transformed into Agrobacterium tumefac-iens LBA4404by electroporation.Tomato seedlings of AC were used for transformation,performed as described (Fillatti et al.1987).Primary tomato transformants(T0)were assayed by PCR using nptII primer pairs of nptIIF and nptIIR,and primer combinations between CaMV35S promoter-specific primer and FaGalUR gene-specific primers GalURR (Table1).Southern blot analysis of T1lines was carried out using the Dig Detection Kit II according to the man-ufacturer’s instructions(Roche,Germany).Semi-quantitative RT-PCR and real-time RT-PCR analysisTotal RNA isolated by TRIzolÒreagent(Introvigen,USA) was used for reverse transcription(RT)-PCR to determine the expression of FaGalUR and SlGLDH in transgenic tomato plant,using the primers GalURF and GalURR and the primers GLDHF and GLDHR(Table1).First strand cDNA was synthesised from3l g total RNA from each sample using MMLV reverse transcriptase(Toyobo, Osaka,Japan)according to the supplier’s protocols. Tomato b-actin gene was used as internal control for RT-PCR analysis.General PCR was carried out using the following program:an initial denaturation at94°C for 3min,followed by24–30cycles of94°C for30s,58°C for30s,and72°C for1min,and afinal extension at 72°C for10min.RT-PCR experiments were repeated three times,and PCR products were detected by1% agarose gel in19TAE with EtBr.Real-time RT-PCR was used to analyse the expression levels of FaGalUR genes in wild-type and transgenic tomato plants.The primers(Table1),QGalURF and QGalURR,used for real-time RT-PCR were designed using the Primer5software.Total RNA was extracted from young leaves of tomato,and DNase I was used to clean out DNA before RT.Real-time RT-PCR was performed using the LightCycler480SYBR Green I Master kit(Roche, Germany)according to the supplier’s protocols.PCR amplification included a5-min pre-incubation step at 95°C,followed by40cycles of95°C for10s,58°C for 15s and72°C for20s.PCR products were quantified by the LightCycler480Real-Time PCR Detection System with the SYBR Green I Master Kit(Roche).D-galacturonic acid reductase(GalUR)activity assay Protein extraction from wild-type and southern positive T1 lines was carried out as described(Shen and Yeh2010).One gram of samples were homogenized in liquid nitrogen and extracted with50mM sodium phosphate buffer,pH7.2, containing2mM EDTA,2mM DTT,20%glycerol and PVPP.The supernatant obtained after a30min centrifuga-tion at4°C at6,0009g was used as the crude enzyme.D-galacturonic acid reductase(GalUR)activity was determined as described(Agius et al.2003).GalUR activity was measured by the decrease in absorbance at 340nm at25°C after the addition of100l l of crude enzyme extract to the assay medium(1ml)consisted of 50mM phosphate buffer(pH7.2),2mM EDTA,0.1mM NADPH,30mM D-galacturonic acid and2mM DTT.One unit of GalUR activity in the crude enzyme extract was expressed as nmol of NADPH oxidized min-1mg-1 protein.Table1Primer sequences used for polymerase chain reaction and reverse transcription polymerase chain reaction analysisName Primer sequence(50-30)GalURF TATCCCACATTCGATCCATTCATT GalURR GCTCATAATTCTTCGTCAACTTCC GLDHF ACGACACCGTTCAAATGC GLDHR CAACCAAGATTACACAGCCTCb-ActinF ATGGCAGACGGAGAGGATATTCA b-ActinR GCCTTTGCAATCCACATCTGCTG nptIIF AGACAATCGGCTGCTCTGAT nptIIR TCATTTCGAACCCCAGAGTC QGalURF CCAAGCCAAAGGAAAATCAAC QGalURR TGTCAAGGTTCTGCCTCATTC CaMV35S ACGCACAATCCCACTATCCTTC Plant Growth RegulExtraction and estimation of ascorbic acid(AsA)by HPLCAsA content was determined as described by Rizzolo et al. (1984).Briefly,samples from T2lines were ground under liquid nitrogen and homogenised in5mL of cold0.1% (w/v)metaphosphoric acid.The homogenate was then centrifuged at12,0009g for10min at4°C.The super-natant wasfiltered through a Millipore membrane (0.22l m)and an aliquot of300l L was incubated with 300l L50mM dithiothreitol for15min at room temper-ature.Then,the extracts were analysed by HPLC using an SB-aq column(Agilent)eluted with acetate buffer (0.2mol L-1pH4.5)at aflow rate of1.0mL min-1to measure total ascorbate.Elutes were detected at254nm, and a standard curve from2to40l g mL-1AsA was obtained.Abiotic stresses treatmentsOne-month-old wild-type and T2transgenic seedlings were used for oxidative and cold stress tolerance experi-ments.For oxidative stress test,plants were sprayed with 75l M methyl viologen for2days with spraying water as control.Then chlorophyll and malondialdehyde(MDA) contents were determined.For cold stress treatment, plants were incubated at4°C for10days,and chloro-phyll and MDA contents were measured7days after treatment.Survival rates were calculated after recovery at 25°C for4days.For salt tolerance experiment,plants were grown supplemented with200mM NaCl solution, replaced every2days for2weeks.Then chlorophyll content and fresh weight of aerial part and under-ground part were determined.Chlorophyll content assayChlorophyll content was determined as described by Zhang et al.(2011a).Briefly,0.2g of leaf tissues were ground under liquid nitrogen and extracted with8mL of80%(v/v)ace-tone.Extraction was performed under low light intensity. Absorption of the extracts at646and663nm was deter-mined spectrophotometrically.Chlorophyll was quantified using the following equation:Chlorophyll concentration (mg/mL)=7.18A663?17.32A646,where A represents absorbance at the specified wavelength.Measurement of MDA levelsExtraction was performed by homogenisation of0.5g leaf tissue with10mL5%(w/v)trichloroacetic acid,and the homogenate was centrifuged at10,000g for10min.Then, 2mL of5%trichloroacetic acid containing0.67%(w/v)thiobarbituric acid was added to2mL of the supernatant. The mixture was boiled for15min,quickly cooled on ice, and centrifuged at10,000g for5min.The supernatant was used for MDA determination according to Heath and Packer(Heath and Packer1968).Statistical analysisData analysis was performed using SAS.Significant dif-ferences were calculated using the Student’s t test at95or 90%confidence limit.ResultsGalUR enzymatic actives coincide with ascorbic acid accumulation in tomatoTo examine whether the D-galacturonic acid pathway functions in tomato AsA biosynthesis,we investigated the D-GalUR activity in leaves and fruit.As shown in Fig.1a the D-GalUR activity was consistently detected in leaves and diffident development stages of tomato fruits.The leaves showed the highest level of D-GalUR activity with 7.42Units mg-1protein,whereas the D-GalUR activity level was the lowest in mature green fruit.D-GalUR activity increased in breaker fruit,and then decreased in red fruit(Fig.1a).To determine the relationship between ascorbate content and the D-GalUR activity,the level of ascorbate was determined in leaf and fruit tissues of tomato.Tomato leaf exhibited the highest ascorbate levels among the different tissues investigated.In tomato fruit, the ascorbate level increased continuously along with the development and ripening of fruit(Fig.1b).The ascorbate content of tomato was coincident with the level of GalUR activity variation.Transgenic tomato overexpressing strawberry GalUR geneTransgenic tomato plants were obtained by the expression of FaGalUR gene via Agrobacterium-mediated transfor-mation.The expression of FaGalUR gene was driven by CaMV35S promoter.Forty-seven of55independent lines of pBGalUR transgenic tomato plants were validated by PCR.PCR results of several transgenic lines were pre-sented in Fig.2a.All the transformants were phenotypi-cally uniform and exhibited no difference in growth compared to the wild-type plants.The integration of gene and the inserted copy numbers were performed by Southern blot analysis.The estimatedPlant Growth Regulcopy numbers of the FaGalUR gene ranged from one to two in the different transgenic plants.Of the five tested transgenic lines,four (line 2,5,21and 41)contained a single transgene copy,while one (line 34)had two inserted copies in the genome (Fig.2b).RT-PCR resultes showed that FaGalUR were highly expressed in T 1transgenic lines,while FaGalUR was not detectable in untransformed control plants (Fig.2c).Interestingly,the expression level of SlGaLDH ,the last step common gene in D -mannose/L -galactose pathway and D -galacturonate pathway,was also elevated compared to the untransformed control (Fig.2c).Two lines,GalUR 21and GalUR-48,with high-level transgene expression were chosen for quantitative real-time RT-PCR analysis.The GalUR mRNA expression level was recorded compared to internal control b -actin gene.The results showed that high GalUR transcript abundance was observed in the transgenic lines (Fig.2d).GalUR enzymatic actives and ascorbic acid content in transgenic tomato plantsThe activity of GalUR in tomato transgenic plants was mea-sured by spectrophotometric method detecting the oxidation of NADPH.In tomato leaf,the GalUR activities in T 1lines (21-2and 41-8)were 42–63%higher than the untransformed control (Fig.3).The activities of GalUR in the mature green fruit increased to 1.26-fold to 1.27-fold of the control (Fig.3).The amount of ascorbic acid present in red ripe fruits and leaves of the T 1transgenic lines and untransformed plants were measured by High-performance liquid chromatography (HPLC).Two transgenic lines of GalUR 21and GalUR 41accumulated ascorbic acid content up to 43.24and 52.13mg/100g FW in red ripe fruits respectively,representing a 1.64-fold to 1.98-fold compared to wild-type control (Table 2);simultaneously,the leaf ascorbic acid level of two transgenic lines increased to 1.71-fold and 1.61-fold as compared with wild-type plants in fully expanded young leaves respectively (Table 2).These demonstrate that the ectopic expression of strawberry FaGalUR gene in tomato could increase ascorbic acid content in fruits and leaves.FaGalUR expression improved tolerance to oxidative stress in tomatoThe extent of leaf chlorophyll loss reflects the damage caused by MV.As shown in Fig.4,chlorophyll content was not sig-nificantly different between wild-type and transgenic plants without MV treatment.After oxidative stress treatment,chlo-rophyll content in the wild-type plants decreased much lower than transgenic lines GalUR 21-2and GalUR 41-8(Fig.4a).MV treatment causes membrane-lipid peroxidation,leading to increased MDA content.Under normal condi-tions,the MDA content of wild-type and transgenic plants showed no significant difference.MV treatment resulted in up to 91%increase in MDA content in wild-type plants,whereas only 27and 63%increase were found in GalUR 21-2and GalUR 41-8lines,respectively (Fig.4b).These results demonstrate that overexpressing FaGalUR gene in tomato confer tolerance to oxidative stress.FaGalUR expression improved salt tolerance in tomato Under normal conditions,the chlorophyll content of wild-type and transgenic plants showed no significant differ-ence.After NaCl treatment,the chlorophyll content in wild-type plants decreased to a significant lower level than that in transgenic lines (P \0.05).NaCl treatment led to 83%reduction of chlorophyll content in wild-type plants,while reduction of chlorophyll content in lines GalUR 21-2and GalUR 41-8was only 44and 42%,respectively (Fig.5a).Fig.1The GalUR activity (a )and the ascorbate content (b )in wild-type tomato leaves and fruit.The GalUR activity and ascorbate levels of tomato were measured in leaf (L ),mature green fruit (MG ),breaker fruit (Br )and red ripe fruit (Rr ),respectively.Data represents the mean ±SD of three replicatesPlant Growth RegulAfter salt treatment,the fresh weight of aerial part and under-ground part were significant higher than those of wild-type control,as shown in Fig.4b.In aerial part,the fresh weight of transgenic lines,GalUR 21and GalUR 41,was 1.39-fold and 1.64-fold of the wild-type plants,respectively.For the under-ground part,the fresh weight of transgenic lines,GalUR 21and GalUR 41,was 1.16-fold and 1.75-fold of wild-type plants,respectively (Fig.5b).These results indicated that overexpression of FaGalUR in tomato could significantly improve salt tolerance.FaGalUR expression improved cold tolerance in tomatoUpon colds stress,the transgenic lines were slightly affected and only a few leaves began to wilt,while the wild-type plants severely wilted after 7days treatment.Under normal conditions,there was no significant differ-ence between transgenic lines and wild-type in chlorophyll and MDA content.After cold treatment,chlorophyll con-tent in the wild-type plants decreased by 58%,while only 19%decrease was detected in transgenic lines GalUR 21-2and GalUR 41-8(Fig.6a).Simultaneously,after cold treatment,the MDA content of wild-type plants increased by 2.6-fold,whereas the transgenic lines exhibited a slight increase of 1.2-fold and 1.3-fold,respectively (Fig.6b).Plant death rate after 4-day recovery was 100%for the wild-type plants and 53and 13%for the transgenic lines GalUR 21-2and GalUR 41-8,respectively (Fig.6c).These result suggested that the overexpression of FaGalUR genes in tomato could improve cold tolerance compared with the wild-typeplants.Fig.2a PCR detection of pBGalUR transgenic plants.M ,marker;N ,negative control;P ,positive control;Lines 1–22:transgenic plants;b southern blot analysis of the copy number in T 1tomato transgenic nes 2,5,21,34and 41:transgenic plants;c RT-PCR analysis of of T 1transgenic lines using GalUR gene specific primers.AC :tomato wild type control;Lanes 2,5,21,34and 41:transgenic plants.The Slactin gene was amplified in RT-PCR as an internal control;d the relative transcript abundances of GalUR in transgenic lines 21.2and 41.8.Data were obtained by real-time RT-PCR normalised against SlactinPlant Growth RegulDiscussionAlthough the D -galacturonic acid pathway has been pro-posed for many years in plants (Agius et al.2003),there is still no direct evidence for the universal existence of D -galacturonic acid pathway,except for the strawberry.Up to now,GalUR gene was only cloned from strawberry and expressed in other plant species.The overexpression of FaGalUR in Arabidopsis thaliana ,potato and tomato hairy roots results in a twofold to threefold,1.6-fold to twofold and 2.5-fold increase in AsA content in transgenic lines,respectively (Agius et al.2003;Hemavathi et al.2009;Oller et al.2009).In this study,D-GalUR activity was detected in leaves and diffident development stages of tomato fruits,and partially correlation with ascorbate content in tomato (Fig.1).In addition,FaGalUR expres-sion significantly elevated ascorbic acid levels in tomato fruit and leaf (Table 2),suggesting that the tomato shares an alternative D -galacturonic acid pathway both in leaf and fruit.The D -galacturonic acid reductase catalyzed the con-version of D -galacturonic acid to L -galactonic acid in plant.The D -galacturonic acid,known as an abundant component of the cell wall,was a degradation product of pectin in senescencing plant cells.It was reported that the expression levels of FaGalUR were correlated with increased ascor-bate content in ripe strawberry fruit (Agius et al.2003),and an up-regulated expression of VvGalUR was demonstrated in ripe grape berries,correlated with a second phase of increased AsA accumulation during grape ripening devel-opment (Melino et al.2009).In the present study,the FaGalUR were highly expressed in T 1transgenic lines,and the expression level of SlGaLDH ,the last step gene in D -mannose/L -galactose pathway,was also elevated in T 1transgenic lines (Fig.2),suggesting that the degradation of pectins in the process of fruit ripening may contribute to ascorbateaccumulation.Fig.3The GalUR activity in T 1transgenic lines and untransformed control lines.The GalUR activity of T 1transgenic and untransformed control lines was measured in leaf,mature green fruit,breaker fruit and red ripe fruit,respectively.Data represents the mean ±SD of three replicates.Asterisk indicates values that is significantly different from control (at P [0.95)Table 2Ascorbic acid contents in red ripe fruits and leaves of overexpressing D -galacturonic acid reductase gene transgenic lines and the control tomatoesTotal ascorbate content (mg/100g FW)WTGalUR 21.2GalUR 41.8Ripe fruit 26.37±1.0943.24±1.79*52.13±7.36*Leaf53.54±2.1790.58±5.43*94.30±8.58*Data presented as mean ±SD of three independent plants per line *Significant difference in comparison with control (Student’s t test,P \0.05)Fig.4FaGalUR overexpressing transgenic tomato plants have improved oxidative stress tolerance.One-month-old wild-type and two transgenic plants were constantly sprayed with 75l M MV for 2days.Chlorophyll content (a )and the MDA content (b )in the fourth leaf of MV-treated and untreated plants were measured 7days post-treatment.Data presented as mean ±SD (N =5)from triplicate independent measurements.Asterisk indicates values that are signif-icantly different from those of wild-type plantsPlant Growth RegulIn tomato,increasing evidence supports the hypothesis that the alternative D -galacturonate pathway contributes to AsA accumulation.When feeding leaves with 30mM D-GAL,the level of GalUR activity was elevated up to 1.25-fold of control leaves,and the GalUR activity increased 1.6-fold to 2.0-fold in transgenic tomato leaves as compared to the non-transgenic leaves (Supplemental Table 1).We also found that the GalUR activities in T 1lines (21-2and 41-8)were higher than the untransformed control,and the elevated activity of GalUR was detected in mature green fruit (Fig.3).These results were well sup-ported by feeding analysis with the D-GalA to Micro-Tom fruit.It was found that feeding D-GalA to Micro-Tom fruit could lead to an increased ascorbate content in red ripened tomato fruits,and the D -galacturonate reductase and ald-onolactonase-specific enzyme activities were detected in the insoluble fraction of the red fruits (Badejo et al.2012).The SlGalUR gene was mapped to 2-A using tomatointrogression lines (Zou et al.2006),and an introgression line with higher ascorbate content,IL12-4,had shown increased transcript levels of pectinesterase andtwoFig.5Response of FaGalUR transgenic and wild-type tomato plants to salt treatment.The chlorophyll content (a )in the fourth leaf of NaCl-treated and untreated plants and fresh weight of aerial part and under-ground part (b )were determined after 2weeks NaCl treatment.Asterisk indicates values that are significantly different from those of wild-typeplantsFig.6Expression of FaGalUR genes in tomato improved cold stress tolerance.Chlorophyll content (a )and MDA content (b )in the fourth leaf of cold-treated and untreated plants were determined after 7days cold treatment.Plant death rates after recovery are shown (c ).Data presented as mean ±SD (N =15)from triplicate independent measurements.Asterisk indicates values that are significantly differ-ent from those of wild-type plantsPlant Growth Regul。
基础医学与临床Basic & Clinical MedicineJanuary 2021Vol.41 No.12021年 1月 第41卷第1期文章编号:1001-6325 ( 2021 ) 01-0008-05研究论文自发KDM 6A 剪切位点突变致歌舞伎综合征合并性早熟和矮小一例赵亚玲,李淑颖,王曦,聂敏,伍学焱,茅江峰*收稿日期:2019-12-05 修回日期:2020-03-29基金项目:国家重点研发计划(2016YFC0905102, 2016YFA0101003);国家自然科学基金(81771576,81971375);中国医学科学院医学与健康科技创新工程(2016-I2M-1-002 , 2017-I2M-3-007)*通信作者(corresponding author ) : maojiangfeng88@ (中国医学科学院北京协和医学院北京协和医院内分泌科,北京100730)摘要:目的分析一例组蛋白特异性赖氨酸脱甲基酶(KDM 6A )基因自发突变导致歌舞伎综合征(KS)2型患者的临床特点及致病基因,增加对疾病致病基因和临床特点的认识。
方法收集患者的临床表现、生化检验及影像学资料进行分析,抽取患者及父母外周静脉血,提取基因组DNA ,对全外显子基因进行测序。
结果1)患儿以真性性早熟、矮小为主要临床表现。
2)患者出现KS 典型的面部、骨骼、皮纹异常和智力偏低表现。
3)患儿及父母外周血基因全 外显子测序提示,患儿存在自发KDM 6A 基因剪切位点突变。
结论KDM 6A 基因突变可导致KS 。
本文报道了一例KS 合并性早熟和矮小的病例,而性早熟和矮小与KS 的相关性仍有待进一步证实。
关键词:歌舞伎综合征;KDM 6A ;真性性早熟;剪切位点突变;身材矮小中图分类号:R585文献标志码:BA case of Kabuki syndrome with precocious pubertyand short stature due to novel KDM 6A splice-site mutationZHAO Ya-ling, LI Shu-ying, WANG Xi , NIE Min, WU Xue-yan , MAO Jiang-feng *(Department of Endocrinology, Peking Lnion Medical College Hospital, CAMS & PLMC , Beijing 100730, China)Abstract : Objective To investigate the pathogenic gene mutations and clinical characteristics of type 2 Kabukisyndrome by analyzing a patient with novel splicing KDM 6A gene mutation. Methods Clinical features , laboratory data and radiologic manifestations were collected. The whole exon was sequenced . Results 1) Patient presentedwith typical facial , skeletal and dermatoglyphic abnormalities , and mild intellectual impairment. 2) The main clini cal manifestations were central precocious puberty and short stature. 3) Whole exon sequencing peripheral lympho cytes of the patient and of her parents identified a denovo splicing mutation in KDM 6A gene. Conclusions KDM 6Amutation may cause Kabuki syndrome , central precocious puberty and dwarfism. This case expands the understand ing of clinical manifestations and gene mutation in Kabuki syndrome.Key words : Kabuki syndrome ; KDM 6A ; central precocious puberty ; splicing mutation , dwarfism歌舞伎综合征(Kabuki syndrome , KS )是一种以 特殊面容、骨骼异常、皮纹异常、智力低下和生长缓慢为主要临床表现的罕见病[1]。

TBP相关凶r3(TRF3)在小鼠早期胚胎和细胞系中的表达及功能分析图1TBP家族成员之间的进化关系㈣1.Z.1TRFl第‘个TBP相关因子TRFl首先在果蝇中发现,并且迄今为止也仅发现在果蝇中存在““。
TRFl的C末端与TBPC末端核心区域具有很高的同源性,可以与TATA元件结合。
TRFl主要在胚胎、成体神经系统和雄性生殖细胞中表达。
TRFl也可以和TFIIA和TFIIB结合。
Hansen等(1997)“21最初发现TRFi可能参与PolII对部分组织特异性基因的转录,但同时他们也发现,多线染色体染色时,TRFI弓TBP在染色体上具有不同的定位,TFRl集中在PolIII转录位点。
随后的生化分析表明,果蝇胚胎核抽提物中去除TRFl(而非TBP)会导致PolIII的转录抑制”3,说明TRFl在PolIII的转录过程中起重要作用。
令人疑惑的是6图2不同物种TRF3序列比较及与人TBP序列比较…3黑色表示两个物种以上的TRF3序列与TBP保守,有变化的地方为灰色;蓝色表示3个物种以上的TRF3序列保守。
TBp序列中与TATAT元件(I)、TFIIA(V)和TFIIB(●)结合的位置分别在图中表示出。
2.早期胚胎的基因激活2.1卵母细胞和精子的成熟生长中的卵母细胞有一个很大的生发泡(有时也被称为生殖泡)(germinalyesiele,GV),相当于细胞的核,因此该阶段的卵母细胞也被称为GV期卵母细胞。
GV期卵母细胞存在活跃的转录,但随着卵母细胞的成熟,转录水平逐渐降低””。
充分生长的卵母细胞在激素的刺激下发生生发泡破裂(GVbreakdown),染色体浓缩,进行减数分裂,并最终停在第一次减数分裂的中期即MII期。
此时的染色体高度浓缩,转录沉默。
精子发生的最后一个阶段即拉长阶段,通过多步骤的蛋白交换过程,精子细胞核内的组蛋白最终被精子所特有的精蛋白代替。
成熟精子中DNA与精蛋白并不形成核小体结构,而是形成晶体样结构,该结构比中期染色体的紧密程度还有高出6倍。
斑马鱼(Danio rerio)胚胎免疫反应:补体基因在早期胚胎以及LPS刺激胚胎中的表达李宗耀;杨雨佳;张士璀;汲广东【摘要】以模式生物斑马鱼(Danio rerio)为研究对象,使用原位杂交及实时荧光定量PCR方法,对斑马鱼补体基因(C3,C4,C9,Bf1,Bf2,Bf3)及其调节因子(RCA2.1,RCA2.2)在早期胚胎中的时空表达模式及LPS刺激后表达量的变化进行了研究.结果表明,上述基因在胚胎早期(卵裂期至体节期)均为泛表达,从受精后24h至幼鱼阶段特异性表达于肝脏及消化道等器官.对胚胎显微注射LPS后,C3、C9、Bf1、Bf2、Bf3基因在早期胚胎中表达上调,RCA2.1基因表达下调,这与斑马鱼成鱼受到革兰氏阴性菌感染后补体分子(C3,C9,B因子等)的反应类似,表明其参与补体激活途径、溶膜途径及补体调节,提示斑马鱼可在胚胎发育早期构建补体系统,参与急性期反应等免疫反应.【期刊名称】《海洋与湖沼》【年(卷),期】2015(046)006【总页数】7页(P1444-1450)【关键词】补体;斑马鱼;胚胎;LPS;表达模式【作者】李宗耀;杨雨佳;张士璀;汲广东【作者单位】中国海洋大学海洋生物多样性与进化研究所青岛 266003;中国海洋大学海洋生物多样性与进化研究所青岛 266003;中国海洋大学海洋生物多样性与进化研究所青岛 266003;中国海洋大学海洋生物多样性与进化研究所青岛266003【正文语种】中文【中图分类】Q786斑马鱼(Danio rerio)是脊椎动物的模式生物,与大多数鱼类相似,均为体外受精并发育。
在胚胎发育过程中,鱼卵暴露于水中,同水中大量的病原微生物直接接触。
这就引出一个问题,鱼类胚胎在发育过程中是如何保护自身免受外源微生物入侵的?鱼类的特异性免疫于脊椎动物中发育程度较低,免疫球蛋白种类和数量均有限,已有的研究表明,与鱼类特异性免疫相关的基因(Rag2,AID,TCRAC,IgLC-1,mIg,sIg,IgZ和DAB)直到胚胎受精后8天才对LPS诱导有强烈反应(Li et al,2011),说明在胚胎发育早期,特异性免疫尚未成熟,非特异性免疫尤其是补体系统在胚胎发育中的构建对其抵御外界病原体的入侵具有重要的意义。
中南大学学报(医学版)J Cent South Univ (Med Sci)2021,46(6)心磷脂变化参与非酒精性脂肪性肝病相关线粒体功能障碍的发生和发展吴敏,陈联辉,陈郎湖,汪勇芬(福建医科大学附属第二医院儿科,福建泉州362000)[摘要]非酒精性脂肪性肝病(non-alcoholic fatty liver disease ,NAFLD)是最常见的肝疾病之一,其发生常伴随着线粒体功能障碍。
心磷脂作为线粒体内膜的特殊脂质,其任何改变都有可能引起一系列线粒体相关疾病。
心磷脂含量的变化、心磷脂重构后脂肪酸侧链的组成变化及心磷脂重构酶的含量改变在NAFLD 相关线粒体功能障碍的发生和发展中发挥着重要的作用。
[关键词]非酒精性脂肪性肝病;线粒体功能障碍;心磷脂Changes of cardiolipin involve in the occurrence and development of mitochondrial dysfunction associatedwith non -alcoholic fatty liver diseaseWU Min,CHEN Lianhui,CHEN Langhu,WANG Yongfen(Department of Pediatrics,Second Affiliated Hospital of Fujian Medical University,Quanzhou Fujian 362000,China)ABSTRACT Non-alcoholic fatty liver disease (NAFLD)is one of the most common liver diseases ,which is often accompanied by mitochondrial dysfunction.Cardiolipin is a special lipid of mitochondrial inner membrane and any change of cardiolipin may cause series of mitochondria-relevant diseases.Changes in cardiolipin content,fatty acid side chain composition after cardiolipin remodeling,and the content of cardiolipin remodeling enzymes play an important role in the occurrence and development of NAFLD-related mitochondrial dysfunction.KEY WORDS non-alcoholic fatty liver disease;mitochondrial dysfunction;cardiolipinDOI :10.11817/j.issn.1672-7347.2021.200583/xbwk/fileup/PDF/202106653.pdf收稿日期(Date of reception):2020-06-30第一作者(First author):吴敏,Email:810539517@,ORCID:0000-0003-1847-9294通信作者(Corresponding author):汪勇芬,Email:136********@,ORCID:0000-0003-3023-4994基金项目(Foundation item):国家自然科学基金(81803595)。
internal ribosome entry site名词解释概述及解释说明1. 引言1.1 概述在分子生物学领域,internal ribosome entry site (IRES,内源性核糖体进入位点)是一种与蛋白质合成调控相关的结构元素。
它存在于某些RNA分子中,可以使核糖体在缺少5'端7-甲基鸟苷帽(m7G)的情况下进入并开始翻译蛋白质编码区域。
这种非经典的转录起始机制通过使部分mRNA分子直接与核糖体结合而绕过了传统上依赖5'端mRNA减数带(untranslated region,UTR)的转录起始点。
1.2 文章结构本文将介绍和解释IRES的定义、功能和作用,并对其发现和研究历程进行概述。
随后,我们将重点讨论IRES的基本结构和特点,以及它与蛋白质合成调控之间的关系。
此外,我们还将介绍IRES在疾病相关性研究方面的最新进展。
文章最后将总结IRES在生物学中的重要性和应用前景,并提供关于未来研究方向的展望和建议。
1.3 目的本篇文章的目的是全面介绍和解释IRES的相关知识,使读者了解其在蛋白质合成调控中的重要作用。
通过阐述其基本结构、功能和与疾病相关性的研究进展,我们希望引发对IRES的深入研究,并为未来的科学探索提供新的思路和方向。
2. internal ribosome entry site名词解释2.1 定义Internal ribosome entry site(IRES)是一段能够在核糖体无需首先依赖5'端启动子的情况下直接招募和定位核糖体的RNA序列元素。
它可以让核糖体直接从内部某个位置进入mRNA,从而实现蛋白质的合成。
2.2 功能和作用IRES在蛋白质合成中起到了重要的作用。
通常,蛋白质合成依赖于mRNA 5'端的启动子来引导核糖体开始转录过程。
然而,对于一些具有IRES元素的mRNA,它们可以通过一种另类的启动机制进行蛋白质合成,而不需要依赖于传统的5'端启动子。
•论S A R S-C o V-2 N s p l6蛋白分子特征及其对男性生殖功能潜在影响张凌寒张婉玉徐小路郭艺红450001郑州,郑州大学第一附属医院生殖医学中心,河南省生殖与遗传重点实验室通信作者:郭艺红,E-mail:136****3710@D01:10.16462/ki.zhjbkz.2021.04.013【摘要】目的C0VID-19可能并发生殖功能损伤的问题已引起关注。
本研究分析SARS-C〇V-2 NsP16蛋白遗传特征、分子结构与生物功能,探讨病毒侵人睾丸组织后NSP16对生殖细胞的潜在影响,为该病发病机制和治疗策略研究奠定基础。
方法应用生物信息技术和国际生物数据库,分析基因变异性、N spl6空间结构与功能及对生殖细胞的潜在影响,并利用Drug-Bank 数据库筛选可靶向结合 NsP16 的药物。
结果基于 3 种30 株冠状病毒的叫>16 序列构建了进化树;SARS-C〇V-2毒株间哪16基因保守性为99%; N sp l6属于亲水蛋白,在体外细胞的半衰期(half-life)是1.9 h;N sp16具有甲基转移酶活性,具有调节精子和睾丸间质细胞基因和功能蛋白甲基化潜能;NsP16具有线性B细胞和CTL细胞抗原表位,可能通过激发免疫反应损伤睾丸组织;从 DrugBank数据库筛选出2种可靶向结合N sp l6的抑制性药物。
结论SARS-C〇V-2 N sp l6是基因局度保守的功能蛋白;病毒经血管紧张素转换酶2( angiotensin-converting enzyme 2,ACE2)受体侵人睾丸组织后,NsP16可能通过促进宿主细胞基因和蛋白甲基化机制,影响生殖细胞生长发育。
该研究首次报道耙向结合NS p l6的化疗药物,对C0VID-19及相关男性生殖系统疾病的防治研究具有重要参考价值。
【关键词】核糖甲基转移酶;新型冠状病毒;NsP16;治疗策略;遗传特征【中图分类号】R373【文献标识码】A 【文章编号】1674-3679(2021)04-0439-06基金项目:国家自然科学基金(81571409);河南省高校科技创新团队支持计划(18IRTSTHN030)Molecular characteristics of SARS-CoV-2 Nspl6 protein and analysis of its potential effect on male reproductive function ZHANG Ling-han, ZHANG Wan-yuy XU Xiao-lu, GUO Yi-hongCenter for Reproductive Medicine,the First Affiliated Hospital of Zhengzhou University,Henan Province Key Laboratory of Reproduction and Genetics, Zhengzhou 450001, ChinaCorresponding author••GUO Yi-hong, E-mail: 136****************【Abstract】Objective The possibility of coronavirus disease 2019 ( COVID-19 ) involving inju-ry to reproductive function has attracted attention. This study analyzed the genetic characteristics, molecular structure and biological function of severe acute respiratory syndrome coronavirus 2 (SARS-CoV-2)Nspl6 protein, and explored potential effects of Nspl6 on germ cells following the virus, invading testicular tissue, aiming to lay basis for studies of pathogenic mechanisms and therapeutic strategies. Methods Bioinformatic techniques and international biological databases were used to analyze nsp\6genetic variability, Nspl6 spatial structure and function, and effects on genes and proteins of germ cells. DrugBank databases were applied in screening for drugs targeted at Nspl6. Results An evolutionary tree was constructed based on the nsp\6sequences of 30 isolates of 3 coronavirus species. The nsp\6conserved property was 99% amongst SARS-CoV-2 isolates. Nspl6 is a hydrophilic protein, with a 1.9 h half-life insidecells in vitro. Nspl6 has methyltransferase activity, showing potential to regulate gene and functional protein methylation of sperm and Leydig cells. Nspl6 has both linear B cell epitopes and CTL cell epitopes,with capacity to induce immune responses and damage to testicular tissue. Two inhibitory drugs targeted at Nsp 16 were found by screening the DrugBank database. Conclusions SARS-CoV-2 Nsp 16 is a functional protein encoded by a highly conserved gene, may affect germ cell growth and development by promoting methylation of host cellular genes and proteins following the virusf invasion into testis tissue through angiotensin-converting enzyme 2 receptors. This report presents Nspl6-targeted chemotherapeutic drugs for the first time, showing high reference value for prevention and treatment of COVID-19 and related lesions of the male reproductive system.【Key words】Ribose methyltransferase;SARS-CoV-2;Nspl6;Therapeutic strategy;Genetic characteristicFund programs: National Natural Science Foundation of China (81571409); Henan Innovation Team Support Program for Colleges and Universities ( 18IRTSTHN030)(Chin J D L s Control Prev2021,25(4) :439-444)目前,SARS-C〇V-2感染确诊病例已超过3 000 万,死亡病例超过100万。
DOI: 10.1126/science.1230612, 1587 (2012);338 Science et al.Nuno L. Barbosa-Morais SpeciesThe Evolutionary Landscape of Alternative Splicing in VertebrateThis copy is for your personal, non-commercial use only.clicking here.colleagues, clients, or customers by , you can order high-quality copies for your If you wish to distribute this article to othershere.following the guidelines can be obtained by Permission to republish or repurpose articles or portions of articles): January 1, 2014 (this information is current as of The following resources related to this article are available online at/content/338/6114/1587.full.html version of this article at:including high-resolution figures, can be found in the online Updated information and services, /content/suppl/2012/12/19/338.6114.1587.DC1.htmlcan be found at:Supporting Online Material /content/338/6114/1587.full.html#related found at:can be related to this article A list of selected additional articles on the Science Web sites /content/338/6114/1587.full.html#ref-list-1, 35 of which can be accessed free:cites 75 articles This article /content/338/6114/1587.full.html#related-urls 16 articles hosted by HighWire Press; see:cited by This article has been/cgi/collection/evolution Evolutionsubject collections:This article appears in the following registered trademark of AAAS.is a Science 2012 by the American Association for the Advancement of Science; all rights reserved. The title Copyright American Association for the Advancement of Science, 1200 New York Avenue NW, Washington, DC 20005. (print ISSN 0036-8075; online ISSN 1095-9203) is published weekly, except the last week in December, by the Science o n J a n u a r y 1, 2014w w w .s c i e n c e m a g .o r g D o w n l o a d e d f r o moctatomic S,dimethyltrisulfide,and dimethyl-tetrasulfide,the latter two for about a combined 1mmole/g;the fragment contained in addition only naphthalene at2to8nmol/g,plus methyl-naphthalenes and biphenol in subnanomole amounts, but no alkanes or anthracene/phenanthrene.The SM meteorite demonstrates that the com-plexity of C-class asteroid surfaces is greater than previously assumed.Rapid terrestrial alteration probably erases many vestiges of the internal and external processes on the asteroid that remain to be explored in spacecraft sample-return missions.References and Notes1.M.Fries,J.Fries,Meteorit.Planet.Sci.45,1476(2010).2.P.Jenniskens,M.Zolensky,Meteorit.Bull.46,1(2012).3.Materials and methods are available as supplementarymaterials on Science Online.4.D.R.Christie,P.Campus,in Infrasound Monitoring forAtmospheric Studies,A.Le Pichon,E.Blanc,A.Hauchecorne,Eds.(Springer,Dordrecht,Netherlands,2010),pp.29−75.5.T.A.Ens,P.G.Brown,W.N.Edwards,E.A.Silber,J.Atmos.Sol.Terr.Phys.80,208(2012).6.E.A.Silber,A.Le Pichon,P.Brown,Geophys.Res.Lett.38,L12201(2011).7.M.H.Shaddad et al.,Meteorit.Planet.Sci.45,1557(2010).8.K.D.Smith et al.,Science305,1277(2004).9.H.Haack et al.,Meteorit.Planet.Sci.47,30(2012).10.H.Haack et al.,in Workshop on the First Solids in theSolar System,7to9November2011,Koloa,Kauai,Hawai’i(Lunar and Planetary Institute,Houston,TX,2011),abstr.9100.11.K.Nishiizumi,M.W.Caffee,Meteorit.Planet.Sci.44(suppl.),5358(2009).12.U.Ott,Rev.Mineral.Geochem.47,71(2002).13.V.S.Heber et al.,Geochim.Cosmochim.Acta73,7414(2009).14.I.Leya,nge,S.Neumann,R.Wieler,R.Michel,Meteorit.Planet.Sci.35,259(2000).15.M.Gounelle et al.,in The Solar System Beyond Neptune,M.A.Barucci,H.Boehnhardt,D.P.Cruikshank,A.Morbidelli, Eds.(Univ.of Arizona Press,Tucson,AZ,2008),pp.525–541.16.D.Nesvornýet al.,Astrophys.J.713,816(2010).17.K.J.Walsh,M.Delbo,W.F.Bottke,paper presented atthe44th American Astronomical Society/Division ofPlanetary Sciences Meeting,Reno,NV,14to19October,2012,abstr.305.04.18.A.Tsuchiyama et al.,Meteorit.Planet.Sci.44(suppl.),5189(2009).19.O.Popova et al.,Meteorit.Planet.Sci.46,1525(2011).20.D.S.Ebel,M.L.Rivers,Meteorit.Planet.Sci.42,1627(2007).21.R.J.Macke,D.T.Britt,G.J.Consolmagno,Meteorit.Planet.Sci.46,311(2011).22.D.T.Britt et al.,paper presented at the Meteoritical SocietyMeeting,Cairns,Australia,12to17August2012,abstr.5250.23.M.S.Spergel,R.C.Reedy,zareth,P.W.Levy,L.A.Slatest,J.Geophys.Res.91,483(1986).24.P.Rochette et al.,Meteorit.Planet.Sci.43,959(2008).25.J.Gattacceca,P.Rochette,Earth Planet.Sci.Lett.227,377(2004).26.A.Bischoff,E.R.D.Scott,K.Metzler,C.A.Goodrich,inMeteorites and the Early Solar System II,uretta,H.Y.McSween Jr.,Eds.(Univ.of Arizona Press,Tucson,AZ,2006),pp.679−712.27.R.J.Walker et al.,Geochim.Cosmochim.Acta66,4187(2002).28.Q-Z.Yin,K.Yamashita,A.Yamakawa,R.Tanaka,B.Jacobsen,D.S.Ebel,I.D.Hutcheon,and E.Nakamura,Lunar Planet.Sci.XL,abstr.2006(2009).29.J.M.Friedrich,M.-S.Wang,M.E.Lipschutz,Meteorit.Planet.Sci.37,677(2002).30.E.Tonui,M.E.Zolensky,M.E.Lipschutz,Proc.NIPRSymp.Antarct.Meteorites15,38(2002).31.M.Haq,F.A.Hasan,D.W.G.Sears,C.B.Moore,C.F.Lewis,Geochim.Cosmochim.Acta53,1435(1989).32.G.D.Cody et al.,Earth Planet.Sci.Lett.272,446(2008).33.E.D.Young,R.D.Ash,P.England,D.Rumble3rd,Science286,1331(1999).34.G.K.Benedix,L.A.Leshin,J.Farquhar,T.Jackson,M.H.Thiemens,Geochim.Cosmochim.Acta67,1577(2003).35.M.M.Grady,Astron.Geophys.50,4.21(2009).36.P.Schmitt-Kopplin et al.,Proc.Natl.Acad.Sci.U.S.A.107,2763(2010).37.G.W.Cooper,W.M.Onwo,J.R.Cronin,Geochim.Cosmochim.Acta56,4109(1992).38.A.A.Monroe,S.Pizzarello,Geochim.Cosmochim.Acta75,7585(2011).39.D.P.Glavin,M.P.Callahan,J.P.Dworkin,J.E.Elsila,Meteorit.Planet.Sci.45,1948(2010).40.J.R.Cronin,S.Pizzarello,Geochim.Cosmochim.Acta54,2859(1990).41.K.Lodders,Astrophys.J.591,1220(2003).42.E.Jarosewich,R.S.Clarke Jr.,J.N.Barrows,Eds.,Smithson.Contrib.Earth Sci.27,1(1986).43.P.G.Brown et al.,Science290,320(2000).44.R.N.Clayton,T.K.Mayeda,Geochim.Cosmochim.Acta63,2089(1999).45.R.N.Clayton,T.K.Mayeda,J.N.Goswami,E.J.Olsen,Geochim.Cosmochim.Acta55,2317(1991).46.R.N.Clayton,T.K.Mayeda,A.E.Rubin,J.Geophys.Res.89,C245(1984).47.G.J.MacPherson et al.,Geochim.Cosmochim.Acta73,5493(2009).48.E.D.Young,S.S.Russell,Science282,452(1998).Acknowledgments:The rapid recovery of SM was made possibleby the local communities of Lotus,Coloma,Pilot Hill,and GrassValley,due in part to the support of property owners,communityleaders,SETI Institute and University of Caifornia at Davis(UC Davis)student and volunteer searchers,and officials of the MarshallGold Discovery State Historic Park and the State of California.Wethank J.Howard,M.Carter,D.E.Macon,and L.Hofland of theNASA Ames Research Center;M.Hill of the American Museum ofNatural History;and G.Baxter,N.Botto,D.Rowland,O.Kreylos,L.Kellogg,and D.Summer of UC Davis for assistance with reportedmeasurements.The NASA Ames Research Center–coordinatedsearch efforts were supported by the NASA Lunar Science Institute.E.D.Y.,M.Z.,A.M.D.,D.S.E.,J.E.E.,K.N.,K.C.W.,M.H.T.,M.W.C.,Q.-Z.Y.,and S.B.S.acknowledge the NASA Cosmochemistry Programfor support of work reported here.In addition,the followingNASA programs are sincerely acknowledged:Near Earth ObjectObservation Program(P.J.),Origins of Solar Systems(S.A.S.),Planetary Major Equipment(Q.-Z.Y.),Sample Return LaboratoryInstruments and Data Analysis(M.W.C.),the NASA AstrobiologyInstitute(J.E.E.,J.P.D.,and D.P.G.),the SPring-8Grant Program(M.Z.),and Post Doctoral Programs(A.S.B.).P.R.H.acknowledgessupport from the Tawani Foundation.R.O.acknowledges KAKENHIgrants from the Japan Society for the Promotion of Science.Supplementary Materials/cgi/content/full/338/6114/1583/DC1Materials and MethodsSupplementary TextFigs.S1to S36Tables S1to S22References(49–105)9July2012;accepted12November201210.1126/science.1227163The Evolutionary Landscapeof Alternative Splicing in Vertebrate SpeciesNuno L.Barbosa-Morais,1,2Manuel Irimia,1*Qun Pan,1*Hui Y.Xiong,3*Serge Gueroussov,1,4* Leo J.Lee,3Valentina Slobodeniuc,1Claudia Kutter,5Stephen Watt,5RecepÇolak,1,6 TaeHyung Kim,1,7Christine M.Misquitta-Ali,1Michael D.Wilson,4,5,7Philip M.Kim,1,4,6 Duncan T.Odom,5,8Brendan J.Frey,1,3Benjamin J.Blencowe1,4†How species with similar repertoires of protein-coding genes differ so markedly at the phenotypic level is poorly understood.By comparing organ transcriptomes from vertebrate species spanning~350million years of evolution,we observed significant differences in alternative splicing complexity between vertebrate lineages,with the highest complexity in primates.Within6million years,the splicing profiles of physiologically equivalent organs diverged such that they are more strongly related to the identity of a species than they are to organ type.Most vertebrate species-specific splicing patterns are cis-directed. However,a subset of pronounced splicing changes are predicted to remodel protein interactions involving trans-acting regulators.These events likely further contributed to the diversification of splicing and other transcriptomic changes that underlie phenotypic differences among vertebrate species.V ertebrate species possess diverse phe-notypic characteristics,yet they sharesimilar repertoires of coding genes(1).Evolutionary changes in transcriptomes under-lie structural and regulatory differences asso-ciated with species-specific characteristics.Forexample,species-dependent mRNA and non-coding RNA(ncRNA)expression patterns havebeen linked to mutational changes in cis-andtrans-acting regulatory factors,as well as to phe-notypic differences(2–5).However,becauseorgan-dependent mRNA expression levels with-in individual species have been largely con-served during vertebrate evolution(6,7),it seemsunlikely that changes in gene expression(GE)1Banting and Best Department of Medical Research,DonnellyCentre,University of Toronto,Toronto,Ontario M5S3E1,Cana-da.2Instituto de Medicina Molecular,Faculdade de Medicina,Universidade de Lisboa,1649-028Lisboa,Portugal.3Departmentof Electrical and Computer Engineering,University of Toronto,Toronto,Ontario M5S3G4,Canada.4Department of Molec-ular Genetics,University of Toronto,Toronto,Ontario M5S1A8,Canada.5University of Cambridge,CRUK-Cambridge Institute,Robinson Way,Cambridge CB20RE,UK.6Department of Com-puter Science,University of Toronto,Toronto,Ontario M5S2E4,Canada.7Hospital for Sick Children,Toronto,OntarioM5G1X8,Canada.8Wellcome Trust Sanger Institute,GenomeCampus,Hinxton,Cambridge CB101SA,UK.*These authors contributed equally to this work.†To whom correspondence should be addressed.E-mail:b.blencowe@utoronto.ca SCIENCE VOL33821DECEMBER20121587RESEARCH ARTICLESaccount for the majority of phenotypic diver-sity among vertebrates.Through the variable use of cis-acting RNA elements in exons and flanking introns that are recognized by trans-acting factors,different pairs of splice sites in primary transcripts can be se-lected in a cell type–,condition-,or species-specific manner(8–15).Changes in alternativesplicing(AS)may therefore represent a majorsource of species-specific differences(16–25).Here,we describe a genome-wide investigationof AS differences among physiologically equiv-alent organs from vertebrate species spanning themajor tetrapod lineages.Evolution of alternative splicing complexity.High-throughput RNA sequencing(RNA-Seq)data were collected from whole brain,forebraincortex,cerebellum,heart,skeletal muscle,liver, Fig.1.Profiling of alternative splicing(AS)in vertebrates.(A)Relativeproportions of exons undergoing AS in each sample,as measured by de-tection of middle exon skipping in random exon triplets,where the threeexons are represented by orthologs in the analyzed species(y-axis unitsrelative to the sample with lowest AS frequency).See fig.S1,A and B,for amore detailed version;see table S5for details on samples,including rep-licates,and RNA-Seq data sets.(B)Percentage of common AS events be-tween human and other species.(C)Symmetrical heat map of Spearmancorrelations from PSI profiles.For each sample,PSI values for the1550orthologous exons in the11analyzed species were estimated.See fig.S4Afor a more detailed version.(D)Symmetrical heat map of Pearson correla-tions from gene expression(GE)profiles.For each sample,mRNA expres-sion[log cRPKM values(26)]of1809analyzed orthologous genes in the11analyzed species were estimated.Key as in(C).See fig.S4B for a moredetailed version.(E)Heat map of PSI values for41conserved cassette al-ternative exons.Rows,exons;columns,samples.Key as in(C).See fig.S11Bfor a more detailed version.Data are hierarchically clustered(complete meth-od,Euclidean distance)for heat maps in(C)to(E).21DECEMBER2012VOL338SCIENCE 1588RESEARCH ARTICLESkidney,and testis from human,chimpanzee,orang-utan,macaque,mouse,opossum,platypus,chick-en,lizard,and frog (26).For each species,we considered all internal exons as potential cassette AS events and created nonredundant databases of splice junction sequences formed by inclusion or skipping of each exon.RNA-Seq reads were mapped to the junction databases to determine “percent spliced-in ”(PSI)values,and also to rep-resentative transcript sequences from each gene to estimate GE levels,represented as “corrected reads per kilobase transcript model per million mapped reads ”(cRPKM)values (26).Orthology relation-ships between genes and exons were established to enable direct cross-species comparisons.The relative proportions of orthologous exons detected to undergo AS in each sample were de-termined.Equal numbers of reads were randomly sampled from each RNA-Seq data set to control for coverage differences (26).AS detection is ap-proximately twice as frequent in all analyzed pri-mate organs as in the equivalent organs from mouse and other species (Fig.1A and fig.S1).Moreover,there is an overall decline in AS fre-quency as the evolutionary distance from primates increases.These differences are significant (P <10−10,Mann-Whitney U tests),are robust to dif-ferent methods of AS frequency detection,and are independent of the variability in AS detection rates between individuals within the same spe-cies (Fig.1A and fig.S1).Genes with the highest AS complexity in human are significantly en-riched in cytoskeleton-associated functions (P <0.03)(table S1),which suggests that AS-directed diversification of the cytoskeleton may have been a driving force in the evolution of increased cel-lular complexity in vertebrate species.Rapid evolution of organ-specific alternative splicing.We next compared AS profiles across organs and species.Approximately half of al-ternatively spliced exons among species sepa-rated by ~6million years of evolution are different(Fig.1B and figs.S2A and S3A).When clus-tering organ AS profiles on the basis of how overall PSI values correlate in pairwise compar-isons,the samples segregate by individual spe-cies (Fig.1C and fig.S4A).This is in contrast to clustering samples on the basis of how their overall GE levels correlate,where the samples segregate according to tissue type (Fig.1D and fig.S4B)(6,7).Principal components analysis confirms that species type and tissue type are the primary sources of variability underlying the overall AS and GE patterns,respectively (figs.S5and S6).The species-dependent clustering of AS profiles is also observed when analyzing sub-sets of alternative exons associated with a wide range of splice site strengths,exon length,increased magnitudes of PSI change between tissues,increased read coverage,and also when using indepen-dently validated (16)PSI differences (figs.S7to S10).These results indicate that overall organ-specific AS patterns have evolved at a much more rapid rate than organ-specific GE patterns.However,when restricting the clustering anal-ysis to all (n =41)orthologous exons that are alternatively spliced in four species (human,mouse,chicken,and frog)representing the main tetrapod lineages,the samples segregate by tis-sue type,with similar results obtained with the larger data set of tissues and species (Fig.1E and fig.S11,A to H).The 41exons,on average,display a wider range of inclusion levels across the samples,indicating that they have a higher degree of regulatory potential (fig.S11I).Con-sistent with this observation,they are also asso-ciated with elevated exonic and flanking intronic sequence conservation,implying that they are under increased selection pressure to maintain binding sites for regulatory trans-acting factors (26).Therefore,although overall AS patterns of multiple organs distinguish vertebrate species,a small subset of exons that undergo AS in multi-ple species spanning ~350million years of evo-lution display conserved patterns of regulation that reflect organ type.We next investigated the relative rates at which AS and GE have evolved.From pairwise comparisons of PSI values in homologous tissues,we observe an overall increase of PSI diver-gence from human with evolutionary time (Fig.2A).In contrast to results from analyzing GE di-vergence (Fig.2,C and D)(6,7),AS levels in testis have not diverged more rapidly than in other tissues (Fig.2B),and AS events detected in neural tissues display the slowest rate of divergence (P <10−6,Mann-Whitney U tests).A significantly higher proportion (27%more on average)of neural AS events are conserved between vertebrate species than are AS events specific to other organs (P <0.002,Mann-Whitney U test;fig.S2B).These AS events are enriched in genes associated with synaptic transmission,axon guidance,neural de-velopment,and actin cytoskeleton reorganization (table S2),indicating that AS regulation of these processes is a highly conserved feature of ver-tebrate nervous system development.ABCD01002003004000.60.70.80.9Divergence from Human (Ma)P e a r s o n c o r r e l a t i o n o f G E w / H u m anC h i m p O r a n g u t a n M a c a q u eM o u s eO p o s s u m P l a t y p u sF r o gC h i c k e n L i z a r dcortex/brain cerebellum liver kidney heart muscle testisP u f f e r f i s hT r e e l e n g t hbrain01002003004000.00.20.40.6Divergence from Human (Ma)P e a r s o n c o r r e l a t i o n o f A S w / H u m ancortex/brain cerebellum liver kidney heart muscle testisC h i m p O r a n g u t a n M a c a q u eM o u s eO p o s s u m P l a t y p u sF r o gC h i c k e n L i z a r dP u f f e r f i s hbrainT r e e l e n g t hFig.2.Different rates of AS and GE divergence.(A )Pearson correlations between human and other species when comparing PSI values pairwise for conserved tissue-specific alternative exons in each tissue.For each pair of samples,correlation is analyzed for PSI values for all exons undergoing AS in both samples.(B )Comparisons of total tree lengths (bootstrapping,100replicates)of PSI trees for con-served tissue-specific alternative exons from six tissues in seven species (human,chimp,macaque,mouse,opossum,platypus,chicken).Statistically significant differences between the neural and each of the other tissues are indicated (Mann-Whitney U tests).Full PSI trees for each tissue are shown in fig.S3B.(C )Pearson correlations between human and other species when comparing GE pairwise (cRPKM,log scale;1809orthologous genes in the 11analyzed species)in each organ.(D )Comparisons of total tree lengths (bootstrapping,100replicates)of expression trees from analyzing six organs from seven species as in (B).Statistically significant differences between testis and each of the other tissues are indicated (Mann-Whitney U tests).Full expression trees for each tissue are shown in fig.S3C.SCIENCEVOL 33821DECEMBER 20121589RESEARCH ARTICLESEvolution of vertebrate splicing codes.To investigate mechanisms underlying the diver-gence in organ AS profiles,we used a splicing code derived from mouse data (27,28)to com-pare cis-regulatory elements that are predictive of tissue-dependent splicing patterns of five or-gans (brain,heart,skeletal muscle,liver,and kid-ney)from the four representative species analyzed above.The splicing code achieved high classi-fication rates when predicting organ-specific AS patterns from sequence alone.The average true positive rate [AUC,area under the receiver op-erating characteristic (ROC)curve]ranges from 68to 70%for heart exon skipping to 80to 88%for brain exon inclusion (Fig.3,A and B,and fig.S12).An exception was a subset of approximate-ly 200exon-skipping AS events in human brain,which were predicted less well (AUC =62%)(fig.S12)(26).A comparison of the most strongly predictive cis-elements accounting for each species ’organ-dependent splicing patterns revealed that these significantly overlap in most tissues (Fig.3C and fig.S12).Such cis-elements may represent features comprising an ancestral vertebrate splic-ing code (Fig.3D).However,the overlap between sets of splicing code features used in a given pair of species decreases with increased evolutionary distance (Fig.3C and fig.S12;see also below).Thus,organ-dependent AS patterns appear to be generally controlled by significantly overlapping cis-regulatory codes,although progressive diver-gence in these codes likely also contributes to AS differences.Species-specific alternative splicing is primar-ily cis-directed.The extent to which evolutionary change in cis-regulatory codes (versus trans-acting factors)accounts for species-dependent AS differences is not known.To address this,we used a mouse strain,Tc1,carrying the ma-jority of human chromosome 21(HsChr21)(29).We compared PSI values of exons from HsChr21transcripts expressed in multiple organs (brain,liver,heart,testis)from the Tc1strain,with PSI values of the identical exons in the correspond-ing human organs.We also compared PSI val-ues for the orthologous mouse exons between wild-type and Tc1mouse strains.For all com-parisons,we analyzed a comprehensive set of 13HsChr21and orthologous mouse exons that were detected,using RNA-Seq data,toFig.3.Inference and comparative analysis of vertebrate splicing codes.(A )ROC curves of splicing code predictions for brain-dependent exon inclusion in human,mouse,chicken,and frog.ROC curves for other tissues are shown in fig.S12.(B )AUC in percent for each of the ROC curves in (A).(C )Left:Heat map of splicing code features with significant prediction scores associated with brain-specific exon inclusion in each species (red for P <0.05,Mann-Whitney U test);statistically significant features in common with all significant mouse features associated with brain-specific exon inclusion are shown.Right:Pro-portions of features significantly associated with mouse brain-specific exon inclusion also significant for brain-specific exon inclusion in other species.Error bars:95%confidence intervals,Pearson ’s c 2proportion tests.Analyses of predictive features for other tissues are shown in fig.S12.(D )Region-specific distribution of code features significantly associated with tissue-specific exon inclusion or exclusion in all four species,as determined by their region-specific enrichment or by their predictive power as inferred by the splicing code.Splicing factors associated with code features are in square brackets.Significantly enriched features are indicated by hollow arrows;features both significantly enriched and predictive are indicated by bold arrows.Arrows are colored according to the organ with which the features are associated (refer to key).21DECEMBER 2012VOL 338SCIENCE1590RESEARCH ARTICLEShave undergone AS in at least one of the two species.All analyzed HsChr21exons that are alterna-tively spliced in human for which the orthologous exons in mouse are constitutively spliced are also alternatively spliced in the Tc1mouse;likewise,all HsChr21constitutively spliced exons for which the orthologous exons in mouse are alternatively spliced are also constitutively spliced in the Tc1mouse (P <0.02,both comparisons;one-sided Fisher ’s exact tests;Fig.4,A and B,and fig.S13A).For the orthologous exons that are alternatively spliced in human and mouse,we observe a sig-nificantly higher correlation between their inclu-sion levels in Tc1mouse and normal human organs relative to the correlation observed when comparing inclusion levels of all orthologous hu-man and mouse exons (r =0.89versus r =0.52,P <0.0008,one-sided Z-test;fig.S13B)(26).Collectively,the results indicate that changes among predominantly conserved cis-regulatory elements are sufficient to direct the majority of the species-specific AS patterns,at least in hu-man and mouse.However,because our results also indicate that vertebrate splicing codes di-verged with increasing evolutionary distance,and because specific subsets of AS events could not be reliably predicted using the splicing code,changes in trans-acting factors likely also con-tributed to evolutionary differences in AS.Species-classifying alternative splicing events in trans-acting regulatory factors.To investigate which splicing changes during evolution likely had the greatest functional impact,we identified AS events that best discriminate or “classify ”spe-cies (26).These AS events have relatively large and widely expressed PSI differences between species or lineages,and were validated at a high rate by reverse transcription polymerase chain reaction (RT-PCR)assays (r =0.90,n =180;fig.S14).Gene Ontology enrichment analysis re-veals that the corresponding genes are function-ally diverse,with “nucleic acid binding ”among the most frequently represented categories (Fig.5A,fig.S14,and tables S3and S4).Consistent with a major role for conserved cis-regulatory elements governing species-dependent AS pro-files (Figs.3and 4),the species-classifying AS events are significantly underrepresented in exons that overlap nucleic acid binding domains,rela-tive to other classes of alternative exons in the same genes (P <0.04,Pearson ’s c 2proportion test;Fig.5C).An interesting example of a species-classifying AS event is the activity-modulating exon 9of the splicing regulator PTBP1,located between RNA recognition motifs 2and 3in this protein (30,31).This exon is skipped in mammalian organs but is fully included in chicken and frog organs (Fig.5A).Consistent with the possibility of a morevariable and extensive regulatory role for PTBP1in mammalian-specific AS,we observe signifi-cant enrichment of putative PTBP1binding sites in sequences surrounding mammalian-specific AS events relative to sequences surrounding chicken-and frog-specific AS events (P <0.002,one-sided Fisher ’s exact test;Fig.5B).The species-classifying AS events in genes as-sociated with other functions are also significantly underrepresented in exons that overlap folded protein domains (P <0.0002,Pearson ’s c 2pro-portion test;fig.S15A).However,the species-classifying AS events are significantly enriched in frame-preserving exons relative to nonclassify-ing species-specific AS events (P ≤0.05,Pearson ’s c 2proportion test;Fig.5D and fig.S15B),and they are also enriched in protein regions pre-dicted to be disordered.Disordered regions gen-erally reside on protein surfaces and are known to play critical roles in ligand interactions and cell signaling (32,33),and recent work has shown that tissue-regulated exons enriched in predicted disordered sequences often function in remodel-ing protein-protein interactions (PPIs)(34,35).The species-classifying AS events thus possess multiple features of functionally important exons.Discussion.Our results show that organs of primate species have significantly higher cas-sette exon AS frequencies than do organs of other vertebrate species.Moreover,overall organ ASPSI Human MouseP S I T c1ABFig.4.Human-specific AS is preserved in a mouse trans-acting environment.(A )Scatterplot comparing RT-PCR –estimated PSI values for HsChr21exons in human tissues (squares)or for the orthologous exons in the corresponding wild-type mouse tissues (triangles)(xaxis),and the same HsChr21exons in Tc1mouse tissues (y axis)[13different pairs of orthologous exons,31total pairs of orthologous AS events (26)].Data points are colored according to whether the represented splicing events are alternative in human and constitutive in mouse (red),constitutive in human and alternative in mouse (blue),or alternative in both species (black)(26).Dark blue:exons with PSI >95%and <100%in human and PSI <50%in mouse.Identity line is in dashed gray.P values for one-sided Fisher ’s exact tests are indicated.(B )RT-PCR experiments measuring PSI levels for pairs of orthologous human and mouse exons using species-specific primer pairs (26),for exonsalternative in one species and constitutive or near-constitutive (PSI >95%)in the other.Human Chr21exons were analyzed in Tc1mouse tissues and normal human tissues;the orthologous mouse exons were analyzed in corresponding tissues from both the Tc1and wild-type mouse strains.Quantification of PSI levels,human gene names (followed by the exon number,when more than one exon for the same gene was studied),and tissues are indicated.Red and yellow dots indicate exon-included and exon-skipped isoforms,respectively.Note that each set of species-specific primers amplifying the orthologous splice isoforms generates size-distinct RT-PCR SCIENCEVOL 33821DECEMBER 20121591RESEARCH ARTICLES。