Spontaneous emergence of spatial patterns ina a predator-prey model
- 格式:pdf
- 大小:1.16 MB
- 文档页数:16
Section 31.To criticize a disaster film for being ________ is a bit silly, since people do not go to disaster movies to see an honest portrayed of reality.A.expensiveB.harrowingC.derivativeD.convolutedE.implausible2.Though many avant-garde writers ________ traditional distinctions among literary categories, combining elements of biography and fiction, prose and poetry, this fusion of forms has been slow to catch on with publishers.A.floutB.presupposeC.exploitD.imitateE.illuminate3.Despite the abundance and importance of maize, its biological origin has been a long-running mystery. The bright yellow, mouth-watering treat does not grow in the wild4.If newspaper consumers are concerned about more than (i)________ and prefer to read news that is consistent with their beliefs, then (ii)________ is not a journalistic flaw, but, rather, a cultivated feature. In a competitive news market, producers can use slant to5.China’s rapidly growing population is the main threat facing large carnivores in the People’s Republic. Increasingly, policies aimed at limiting population growth have been (i)________: nevertheless, the country’s vast size and the isolation of many its re gions mean that human populations in areas where large carnivores still occur(ii)________. This6.The slow pace of job creation was without precedent for the period of recovery froma recession, but the conditions that conspired to cause the recession were also (i)________. The stock market declined sharply, and rampant business investment slumped. Then an ensuing spate of scandals (ii)________ public trust in the way companies were run. AndIn 1755 British writer Samuel Johnson published an acerbic letter to Lord Chesterfield rebuffing his patron for neglecting and declining support. Johnson’s rejection of his patron’s belated assistance has often been identified as a key moment in the history of publishing, marking the end of the culture of patronage. However, patronage had been in decline for 50 years, yet would survive, in attenuated form, for another 50. Indeed, Johnson was in 1762 awarded a pension by the Crown—a subtle form of sponsorshi p, tantamount to state patronage. The importance of Johnson’s letter is not so much historical as emotional; it would become a touchstone for all who repudiated patrons and for all who embraced the laws of the marketplace.7.The author of the passage mentio ns Johnson’s 1762 pension award in order toA.reveal that Johnson remained consistent in his rebuke of Lord Chesterfield well after 1755B.provide evidence for a general trend in the later half of the eighteenth century of private patronage’s being replaced by state sponsorship.C.situated the debate over the end of patronage within the wider realm of eighteenth-centuryD.suggest that Johnson’s letter to Chesterfield was noticed by the crown only years afterE.emphasize that patronage still helped support Johnson’s writing after his letter to Lord Chesterfield8.Which of the following best describes the function of highlighted sentence in the context of the passage as a whole?A.It points out the most obvious implications of Johnson’s letter to his patronB.It suggests a motivation for Johnson’s rejection of Chesterfield’s patronageC.It provides information that qualifies the assertion that Johnson’s letter sharply defined the end of a publishing eraD.It provides a possible defense for Chesterfield’s alleged neglect of Johns onE.It refuses the notion that patrons are found primarily among the nobilityMassive projectiles striking much larger bodies create various kinds of craters, including multi-ring basins–the largest geologic features observed on planets and moons. In such collisions, the impactor is completely destroyed and its material is incorporated into the larger body. Collisons between bodies of comparable size, on the other hand, have very different consequences: one or both bodies might be entirely smashed, with mass from one or both the bodies redistributed among new objects formed from the fragments. Such a titanic collision between Earth and a Mars-size impactor may have given rise to Earth’s Moon.The Earth-Moon system has always been perplexing. Earth is the only one of the inner planets with a large satellite, the orbit of which is neither in the equatorial plane of Earth nor in the plane in which the other planets lie. The Moons mean density is much lower than that of Earth but is about the same as that of Earths mantle. This similarity in density has long prompted speculation that the Moon split away from a rapidly rotating Earth, but this idea founders on two observations. In order to spin off the Moon, Earth would have had to rotate so fast that a day would have lasted less than three hours. Science offers no plausible explanation of how it could have slowed to its current rotational rate from that speed. Moreover, the Moons composition, though similar to that of Earths mantle, is not a precise match. Theorizing a titanic collision eliminates postulating a too-rapidly spinning Earth and accounts for the Moons peculiar composition. In a titanic collision model, the bulk of the Moon would have formed from a combination of material from the impactor and Earths mantle. Most of the earthly component would have been in the form of melted or vaporized matter. The difficulty in recondensing this vapor in Earths orbit, and its subsequent loss to the vacuum of outer space, might account for the observed absence in lunar rocks of certain readily vaporized compounds and elements.Unusual features of some other planets might also be explained by such impacts. Mercury is known to have a high density in comparison with other rocky planets. A titanic impact could have stripped away a portion of its rocky mantle, leaving behind a metallic core whose density is out of proportion with the original ratio of rock to metal.A massive, glancing blow to Venus might have given it its anomalously slow spin and reversed direction of rotation. Such conjectures are tempting, but, since no early planet was immune to titanic impacts, they could be used indiscriminately to explain away in a cavalier fashion every unusual planetary characteristic; still, we may now be beginning to discern the true role of titanic impacts in planetary history.9. According to the passage, which of the following is true of the collisions mentioned in the highlighted sentence?A. They occur less frequently than do titanic collisions.B. They occur between bodies of comparable size.C. They occur primarily between planet-sized bodies.D. They result in the complete destruction of the impacting body.E. They result in mass being redistributed among newly formed objects.10. The author of the passage asserts which of the following about titanic collision models?A. Such models are conclusive with respect to certain anomalies within the solar system, but leave numerous other anomalies unexplained.B. Such models are more likely than are earlier models to account for the formation of multi-ring basins.C. Such models may be particularly useful in explaining what happens when the impacting bodies involved are of highly dissimilar mean densities.D. Such models have been tested to such a degree that they are quickly reaching the point where they can be considered definitive.E. Such models are so tempting that they run the risk of being used indiscriminately to explain unusual planetary features.11. The passage suggests that which of the following is true of the cited compounds and elements?A. They were created by reactions that took place during a titanic collision.B. They were supplied by an impactor that collided with Earth.C. They were once present on the Moon but were subsequently vaporized.D. They are rarely found on planet-size bodies in our solar system.E. They are present on Earth but not on the Moon.12. In the second paragraph, the author is primarily concerned withA. Arguing in favor of a particular theory about the formation of the EarthMoon system.B. Summarizing conventional theories about the formation of the earth-Moon system.C. Anticipating and responding to criticisms of a particular theory about the formation of the Earth-Moon system.D. Explaining why the Earth-Moon system is considered scientifically perplexing.E. Questioning an assumption underlying one theory about the formation of the Earth-Moon system.13. Although legislators on both sides of the issues have repeatedly________ a desire to find a middle ground, until now no acceptable compromise has been achieved.A.discussedB.proclaimedC.professedD.rejectedE.disownedF.betrayed14. Even before she went to art school, Veronica found the standard design categories________: she didn’t understand why designing buildings and designing tables should require different sensibilities.A.provocativeB.limitingC.stimulatingD.confusingE.confiningF.exhilarating15. The author engages this issue from diverse perspectives, supports his arguments with many examples, and manages to avoid antagonizing others in dealing with a very _____ subject.A.contentiousB.pedestrianC.controversialD.perplexingE.mundaneF.intriguing16. To call Kermode the finest English critic of his generation be a_________ compliment, since not many of its population are professionally engaged in literary criticism.A.sincereB.backhandedC.paltryD.heartfeltE.meagerF.plausibleAlthough several ancient cultures practiced mummification, mummies from ancient Egypt are generally more well preserved than mummies of similar antiquity from other cultures. One possible explanation for this difference is that the mummification techniques or materials used by ancient Egyptians were better than those of other cultures. A second, more likely, explanation is that the extremely dry climate of ancient Egypt was largely responsible, given that dryness promotes the preservation of organic remains generally.17. Which of the following provide the most support for the argument?A. The materials used by ancient Egyptians for mummification were not used by any other ancient culture that practiced mummification.B. Some ancient Egyptian mummies are better preserved than other ancient Egyptian mummies from around the same time.C. No ancient people living in very damp areas practiced mummification.E. Bodies from ancient Egyptian tombs dating from before the practice of mummification began are almost as well preserved as ancient Egyptian mummies.F. Ancient mummies discovered in places other than Egypt have typically not been as well protected from the elements as ancient Egyptian mummies were.Attempts to identify New Guinean’s hunter-gatherers face the well-known difficulty of defining what constitutes a hunter-gather group. According to the common definition, hunter-gathers are those who subsist by hunting wild animals and gathering wild plants. Yet those criteria beg numerous questions, including the issue of what constitutes “wild”. The very presence on a landscape of humans who are consumers affects food resources, blurring the lines between wild and domesticated and, hence between hunting and pastoralism, and between gathering and cultivation. Moreover, it is unclear how groups should be classified that are hunter-gatherers in their procurement strategies but that make use of pastoralism and cultivation in their consumption patterns––subsisting, for example, by trading wild foods to neighbors in return for domesticated crops.18.The primary purpose of the passage is toA.suggest that there are not as many hunter-gathers in New Guinea as is commonly thoughtB.explain why identifying N ew Guinean’s hunter-gathers is not a straightforward processC.point to certain difficulties in establishing what constitute a wild plant and a wild animalD.establish new, more relevant criteria for what constitutes a hunter-gather groupE.discuss the implication of an inappropriate definition of pastoralism19.Replacement of the word “common” with which of the following results in the LEAST change in meaning to the passage?A.triteB.mutualC.unexceptionalD.collectiveE.conventionalColumnist: Until very recently, Presorbin and Veltrex, two medications used to block excess stomach acid, were both available only with a prescription written by a doctor. In an advertisement for Presorbin, its makers argue that Presorbin is superior on the grounds that doctors have written 200 million prescriptions for Presorbin, as compared to 100 million for Veltrex. It can be argued that the number of prescriptions written is never a worthwhile criterion for comparing the merits of medicines, but that the advertisement’s argument is a bsurd is quite adequately revealed by observing that Presorbin was available as a prescription medicine years before Veltrex was.20. In the columnist’s argument, the two highlighted portions play which of the following roles?A. The first is a claim that the columnist’s argument seeks to clarify; the second states a conclusion drawn about one possible interpretation of that claim.B. The first identifies the conclusion of an argument that the columnist’s argument is directed against; the second states the main conclusion of the columnist’s argument.C. The first states the main conclusion of the columnist’s argument; the second states a conclusion that the columnist draws in defending that conclusion against an objection.D. The first identifies an assumption made in an argument that the columnist's argument is directed against; the second states the main conclusion of the columnist’s argument.E. The first is a claim that has been offered as evidence to support a position that the columnist opposes; the se cond states the main conclusion of the columnist’s argumentSection 4 1. The idea of a “language instinct” may seem________ to those who think of language as the zenith of the human intellect and of instincts as brute impulse. A. jarring B. plausible C. gratifying D. inevitable E. conciliatory 2. The maps in this volume are meant not as guides but as________ they are designed to make the reader think anew about the city. A. adornments B. referencesC. truismsD. provocationsE. valedictions 3. Proponents of international regulation of environmental issues have always struggled against scientific uncertainty and economic hostility, two obstacles which, form a political standpoint, often have been closely related, as economic hostile toward environmental regulation for economic reasons have (i)________the considerable uncertainly underlying most environmental challenges to (ii)________ of environmental regulation.4. It would be imprecise to characterize her scholarship as (i)________: though her etymological discussion is necessarily esoteric, there is nothing (ii)________about the conclusions she derives from it.5. The book is not comprehensive but is, instead, (i)________ in the most positive sense: (ii)_______ rather than settles.6.With the emergence of scientific history-writing in the late nineteenth century, several authors sought to ignore the glowing myths surrounding George Washington and uncover the human being within, but their biographies were still (i)________ enough that Washington remained a marbled and remote figure. Indeed, by the 1920s Washington had become such (ii)________ personage that inevitably someone had to go to the otherEarly life insurers in the United States found themselves facing the problem of obtaining reliable information, as they needed to rely on applicants themselves to provide truthful, complete answers to a standard set of questions. In an attempt to personalize the relationship between insurers and their individual applicants, firms selected highly respecte d local citizens to act as their agents. These agents were expected to evaluate the appearance of candidates, unearth evidence of unhealthy family histories or questionable habits, and attest to the respectability of the people writing testimonial letters on an applicant's behalf. In short, the initial purpose of the agency system was not to actively solicit customers, but, rather, to recreate the glass-bowl mentality associated with small towns or city neighborhoods.7. The primary purpose of the passage is toA. explain the original function of life insurance agentsB. evaluate the effectiveness of early life insurance agentsC. describe how life insurance was first introducedD. illustrate how the life insurance agency system changed over timeE. compare the strategies used by life insurance in cities and in small towns8 . The author suggests which of the following about “city neighborhoods”?A. They were places where family histories where difficult to establishB. They were places where unhealthy behaviors had been successfully addressedC. They were locations that were well suited for recruiting insurance agentsD. They offered a high degree of transparency about a resident's personal history and characterE. They offered potentially fruitful markets for the life insurance industryThroughout much of the Tertiary period (most of the past 65million years), the Arctic supported continuous forests. Only toward the end of that period does the fossil evidence show that certain present-day Arctic plants were established and widely distributed throughout the Arctic. Many Arctic plants are thought to have originated in the high mountain ranges of central Asia and North America, to have spread northward to the Arctic as global temperatures fell in the late Tertiary, and to have achieved a circumpolar distribution by the end of the Tertiary (about 2 million years ago). However, fossil evidence to support these proposals is either lacking or fragmentary. Consequently, the routes by which these plants expanded their ranges during their colonization of the Arctic remain unknown.9. Which of the following statements about Arctic plants is supported by the passage?A. The decline in global temperatures in the late Tertiary prevented many high-mountain plants from becoming established in the Arctic.B. There is not enough evidence to firmly establish the historical migration routes of present-day Arctic plants.C. Present-day Arctic plants are less likely to leave fossil remains than are plants outside the Arctic.10. The context in which it appears, "distributed" most nearly meansA. developedB. isolatedC. dispersedD. dividedE. disconnected9.Even though the original settlement may not hold up, it at least proves that thedeadlock can be broken and that a hitherto________ party is ready to bargain.A.implacableB.unyieldingC.impeccableD.flawlessE.unqualifiedF.capricious10.The company is so old-fashioned and opposed to innovation that it can seem downright________.A.antediluvianB.flightyC.archaicD.chauvinisticE.capriciousF.patronizing11.Space is often referred to as the final frontier, as the only realm of which humankind has still to gain substantial understanding, yet the ocean is also another vast area about which our knowledge is ________.A.erroneousB.confusingC.frustratingD.rudimentaryE.delusiveF.sketchy12.In sharp contrast to the novel’s scenic realism and precise characterized figure is its persistent philosophical ________.A.naturalismB.abstractionC.generalityD.impartialityE.sincerityF.objectivityA mouse’s immune system generally rejects proteins different from those produced by that mouse. The immune system of a pregnant mouse does not, however, reject the mouse’s fetuses, alt hough the fetal tissue a fetus produces as it develops typically contains many such proteins. Some scientists hypothesize that the placenta surrounding the fetus physically blocks the mother’s immune system. But others, noting that the placenta produces IDO, an enzyme that suppresses the immune system, hypothesize that IDO plays a crucial role in protecting the fetus.15. In order to choose between the two hypotheses, it would be most useful to determine which of the following?A.Whether mice sometimes produce IDO when they are not pregnantB.Whether the immune systems of fetal mice are capable of attacking the tissue of the motherC.Whether there are cases in which the immune system of a pregnant mouse rejects some fetuses but not othersD.Whether IDO is the only substance capable of suppressing the immune system produced by miceE.Whether the immune systems of pregnant mice that are given a drug that inhibits IDO production subsequently reject the fetus.Biologists studying wild monkeys sometimes need the genetic material DNA from a particular monkey to determine the animal's parentage. Until recently, DNA could be extracted only from blood. Collecting a blood sample required tranquilizing the donor animal. Now DNA can be extracted from hair. Monkeys shed large quantities of hair in places where they sleep. Therefore, researchers will now be able to determine the parentage of individual monkeys from DNA without tranquilizing the monkeys.16. Which of the following is an assumption on which the argument depends?A. The places in which monkeys sleep are easily accessible to researchersB. Information about a particular monkey’s parentage is the only kind of information that can be determined from DNA that has been extracted from that monkey’s hair.C. For at least some samples of hair collected from monkey habitat it will be possible to associate hairs with the individual monkeys from which they cameD. Examining DNA is the only way to determine the parentage of wild monkeysE. It will be necessary to obtain any hair samples used in determining a monkey’s parentage from a place where the monkey has sleptDuring the 1920s, most advocates of scientific management, Frederick Taylor’s method for maximizing workers’ productivity by rigorously routinizing their jobs, opposed the five-day workweek. Although scientific managers conceded that reducing hours might provide an incentive to workers, in practice they more often used pay differentials to encourage higher productivity. Those reformers who wished to embrace both scientific management and reduced hours had to make a largely negative case, portraying the latter as an antidote to the rigors of the former.In contrast to the scientific managers, Henry Ford claimed that shorter hours led to greater productivity and pro fits. However, few employers matched either Ford’s vision or his specific interest in mass marketing a product—automobiles—that required leisure for its use, and few unions succeeded in securing shorter hours through bargaining. At its 1928 convention, the American Federation of Labor (AFL) boasted of approximately 165,000 members working five-day, 40-hour weeks. But although this represented an increase of about 75,000 since 1926, about 70 percent of the total came from five extremely well-organized building trades’ unions.17. It can be inferred that the author of the passage would probably agree withwhich of the following claims about the boast referred to in highlighted sentence?A.It is based on a mistaken estimation of the number of AFL workers who were allowed to work a five-day, 40-hour week in 1928.B.It could create a mistaken impression regarding the number of unions obtaining a five-day, 40-hour week during the 1920s.C.It exaggerates the extent of the increase between 1926 and 1928 in AFL members working a five-day, 40-hour week.D.It overestimates the bargaining prowess of the AFL building trades’ unions during the 1920s.E.It is based on an overestimation of the number of union members in the AFL in 1928.18. According to t he passage, the “reformers” (line 5) claimed thatA.neither scientific management nor reduced hours would result in an improvement in the working conditions of most workersB.the impact that the routinization of work had on workers could be mitigated by a reduction in the length of their workweekC.there was an inherent tension between the principles of scientific management and a commitment to reduced workweeksD.scientific managers were more likely than other managers to use pay differentials to encourage higher productivityE.reducing the length of the workweek would increase productivity more effectively than would increases in payUnlike herbivores and omnivores, predators have traditionally been thought not to balance nutrient intake because of the assumption that animal tissue as a food source varies little and is nutritionally balanced. But chemical analysis of invertebrate prey reveals remarkable variation in nutrient composition among species; even within species, nutrient composition may vary considerably. Greenstone suggested that predators may select food items according to their nutrient contents. Jensen et al (2011) have shown experimentally that even sit-and-wait invertebrate predators with limited mobility can work to address nutrient deficiencies. The wolf spider, for instance, has been shown to regulate nutrient intake by extracting more dry mass from a prey item if it contains a higher proportion of a nutrient that was deficient in the previous prey.19.The passage supplies information for answering which of the followingquestions?A.Do invertebrate predators with full mobility address nutrient needs in the same fashion as sit-and-wait invertebrate predators with limited mobility?B.Why would there be a considerable variation in nutrient composition within prey of a given species?C.Is all of the nutrient content of invertebrate prey contained in the dry mass?D.What would a wolf spider do if a fly it was eating contained a higher proportion of a certain nutrient than was present in the spider’s recent prey?E.How is a wolf spider able to determine that some prey it is eating contains a higher proportion of a nutrient that was deficient in the previous prey?20.Which of the following best describes the organization of the passage as a whole?A. A phenomenon is described, and an interpretation is offered.B. A claim is made, and the corroborating evidence is evaluated.C. A hypothesis is presented and undermined by recent findings.D. A contrast is noted and shown to be specious based on recent findings.E. A series of assumptions is presented and shown to be based on sound reasoning.。
1.architect n. 建筑师→architecture n.建筑学;建筑术;建筑风格;建筑式样2.superb adj.极好的,出色的→superbly ad v.庄重地;华美地;极好地3.front n.前面;正面;前线adj.前面的,前部的;正面的→frontier n.知识/物理学等的前沿frontier n.(知识/物理学等的)前沿,尖端;国界,边界;边远地区①a remote frontier settlement边远地区②the frontier between Austria and Hungary边界③advance the frontiers of science前沿/领域Words And Phrases知识要点1take for granted 认为……理所当然(教材P50)In fact,we are so used to them that we may even take them for granted without realising how much inspiration they have given us.事实上,我们已经习惯了它们,甚至可能认为它们是理所当然的,没有意识到它们给了我们多少灵感。
[例1]He just takes everything his mother does for him for granted.他只是认为他妈妈为他做的一切都是理所当然的。
[例2]We shouldn't take anything for granted.我们不要认为什么都是理所当然的。
[造句]你不应该认为父母的爱理所当然。
You shouldn't take your parents' love for granted.[知识拓展]take it for granted that...想当然地认为……granting that...=granted that... 假定……,即使……①They now have their own opinions; you can't take it for granted that they'lllisten to you.②Granted/Granting(grant)that this is true,what conclusion can you reach?③She often told me not to take things for granted(grant).知识要点2superb adj.极好的,出色的(教材P51)Harare's Eastgate Centre is a superb example of biomimicry.哈拉雷的东门中心是仿生学极好的典范。
Modeling the Spatial Dynamics of Regional Land Use:The CLUE-S ModelPETER H.VERBURG*Department of Environmental Sciences Wageningen UniversityP.O.Box376700AA Wageningen,The NetherlandsandFaculty of Geographical SciencesUtrecht UniversityP.O.Box801153508TC Utrecht,The NetherlandsWELMOED SOEPBOERA.VELDKAMPDepartment of Environmental Sciences Wageningen UniversityP.O.Box376700AA Wageningen,The NetherlandsRAMIL LIMPIADAVICTORIA ESPALDONSchool of Environmental Science and Management University of the Philippines Los Ban˜osCollege,Laguna4031,Philippines SHARIFAH S.A.MASTURADepartment of GeographyUniversiti Kebangsaan Malaysia43600BangiSelangor,MalaysiaABSTRACT/Land-use change models are important tools for integrated environmental management.Through scenario analysis they can help to identify near-future critical locations in the face of environmental change.A dynamic,spatially ex-plicit,land-use change model is presented for the regional scale:CLUE-S.The model is specifically developed for the analysis of land use in small regions(e.g.,a watershed or province)at afine spatial resolution.The model structure is based on systems theory to allow the integrated analysis of land-use change in relation to socio-economic and biophysi-cal driving factors.The model explicitly addresses the hierar-chical organization of land use systems,spatial connectivity between locations and stability.Stability is incorporated by a set of variables that define the relative elasticity of the actual land-use type to conversion.The user can specify these set-tings based on expert knowledge or survey data.Two appli-cations of the model in the Philippines and Malaysia are used to illustrate the functioning of the model and its validation.Land-use change is central to environmental man-agement through its influence on biodiversity,water and radiation budgets,trace gas emissions,carbon cy-cling,and livelihoods(Lambin and others2000a, Turner1994).Land-use planning attempts to influence the land-use change dynamics so that land-use config-urations are achieved that balance environmental and stakeholder needs.Environmental management and land-use planning therefore need information about the dynamics of land use.Models can help to understand these dynamics and project near future land-use trajectories in order to target management decisions(Schoonenboom1995).Environmental management,and land-use planning specifically,take place at different spatial and organisa-tional levels,often corresponding with either eco-re-gional or administrative units,such as the national or provincial level.The information needed and the man-agement decisions made are different for the different levels of analysis.At the national level it is often suffi-cient to identify regions that qualify as“hot-spots”of land-use change,i.e.,areas that are likely to be faced with rapid land use conversions.Once these hot-spots are identified a more detailed land use change analysis is often needed at the regional level.At the regional level,the effects of land-use change on natural resources can be determined by a combina-tion of land use change analysis and specific models to assess the impact on natural resources.Examples of this type of model are water balance models(Schulze 2000),nutrient balance models(Priess and Koning 2001,Smaling and Fresco1993)and erosion/sedimen-tation models(Schoorl and Veldkamp2000).Most of-KEY WORDS:Land-use change;Modeling;Systems approach;Sce-nario analysis;Natural resources management*Author to whom correspondence should be addressed;email:pverburg@gissrv.iend.wau.nlDOI:10.1007/s00267-002-2630-x Environmental Management Vol.30,No.3,pp.391–405©2002Springer-Verlag New York Inc.ten these models need high-resolution data for land use to appropriately simulate the processes involved.Land-Use Change ModelsThe rising awareness of the need for spatially-ex-plicit land-use models within the Land-Use and Land-Cover Change research community(LUCC;Lambin and others2000a,Turner and others1995)has led to the development of a wide range of land-use change models.Whereas most models were originally devel-oped for deforestation(reviews by Kaimowitz and An-gelsen1998,Lambin1997)more recent efforts also address other land use conversions such as urbaniza-tion and agricultural intensification(Brown and others 2000,Engelen and others1995,Hilferink and Rietveld 1999,Lambin and others2000b).Spatially explicit ap-proaches are often based on cellular automata that simulate land use change as a function of land use in the neighborhood and a set of user-specified relations with driving factors(Balzter and others1998,Candau 2000,Engelen and others1995,Wu1998).The speci-fication of the neighborhood functions and transition rules is done either based on the user’s expert knowl-edge,which can be a problematic process due to a lack of quantitative understanding,or on empirical rela-tions between land use and driving factors(e.g.,Pi-janowski and others2000,Pontius and others2000).A probability surface,based on either logistic regression or neural network analysis of historic conversions,is made for future conversions.Projections of change are based on applying a cut-off value to this probability sur-face.Although appropriate for short-term projections,if the trend in land-use change continues,this methodology is incapable of projecting changes when the demands for different land-use types change,leading to a discontinua-tion of the trends.Moreover,these models are usually capable of simulating the conversion of one land-use type only(e.g.deforestation)because they do not address competition between land-use types explicitly.The CLUE Modeling FrameworkThe Conversion of Land Use and its Effects(CLUE) modeling framework(Veldkamp and Fresco1996,Ver-burg and others1999a)was developed to simulate land-use change using empirically quantified relations be-tween land use and its driving factors in combination with dynamic modeling.In contrast to most empirical models,it is possible to simulate multiple land-use types simultaneously through the dynamic simulation of competition between land-use types.This model was developed for the national and con-tinental level,applications are available for Central America(Kok and Winograd2001),Ecuador(de Kon-ing and others1999),China(Verburg and others 2000),and Java,Indonesia(Verburg and others 1999b).For study areas with such a large extent the spatial resolution of analysis was coarse(pixel size vary-ing between7ϫ7and32ϫ32km).This is a conse-quence of the impossibility to acquire data for land use and all driving factors atfiner spatial resolutions.A coarse spatial resolution requires a different data rep-resentation than the common representation for data with afine spatial resolution.Infine resolution grid-based approaches land use is defined by the most dom-inant land-use type within the pixel.However,such a data representation would lead to large biases in the land-use distribution as some class proportions will di-minish and other will increase with scale depending on the spatial and probability distributions of the cover types(Moody and Woodcock1994).In the applications of the CLUE model at the national or continental level we have,therefore,represented land use by designating the relative cover of each land-use type in each pixel, e.g.a pixel can contain30%cultivated land,40%grass-land,and30%forest.This data representation is di-rectly related to the information contained in the cen-sus data that underlie the applications.For each administrative unit,census data denote the number of hectares devoted to different land-use types.When studying areas with a relatively small spatial ex-tent,we often base our land-use data on land-use maps or remote sensing images that denote land-use types respec-tively by homogeneous polygons or classified pixels. When converted to a raster format this results in only one, dominant,land-use type occupying one unit of analysis. The validity of this data representation depends on the patchiness of the landscape and the pixel size chosen. Most sub-national land use studies use this representation of land use with pixel sizes varying between a few meters up to about1ϫ1km.The two different data represen-tations are shown in Figure1.Because of the differences in data representation and other features that are typical for regional appli-cations,the CLUE model can not directly be applied at the regional scale.This paper describes the mod-ified modeling approach for regional applications of the model,now called CLUE-S(the Conversion of Land Use and its Effects at Small regional extent). The next section describes the theories underlying the development of the model after which it is de-scribed how these concepts are incorporated in the simulation model.The functioning of the model is illustrated for two case-studies and is followed by a general discussion.392P.H.Verburg and othersCharacteristics of Land-Use SystemsThis section lists the main concepts and theories that are prevalent for describing the dynamics of land-use change being relevant for the development of land-use change models.Land-use systems are complex and operate at the interface of multiple social and ecological systems.The similarities between land use,social,and ecological systems allow us to use concepts that have proven to be useful for studying and simulating ecological systems in our analysis of land-use change (Loucks 1977,Adger 1999,Holling and Sanderson 1996).Among those con-cepts,connectivity is important.The concept of con-nectivity acknowledges that locations that are at a cer-tain distance are related to each other (Green 1994).Connectivity can be a direct result of biophysical pro-cesses,e.g.,sedimentation in the lowlands is a direct result of erosion in the uplands,but more often it is due to the movement of species or humans through the nd degradation at a certain location will trigger farmers to clear land at a new location.Thus,changes in land use at this new location are related to the land-use conditions in the other location.In other instances more complex relations exist that are rooted in the social and economic organization of the system.The hierarchical structure of social organization causes some lower level processes to be constrained by higher level dynamics,e.g.,the establishments of a new fruit-tree plantation in an area near to the market might in fluence prices in such a way that it is no longer pro fitable for farmers to produce fruits in more distant areas.For studying this situation an-other concept from ecology,hierarchy theory,is use-ful (Allen and Starr 1982,O ’Neill and others 1986).This theory states that higher level processes con-strain lower level processes whereas the higher level processes might emerge from lower level dynamics.This makes the analysis of the land-use system at different levels of analysis necessary.Connectivity implies that we cannot understand land use at a certain location by solely studying the site characteristics of that location.The situation atneigh-Figure 1.Data representation and land-use model used for respectively case-studies with a national/continental extent and local/regional extent.Modeling Regional Land-Use Change393boring or even more distant locations can be as impor-tant as the conditions at the location itself.Land-use and land-cover change are the result of many interacting processes.Each of these processes operates over a range of scales in space and time.These processes are driven by one or more of these variables that influence the actions of the agents of land-use and cover change involved.These variables are often re-ferred to as underlying driving forces which underpin the proximate causes of land-use change,such as wood extraction or agricultural expansion(Geist and Lambin 2001).These driving factors include demographic fac-tors(e.g.,population pressure),economic factors(e.g., economic growth),technological factors,policy and institutional factors,cultural factors,and biophysical factors(Turner and others1995,Kaimowitz and An-gelsen1998).These factors influence land-use change in different ways.Some of these factors directly influ-ence the rate and quantity of land-use change,e.g.the amount of forest cleared by new incoming migrants. Other factors determine the location of land-use change,e.g.the suitability of the soils for agricultural land use.Especially the biophysical factors do pose constraints to land-use change at certain locations, leading to spatially differentiated pathways of change.It is not possible to classify all factors in groups that either influence the rate or location of land-use change.In some cases the same driving factor has both an influ-ence on the quantity of land-use change as well as on the location of land-use change.Population pressure is often an important driving factor of land-use conver-sions(Rudel and Roper1997).At the same time it is the relative population pressure that determines which land-use changes are taking place at a certain location. Intensively cultivated arable lands are commonly situ-ated at a limited distance from the villages while more extensively managed grasslands are often found at a larger distance from population concentrations,a rela-tion that can be explained by labor intensity,transport costs,and the quality of the products(Von Thu¨nen 1966).The determination of the driving factors of land use changes is often problematic and an issue of dis-cussion(Lambin and others2001).There is no unify-ing theory that includes all processes relevant to land-use change.Reviews of case studies show that it is not possible to simply relate land-use change to population growth,poverty,and infrastructure.Rather,the inter-play of several proximate as well as underlying factors drive land-use change in a synergetic way with large variations caused by location specific conditions (Lambin and others2001,Geist and Lambin2001).In regional modeling we often need to rely on poor data describing this complexity.Instead of using the under-lying driving factors it is needed to use proximate vari-ables that can represent the underlying driving factors. Especially for factors that are important in determining the location of change it is essential that the factor can be mapped quantitatively,representing its spatial vari-ation.The causality between the underlying driving factors and the(proximate)factors used in modeling (in this paper,also referred to as“driving factors”) should be certified.Other system properties that are relevant for land-use systems are stability and resilience,concepts often used to describe ecological systems and,to some extent, social systems(Adger2000,Holling1973,Levin and others1998).Resilience refers to the buffer capacity or the ability of the ecosystem or society to absorb pertur-bations,or the magnitude of disturbance that can be absorbed before a system changes its structure by changing the variables and processes that control be-havior(Holling1992).Stability and resilience are con-cepts that can also be used to describe the dynamics of land-use systems,that inherit these characteristics from both ecological and social systems.Due to stability and resilience of the system disturbances and external in-fluences will,mostly,not directly change the landscape structure(Conway1985).After a natural disaster lands might be abandoned and the population might tempo-rally migrate.However,people will in most cases return after some time and continue land-use management practices as before,recovering the land-use structure (Kok and others2002).Stability in the land-use struc-ture is also a result of the social,economic,and insti-tutional structure.Instead of a direct change in the land-use structure upon a fall in prices of a certain product,farmers will wait a few years,depending on the investments made,before they change their cropping system.These characteristics of land-use systems provide a number requirements for the modelling of land-use change that have been used in the development of the CLUE-S model,including:●Models should not analyze land use at a single scale,but rather include multiple,interconnected spatial scales because of the hierarchical organization of land-use systems.●Special attention should be given to the drivingfactors of land-use change,distinguishing drivers that determine the quantity of change from drivers of the location of change.●Sudden changes in driving factors should not di-rectly change the structure of the land-use system asa consequence of the resilience and stability of theland-use system.394P.H.Verburg and others●The model structure should allow spatial interac-tions between locations and feedbacks from higher levels of organization.Model DescriptionModel StructureThe model is sub-divided into two distinct modules,namely a non-spatial demand module and a spatially explicit allocation procedure (Figure 2).The non-spa-tial module calculates the area change for all land-use types at the aggregate level.Within the second part of the model these demands are translated into land-use changes at different locations within the study region using a raster-based system.For the land-use demand module,different alterna-tive model speci fications are possible,ranging from simple trend extrapolations to complex economic mod-els.The choice for a speci fic model is very much de-pendent on the nature of the most important land-use conversions taking place within the study area and the scenarios that need to be considered.Therefore,the demand calculations will differ between applications and scenarios and need to be decided by the user for the speci fic situation.The results from the demandmodule need to specify,on a yearly basis,the area covered by the different land-use types,which is a direct input for the allocation module.The rest of this paper focuses on the procedure to allocate these demands to land-use conversions at speci fic locations within the study area.The allocation is based upon a combination of em-pirical,spatial analysis,and dynamic modelling.Figure 3gives an overview of the procedure.The empirical analysis unravels the relations between the spatial dis-tribution of land use and a series of factors that are drivers and constraints of land use.The results of this empirical analysis are used within the model when sim-ulating the competition between land-use types for a speci fic location.In addition,a set of decision rules is speci fied by the user to restrict the conversions that can take place based on the actual land-use pattern.The different components of the procedure are now dis-cussed in more detail.Spatial AnalysisThe pattern of land use,as it can be observed from an airplane window or through remotely sensed im-ages,reveals the spatial organization of land use in relation to the underlying biophysical andsocio-eco-Figure 2.Overview of the modelingprocedure.Figure 3.Schematic represen-tation of the procedure to allo-cate changes in land use to a raster based map.Modeling Regional Land-Use Change395nomic conditions.These observations can be formal-ized by overlaying this land-use pattern with maps de-picting the variability in biophysical and socio-economic conditions.Geographical Information Systems(GIS)are used to process all spatial data and convert these into a regular grid.Apart from land use, data are gathered that represent the assumed driving forces of land use in the study area.The list of assumed driving forces is based on prevalent theories on driving factors of land-use change(Lambin and others2001, Kaimowitz and Angelsen1998,Turner and others 1993)and knowledge of the conditions in the study area.Data can originate from remote sensing(e.g., land use),secondary statistics(e.g.,population distri-bution),maps(e.g.,soil),and other sources.To allow a straightforward analysis,the data are converted into a grid based system with a cell size that depends on the resolution of the available data.This often involves the aggregation of one or more layers of thematic data,e.g. it does not make sense to use a30-m resolution if that is available for land-use data only,while the digital elevation model has a resolution of500m.Therefore, all data are aggregated to the same resolution that best represents the quality and resolution of the data.The relations between land use and its driving fac-tors are thereafter evaluated using stepwise logistic re-gression.Logistic regression is an often used method-ology in land-use change research(Geoghegan and others2001,Serneels and Lambin2001).In this study we use logistic regression to indicate the probability of a certain grid cell to be devoted to a land-use type given a set of driving factors following:LogͩP i1ϪP i ͪϭ0ϩ1X1,iϩ2X2,i......ϩn X n,iwhere P i is the probability of a grid cell for the occur-rence of the considered land-use type and the X’s are the driving factors.The stepwise procedure is used to help us select the relevant driving factors from a larger set of factors that are assumed to influence the land-use pattern.Variables that have no significant contribution to the explanation of the land-use pattern are excluded from thefinal regression equation.Where in ordinal least squares regression the R2 gives a measure of modelfit,there is no equivalent for logistic regression.Instead,the goodness offit can be evaluated with the ROC method(Pontius and Schnei-der2000,Swets1986)which evaluates the predicted probabilities by comparing them with the observed val-ues over the whole domain of predicted probabilities instead of only evaluating the percentage of correctly classified observations at afixed cut-off value.This is an appropriate methodology for our application,because we will use a wide range of probabilities within the model calculations.The influence of spatial autocorrelation on the re-gression results can be minimized by only performing the regression on a random sample of pixels at a certain minimum distance from one another.Such a selection method is adopted in order to maximize the distance between the selected pixels to attenuate the problem associated with spatial autocorrelation.For case-studies where autocorrelation has an important influence on the land-use structure it is possible to further exploit it by incorporating an autoregressive term in the regres-sion equation(Overmars and others2002).Based upon the regression results a probability map can be calculated for each land-use type.A new probabil-ity map is calculated every year with updated values for the driving factors that are projected to change in time,such as the population distribution or accessibility.Decision RulesLand-use type or location specific decision rules can be specified by the user.Location specific decision rules include the delineation of protected areas such as nature reserves.If a protected area is specified,no changes are allowed within this area.For each land-use type decision rules determine the conditions under which the land-use type is allowed to change in the next time step.These decision rules are implemented to give certain land-use types a certain resistance to change in order to generate the stability in the land-use structure that is typical for many landscapes.Three different situations can be distinguished and for each land-use type the user should specify which situation is most relevant for that land-use type:1.For some land-use types it is very unlikely that theyare converted into another land-use type after their first conversion;as soon as an agricultural area is urbanized it is not expected to return to agriculture or to be converted into forest cover.Unless a de-crease in area demand for this land-use type occurs the locations covered by this land use are no longer evaluated for potential land-use changes.If this situation is selected it also holds that if the demand for this land-use type decreases,there is no possi-bility for expansion in other areas.In other words, when this setting is applied to forest cover and deforestation needs to be allocated,it is impossible to reforest other areas at the same time.2.Other land-use types are converted more easily.Aswidden agriculture system is most likely to be con-verted into another land-use type soon after its396P.H.Verburg and othersinitial conversion.When this situation is selected for a land-use type no restrictions to change are considered in the allocation module.3.There is also a number of land-use types that oper-ate in between these two extremes.Permanent ag-riculture and plantations require an investment for their establishment.It is therefore not very likely that they will be converted very soon after into another land-use type.However,in the end,when another land-use type becomes more pro fitable,a conversion is possible.This situation is dealt with by de fining the relative elasticity for change (ELAS u )for the land-use type into any other land use type.The relative elasticity ranges between 0(similar to Situation 2)and 1(similar to Situation 1).The higher the de fined elasticity,the more dif ficult it gets to convert this land-use type.The elasticity should be de fined based on the user ’s knowledge of the situation,but can also be tuned during the calibration of the petition and Actual Allocation of Change Allocation of land-use change is made in an iterative procedure given the probability maps,the decision rules in combination with the actual land-use map,and the demand for the different land-use types (Figure 4).The following steps are followed in the calculation:1.The first step includes the determination of all grid cells that are allowed to change.Grid cells that are either part of a protected area or under a land-use type that is not allowed to change (Situation 1,above)are excluded from further calculation.2.For each grid cell i the total probability (TPROP i,u )is calculated for each of the land-use types u accord-ing to:TPROP i,u ϭP i,u ϩELAS u ϩITER u ,where ITER u is an iteration variable that is speci fic to the land use.ELAS u is the relative elasticity for change speci fied in the decision rules (Situation 3de-scribed above)and is only given a value if grid-cell i is already under land use type u in the year considered.ELAS u equals zero if all changes are allowed (Situation 2).3.A preliminary allocation is made with an equalvalue of the iteration variable (ITER u )for all land-use types by allocating the land-use type with the highest total probability for the considered grid cell.This will cause a number of grid cells to change land use.4.The total allocated area of each land use is nowcompared to the demand.For land-use types where the allocated area is smaller than the demanded area the value of the iteration variable is increased.For land-use types for which too much is allocated the value is decreased.5.Steps 2to 4are repeated as long as the demandsare not correctly allocated.When allocation equals demand the final map is saved and the calculations can continue for the next yearly timestep.Figure 5shows the development of the iteration parameter ITER u for different land-use types during asimulation.Figure 4.Representation of the iterative procedure for land-use changeallocation.Figure 5.Change in the iteration parameter (ITER u )during the simulation within one time-step.The different lines rep-resent the iteration parameter for different land-use types.The parameter is changed for all land-use types synchronously until the allocated land use equals the demand.Modeling Regional Land-Use Change397Multi-Scale CharacteristicsOne of the requirements for land-use change mod-els are multi-scale characteristics.The above described model structure incorporates different types of scale interactions.Within the iterative procedure there is a continuous interaction between macro-scale demands and local land-use suitability as determined by the re-gression equations.When the demand changes,the iterative procedure will cause the land-use types for which demand increased to have a higher competitive capacity (higher value for ITER u )to ensure enough allocation of this land-use type.Instead of only being determined by the local conditions,captured by the logistic regressions,it is also the regional demand that affects the actually allocated changes.This allows the model to “overrule ”the local suitability,it is not always the land-use type with the highest probability according to the logistic regression equation (P i,u )that the grid cell is allocated to.Apart from these two distinct levels of analysis there are also driving forces that operate over a certain dis-tance instead of being locally important.Applying a neighborhood function that is able to represent the regional in fluence of the data incorporates this type of variable.Population pressure is an example of such a variable:often the in fluence of population acts over a certain distance.Therefore,it is not the exact location of peoples houses that determines the land-use pattern.The average population density over a larger area is often a more appropriate variable.Such a population density surface can be created by a neighborhood func-tion using detailed spatial data.The data generated this way can be included in the spatial analysis as anotherindependent factor.In the application of the model in the Philippines,described hereafter,we applied a 5ϫ5focal filter to the population map to generate a map representing the general population pressure.Instead of using these variables,generated by neighborhood analysis,it is also possible to use the more advanced technique of multi-level statistics (Goldstein 1995),which enable a model to include higher-level variables in a straightforward manner within the regression equa-tion (Polsky and Easterling 2001).Application of the ModelIn this paper,two examples of applications of the model are provided to illustrate its function.TheseTable nd-use classes and driving factors evaluated for Sibuyan IslandLand-use classes Driving factors (location)Forest Altitude (m)GrasslandSlope Coconut plantation AspectRice fieldsDistance to town Others (incl.mangrove and settlements)Distance to stream Distance to road Distance to coast Distance to port Erosion vulnerability GeologyPopulation density(neighborhood 5ϫ5)Figure 6.Location of the case-study areas.398P.H.Verburg and others。

DOI: 10.1126/science.1094786, 441 (2004);304Science et al.Mitchell S. Abrahamsen,Cryptosporidium parvum Complete Genome Sequence of the Apicomplexan, (this information is current as of October 7, 2009 ):The following resources related to this article are available online at/cgi/content/full/304/5669/441version of this article at:including high-resolution figures, can be found in the online Updated information and services,/cgi/content/full/1094786/DC1 can be found at:Supporting Online Material/cgi/content/full/304/5669/441#otherarticles , 9 of which can be accessed for free: cites 25 articles This article 239 article(s) on the ISI Web of Science. cited by This article has been /cgi/content/full/304/5669/441#otherarticles 53 articles hosted by HighWire Press; see: cited by This article has been/cgi/collection/genetics Genetics: subject collections This article appears in the following/about/permissions.dtl in whole or in part can be found at: this article permission to reproduce of this article or about obtaining reprints Information about obtaining registered trademark of AAAS.is a Science 2004 by the American Association for the Advancement of Science; all rights reserved. The title Copyright American Association for the Advancement of Science, 1200 New York Avenue NW, Washington, DC 20005. (print ISSN 0036-8075; online ISSN 1095-9203) is published weekly, except the last week in December, by the Science o n O c t o b e r 7, 2009w w w .s c i e n c e m a g .o r g D o w n l o a d e d f r o m3.R.Jackendoff,Foundations of Language:Brain,Gram-mar,Evolution(Oxford Univ.Press,Oxford,2003).4.Although for Frege(1),reference was established rela-tive to objects in the world,here we follow Jackendoff’s suggestion(3)that this is done relative to objects and the state of affairs as mentally represented.5.S.Zola-Morgan,L.R.Squire,in The Development andNeural Bases of Higher Cognitive Functions(New York Academy of Sciences,New York,1990),pp.434–456.6.N.Chomsky,Reflections on Language(Pantheon,New York,1975).7.J.Katz,Semantic Theory(Harper&Row,New York,1972).8.D.Sperber,D.Wilson,Relevance(Harvard Univ.Press,Cambridge,MA,1986).9.K.I.Forster,in Sentence Processing,W.E.Cooper,C.T.Walker,Eds.(Erlbaum,Hillsdale,NJ,1989),pp.27–85.10.H.H.Clark,Using Language(Cambridge Univ.Press,Cambridge,1996).11.Often word meanings can only be fully determined byinvokingworld knowledg e.For instance,the meaningof “flat”in a“flat road”implies the absence of holes.However,in the expression“aflat tire,”it indicates the presence of a hole.The meaningof“finish”in the phrase “Billfinished the book”implies that Bill completed readingthe book.However,the phrase“the g oatfin-ished the book”can only be interpreted as the goat eatingor destroyingthe book.The examples illustrate that word meaningis often underdetermined and nec-essarily intertwined with general world knowledge.In such cases,it is hard to see how the integration of lexical meaning and general world knowledge could be strictly separated(3,31).12.W.Marslen-Wilson,C.M.Brown,L.K.Tyler,Lang.Cognit.Process.3,1(1988).13.ERPs for30subjects were averaged time-locked to theonset of the critical words,with40items per condition.Sentences were presented word by word on the centerof a computer screen,with a stimulus onset asynchronyof600ms.While subjects were readingthe sentences,their EEG was recorded and amplified with a high-cut-off frequency of70Hz,a time constant of8s,and asamplingfrequency of200Hz.14.Materials and methods are available as supportingmaterial on Science Online.15.M.Kutas,S.A.Hillyard,Science207,203(1980).16.C.Brown,P.Hagoort,J.Cognit.Neurosci.5,34(1993).17.C.M.Brown,P.Hagoort,in Architectures and Mech-anisms for Language Processing,M.W.Crocker,M.Pickering,C.Clifton Jr.,Eds.(Cambridge Univ.Press,Cambridge,1999),pp.213–237.18.F.Varela et al.,Nature Rev.Neurosci.2,229(2001).19.We obtained TFRs of the single-trial EEG data by con-volvingcomplex Morlet wavelets with the EEG data andcomputingthe squared norm for the result of theconvolution.We used wavelets with a7-cycle width,with frequencies ranging from1to70Hz,in1-Hz steps.Power values thus obtained were expressed as a per-centage change relative to the power in a baselineinterval,which was taken from150to0ms before theonset of the critical word.This was done in order tonormalize for individual differences in EEG power anddifferences in baseline power between different fre-quency bands.Two relevant time-frequency compo-nents were identified:(i)a theta component,rangingfrom4to7Hz and from300to800ms after wordonset,and(ii)a gamma component,ranging from35to45Hz and from400to600ms after word onset.20.C.Tallon-Baudry,O.Bertrand,Trends Cognit.Sci.3,151(1999).tner et al.,Nature397,434(1999).22.M.Bastiaansen,P.Hagoort,Cortex39(2003).23.O.Jensen,C.D.Tesche,Eur.J.Neurosci.15,1395(2002).24.Whole brain T2*-weighted echo planar imaging bloodoxygen level–dependent(EPI-BOLD)fMRI data wereacquired with a Siemens Sonata1.5-T magnetic reso-nance scanner with interleaved slice ordering,a volumerepetition time of2.48s,an echo time of40ms,a90°flip angle,31horizontal slices,a64ϫ64slice matrix,and isotropic voxel size of3.5ϫ3.5ϫ3.5mm.For thestructural magnetic resonance image,we used a high-resolution(isotropic voxels of1mm3)T1-weightedmagnetization-prepared rapid gradient-echo pulse se-quence.The fMRI data were preprocessed and analyzedby statistical parametric mappingwith SPM99software(http://www.fi/spm99).25.S.E.Petersen et al.,Nature331,585(1988).26.B.T.Gold,R.L.Buckner,Neuron35,803(2002).27.E.Halgren et al.,J.Psychophysiol.88,1(1994).28.E.Halgren et al.,Neuroimage17,1101(2002).29.M.K.Tanenhaus et al.,Science268,1632(1995).30.J.J.A.van Berkum et al.,J.Cognit.Neurosci.11,657(1999).31.P.A.M.Seuren,Discourse Semantics(Basil Blackwell,Oxford,1985).32.We thank P.Indefrey,P.Fries,P.A.M.Seuren,and M.van Turennout for helpful discussions.Supported bythe Netherlands Organization for Scientific Research,grant no.400-56-384(P.H.).Supporting Online Material/cgi/content/full/1095455/DC1Materials and MethodsFig.S1References and Notes8January2004;accepted9March2004Published online18March2004;10.1126/science.1095455Include this information when citingthis paper.Complete Genome Sequence ofthe Apicomplexan,Cryptosporidium parvumMitchell S.Abrahamsen,1,2*†Thomas J.Templeton,3†Shinichiro Enomoto,1Juan E.Abrahante,1Guan Zhu,4 Cheryl ncto,1Mingqi Deng,1Chang Liu,1‡Giovanni Widmer,5Saul Tzipori,5GregoryA.Buck,6Ping Xu,6 Alan T.Bankier,7Paul H.Dear,7Bernard A.Konfortov,7 Helen F.Spriggs,7Lakshminarayan Iyer,8Vivek Anantharaman,8L.Aravind,8Vivek Kapur2,9The apicomplexan Cryptosporidium parvum is an intestinal parasite that affects healthy humans and animals,and causes an unrelenting infection in immuno-compromised individuals such as AIDS patients.We report the complete ge-nome sequence of C.parvum,type II isolate.Genome analysis identifies ex-tremely streamlined metabolic pathways and a reliance on the host for nu-trients.In contrast to Plasmodium and Toxoplasma,the parasite lacks an api-coplast and its genome,and possesses a degenerate mitochondrion that has lost its genome.Several novel classes of cell-surface and secreted proteins with a potential role in host interactions and pathogenesis were also detected.Elu-cidation of the core metabolism,including enzymes with high similarities to bacterial and plant counterparts,opens new avenues for drug development.Cryptosporidium parvum is a globally impor-tant intracellular pathogen of humans and animals.The duration of infection and patho-genesis of cryptosporidiosis depends on host immune status,ranging from a severe but self-limiting diarrhea in immunocompetent individuals to a life-threatening,prolonged infection in immunocompromised patients.Asubstantial degree of morbidity and mortalityis associated with infections in AIDS pa-tients.Despite intensive efforts over the past20years,there is currently no effective ther-apy for treating or preventing C.parvuminfection in humans.Cryptosporidium belongs to the phylumApicomplexa,whose members share a com-mon apical secretory apparatus mediating lo-comotion and tissue or cellular invasion.Many apicomplexans are of medical or vet-erinary importance,including Plasmodium,Babesia,Toxoplasma,Neosprora,Sarcocys-tis,Cyclospora,and Eimeria.The life cycle ofC.parvum is similar to that of other cyst-forming apicomplexans(e.g.,Eimeria and Tox-oplasma),resulting in the formation of oocysts1Department of Veterinary and Biomedical Science,College of Veterinary Medicine,2Biomedical Genom-ics Center,University of Minnesota,St.Paul,MN55108,USA.3Department of Microbiology and Immu-nology,Weill Medical College and Program in Immu-nology,Weill Graduate School of Medical Sciences ofCornell University,New York,NY10021,USA.4De-partment of Veterinary Pathobiology,College of Vet-erinary Medicine,Texas A&M University,College Sta-tion,TX77843,USA.5Division of Infectious Diseases,Tufts University School of Veterinary Medicine,NorthGrafton,MA01536,USA.6Center for the Study ofBiological Complexity and Department of Microbiol-ogy and Immunology,Virginia Commonwealth Uni-versity,Richmond,VA23198,USA.7MRC Laboratoryof Molecular Biology,Hills Road,Cambridge CB22QH,UK.8National Center for Biotechnology Infor-mation,National Library of Medicine,National Insti-tutes of Health,Bethesda,MD20894,USA.9Depart-ment of Microbiology,University of Minnesota,Min-neapolis,MN55455,USA.*To whom correspondence should be addressed.E-mail:abe@†These authors contributed equally to this work.‡Present address:Bioinformatics Division,Genetic Re-search,GlaxoSmithKline Pharmaceuticals,5MooreDrive,Research Triangle Park,NC27009,USA.R E P O R T S SCIENCE VOL30416APRIL2004441o n O c t o b e r 7 , 2 0 0 9 w w w . s c i e n c e m a g . o r g D o w n l o a d e d f r o mthat are shed in the feces of infected hosts.C.parvum oocysts are highly resistant to environ-mental stresses,including chlorine treatment of community water supplies;hence,the parasite is an important water-and food-borne pathogen (1).The obligate intracellular nature of the par-asite ’s life cycle and the inability to culture the parasite continuously in vitro greatly impair researchers ’ability to obtain purified samples of the different developmental stages.The par-asite cannot be genetically manipulated,and transformation methodologies are currently un-available.To begin to address these limitations,we have obtained the complete C.parvum ge-nome sequence and its predicted protein com-plement.(This whole-genome shotgun project has been deposited at DDBJ/EMBL/GenBank under the project accession AAEE00000000.The version described in this paper is the first version,AAEE01000000.)The random shotgun approach was used to obtain the complete DNA sequence (2)of the Iowa “type II ”isolate of C.parvum .This isolate readily transmits disease among numerous mammals,including humans.The resulting ge-nome sequence has roughly 13ϫgenome cov-erage containing five gaps and 9.1Mb of totalDNA sequence within eight chromosomes.The C.parvum genome is thus quite compact rela-tive to the 23-Mb,14-chromosome genome of Plasmodium falciparum (3);this size difference is predominantly the result of shorter intergenic regions,fewer introns,and a smaller number of genes (Table 1).Comparison of the assembled sequence of chromosome VI to that of the recently published sequence of chromosome VI (4)revealed that our assembly contains an ad-ditional 160kb of sequence and a single gap versus two,with the common sequences dis-playing a 99.993%sequence identity (2).The relative paucity of introns greatly simplified gene predictions and facilitated an-notation (2)of predicted open reading frames (ORFs).These analyses provided an estimate of 3807protein-encoding genes for the C.parvum genome,far fewer than the estimated 5300genes predicted for the Plasmodium genome (3).This difference is primarily due to the absence of an apicoplast and mitochondrial genome,as well as the pres-ence of fewer genes encoding metabolic functions and variant surface proteins,such as the P.falciparum var and rifin molecules (Table 2).An analysis of the encoded pro-tein sequences with the program SEG (5)shows that these protein-encoding genes are not enriched in low-complexity se-quences (34%)to the extent observed in the proteins from Plasmodium (70%).Our sequence analysis indicates that Cryptosporidium ,unlike Plasmodium and Toxoplasma ,lacks both mitochondrion and apicoplast genomes.The overall complete-ness of the genome sequence,together with the fact that similar DNA extraction proce-dures used to isolate total genomic DNA from C.parvum efficiently yielded mito-chondrion and apicoplast genomes from Ei-meria sp.and Toxoplasma (6,7),indicates that the absence of organellar genomes was unlikely to have been the result of method-ological error.These conclusions are con-sistent with the absence of nuclear genes for the DNA replication and translation machinery characteristic of mitochondria and apicoplasts,and with the lack of mito-chondrial or apicoplast targeting signals for tRNA synthetases.A number of putative mitochondrial pro-teins were identified,including components of a mitochondrial protein import apparatus,chaperones,uncoupling proteins,and solute translocators (table S1).However,the ge-nome does not encode any Krebs cycle en-zymes,nor the components constituting the mitochondrial complexes I to IV;this finding indicates that the parasite does not rely on complete oxidation and respiratory chains for synthesizing adenosine triphosphate (ATP).Similar to Plasmodium ,no orthologs for the ␥,␦,or εsubunits or the c subunit of the F 0proton channel were detected (whereas all subunits were found for a V-type ATPase).Cryptosporidium ,like Eimeria (8)and Plas-modium ,possesses a pyridine nucleotide tran-shydrogenase integral membrane protein that may couple reduced nicotinamide adenine dinucleotide (NADH)and reduced nico-tinamide adenine dinucleotide phosphate (NADPH)redox to proton translocation across the inner mitochondrial membrane.Unlike Plasmodium ,the parasite has two copies of the pyridine nucleotide transhydrogenase gene.Also present is a likely mitochondrial membrane –associated,cyanide-resistant alter-native oxidase (AOX )that catalyzes the reduction of molecular oxygen by ubiquinol to produce H 2O,but not superoxide or H 2O 2.Several genes were identified as involved in biogenesis of iron-sulfur [Fe-S]complexes with potential mitochondrial targeting signals (e.g.,nifS,nifU,frataxin,and ferredoxin),supporting the presence of a limited electron flux in the mitochondrial remnant (table S2).Our sequence analysis confirms the absence of a plastid genome (7)and,additionally,the loss of plastid-associated metabolic pathways including the type II fatty acid synthases (FASs)and isoprenoid synthetic enzymes thatTable 1.General features of the C.parvum genome and comparison with other single-celled eukaryotes.Values are derived from respective genome project summaries (3,26–28).ND,not determined.FeatureC.parvum P.falciparum S.pombe S.cerevisiae E.cuniculiSize (Mbp)9.122.912.512.5 2.5(G ϩC)content (%)3019.43638.347No.of genes 38075268492957701997Mean gene length (bp)excluding introns 1795228314261424ND Gene density (bp per gene)23824338252820881256Percent coding75.352.657.570.590Genes with introns (%)553.9435ND Intergenic regions (G ϩC)content %23.913.632.435.145Mean length (bp)5661694952515129RNAsNo.of tRNA genes 454317429944No.of 5S rRNA genes 6330100–2003No.of 5.8S ,18S ,and 28S rRNA units 57200–400100–20022Table parison between predicted C.parvum and P.falciparum proteins.FeatureC.parvum P.falciparum *Common †Total predicted proteins380752681883Mitochondrial targeted/encoded 17(0.45%)246(4.7%)15Apicoplast targeted/encoded 0581(11.0%)0var/rif/stevor ‡0236(4.5%)0Annotated as protease §50(1.3%)31(0.59%)27Annotated as transporter 69(1.8%)34(0.65%)34Assigned EC function ¶167(4.4%)389(7.4%)113Hypothetical proteins925(24.3%)3208(60.9%)126*Values indicated for P.falciparum are as reported (3)with the exception of those for proteins annotated as protease or transporter.†TBLASTN hits (e Ͻ–5)between C.parvum and P.falciparum .‡As reported in (3).§Pre-dicted proteins annotated as “protease or peptidase”for C.parvum (CryptoGenome database,)and P.falciparum (PlasmoDB database,).Predicted proteins annotated as “trans-porter,permease of P-type ATPase”for C.parvum (CryptoGenome)and P.falciparum (PlasmoDB).¶Bidirectional BLAST hit (e Ͻ–15)to orthologs with assigned Enzyme Commission (EC)numbers.Does not include EC assignment numbers for protein kinases or protein phosphatases (due to inconsistent annotation across genomes),or DNA polymerases or RNA polymerases,as a result of issues related to subunit inclusion.(For consistency,46proteins were excluded from the reported P.falciparum values.)R E P O R T S16APRIL 2004VOL 304SCIENCE 442 o n O c t o b e r 7, 2009w w w .s c i e n c e m a g .o r g D o w n l o a d e d f r o mare otherwise localized to the plastid in other apicomplexans.C.parvum fatty acid biosynthe-sis appears to be cytoplasmic,conducted by a large(8252amino acids)modular type I FAS (9)and possibly by another large enzyme that is related to the multidomain bacterial polyketide synthase(10).Comprehensive screening of the C.parvum genome sequence also did not detect orthologs of Plasmodium nuclear-encoded genes that contain apicoplast-targeting and transit sequences(11).C.parvum metabolism is greatly stream-lined relative to that of Plasmodium,and in certain ways it is reminiscent of that of another obligate eukaryotic parasite,the microsporidian Encephalitozoon.The degeneration of the mi-tochondrion and associated metabolic capabili-ties suggests that the parasite largely relies on glycolysis for energy production.The parasite is capable of uptake and catabolism of mono-sugars(e.g.,glucose and fructose)as well as synthesis,storage,and catabolism of polysac-charides such as trehalose and amylopectin. Like many anaerobic organisms,it economizes ATP through the use of pyrophosphate-dependent phosphofructokinases.The conver-sion of pyruvate to acetyl–coenzyme A(CoA) is catalyzed by an atypical pyruvate-NADPH oxidoreductase(Cp PNO)that contains an N-terminal pyruvate–ferredoxin oxidoreductase (PFO)domain fused with a C-terminal NADPH–cytochrome P450reductase domain (CPR).Such a PFO-CPR fusion has previously been observed only in the euglenozoan protist Euglena gracilis(12).Acetyl-CoA can be con-verted to malonyl-CoA,an important precursor for fatty acid and polyketide biosynthesis.Gly-colysis leads to several possible organic end products,including lactate,acetate,and ethanol. The production of acetate from acetyl-CoA may be economically beneficial to the parasite via coupling with ATP production.Ethanol is potentially produced via two in-dependent pathways:(i)from the combination of pyruvate decarboxylase and alcohol dehy-drogenase,or(ii)from acetyl-CoA by means of a bifunctional dehydrogenase(adhE)with ac-etaldehyde and alcohol dehydrogenase activi-ties;adhE first converts acetyl-CoA to acetal-dehyde and then reduces the latter to ethanol. AdhE predominantly occurs in bacteria but has recently been identified in several protozoans, including vertebrate gut parasites such as Enta-moeba and Giardia(13,14).Adjacent to the adhE gene resides a second gene encoding only the AdhE C-terminal Fe-dependent alcohol de-hydrogenase domain.This gene product may form a multisubunit complex with AdhE,or it may function as an alternative alcohol dehydro-genase that is specific to certain growth condi-tions.C.parvum has a glycerol3-phosphate dehydrogenase similar to those of plants,fungi, and the kinetoplastid Trypanosoma,but(unlike trypanosomes)the parasite lacks an ortholog of glycerol kinase and thus this pathway does not yield glycerol production.In addition to themodular fatty acid synthase(Cp FAS1)andpolyketide synthase homolog(Cp PKS1), C.parvum possesses several fatty acyl–CoA syn-thases and a fatty acyl elongase that may partici-pate in fatty acid metabolism.Further,enzymesfor the metabolism of complex lipids(e.g.,glyc-erolipid and inositol phosphate)were identified inthe genome.Fatty acids are apparently not anenergy source,because enzymes of the fatty acidoxidative pathway are absent,with the exceptionof a3-hydroxyacyl-CoA dehydrogenase.C.parvum purine metabolism is greatlysimplified,retaining only an adenosine ki-nase and enzymes catalyzing conversionsof adenosine5Ј-monophosphate(AMP)toinosine,xanthosine,and guanosine5Ј-monophosphates(IMP,XMP,and GMP).Among these enzymes,IMP dehydrogenase(IMPDH)is phylogenetically related toε-proteobacterial IMPDH and is strikinglydifferent from its counterparts in both thehost and other apicomplexans(15).In con-trast to other apicomplexans such as Toxo-plasma gondii and P.falciparum,no geneencoding hypoxanthine-xanthineguaninephosphoribosyltransferase(HXGPRT)is de-tected,in contrast to a previous report on theactivity of this enzyme in C.parvum sporo-zoites(16).The absence of HXGPRT sug-gests that the parasite may rely solely on asingle enzyme system including IMPDH toproduce GMP from AMP.In contrast to otherapicomplexans,the parasite appears to relyon adenosine for purine salvage,a modelsupported by the identification of an adeno-sine transporter.Unlike other apicomplexansand many parasitic protists that can synthe-size pyrimidines de novo,C.parvum relies onpyrimidine salvage and retains the ability forinterconversions among uridine and cytidine5Ј-monophosphates(UMP and CMP),theirdeoxy forms(dUMP and dCMP),and dAMP,as well as their corresponding di-and triphos-phonucleotides.The parasite has also largelyshed the ability to synthesize amino acids denovo,although it retains the ability to convertselect amino acids,and instead appears torely on amino acid uptake from the host bymeans of a set of at least11amino acidtransporters(table S2).Most of the Cryptosporidium core pro-cesses involved in DNA replication,repair,transcription,and translation conform to thebasic eukaryotic blueprint(2).The transcrip-tional apparatus resembles Plasmodium interms of basal transcription machinery.How-ever,a striking numerical difference is seenin the complements of two RNA bindingdomains,Sm and RRM,between P.falcipa-rum(17and71domains,respectively)and C.parvum(9and51domains).This reductionresults in part from the loss of conservedproteins belonging to the spliceosomal ma-chinery,including all genes encoding Smdomain proteins belonging to the U6spliceo-somal particle,which suggests that this par-ticle activity is degenerate or entirely lost.This reduction in spliceosomal machinery isconsistent with the reduced number of pre-dicted introns in Cryptosporidium(5%)rela-tive to Plasmodium(Ͼ50%).In addition,keycomponents of the small RNA–mediatedposttranscriptional gene silencing system aremissing,such as the RNA-dependent RNApolymerase,Argonaute,and Dicer orthologs;hence,RNA interference–related technolo-gies are unlikely to be of much value intargeted disruption of genes in C.parvum.Cryptosporidium invasion of columnarbrush border epithelial cells has been de-scribed as“intracellular,but extracytoplas-mic,”as the parasite resides on the surface ofthe intestinal epithelium but lies underneaththe host cell membrane.This niche may al-low the parasite to evade immune surveil-lance but take advantage of solute transportacross the host microvillus membrane or theextensively convoluted parasitophorous vac-uole.Indeed,Cryptosporidium has numerousgenes(table S2)encoding families of putativesugar transporters(up to9genes)and aminoacid transporters(11genes).This is in starkcontrast to Plasmodium,which has fewersugar transporters and only one putative ami-no acid transporter(GenBank identificationnumber23612372).As a first step toward identification ofmulti–drug-resistant pumps,the genome se-quence was analyzed for all occurrences ofgenes encoding multitransmembrane proteins.Notable are a set of four paralogous proteinsthat belong to the sbmA family(table S2)thatare involved in the transport of peptide antibi-otics in bacteria.A putative ortholog of thePlasmodium chloroquine resistance–linkedgene Pf CRT(17)was also identified,althoughthe parasite does not possess a food vacuole likethe one seen in Plasmodium.Unlike Plasmodium,C.parvum does notpossess extensive subtelomeric clusters of anti-genically variant proteins(exemplified by thelarge families of var and rif/stevor genes)thatare involved in immune evasion.In contrast,more than20genes were identified that encodemucin-like proteins(18,19)having hallmarksof extensive Thr or Ser stretches suggestive ofglycosylation and signal peptide sequences sug-gesting secretion(table S2).One notable exam-ple is an11,700–amino acid protein with anuninterrupted stretch of308Thr residues(cgd3_720).Although large families of secretedproteins analogous to the Plasmodium multi-gene families were not found,several smallermultigene clusters were observed that encodepredicted secreted proteins,with no detectablesimilarity to proteins from other organisms(Fig.1,A and B).Within this group,at leastfour distinct families appear to have emergedthrough gene expansions specific to the Cryp-R E P O R T S SCIENCE VOL30416APRIL2004443o n O c t o b e r 7 , 2 0 0 9 w w w . s c i e n c e m a g . o r g D o w n l o a d e d f r o mtosporidium clade.These families —SKSR,MEDLE,WYLE,FGLN,and GGC —were named after well-conserved sequence motifs (table S2).Reverse transcription polymerase chain reaction (RT-PCR)expression analysis (20)of one cluster,a locus of seven adjacent CpLSP genes (Fig.1B),shows coexpression during the course of in vitro development (Fig.1C).An additional eight genes were identified that encode proteins having a periodic cysteine structure similar to the Cryptosporidium oocyst wall protein;these eight genes are similarly expressed during the onset of oocyst formation and likely participate in the formation of the coccidian rigid oocyst wall in both Cryptospo-ridium and Toxoplasma (21).Whereas the extracellular proteins described above are of apparent apicomplexan or lineage-specific in-vention,Cryptosporidium possesses many genesencodingsecretedproteinshavinglineage-specific multidomain architectures composed of animal-and bacterial-like extracellular adhe-sive domains (fig.S1).Lineage-specific expansions were ob-served for several proteases (table S2),in-cluding an aspartyl protease (six genes),a subtilisin-like protease,a cryptopain-like cys-teine protease (five genes),and a Plas-modium falcilysin-like (insulin degrading enzyme –like)protease (19genes).Nine of the Cryptosporidium falcilysin genes lack the Zn-chelating “HXXEH ”active site motif and are likely to be catalytically inactive copies that may have been reused for specific protein-protein interactions on the cell sur-face.In contrast to the Plasmodium falcilysin,the Cryptosporidium genes possess signal peptide sequences and are likely trafficked to a secretory pathway.The expansion of this family suggests either that the proteins have distinct cleavage specificities or that their diversity may be related to evasion of a host immune response.Completion of the C.parvum genome se-quence has highlighted the lack of conven-tional drug targets currently pursued for the control and treatment of other parasitic protists.On the basis of molecular and bio-chemical studies and drug screening of other apicomplexans,several putative Cryptospo-ridium metabolic pathways or enzymes have been erroneously proposed to be potential drug targets (22),including the apicoplast and its associated metabolic pathways,the shikimate pathway,the mannitol cycle,the electron transport chain,and HXGPRT.Nonetheless,complete genome sequence analysis identifies a number of classic and novel molecular candidates for drug explora-tion,including numerous plant-like and bacterial-like enzymes (tables S3and S4).Although the C.parvum genome lacks HXGPRT,a potent drug target in other api-complexans,it has only the single pathway dependent on IMPDH to convert AMP to GMP.The bacterial-type IMPDH may be a promising target because it differs substan-tially from that of eukaryotic enzymes (15).Because of the lack of de novo biosynthetic capacity for purines,pyrimidines,and amino acids,C.parvum relies solely on scavenge from the host via a series of transporters,which may be exploited for chemotherapy.C.parvum possesses a bacterial-type thymidine kinase,and the role of this enzyme in pyrim-idine metabolism and its drug target candida-cy should be pursued.The presence of an alternative oxidase,likely targeted to the remnant mitochondrion,gives promise to the study of salicylhydroxamic acid (SHAM),as-cofuranone,and their analogs as inhibitors of energy metabolism in the parasite (23).Cryptosporidium possesses at least 15“plant-like ”enzymes that are either absent in or highly divergent from those typically found in mammals (table S3).Within the glycolytic pathway,the plant-like PPi-PFK has been shown to be a potential target in other parasites including T.gondii ,and PEPCL and PGI ap-pear to be plant-type enzymes in C.parvum .Another example is a trehalose-6-phosphate synthase/phosphatase catalyzing trehalose bio-synthesis from glucose-6-phosphate and uridine diphosphate –glucose.Trehalose may serve as a sugar storage source or may function as an antidesiccant,antioxidant,or protein stability agent in oocysts,playing a role similar to that of mannitol in Eimeria oocysts (24).Orthologs of putative Eimeria mannitol synthesis enzymes were not found.However,two oxidoreductases (table S2)were identified in C.parvum ,one of which belongs to the same families as the plant mannose dehydrogenases (25)and the other to the plant cinnamyl alcohol dehydrogenases.In principle,these enzymes could synthesize protective polyol compounds,and the former enzyme could use host-derived mannose to syn-thesize mannitol.References and Notes1.D.G.Korich et al .,Appl.Environ.Microbiol.56,1423(1990).2.See supportingdata on Science Online.3.M.J.Gardner et al .,Nature 419,498(2002).4.A.T.Bankier et al .,Genome Res.13,1787(2003).5.J.C.Wootton,Comput.Chem.18,269(1994).Fig.1.(A )Schematic showing the chromosomal locations of clusters of potentially secreted proteins.Numbers of adjacent genes are indicated in paren-theses.Arrows indicate direc-tion of clusters containinguni-directional genes (encoded on the same strand);squares indi-cate clusters containingg enes encoded on both strands.Non-paralogous genes are indicated by solid gray squares or direc-tional triangles;SKSR (green triangles),FGLN (red trian-gles),and MEDLE (blue trian-gles)indicate three C.parvum –specific families of paralogous genes predominantly located at telomeres.Insl (yellow tri-angles)indicates an insulinase/falcilysin-like paralogous gene family.Cp LSP (white square)indicates the location of a clus-ter of adjacent large secreted proteins (table S2)that are cotranscriptionally regulated.Identified anchored telomeric repeat sequences are indicated by circles.(B )Schematic show-inga select locus containinga cluster of coexpressed large secreted proteins (Cp LSP).Genes and intergenic regions (regions between identified genes)are drawn to scale at the nucleotide level.The length of the intergenic re-gions is indicated above or be-low the locus.(C )Relative ex-pression levels of CpLSP (red lines)and,as a control,C.parvum Hedgehog-type HINT domain gene (blue line)duringin vitro development,as determined by semiquantitative RT-PCR usingg ene-specific primers correspondingto the seven adjacent g enes within the CpLSP locus as shown in (B).Expression levels from three independent time-course experiments are represented as the ratio of the expression of each gene to that of C.parvum 18S rRNA present in each of the infected samples (20).R E P O R T S16APRIL 2004VOL 304SCIENCE 444 o n O c t o b e r 7, 2009w w w .s c i e n c e m a g .o r g D o w n l o a d e d f r o m。
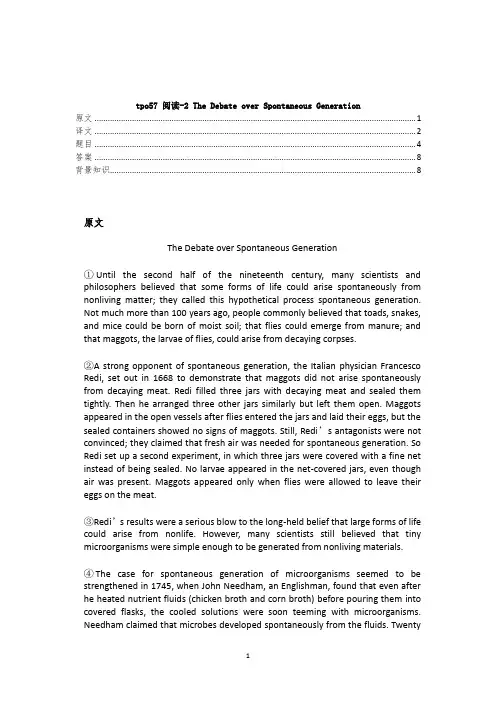
tpo57 阅读-2 The Debate over Spontaneous Generation原文 (1)译文 (2)题目 (4)答案 (8)背景知识 (8)原文The Debate over Spontaneous Generation①Until the second half of the nineteenth century, many scientists and philosophers believed that some forms of life could arise spontaneously from nonliving matter; they called this hypothetical process spontaneous generation. Not much more than 100 years ago, people commonly believed that toads, snakes, and mice could be born of moist soil; that flies could emerge from manure; and that maggots, the larvae of flies, could arise from decaying corpses.②A strong opponent of spontaneous generation, the Italian physician Francesco Redi, set out in 1668 to demonstrate that maggots did not arise spontaneously from decaying meat. Redi filled three jars with decaying meat and sealed them tightly. Then he arranged three other jars similarly but left them open. Maggots appeared in the open vessels after flies entered the jars and laid their eggs, but the sealed containers showed no signs of maggots. Still, Redi’s antagonists were not convinced; they claimed that fresh air was needed for spontaneous generation. So Redi set up a second experiment, in which three jars were covered with a fine net instead of being sealed. No larvae appeared in the net-covered jars, even though air was present. Maggots appeared only when flies were allowed to leave their eggs on the meat.③Redi’s results were a serious blow to the long-held belief that large forms of life could arise from nonlife. However, many scientists still believed that tiny microorganisms were simple enough to be generated from nonliving materials.④The case for spontaneous generation of microorganisms seemed to be strengthened in 1745, when John Needham, an Englishman, found that even after he heated nutrient fluids (chicken broth and corn broth) before pouring them into covered flasks, the cooled solutions were soon teeming with microorganisms. Needham claimed that microbes developed spontaneously from the fluids. Twentyyears later, Lazzaro Spallanzani, an Italian scientist, suggested that microorganisms from the air probably had entered Needham’s solutions after they were boiled. Spallanzani showed that nutrient fluids heated after being sealed in a flask did not develop microbial growth. Needham responded by claiming the “vital force”necessary for spontaneous generation had been destroyed by the heat and was kept out of the flasks by the seals.⑤This intangible “vital force”was given all the more credence shortly after Spallanzani’s experiment, when Laurent Lavoisier showed the importance of oxygen to life. Spallanzani’s observations were criticized on the grounds that there was not enough oxygen in the sealed flasks to support microbial life.⑥The issue was still unresolved in 1858, when the German scientist Rudolf Virchow challenged spontaneous generation with the concept of biogenesis, the claim that living cells can arise only from preexisting living cells. Arguments about spontaneous generation continued until 1861, when the work of the French scientist Louis Pasteur ended the debate.⑦With a series of ingenious and persuasive experiments, Pasteur demonstrated that microorganisms are present in the air and can contaminate sterile solutions, but air itself does not create microbes. He filled several short-necked flasks with beef broth and then boiled their contents. Some were then left open and allowed to cool. In a few days, these flasks were found to be contaminated with microbes. The other flasks, sealed after boiling, were free of microorganisms. From these results, Pasteur reasoned that microbes in the air were the agents responsible for contaminating nonliving matter such as the broths in Needham’s flasks.⑧Pasteur next placed broth in open-ended long-necked flasks and bent the necks into S-shaped curves. The contents of these flasks were then boiled and cooled. The broth in the flasks did not decay and showed no signs of life, even after months. Pasteur’s unique design allowed air to pass into the flask, but the curved neck trapped any airborne microorganisms that might have contaminated the broth.⑨Pasteur showed that microorganisms can be present in nonliving matter—on solids, in liquids, and in the air. His work provided evidence that microorganisms cannot originate from mysterious forces present in nonliving materials. Rather, any appearance of “spontaneous”life in nonliving solutions can be attributed to microorganisms that were already present in the air or in the fluids themselves.译文关于无生源说的争论①直至19世纪下半叶,许多科学家和哲学家均认为,某些生命形式可以从无生命物质中自发产生; 他们把这个假设的过程称为无生源说。
6、What does the professor mainly discuss?A. The importance of zooplankton in the marine food chainB. The interdependence of two types of tiny marine organismsC. A physical feature of zooplankton that makes them well adapted for swimmingD. A phenomenon observed in some species of zooplankton答案:D就是说,微生物虽然没有像鸟类那样按照季节迁徙,但是它们会有纵向迁徙,晚上的时候,微生物会游到水面,而到白天的时候,又会游到更深的水域。
解析:本题为内容主旨题,题干问教授主要讨论的问题是什么? 讲座一开始给出了浮游生物的定义,并提到浮游生物每天会纵向迁徙,晚上的时候,微生物会游到水面,而到白天的时候,又会游到更深的水域,科学家正在尝试揭开这个谜团,并且后文都是关于科学家对这个现象提出的猜想,综合全文来看,本题选D。
A 选项的意思为: 浮游动物在海洋食物链里的重要性,只在开头提到了一下,不是主旨,故排除;B 选项的意思为: 两种微小的海洋微生物的相互联系,没提到联系,故排除;C 选项的意思为: 一种让浮游动物擅长游泳的身体特点,原文未提及,故排除;7、Why does the professor conclude that zooplankton must derive an important benefit from diel vertical migration?A. Diel vertical migration uses up a lot of energy.B. Diel vertical migration exposes zooplankton to predators.C. Diel vertical migration prevents zooplankton from being able to digest phytoplankton.D. Diel vertical migration forces zooplankton populations to live permanently in cold water.答案:A意思为:对于微生物来说,那是一个巨大的距离,但是浮游生物能够游得非常好,并且纵向迁移需要消耗很多的能量,所以对于浮游生物来说,每天的上下游动肯定能带来很多的好处。
DOI :10.14182/ki.1001-2443.2022.06.002具有收获和避难所效应的捕食—食饵系统Hopf 分支分析张道祥,李梦婷,闫晴,周文(安徽师范大学数学与统计学院,安徽芜湖241002)摘要:研究了具有收获和避难所效应的捕食-食饵系统的动力学。
首先研究了系统解的正性,有界性以及正平衡点的存在性。
其次,对系统正平衡点的局部稳定性和全局稳定性进行分析。
接着分别给出了ODE 系统以及PDE 系统产生Hopf 分支的条件。
最后通过一系列数值模拟来展示理论的正确性。
结果表明收获效应会提高食饵的密度,降低捕食者密度,避难所效应会提高食饵的密度且在一定范围内会提高捕食者密度。
关键词:捕食-食饵系统;收获;避难所;Hopf 分支中图分类号:O175.2;O193文献标志码:A文章编号:1001-2443(2022)06-0522-12引言多年来,捕食-食饵系统动力学一直是生态学和生物数学的重要研究问题。
在数学中,使用微分方程组来刻画捕食者与食饵之间的关系是一种主要的研究方法。
20世纪50年代,Leslie 首先提出了如下捕食-食饵模型[1-2]:ìíîïïïïdu dt =u (a -su )-muvdv dt =v (b -v γu )(1)其中u ,v 分别表示食饵和捕食者的密度,m 是捕食者的攻击率,a 是食饵的内禀增长率,b 是捕食者的内禀增长率,a s代表食饵的环境容纳量,1γu 代表捕食者依赖食饵的承载能力。
1960年,Leslie 和Gower 对系统(1)进行了改进,引入了功能反应函数[3]:ìíîïïïïdu dt =u (a -su )-p (u )vdv dt=v (b -v γu )(2)其中p (u )表示捕食者对食饵的功能反应函数。

地中海鲨鱼问题摘要自然界中存在捕食者与被捕食者系统。
这表示两个物种或多个物种之间的既相互制约又相互依存的自然法则。
本文首先建立了鲨鱼数量在战争前期和战争期间的增长比例模型。
考虑到外界因素不同,模型分为鲨鱼(捕食者)与食用鱼(食饵)在自然条件下战争前、战争期间的比较模型,还有鲨鱼(捕食者)、食用鱼(食饵)在人工捕获条件下战争前、战争期间比较模型。
采用解微分方程组的方法分别求出战争前、战争中两种条件下鲨鱼(捕食者)与食用鱼(鱼饵)的增长比例之间的关系。
由意大利著名生物学家(volterra)建立的系列数学模型。
食用鱼一多,鲨鱼容易得到食物,鲨鱼的数量就会增加。
而由于鲨鱼的数量增加,会吃掉大量的食用鱼,食用鱼的数量减少,鲨鱼缺少食物,鲨鱼的数量就会减少,而食用鱼天敌数量减少,食用鱼的数量就会增加,就这样,食用鱼鲨鱼的数量交替增减,无休止的循环,遂形成生态的动态平衡。
由于战争中人对食用鱼的捕获量减少,鲨鱼食物增多,战争中鲨鱼的比例比战争前要高。
关键词:捕获量百分比,Lotka-Volterra模型,非线性模型。
一、 问题重述意大利生物学家Ancona 曾致力于鱼类种群相互制约关系的研究,他从第一次世界大战期间,地中海各港口捕获的几种鱼类捕获量百分比的资料中,发现鲨鱼等的比例有明显增加(见下表)。
而供其捕食的食用鱼的百分比却明显下降.显然战争使捕鱼量下降,食用鱼增加,鲨鱼等也随之增加,但为何鲨鱼的比例大幅增加呢?他无法解释这个现象,于是求助于著名的意大利数学家V.Volterra ,希望建立一个食饵—捕食系统的数学模型定量地回答这个问题.二、 模型假设食饵由于捕食者的存在使增长率降低,假设降低的程度与捕食者数量成正比; 捕食者由于食饵为它提供食物的作用使其死亡率降低或使之增长,假定增长的程度与食饵数量成正比。
三、 符号说明1()x t —食饵在t 时刻的数量;2()x t —捕食者在t 时刻的数量;1γ—食饵独立生长的增长率;2γ—捕食者独立存在的死亡率;1λ—捕食者掠取食饵的能力;2λ—食饵对捕食者的供养能力;e —捕获能力系数;四、 问题分析战争给人们的生活带来了很多不可磨灭的记忆,同时也会给我们的生活带来不便,战争的到来,征召了许多身强体壮的劳动力去打仗,没有业余的工夫去打鱼,这就造成了鱼类的大量繁殖和生长,同时,捕食者也因为有充足的食饵而得到繁殖和生长。

临沂市第十三届自然科学优秀学术成果奖评选结果公示
根据《临沂市自然科学优秀学术成果奖评审与管理办法》,中共临沂市委组织部,临沂市人力资源和社会保障局,临沂市财政局,临沂市科协组织开展了临沂市第十三届自然科学优秀学术成果奖评选。
评选范围是2012年1月至2014年3月期间在正式学术刊物上发表或在学术会议上交流的学术成果,考察论证或调研报告,科技建议和正式出版的学术专著等。
按照评选标准和优中选优并兼顾学科分布的原则,经推荐单位初评,领导小组办公室初审,临沂市第十三届自然科学优秀学术成果奖评审委员会评审,评出一等奖88篇,二等奖118篇,三等奖232篇。
现予以公示,详情请登录临沂市科协网站()查看。
如有异议,请于刊登之日起7日(8月5日—11日)内将意见反馈市自然科学优秀学术成果评选领导小组办公室(地址:临沂市科协,联系人:韩成峰,联系电话:8727781,邮政编码:276001)。
临沂市自然科学优秀学术成果奖
评选领导小组办公室
2014年8月5日
临沂市第十三届自然科学优秀学术成果奖
一等奖(88项)
二等奖(118项)
Bis[2--pyridyl)–4,4,5,5-tetramethylimidazoline-1-oxyl-3-oxide- 2O,N]tris(nitrato-
三等奖(232项)
21。
病害生态学中的数学建模病害生态学是一门研究生物体(包括植物、动物和微生物)与病原体之间相互作用的学科。
数学建模作为一种重要的方法,可以帮助我们深入理解病害的传播机制、病害对生态系统的影响以及疾病的防控策略。
本文将重点探讨病害生态学中的数学建模方法和应用。
一、传染病的传播模型在病害生态学中,我们通常使用传染病的传播模型来描述疾病的传播过程。
最简单的传播模型就是SIR模型,其中"S"代表易感者(Susceptible)、"I"代表感染者(Infectious)、"R"代表康复者(Recovered)。
通过建立微分方程组,我们可以描述这三类个体的数量随时间的变化关系。
以植物病害为例,我们可以考虑病原体在土壤中的存活与传播、植物感染的过程以及植物的恢复和死亡。
通过引入合适的参数,我们可以模拟疾病在不同环境条件下的传播速度和程度,从而为病害的预防和控制提供科学依据。
二、害虫的种群动态模型害虫是农业生产中常见的病害生物,其种群数量的波动对农作物的产量和质量有着重要影响。
为了更好地了解害虫种群的动态变化,我们可以借助数学建模方法。
Lotka-Volterra方程是描述害虫种群与其捕食者之间相互作用的经典模型。
这个模型考虑了捕食者对害虫种群数量的影响以及害虫自然增长的情况,通过求解微分方程组,我们可以得到害虫和捕食者的数量随时间变化的轨迹。
此外,我们还可以考虑其他因素对害虫种群数量的影响,比如环境因素、食物供应等。
通过引入适当的修正项,可以提高模型的准确性,并为害虫的预测、监控和防治提供科学依据。
三、生态系统中的种间关系模型病害生态学研究的一个核心问题是不同生物体之间的相互作用关系。
数学建模可以帮助我们揭示不同物种之间的竞争、捕食和共生关系,从而进一步理解生态系统中的稳定性和动态变化。
以食物链模型为例,我们可以用一个复杂的微分方程组来描述不同物种之间的能量流动和数量变化。
第39卷第5期2019年3月生态学报ACTAECOLOGICASINICAVol.39,No.5Mar.,2019基金项目:国家自然科学基金(41561013);国家林业局委托项目(211⁃62210)收稿日期:2018⁃02⁃04;㊀㊀网络出版日期:2018⁃12⁃21∗通讯作者Correspondingauthor.E⁃mail:Nurbaye@sina.comDOI:10.5846/stxb201802040299塞依丁㊃海米提,努尔巴依㊃阿布都沙力克,许仲林,阿尔曼㊃解思斯,邵华,维尼拉㊃伊利哈尔.气候变化情景下外来入侵植物刺苍耳在新疆的潜在分布格局模拟.生态学报,2019,39(5):1551⁃1559.SAYITHamit,NURBAYAbdushalih,XuZL,ARMANJiesisi,ShaoH,VINIRAYilihar.SimulationofpotentialdistributionpatternsoftheinvasiveplantspeciesXanthiumspinosumL.(Bathurstburr)inXinjiangunderclimatechange.ActaEcologicaSinica,2019,39(5):1551⁃1559.气候变化情景下外来入侵植物刺苍耳在新疆的潜在分布格局模拟塞依丁㊃海米提1,2,努尔巴依㊃阿布都沙力克1,2,∗,许仲林1,2,阿尔曼㊃解思斯1,2,邵㊀华3,维尼拉㊃伊利哈尔41新疆大学资源与环境科学学院,乌鲁木齐㊀8300462绿洲生态教育部重点实验室,乌鲁木齐㊀8300463中国科学院新疆生态与地理研究所,乌鲁木齐㊀8300114新疆大学生命科学与技术学院,乌鲁木齐㊀830046摘要:明确区域尺度上外来入侵种的潜在分布格局及其对气候变化的响应对入侵种的预防和控制具有重要意义㊂以外来入侵植物刺苍耳(XanthiumspinosumL.)为研究对象,以其扩散蔓延的新疆地区为研究区域,结合中国国家气候中心开发的BCC CSM1 1模式下的将来气候条件,应用MaxEnt模型和ArcGIS空间分析技术构建了未来不同气候变化情景(RCP4.5,8.5)下2050s和2070s的刺苍耳适宜生境预测模型,定量的展示了气候变化情景下刺苍耳在新疆的扩散趋势及其适宜生境的面积空间变化和分布区中心移动轨迹㊂结果表明:年降雨量㊁下层土壤有机碳含量㊁上层土壤pH值㊁年温度变化范围㊁降雨量的季节性变化和年平均温度是影响刺苍耳地理分布的主导环境因子;博州㊁塔城㊁阿勒泰西北部㊁哈密中部㊁巴州北部㊁克州中部㊁阿克苏北部㊁奎屯市㊁克拉玛依市㊁五家渠市㊁喀什市等地为高危入侵风险区;两种气候模式下刺苍耳的各级适生区面积和总适生面积均呈持续增加的变化趋势,且在RCP8.5情景(最高温室气体排放情景)下响应更为敏感;总体上看,刺苍耳在新疆的分布未达到饱和,呈现以塔城中部为中心,向天山北麓和塔克拉玛干北缘方向辐射状扩散,且两种气候变化情景下至2070s分布区中心均向伊犁州奎屯方向移动㊂关键词:气候变化;外来植物入侵;刺苍耳;扩散SimulationofpotentialdistributionpatternsoftheinvasiveplantspeciesXanthiumspinosumL.(Bathurstburr)inXinjiangunderclimatechangeSAYITHamit1,2,NURBAYAbdushalih1,2,∗,XUZhonglin1,2,ARMANJiesisi1,2,SHAOHua3,VINIRAYilihar41CollegeofResourcesandEnvironmentalSciences,XinjiangUniversity,Urumqi830046,China2KeyLaboratoryofOasisEcology,XinjiangUniversity,Urumqi830046,China3XinjiangInstituteofEcologyandGeography,ChineseAcademyofSciences,Urumqi830011,China4CollegeofLifeSciencesandTechnology,XinjiangUniversity,Urumqi830046,ChinaAbstract:Understandingthepotentialdistributionpatternsandresponsestoclimatechangeofinvasiveplantspeciesonaregionalscaleisofgreatsignificanceforthepreventionandcontrolofinvasivespecies.Inthepresentstudy,theinvasiveplantspeciesXanthiumspinosumL.(Bathurstburr)wasstudiedintheXinjiangregion,wherethespeciesiswidelydistributed.XinjiangwasselectedasthestudyregionforconstructingaBCC CSM1 1modeldevelopedbytheChina2551㊀生㊀态㊀学㊀报㊀㊀㊀39卷㊀NationalClimateCentertosimulatefutureclimateconditions.AMaxEntmodelandtheArcGISspatialanalysttoolwereusedtoconstructpredictivemodelsofsuitablehabitatsforX.spinosuminthe2050sand2070sundertwofutureclimatechangescenarios(RCP4.5and8.5).TheultimateaimwastoquantitativelydemonstratethedispersaltrendsofX.spinosuminXinjiang,variationsintheareaofsuitablehabitat,andthemovementpathofthecenterofdistribution.Theresultsindicatedthatannualprecipitation,subsoilorganiccarboncontent,topsoilpH,annualtemperaturerange,seasonalvariationsinannualprecipitation,andannualaveragetemperaturearedominantenvironmentalfactorsthataffectthegeographicaldistributionofX.spinosum.Bortala,Tacheng,NorthwestAltay,CentralHami,NorthernBayingol,CentralKizilsu,NorthernAksu,KuytunCity,KaramayCity,WujiaquCity,andKashgarCitywereidentifiedasareaswithhighinvasionrisk.TrendsofacontinuousincreaseintheareaofsuitablehabitatattherespectivelevelsandinthetotalareaofsuitablehabitatforX.spinosumwerepredictedforbothclimatescenarios,withtheresponsesbeingmoresensitiveintheRCP8.5scenario(highemissions).Ingeneral,thedistributionofX.spinosuminXinjianghasnotreachedsaturation,withthespeciesbeingradiallydispersedtowardsthenorthpiedmontofTianshanMountainsandthenorthernmarginoftheTaklamakanDesertfromthecenterofdistributionincentralTacheng.ThecenterofdistributionispredictedtomovetowardsKuituninIliPrefectureby2070underbothclimatechangescenarios.KeyWords:climatechange;alieninvasiveplant;XanthiumspinosumL.;expansion气候变化作为全球变化的一个重要方面,主要表现在温度的上升㊁降水格局的改变以及极端气候事件的增加[1⁃2]㊂在区域尺度上,气候因素会对物种的生长繁殖㊁物候㊁地理分布范围等产生诸多影响[3⁃5]㊂随着全球温室气体排放量的指数型增长,我国未来气候变暖趋势将进一步加剧,全国大部分地区的降水量会有所增加,但是西部地区降水量将会减少[6]㊂新疆属于典型的干旱半干旱地区,生态系统极为脆弱,容易遭受外来生物的入侵,面临着极大的入侵风险㊂在全球气候变化的大背景下外来入侵植物的适宜生境有可能扩大,也有可能因为气候条件超过了入侵植物的适宜范围而缩小㊂如Bourdot等[7]的模拟研究结果表明,入侵植物Nassellaneesiana在未来气候情景下的适宜生境有不同程度的减小㊂刘金雪[8]的研究结果表明,入侵植物互花米草的适宜生境在RCP4.5情景(中等温室气体排放情景)下呈扩大趋势,在RCP8.5情景(最高温室气体排放情景)下呈减小趋势㊂Roger等[9]的评估结果表明入侵植物的适宜生境在未来气候情景下的变化并无一致的规律㊂因此,制定长期有效的预防措施需要考虑外来入侵种在未来气候变化情景下的分布[10]㊂刺苍耳(XanthiumspinosumL.)是菊科苍耳属一年生草本植物,是一种入侵性极强的恶性杂草,已经在全球范围内广泛的扩散蔓延[11]㊂中国境内的刺苍耳首先在河南邯郸县发现,现已扩散至河南㊁安徽㊁辽宁㊁北京㊁内蒙古㊁宁夏㊁新疆等多个省市区,其在新疆主要分布在伊犁地区㊁昌吉市㊁石河子市㊁乌鲁木齐市等地[12⁃13]㊂刺苍耳的竞争能力和适应能力很强[14],很容易在新的环境中占据领地,与原有植物和农作物竞争光照㊁矿质营养㊁水分㊁空间等生存资源,严重影响了当地植物群落的结构和组成㊂致使入侵地的草场退化㊁农作物减产㊁原有物种灭绝和物种多样性降低[15]㊂因此,研究气候变化对外来入侵植物刺苍耳潜在分布范围及空间格局的影响对保护新疆的生物多样性有重要的意义㊂鉴于刺苍耳在新疆的分布现状㊁扩散趋势和潜在危害㊂本研究结合中国国家气候中心开发的BCC CSM1 1模式下的将来气候条件,应用MaxEnt模型和ArcGIS空间分析技术分别构建了未来不同气候变化情景下刺苍耳适宜生境预测模型,分析比较了刺苍耳适宜生境的面积空间变化及分布区中心移动轨迹,明确了影响其潜在地理分布的主导环境变量,旨在揭示全球气候变化背景下刺苍耳在新疆的扩散趋势,目的在于预防和控制外来入侵植物刺苍耳在新疆的进一步扩散蔓延,减小气候变化对新疆生物多样性的不利影响,给入侵预防和控制提供相应的决策支持㊂1㊀数据与方法1.1㊀物种分布数据来源㊀㊀刺苍耳在新疆的地理分布数据来源于国家林业局委托项目第二次全国植物资源普查新疆片区的调查工作㊂划定刺苍耳的花果期7 10月为野外考察期[16],于2015 2017年在新疆境内进行野外实地采样,调查点主要有伊宁市㊁伊宁县㊁巩留县㊁特克斯县㊁新源县㊁察布查尔县㊁霍城县㊁尼勒克县㊁博乐市㊁昌吉市㊁石河子市㊁乌鲁木齐市㊁塔城地区和阿勒泰地区,发现刺苍耳即记为 存在点(presence) ,用GPS记录经纬度和海拔,共获得92条不重复的的地理分布数据(图1)㊂图1㊀刺苍耳在新疆的地理分布Fig.1㊀DistributionofXanthiumspinosumL.inXinjiang1.2㊀环境变量的选择本文共选取生物气候因子㊁地形因子㊁土壤因子等31个环境变量㊂其中,现代(1960 1990年的均值)和未来气候情景2050s(2041 2060年的均值)和2070s(2061 2080年的均值)的19个生物气候变量均来源于Worldclim数据集(http://www.worldclim.org/)[17],该数据集分辨率为1km,由19个降水量㊁温度的极值和变化范围的变量构成,根据新疆政区图对下载的全球气候数据进行影像配准㊁裁剪和叠加㊂海拔高程数据(DEM)从美国国家航空航天局发布的全球数字高程模型(SRTMv4.1,http://datamirror.csdb.cn/)下载,空间分辨率为100m[18]㊂坡向和坡度利用ArcToolbox工具箱的表面分析工具根据DEM生成㊂土壤数据来源于南京土壤所制作的二调数据,选取了数据集中的9个土壤变量,其中以T_开头的字段表示上层土壤属性(0 30cm),以S_开头的字段表示下层土壤属性(30 100cm)㊂2050s和2070s两个未来时间段的生物气候变量来源于政府间气候变化专门委员会(IntergovernmentalPanelonClimateChange,IPCC)第5次气候评估报告发布的缩减全球气候模型数据㊂结合研究区域的地理位置,采用由中国国家气候中心基于缩减全球气候模型数据开发的BCC CSM1 1模式下的2种不同气候变化情景(RCP4.5㊁RCP8.5)数据[19]㊂RCPs(RepresentativeConcentrationPathways)情景对温度和降水等各变量的模拟和预测具有较高的准确性,且更加详细的考虑了温室气体排放量受人类应对全球气候变化所采取的各种方针策略的影响[6]㊂本文选取的RCP4.5气候情景代表未来气候变化情景下的中等温室气体排放情景,在RCP4.5情景下至2100年温室气体浓度稳定为650ˑ10-6CO2当量㊂RCP8.5气候情景代表未来气候变化情景下的最高温室气体排放情景,在RCP8.5情景下至2100年温室气体浓度高于1370ˑ10-6CO2当量[8]㊂假设未来气候条件下土壤因子不发现变化㊂在建模过程中除了要考虑变量之间存在自相关和多重线性重复等问题外,还需要考虑模型的维度和复杂程度,这些因素均会对模型的转移能力产生影响㊂因此,本研究参考Worthington[20]㊁张天蛟[21]等的方法对环境变量进行了筛选,具体方法为在R语言中加载cor函数包,分别计算生物气候因子和土壤因子的spearman相关系数[22],并细致考虑变量的生态学意义,选用相关系数<0.75的环境因子,对于相关系数>0.75的环境因子进行单因子建模,运行刀割法测定其对模型预测的贡献率大小,以此剔除对物种分布贡献率较小的环境因子,最终筛选出17个环境变量参与建模(表1)㊂1.3㊀矢量图及模型来源本文所用的新疆政区矢量图,来源于新疆维吾尔自治区测绘地理信息局的标准地图下载服务区,地址为http://www.xjch.gov.cn/wsfw/bzdt/bzdtxz/㊂MaxEnt模型是由S.J.Philliips于2004年构建的用于预测物种分3551㊀5期㊀㊀㊀塞依丁㊃海米提㊀等:气候变化情景下外来入侵植物刺苍耳在新疆的潜在分布格局模拟㊀4551㊀生㊀态㊀学㊀报㊀㊀㊀39卷㊀布的技术方法[23],本研究所使用的MaxEnt软件为3.3.3k版[24]㊂ArcGIS空间技术平台是美国Esri公司研发的一套完整的GIS产品,本研究所使用的ArcGIS软件版本为10.2.2版[25⁃26]㊂表1㊀17个参与建模的环境变量及其贡献率Table1㊀17environmentalvariablesusedformodelingandtheircontributionrates变量名称Codeofvariables描述Namesofvariables贡献率PermutationimportancePercentcontribution/%重要性Bio1年平均温度Meanannualtemperature4.827Bio3等温线Isotherm0.72.8Bio7年温度变化范围Annualtemperaturerange9.10.8Bio12年降雨量Annualrainfall49.159.9Bio15降雨量的季节性变化Seasonalchangesinrainfall7.50.2T_texture土壤质地Soiltexture0.50.1S_cec_soil下层土土壤的阳离子交换能力CECofundersoil3.40T_cec_soil上层土土壤的阳离子交换能力CECoftopsoil0.20.5S_sand下层土沙含量Lowersoilsedimentcontent0.70.2T_sand上层土沙含量Uppersoilsedimentcontent0.10.1S_ph_h2o下层土pHpHofundersoil00T_ph_h2o上层土pHpHoftopsoil9.93.3S_oc下层土有机碳含量Organiccarboncontentofundersoil10.40.4T_oc上层土有机碳含量Organiccarboncontentoftopsoil2.12.2Alt海拔Altitude0.21.1Aspect坡向Aspect1.31Slope坡度Slope0.20.31.4㊀MaxEnt模型构建及数据处理将刺苍耳地理分布数据和17个环境变量导入MaxEnt,随机选取75%的刺苍耳分布点作为训练集,剩余25%的刺苍耳分布点作为测试集[27],运行刀割法测定各环境变量在影响刺苍耳生长适宜度中所占的权重,并创建各环境变量的单因子响应曲线,模型的其余参数均选择默认值㊂本研究用受试者操作特征曲线(ReceiverOperatingCharacteristicCurve,ROC曲线)下面积值,即AUC值(AreaUnderCurve,AUC)为判据评价模型的模拟结果[28]㊂不同的AUC值代表不同预测效果(表2)[29]㊂将模型输出的栅格图层导入ArcGIS,采用 10percentiletrainingpersencelogisticthreshold 进行重分类,并根据专家经验法将刺苍耳的适宜生境划分成4个等级:0 0.40为非适应区,0.40 0.60为低适生区,0.60 0.80为中适生区,0.80 1.00为高适生区[30]㊂再运用ArcGIS的SDM工具箱和统计工具Zonal计算4类分区的面积和面积空间变化,通过适宜区域几何面积化确定分布区中心移动轨迹,分析比较刺苍耳在不同气候变化情景下的潜在分布范围和格局㊂表2㊀AUC值取值范围及其与模型准确性的关系2㊀结果与分析2.1㊀MaxEnt模型预测结果检测及贡献率评估㊀㊀本研究的预测结果显示训练集的AUC值为0.986,测试集的AUC值为0.957(图2),表明MaxEnt模型的预测结果可靠,刺苍耳的实际分布范围与模型预测的地理分布范围具有较高的一致性,预测结果可用于刺苍耳的适宜生境区划[31]㊂在模型中运行刀割法(Jackknifetest),运行结果显示出各环境变量对刺苍耳适宜生境预测的相对贡献率(表1),Bio12年降雨量的贡献率最高(49.1%),是影响刺苍耳分布的决定因子;S_oc下层土有机碳含量的贡献率为10.4%,仅次于年降雨量,是影响刺苍耳分布的次要因子;其次,T_ph_h2o上层土pH(9.9%)㊁Bio7年温度变化范围(9.1%)㊁Bio15降雨量的季节性变化(7.5%)和Bio1年平均温度(4.8%)的贡献率也均超过了4%,以上6个因子的贡献率总和高达90.8%,是影响刺苍耳地理分布的主导环境因子㊂图2㊀刺苍耳潜在分布预测结果的ROC曲线验证Fig.2㊀ROCCurveandAUCvaluesoftheMaxEntmodel㊀ROC:受试者操作特征,ReceiverOperatingCharacteristic;AUC:曲线下面积值,AreaUnderCurve2.2㊀刺苍耳在现代及未来气候变化情景下的潜在分布预测由预测结果(图3)和统计分析可知(表3),刺苍耳在现代气候及未来气候情景下的适生区主要分布在天山以北,且随着气候变化的加剧,刺苍耳的适宜生境会扩散至天山以南的区域㊂总体上看,刺苍耳在新疆的分布未达到饱和且即将进入指数型的增长和扩散阶段㊂现代气候情景下刺苍耳在新疆的适宜生境主要包括伊犁中部和西北部㊁博州中部㊁塔城西北部㊁昌吉中部㊁石河子市中部和乌鲁木齐市北部,总适生面积为3.33ˑ104km2㊂RCP4.5情景(中等温室气体排放情景)下刺苍耳的适宜生境主要包括伊犁州全境㊁博州全境㊁塔城全境㊁奎屯市㊁克拉玛依市㊁石河子市㊁五家渠市㊁乌鲁木齐市㊁昌吉州中部和西部㊁阿勒泰西北部㊁哈密中部㊁巴州北部㊁阿克苏北部㊁克州中部和喀什市,2050s和2070s的总适生面积分别为12.85ˑ104km2和16.18ˑ104km2㊂RCP8.5情景(最高温室气体排放情景)下刺苍耳的适宜生境在RCP4.5气候情景下的适宜生境基础上进一步向四周扩张,且高适生区的扩增尤为显著,2050s和2070s的总适生面积分别为17.46ˑ104km2和21.50ˑ104km2㊂两种气候模式下各级适生区面积和总适生面积均呈持续增加的变化趋势,且在RCP8.5情景(最高温室气体排放情景)下响应更为敏感㊂表3㊀不同气候变化情景下刺苍耳在新疆的适生区面积/ˑ104km2Table3㊀SuitableareaofXanthiumspinosumL.inXinjiangunderchangingclimatescenarios气候变化情景Climatechangescenario高适生区面积Highlysuitablearea中适生区面积Suitablearea低适生区面积Lowsuitablearea非适应区面积Unsuitablearea总适生面积(比例)Totalsuitablearea(percentage)现代Current1.172.168.51151.583.33(2.04%)RCP4.5⁃2050s8.114.7415.37135.212.85(7.86%)RCP4.5⁃2070s10.096.0915.69131.5516.18(9.90%)RCP8.5⁃2050s11.046.4213.54132.4217.46(10.68%)RCP8.5⁃2070s15.166.3414.26127.6521.50(13.16%)2.3㊀气候变化情景下刺苍耳适宜生境的面积空间变化及分布区中心移动轨迹当前至RCP4.5中等温室气体排放情景下,至2050s刺苍耳在新疆的适宜生境增加16.38ˑ104km2(图4),5551㊀5期㊀㊀㊀塞依丁㊃海米提㊀等:气候变化情景下外来入侵植物刺苍耳在新疆的潜在分布格局模拟㊀图3㊀不同气候变化情景下刺苍耳在新疆的适生区分布Fig.3㊀SuitabledistributionforXanthiumspinosumL.inXinjiangunderchangingclimatescenarios增加面积是当前适生总面积的4.92倍,至2070s刺苍耳在新疆的适宜生境增加20.03ˑ104km2,增加面积是当前适生总面积的6.02倍㊂分布区中心由塔城中部(现代)经塔城南部(2050s)向伊犁州奎屯(2070s)方向移动(图5)㊂当前至RCP8.5最高温室气体排放情景下,至2050s刺苍耳在新疆的适宜生境增加19.16ˑ104km2,增加面积是当前适生总面积的5.75倍,至2070s刺苍耳在新疆的适宜生境增加23.92ˑ104km2,增加面积是当前适生总面积的7.18倍㊂分布区中心由塔城中部(现代)经克拉玛依市(2050s)向伊犁州奎屯(2070s)方向移动㊂说明在未来气候情景下,刺苍耳在新疆的适生分布区范围逐渐扩大,面积空间变化明显,呈现以塔城中部为中心,向天山北麓和塔克拉玛干北缘方向辐射状扩散,且两种气候变化情景下至2070s分布区中心均向伊犁州奎屯方向移动㊂3㊀讨论与结论制定长期有效的预防和控制措施需要考虑外来入侵种在未来气候变化情景下的分布,本研究结合中国国家气候中心开发的BCC CSM1 1模式下的将来气候条件,利用最大熵模型MaxEnt和ArcGIS空间分析技术对刺苍耳的适宜生境进行了全疆范围的模拟预测,ROC曲线测评结果可靠,预测结果与刺苍耳实际分布区域的相符度较高㊂原因在于本研究通过spearman相关系数对参与建模的环境因子进行了筛选,有效的降低了6551㊀生㊀态㊀学㊀报㊀㊀㊀39卷㊀图4㊀未来气候情景对比现代气候情景下刺苍耳适宜生境的变化Fig.4㊀ChangesofsuitablehabitatsofXanthiumspinosumL.underfutureclimatescenariosversusmodernclimatescenarios图5㊀不同气候情景下刺苍耳分布区中心与其移动轨迹变化㊀Fig.5㊀ChangesincenterofdistributionareaofXanthiumspinosumL.anditsmovingtrajectoryunderdifferentclimatechangescenarios模型的维度和复杂程度㊂当前气候情景下刺苍耳总适生面积比例为2.04%,在RCP4.5㊁RCP8.5两种情景下至2050s,预测的总适生面积比例为7.86%㊁10.68%,适宜生境的增加面积分别是当前适生总面积的4.92和5.75倍㊂至2070s,预测的总适生面积比例为9.90%㊁13.16%,适宜生境的增加面积分别是当前适生总面积的6.02和7.18倍㊂说明在未来气候变化情景下,刺苍耳在新疆的种群数量和分布范围可能较当前会有一个指数型的增长和扩张,爆发成灾的可能性很大,入侵预防和控制任务更为艰巨㊂除已知分布区外,气候变化情景下博州㊁塔城㊁阿勒泰西北部㊁哈密中部㊁巴州北部㊁克州中部㊁阿克苏北部㊁奎屯市㊁克拉玛依市㊁五家渠市㊁喀什市等地的刺苍耳生境适宜度较高,具有极高的入侵风险㊂总体上看,刺苍耳在新疆的分布未达到饱,呈现以塔城中部为中心,向天山北麓和塔克拉玛干北缘方向辐射状扩散㊂本文参考Yue等[32]的计算方法,确定刺苍耳在现代气候及未来气候情景下的适宜生境中心均位于北疆地区,原因可能有以下两点:(1)天山北麓属于温带大陆性干旱半干旱气候,全年降雨量为150 200mm,塔克拉玛干南缘属于暖温带大陆性干旱气候,全年降雨量为25 100mm[33],而年降雨量是影响刺苍耳分布的决定因子,从单因子响应曲线看,年降雨量的范围在13 607mm之间,且刺苍耳的生长适宜度随着年降雨量的增加而增大;(2)土壤因子在影响刺苍耳生长适宜度中所占的权重较高(27.1%),且下层土有机碳含7551㊀5期㊀㊀㊀塞依丁㊃海米提㊀等:气候变化情景下外来入侵植物刺苍耳在新疆的潜在分布格局模拟㊀8551㊀生㊀态㊀学㊀报㊀㊀㊀39卷㊀量是影响刺苍耳分布的次要因子,而朱敏等[34]的研究结果表明天山北麓的土壤养分状况要优于塔克拉玛干北缘,由此可见降水量和土壤养分的差异使刺苍耳在北疆获得了更为广阔的适宜生境㊂但随着气候变化的加剧,刺苍耳的适宜生境会扩张至塔克拉玛干北缘,这可能是因为南疆的冬季气候相对温暖,更利于刺苍耳种子的越冬,这与李杰等[35]得出的结论一致㊂而目前尚未在南疆地区出现刺苍耳的原因可能是天山山脉的阻隔作用,但随着气候变化的加剧,丝绸之路经济带战略的实施,南北疆交通道路的建设和口岸贸易的发展,天山山脉的阻隔作用会有很大程度的减弱,因此在预防措施中不能只考虑北疆部分,南疆也需重点考虑㊂在野外调查过程中发现,伊犁㊁博州等刺苍耳入侵区域的省道和县级公路的两侧已经基本被其占据,且同属菊科苍耳属的意大利苍耳(XanthiumitalicumMoretti),菊科假苍耳属的假苍耳(IvaxanthifoliaN.)等入侵物种也在北疆迅速的扩散蔓延,伊犁㊁昌吉等地还呈现刺苍耳和意大利苍耳交替分布的现象㊂此外,刺苍耳的果实具有刺,牛羊不食,很容易黏着在牛羊等牲畜的皮毛上,再由其携带进行远距离的传播扩散,牧民和地方管理部门对其危害程度的认识也不高,这些现象极大的威胁了入侵地的生物多样性和景观格局㊂全球入侵物种计划(GlobalInvasiveSpeciesProgram,GISP)的主席Waage提出:对外来物种入侵,预防比控制其暴发更为可行,也更为经济[36]㊂因此,鉴于刺苍耳的扩散趋势和野外调查的实际结果,作者提出以下几点防治措施:(1)检疫部门应该将工作概念由过去局限在农产品检验扩大到所有的植物产品,并加强对口岸动物皮毛的检疫;(2)应该针对刺苍耳的适生区建立两条隔离监测带,第一条建立在克拉玛依市,预警和控制刺苍耳继续向天山以北的方向扩散㊂第二条建立在巴州的和硕县和阿克苏的拜城县,预防刺苍耳扩散至天山以南的区域,并且对隔离监测带进行系统的监测和周期评估;(3)从全疆的层面建立入侵物种数据库,为林业部门㊁环保部门和行政部门提供准确全面的生物入侵信息;(4)加强在牧区和草场的宣传力度,出台相应的政策法规,让牧民和草场管理者能及时的发现刺苍耳并汇报上级部门㊂本研究定量的展示了气候变化情景下外来入侵种刺苍耳在新疆扩散趋势,为全球气候变化对干旱区半干旱区生物多样性的影响,尤其是对入侵种刺苍耳的影响研究,提供了科学依据㊂然而,本研究也存在着一定的局限性和不足之处,原因在于研究中仅考虑了生物气候㊁地形㊁土壤等环境因子,而未考虑植物的生命周期㊁遗传特性㊁繁殖能力㊁人类活动㊁光照㊁河流等其他因素㊂且预测是以当前的刺苍耳分布点为基础进行的,未考虑未来分布点的实际变化,不可避免的造成了一定的误差㊂因此,在今后的研究中需要进一步考虑环境变量的选取,并着重追溯刺苍耳的入侵历史,分阶段的验证刺苍耳分布点的实际变化㊂参考文献(References):[1]㊀EdwardsPN.AVastMachine:ComputerModels,ClimateData,andthePoliticsofGlobalWarming.Cambridge:TheMITPress,2010.[2]㊀李丽鹤.气候变化与人类活动对入侵植物潜在分布的影响及风险区识别 以云南省为例[D].南京:南京师范大学,2017.[3]㊀PoundsJA,BustamanteMR,ColomaLA,ConsuegraJA,FogdenMPL,FosterPN,LaMarcaE,MastersKL,Merino⁃ViteriA,PuschendorfR,RonSR,Sánchez⁃AzofeifaGA,StillCJ,YoungBE.Widespreadamphibianextinctionsfromepidemicdiseasedrivenbyglobalwarming.Nature,2006,439(7073):161⁃167.[4]㊀KozakKH,GrahamCH,WiensJJ.IntegratingGIS⁃basedenvironmentaldataintoevolutionarybiology.TrendsinEcology&Evolution,2008,23(3):141⁃148.[5]㊀王茹琳,李庆,何仕松,刘原.中华猕猴桃在中国潜在分布及其对气候变化响应的研究.中国生态农业学报,2018,26(1):27⁃37.[6]㊀唐继洪,程云霞,罗礼智,张蕾,江幸福.基于Maxent模型的不同气候变化情景下我国草地螟越冬区预测.生态学报,2017,37(14):4852⁃4863.[7]㊀BourdôtGW,LamoureauxSL,WattMS,ManningLK,KriticosDJ.ThepotentialglobaldistributionoftheinvasiveweedNassellaneesianaundercurrentandfutureclimates.BiologicalInvasions,2012,14(8):1545⁃1556.[8]㊀刘金雪.气候变化对外来入侵植物互花米草潜在分布区的影响[D].南京:南京师范大学,2016.[9]㊀RogerE,DuursmaDE,DowneyPO,GallagherRV,HughesL,SteelJ,JohnsonSB,LeishmanMR.Atooltoassesspotentialforalienplantestablishmentandexpansionunderclimatechange.JournalofEnvironmentalManagement,2015,159:121⁃127.[10]㊀张颖.基于GIS的生态位模型预测源自北美的菊科入侵物种的潜在适生区[D].南京:南京农业大学,2011.[11]㊀梁巧玲,刘忠权,陆平,陈卫民.刺苍耳在新疆伊犁河谷的分布及生长发育特性.杂草学报,2017,35(1):25⁃29.[12]㊀宋珍珍,谭敦炎,周桂玲.入侵植物刺苍耳在新疆的分布及其群落特征.西北植物学报,2012,32(7):1448⁃1453.[13]㊀杜珍珠,徐文斌,阎平,王少山,郭一敏.新疆苍耳属3种外来入侵新植物.新疆农业科学,2012,49(5):879⁃886.[14]㊀袁着耕,刘影,邵华,赵金雨,赵玉,胡云霞.不同生长期入侵植物刺苍耳的化感作用.生态科学,2017,36(6):107⁃113.[15]㊀宋珍珍,刘同业,谭敦炎,周桂玲.两种入侵植物对新疆当地物种多样性的影响.新疆农业科学,2012,49(11):2120⁃2126.[16]㊀周明冬,秦晓辉.有害入侵生物刺苍耳的危害与控制.新疆农业科技,2014,(3):47⁃48.[17]㊀张殷波,高晨虹,秦浩.山西翅果油树的适生区预测及其对气候变化的响应.应用生态学报,2018,29(4):1156⁃1162.[18]㊀刘艳,阿提古丽㊃毛拉,沙毕热木㊃斯热义力,买买提明㊃苏来曼.气候变化下耐旱藓类连轴藓属在新疆的分布模拟.西北植物学报,2017,37(9):1881⁃1887.[19]㊀应凌霄,刘晔,陈绍田,沈泽昊.气候变化情景下基于最大熵模型的中国西南地区清香木潜在分布格局模拟.生物多样性,2016,24(4):453⁃461.[20]㊀WorthingtonTA,ZhangTJ,LogueDR,MittelstetAR,BrewerSK.Landscapeandflowmetricsaffectingthedistributionofafederally⁃threatenedfish:improvingmanagement,modelfit,andmodeltransferability.EcologicalModelling,2016,342:1⁃18.[21]㊀张天蛟,刘刚.提高生态位模型时间转移能力的方法研究.中国农业大学学报,2017,22(2):98⁃105.[22]㊀YangXQ,KushwahaSPS,SaranS,XuJC,RoyPS.Maxentmodelingforpredictingthepotentialdistributionofmedicinalplant,JusticiaadhatodaL.inLesserHimalayanfoothills.EcologicalEngineering,2013,51:83⁃87.[23]㊀PhillipsSJ,DudíkM.ModelingofspeciesdistributionswithMaxent:newextensionsandacomprehensiveevaluation.Ecography,2008,31(2):161⁃175.[24]㊀PadaliaH,SrivastavaV,KushwahaSPS.Modelingpotentialinvasionrangeofalieninvasivespecies,Hyptissuaveolens(L.)Poit.inIndia:comparisonofMaxEntandGARP.EcologicalInformatics,2014,22:36⁃43.[25]㊀VinodPN,ChandramouliPN,KochM.EstimationofnitrateleachingingroundwaterinanagriculturallyusedareainthestateKarnataka,India,usingexistingModelandGIS.AquaticProcedia,2015,4:1047⁃1053.[26]㊀AndersonRP,RazaA.TheeffectoftheextentofthestudyregiononGISmodelsofspeciesgeographicdistributionsandestimatesofnicheevolution:preliminarytestswithmontanerodents(genusNephelomys)inVenezuela.JournalofBiogeography,2010,37(7):1378⁃1393.[27]㊀吴庆明,王磊,朱瑞萍,杨宇博,金洪阳,邹红菲.基于MAXENT模型的丹顶鹤营巢生境适宜性分析 以扎龙保护区为例.生态学报,2016,36(12):3758⁃3764.[28]㊀王茹琳,李庆,封传红,石朝鹏.基于MaxEnt的西藏飞蝗在中国的适生区预测.生态学报,2017,37(24):8556⁃8566.[29]㊀王亚领,李浩,杨旋,郭彦龙,李维德.基于MaxEnt模型和不同气候变化情景的单叶蔓荆潜在地理分布预测.草业学报,2017,26(7):1⁃10.[30]㊀李丽鹤,刘会玉,林振山,贾俊鹤,刘翔.基于MAXENT和ZONATION的加拿大一枝黄花入侵重点监控区确定.生态学报,2017,37(9):3124⁃3132.[31]㊀吴显坤,南程慧,汤庚国,李垚,毛丽君,张志成.气候变化对浙江楠潜在分布范围及空间格局的影响.南京林业大学学报:自然科学版,2016,40(6):85⁃91.[32]㊀YueTX,FanZM,ChenCF,SunXF,LiBL.Surfacemodellingofglobalterrestrialecosystemsunderthreeclimatechangescenarios.EcologicalModelling,2011,222(14):2342⁃2361.[33]㊀王文静,延军平,刘永林.新疆旱涝气候的南北差异性分析.干旱区研究,2016,33(3):609⁃618.[34]㊀朱敏,梁智,徐万里,周勃,丁峰.新疆绿洲棉田土壤养分时空分布特点.新疆农业科学,2009,46(5):1076⁃1081.[35]㊀李杰,马淼.新疆外来入侵植物意大利苍耳和刺苍耳种子的越冬性能.生态学报,2017,37(21):7181⁃7186.[36]㊀WaageJK,ReaserJK.Aglobalstrategytodefeatinvasivespecies.Science,2001,292(5521):1486.9551㊀5期㊀㊀㊀塞依丁㊃海米提㊀等:气候变化情景下外来入侵植物刺苍耳在新疆的潜在分布格局模拟㊀。
arXiv:q-bio/0611024v1 [q-bio.PE] 7 Nov 2006SpontaneousEmergenceofSpatialPatternsina
Predator-PreyModel
M.V.Carneiro∗andI.C.Charret†DepartamentodeCiˆenciasExatasUniversidadeFederaldeLavrasP.O.Box3707,ZipCode37200-000,Lavras-MG,Brazil.
February9,2008
AbstractWepresentstudiesforanindividualbasedmodelofthreeinteractingpopulationswhoseindividualsaremobileina2D-lattice.Wefocusonthepatternformationinthespatialdistributionsofthepopulations.Alsorelevantistherelationshipbetweenpatternformationandfeaturesofthepopulations’timeseries.Ourmodeldisplaystravellingwavessolutions,clusteringanduniformdistributions,allrelatedtotheparametersvalues.Wealsoobservedthattheregenerationrate,theparameterassociatedtotheprimaryleveloftrophicchain,theplants,regulatedthepresenceofpredators,aswellasthetypeofspatialconfiguration.Keywords:computationalmodelling,predator-preysystem,cellularautomata,travel-lingwaves.
1IntroductionMathematicalmodellingofpopulationdynamicsiswidelyrecognizedasausefultoolintheinvestigationofmanyinterestingfeaturesfoundintheorganizationofindividualsinnature[1].Inordertostudythedistributionofindividualsintheirhabitat,itisessentialtotakeintoaccountfactorssuchasindividual’smobilityandhuntingandescapingskills.Whenpopulationsareapproximatelytreatedascontinuousfunctionsofspaceandtime,individual’smotionappearintheequationsthatgovernspopulationsdistributionsasdiffusionterms.Diffusionisaverycommonnaturalphenomenainmanyareasofscience[2].Thus,muchcanbelearned,byanalogy,aboutthedistributionofindividualsintheirhabitatsfromotherdiffusivephenomena.Forinstance,ifinteractingpopulationsaredescribedbysetsofreaction-diffusionequations,itispossibletoinferthatindividualsmaybedistributedheterogeneouslyeveninhomogeneoushabitats.Otherpossiblephenomenaaretravellingwavesandchaos[3].Predator-preymodelscanhavetheirstabilitypropertieschangedbydiffusiveterms.ItisbeenstatedbyWilsonandDeRoos[4]thatspatialpredator-preysystemsareconsiderablymorestablethanaspatialones.Originally,populationdynamicsmodelsusedtobeformulatedintermsofdifferentialequations[1].Thisallowedthevastsetofanalyticalmethodsdevelopedtotreatproblemsinmanyotherareasofscienceandengineeringtobeappliedtoecology.Withtheadventofcheapcomputingpower,itbecamepossibletobuildmoresophisticatedmodelsthatdonottranslateeasilyintodifferentialequationsorwouldresultinequationstoodifficulttosolve.SomestrategiesofanalysingandsimulatingthesemodelsincludesIndividualBasedModels(IBM)usingcellularautomata[5];IndividualBasedModels[4]withoutcellularautomata;applyingmeanfieldsapproximation[6].Finiteelementmethodsandpertubativemethods[7]areotheralternativeapproachestounderstandthesesystems.OurchoiceinthisworkistouseIndividualBasedModels(IBM)withcellularautomata.Itconsistsonapplyingsimplerulesinspiredinnaturaleventsofrealsystemonadiscretegroupofindividualslyingoveradiscretefinitelattice.Theserulesareorganizedasasetofeventsanddetermineshowindividualswillbehaveineacheventsuchasreproductionandhuntingevents.Weareinterestedtoinvestigatetheglobalresponseofthesystem.ThemainadvantageofIBMisthepossibilityofaccountingformanyadditionalfeaturesobservedonrealsystemswithoutincreasingthecomputationalcostexponentially,suchastimedelayedeffects,history-dependentmodels[8]andattributingtoeachindividualaparticularinformation,likegeneticsandage[9,10].Ourworkfocusmainlyonthespatialpatternsthatemergeinanopenthree-trophicfoodchainandtheirrelationshiptothepopulationtimeseries.Keittetal.[11]discussedemergentpatternsindiffusion-limitedpredator-preyinteractionintroducingspatialheterogeneityinthemodel.Weobservedspatialpatternswithoutthismechanism.Ourmodelpresentsselforga-nizationderivedmainlyfromthedynamicstothesystem.WeproposeanIBMconsistingofafixedplantpopulation,aherbivorepopulation,whichfeedsfromtheplantpopulationandisabletodiffusethroughthesystem,andapredatorpopulationwhichfeedsonherbivoresinordertoreproduceandisabletodiffusethroughthesystemaswell.Thispaperisorganizedasfollows.Inthenextsection,wepresentadescriptionofthemodelforathreetrophicpredator-preysystemthatinspiredthiswork.Thesimulationmethodispresentedandthedetailsofimplementationofthecellularautomatarulesaredescribed.Insection3,itispresentedresultsanddiscussionaboutthemainpointsofthepaperandinsection4wepresentedourconclusionsandfutureperspectives.
2TheModelBasedonthesimplestactionsofindividualsonnature,weproposedthefollowingrulesforthecellularautomata:
•Movement:Predatorsandherbivorescanhavedifferentprobabilitiestomovetoaneigh-bouringsite.Inthesimulation,eachindividualreceivearandomnumbertodecideitsnextlocationonthetimet+1.Therearefivepossibilitiesrelatedtothediffusiveratesd1