AlN Precipitation in Dual-phase 3% Si Electrical Steels
- 格式:pdf
- 大小:993.95 KB
- 文档页数:8
ASTM A213/A213M-07锅炉、过热器和换热器用无缝铁素体和奥氏体合金钢管标准规范本标准以固定的标准号A213/A213M出版;紧随标准号之后的号码表示原来采用的年代号或最新修订标准的年代号(在标准修订版情况下)。
带括号的数字表示最新认可的年代号。
上标的希腊字母表示上次修订或上次重新认可以来的编辑变更。
本标准经过国防部代理机构批准使用。
1、范围1.1本标准适用于无缝铁素体和奥氏体锅炉钢管、过热器钢管和热交换器管,标准牌号T5、TP304等,这些钢列于表1、表2 中。
1.2含字母H级别的钢与同类别不含字母H的钢要求不同,含字母H级别的钢提供更高的蠕变—断裂强度。
1.3通常按本标准提供的管子尺寸和壁厚为:内径1/8in(3.2mm)到外径5in(127mm);壁厚0.015~0.500in(0.4~12.7mm),包括最小壁厚或在定单上规定的平均壁厚。
也可提供其它尺寸的管子,但要保证这些管子符合本标准的所有其它要求。
1.4 以英寸—磅或国际制(SI)单位表示的数值都应视为标准值。
本文中SI单位表示的数列于括号之内。
由于两种单位制的数值并不完全相等,因此必须单独分别采用每一种单位制。
因两种单位制的混合使用,可能导致与本标准不一致。
如果不是在定货中规定使用本标准中的“M”标志,则应采用英寸—磅单位制。
2、引用标准2.1 ASTM标准A262 奥氏体不锈钢晶间腐蚀敏感性检测规程A941 与钢、不锈钢、合金及铁合金有关的术语A1016/A1016M 铁素体合金钢、奥氏体合金钢及不锈钢管的一般要求E112平均晶粒度测定方法3、术语3.1 定义标准中所使用的术语的定义见A941。
4、订货需知4.1关于本标准产品的所有要求应由用户负责,这些要求包括以下内容(但不受以下内容的限制):4.1.1 数量(英尺、米或根数)。
4.1.2材料名称(无缝管)4.1.3级别或牌号(表1和表2 )4.1.4 加工状况(热精整或冷精整)4.1.5控制的金相组织特征(见6.3条)4.1.6 尺寸(外径和最小壁厚、规定的平均壁厚)4.1.7长度(定尺或不定尺)4.1.8 水压试验或非破坏性电测试验(见10.1条)4.1.9 标准号和出版年代。
Allegheny LudlumAL 2003TM双相不锈钢(UNS S32003)简介AL2003TM(UNS S32003)合金是一种含高N,目前仍处于专利保护期的双相不锈钢。
控制Cr、Ni、Mo、N含量并获得与AL2205合金类似的相平衡,同时降低了产品成本。
该合金填补了317型不锈钢与2205双相不锈钢耐蚀性之间的空白,同时又具有双相不锈钢较高力学性能的特点。
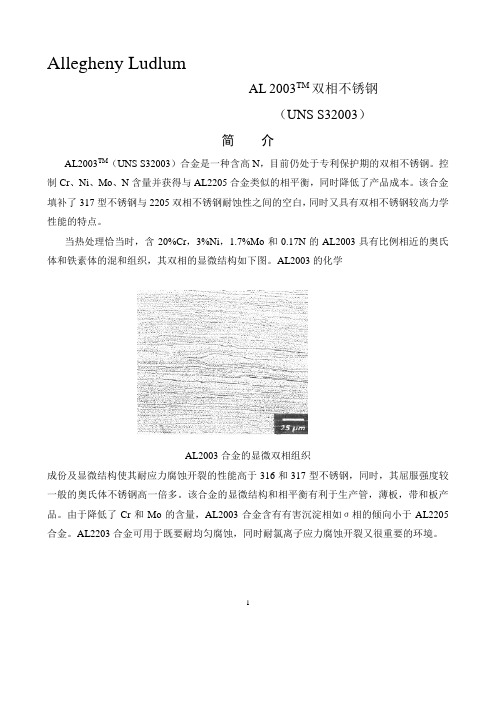
当热处理恰当时,含20%Cr,3%Ni,1.7%Mo和0.17N的AL2003具有比例相近的奥氏体和铁素体的混和组织,其双相的显微结构如下图。
AL2003的化学AL2003合金的显微双相组织成份及显微结构使其耐应力腐蚀开裂的性能高于316和317型不锈钢,同时,其屈服强度较一般的奥氏体不锈钢高一倍多。
该合金的显微结构和相平衡有利于生产管,薄板,带和板产品。
由于降低了Cr和Mo的含量,AL2003合金含有有害沉淀相如σ相的倾向小于AL2205合金。
AL2203合金可用于既要耐均匀腐蚀,同时耐氯离子应力腐蚀开裂又很重要的环境。
1表1 ASTM技术文件规定的化学成份表2 物理性能ASTM技术文件所涉及的ASTM技术文件如下:A240(板,薄板和带),A480,A789,A790(焊管)。
其他的产品形式应包括在ASME锅炉和压力容器规范中。
耐蚀性能耐氯离子应力腐蚀开裂性能无镍的铁素体不锈钢对氯化物的应力腐蚀开裂是免疫的,而另一方面,含镍的奥氏体不锈钢如304,316对应力腐蚀开裂高度敏感。
双相不锈钢具有奥氏体相和铁素体相的特点,AL2003合金的铁素体相提供了耐氯化物应力腐蚀开裂能力,使其耐氯化物应力腐蚀性能高于300系列奥氏体不锈钢。
表3显示了各种不锈钢抗应力开裂能力。
2表3耐点腐蚀和缝隙腐蚀性能根据ASTM标准G150可以对合金耐点腐蚀和缝隙腐蚀能力进行排序。
逐步提高试验温度,直到观察到点腐蚀,首次观察到点腐蚀的温度称为临界点蚀温度(CPT)。

双相不锈钢的国内外应用双相不锈钢已实用化多年,尤其是当代超低碳含氮双相不锈钢克服了焊接方面的一些问题,结合双相不锈钢所具有的耐局部腐蚀和综合力学性能好的一些优点,为焊接结构材料的大量推广应用创造了条件,近年市场销售量增加很快,加之随着超级双相不锈钢的步入市场,扩大了在一些苛刻介质中的应用,使双相不锈钢的应用范围不断拓宽,也积累了不少实际使用经验,为双相不锈钢的选用和新钢种的开发进一步创造了条件。
双相不锈钢既有一般不锈钢的共性,也有他本身的特性规律,因此,在双相不锈钢的合理选用方面,除了必须遵循一般不锈钢的选用需要考虑的各种因素外,还需要考虑双相不锈钢的特性规律。
本讲座将就双相不锈钢安全使用的几点限制和特殊要求以及在主要领域中的国内外应用作一介绍,其中涉及一些在使用中的失效事例分析,以求有助于双相不锈钢的正确选用。
1. 双相不锈钢安全使用的几点限制和要求①需要对相比例进行控制,最合适的比例是铁素体相和奥氏体相约各占一半,其中某一相的数量最多不能超过65%,这样才能保证有最佳的综合性能。
如果两相比例失调,例如铁素体相数量过多,很容易在焊接HAZ形成单相铁素体,在某些介质中对应力腐蚀破裂敏感。
②需要掌握双相不锈钢的组织转变规律,熟悉每一个钢种的TTT和CCT转变曲线,这是正确指导制定双相不锈钢热处理,热成型等工艺的关键,双相不锈钢脆性相的析出要比奥氏体不锈钢敏感的多。
③双相不锈钢的连续使用温度范围为-50~250℃,下限取决于钢的脆性转变温度,上限受到475℃脆性的限制,上限温度不能超过300℃。
④双相不锈钢固溶处理后需要快冷,缓慢冷却会引起脆性相的析出,从而导致钢的韧性,特别是耐局部腐蚀性能的下降。
⑤高铬钼双相不锈钢的热加工与热成型的下限温度不能低于950℃,超级双相不锈钢不能低于980℃低铬钼双相不锈钢不能低于900℃,避免因脆性相的析出在加工过程造成表面裂纹。
⑥不能使用奥氏体不锈钢常用的650-800℃的消除应力处理,一般采用固溶退火处理。

TableI.Product Analyses of the Experimental Steels (Weight Percent)Steel C Mn P S S Ni Cr TiN090.19 1.200.0190.0140.230.010Ͻ0.01TiN130.18 1.170.0140.0160.240.0160.020TiN180.19 1.160.0140.0150.250.0170.019TiN230.18 1.180.0150.0170.24Ͻ0.010.018TiN250.17 1.200.0160.0160.250.0140.018TiN320.18 1.190.0160.0160.240.0170.019TiN370.19 1.190.0160.0160.250.0160.018TiN460.18 1.200.0160.0170.240.0180.020TiN36-LN 0.18 1.170.0160.0150.250.0200.019TiN52-LN0.171.160.0160.0160.250.0200.019Steel Cu Al B Ti N Ti/N Ratio Ti ex *N ex **TiN090.0160.0520.00150.0100.01070.93—0.0078TiN130.0190.0470.00210.0090.0070 1.29—0.0044TiN180.0220.0490.00230.0160.0088 1.82—0.0041TiN230.0190.0510.00210.0160.0069 2.32—0.0022TiN250.0210.0530.00210.0200.0080 2.50—0.0022TiN320.0220.0560.00220.0250.0078 3.21—0.0005TiN370.0210.0510.00230.0320.0086 3.720.0026—TiN460.0230.0510.00220.0390.0085 4.590.0099—TiN36-LN 0.0180.0470.00180.0210.0058 3.620.0012—TiN52-LN0.0410.0460.00160.0300.00585.170.0102—*Ti ex ϭtotal Ti Ϫ3.42N.**N ex ϭtotal N ϪTi/3.42.Fig.1—Jominy curves for the experimental C-Mn-B steels.The specimens were austenitized at 927ЊC for 30min (at temperature)prior to end quenching.sodium tridecylbenzene sulfonate)was used for etching.The austenite grain size was measured near the quenched end using the three-concentric-circle intercept counting pro-cedure described in ASTM E112-88,‘‘Standard Methods for Determining Average Grain Size .’’[10]Subsequently,additional billet samples were reheated at 1260ЊC and rolled to produce 12.7-mm-thick plates for further evaluation.All as-rolled plates were austenitized at 927ЊC for 30minutes and quenched in water.The as-quenched hardness was measured through the thickness for each plate,and the tempering behavior (hardness at the plate midthickness location)was evaluated over the tem-perature range of 482ЊC to 704ЊC.For mechanical prop-erty evaluation,all the as-quenched plates were tempered at 593ЊC for 30minutes and air cooled.The austenite grain size of these as-tempered plates was measured using the procedure described previously.Transverse tensile proper-ties were evaluated using standard ASTM 9-mm-diameter specimens (tested in duplicate).Charpy V-notch (CVN)transition curves were developed (including triplicate test-ing at Ϫ40ЊC)using transverse full-size Charpy specimens.The fracture surfaces of selected broken Charpy specimens were investigated using an Amray 1600scanning electron microscope (SEM).The volume fraction of coarse TiN par-ticles was measured on as-polished specimens following the procedure specified in JIS G 0555(1977),‘‘Microscopic Testing Method for Non-Metallic Inclusions in Steel ’’,[11]with a 400-point grid and a magnification of 400times in 65fields.In the present study,‘‘coarse’’TiN particles were taken to have edge dimensions ≥1m,the minimum size resolvable in an optical microscope.In addition to the vol-ume fraction determination,the total number of coarse TiN particles observed in these 65fields was recorded,and theaverage edge length of TiN particles was measured at a magnification of 1000times.Analytical electron microscopy of extraction replicas was conducted to analyze fine precipitates (2to 100nm in di-ameter).The replication procedure started with metallo-graphically polishing the specimens and pre-etching in a 2Table II.Results of Jominy Testing,Austenitizing Condition:927ЊC for30MinutesSteel Ti/NRatioJ50pct M*(mm)DI measured(mm)DI calc,excluding B(GS7)(mm)DI calc,excluding B(GS corrected)(mm)BFactor**AusteniteGrain Size(m)ASTMNumberTiN090.93 3.828.215.314.5 1.8422.47.7 TiN13 1.29 4.935.614.914.0 2.3921.17.8 TiN18 1.82 4.231.015.715.4 1.9725.17.3 TiN23 2.32 6.545.514.914.4 3.0524.87.4 TiN25 2.50 4.634.014.413.7 2.3622.67.6 TiN32 3.21 6.746.215.115.2 3.0629.2 6.9 TiN37 3.727.350.016.015.4 3.1324.07.5 TiN46 4.598.255.115.315.0 3.6026.17.2 TiN36-LN 3.62 6.947.515.013.4 3.1717.28.4 TiN52-LN 5.178.154.914.212.5 3.8716.38.6*J50pct MϭJominy distance for50vol pct martensite,based on the tabulated50pct martensite hardnesses provided in ASTM A255-89.**B factorϭDI measured /DI calc(excluding B,GS7).Fig.2—BFs as a function of the Ti/N ratio for the experimental C-Mn-Bsteels.pct nital solution.A thin Alfilm(about30-nm thick)was then evaporated onto the etched specimens in a vacuum evaporator equipped with a cryogenic pump(to avoid car-bon contamination).The Alfilm with embeddedfine pre-cipitates was then scribed into3-mm squares and separated from the specimen surface by etching in a10pct nital so-lution.Finally,the replicas werefloated off in distilled wa-ter and collected on Al grids.The replicas were initially examined in a PHILIPS*EM300transmission electron mi-*PHILIPS is a trademark of Philips Electronic Instruments Corp., Mahwah,NJ.croscope(TEM)operating at100kV.If the quality of spec-imens was satisfactory,the compositions of thefine precip-itates were determined in a VG Scientific HB501scanning transmission electron microscope(STEM).Equipped with afield emission gun,the HB501STEM has a probe size of 1nm when operating at100kV with a beam current of1 nA;a windowless X-ray detector provides high sensitivity for the analysis of light elements.III.RESULTS AND DISCUSSIONA.Steel CompositionTable I shows the product analyses of the ten experi-mental steels investigated in this study.With a nominal base composition of0.18C-1.2Mn-0.002B,these steels con-tain various combinations of Ti and N and can be divided into two groups based on N content:(1)high-N steels with N levels in the range of70to100ppm and(2)low-N steels with N levels of about60ppm.The combinations of dif-ferent Ti(range of about0.01to0.04wt pct)and N levels result in Ti/N ratios that vary from0.93to5.17.In this article,each steel is referred to by the‘‘rounded-off’’Ti/N ratio.For example,steels TiN09and TiN46have Ti/N ra-tios of0.93and4.59,respectively.The LN designation used in Table I for steels TiN36-LN and TiN52-LN refers to‘‘low nitrogen.’’Note that steels TiN37,TiN46, TiN36-LN,and TiN52-LN all have hyperstoichiometric Ti/N ratios;these steels have‘‘excess Ti’’after all the available N is precipitated as TiN.The calculated excess Ti or excess N levels for all the steels are shown in Table I.B.HardenabilityFigure1shows Jominy curves for the experimental steels (these data are also summarized in Table II).In general, the hardenability increases with increasing Ti/N ratio,in-dependent of N level.The effectiveness of the various Ti additions can be derived from these curves by an evaluation of the B-hardenability effect,expressed as a boron factor (BF).Here,the BF is obtained by dividing the measured hardenability(the effect of all alloying elements,including B)by the calculated base hardenability excluding B(using the multiplying alloy factors provided in ASTM A255-89). Separate DIcalculations were done for(1)a constant aus-tenite grain size of ASTM7,following ASTM A255-89 procedures;and(2)the measured grain sizes(range of ASTM6.9to8.6)using the grain size correction developed by Grossman.[12]A comparison of these calculations(Table II)shows that the grain size correction has only a modestFig.3—As-quenched through-thickness hardness profiles of experimental 12.7-mm,C-Mn-B plates.The plates were austenitized at 927ЊC for 30min (at temperature)and water quenched.Fig.4—Tempering curves (midthickness hardness vs tempering temperature)for the 12.7-mm plates.Tempering times were 30min (at temperature).Table III.Mechanical Properties and Austenite Grain Sizes of C-Mn-B Plates (Tempering Temperature ϭ593ЊC)Steel 0.2Pct Yield Strength (MPa)Tensile Strength (MPa)Elongation (Pct)Reduction in Area (Pct)Charpy Energy at Ϫ40ЊC (J)Austenite Grain Size (m)ASTM Number TiN0960568922.557.55217.78.4TiN1360769121.056.64519.88.0TiN1861470121.057.64720.97.9TiN2361170020.556.84221.07.9TiN2560869321.057.34124.07.5TiN3262070520.556.43522.07.7TiN3764271919.555.23421.27.8TiN4666973719.355.93020.18.0TiN36-LN 64672422.061.14619.58.1TiN52-LN69776320.058.63217.48.4effect on the base hardenability.In addition,it has been suggested that the effect of grain size on hardenability in B-treated steels is not as significant as in B-free steels,since B inhibits the grain boundary nucleation of ferrite.[1]As a result,the small grain size differences observed in this study are not expected to have a significant effect on sub-sequent comparisons.Consequently,the D I values for a constant grain size of ASTM No.7were used in the BF calculations (Table II).The higher the BF,the greater the contribution of B to hardenability and,hence,the more effective is the protec-tion provided by the Ti addition.Figure 2shows the cal-culated BFs as a function of Ti/N ratio (note that the low-N and high-N results are comparable).Overall,the data define a band where the BF increases with increasing Ti/N ratio.This data band consists of three distinct regimes.(1)For Ti/N ratios up to about 2.5,the BF is low andinconsistent,suggesting incomplete protection of the B by Ti.(2)All steels with Ti/N ratios ≥2.9have good BF;thismeans that in these steels,the BF is fully protected by Ti.(3)At Ti/N ratios above about 3.4,the BF starts to increaseagain.In this regime,the BF probably include a har-denability contribution from some of the excess Ti in the steel (present as TiC)that dissolves during austen-itizing.[13,14]On the basis of these results,a ‘‘threshold’’point for com-plete B protection can be defined at a Ti/N ratio of 2.9(the point that separates regimes I and II).The data of Kapadia et al.[3]on low-C,Ni-Cr-Mo steels and those of Nakasato and Takahashi [4]on low-C,Mn steels also suggest that a Ti/N ratio ≥2.9provides full B protection,consistent with the present results.Note that a Ti/N ratio of 2.9is below the stoichiometric Ti/N ratio of 3.4commonly used in the alloy design of B-alloyed Q &T grades.C.As-Quenched Hardness and Tempering Behavior The through-thickness hardness profiles of the as-quenched,12.7-mm-thick plates are shown in Figure 3.Ex-Fig.5—Yield and tensile strengths as a function of the Ti/N ratio of Q &T,12.7-mmplates.Fig.6—The CVN absorbed energy at Ϫ40ЊC as a function of the Ti/N ratio of Q &T,12.7-mmplates.Fig.7—Charpy energy transition curves for the Q &T,12.7-mm plates.cept for the lowest Ti/N ratio steel,all the plates appear to be through hardened;at this thickness,the best B harden-ability factor is not needed.The tempering behavior of sev-eral of these as-quenched structures was also examined.Figure 4shows the midthickness hardnesses as a function of tempering temperature.The hardness of all plates de-creases continuously with increasing tempering temperature over the entire range evaluated (482ЊC to 704ЊC).At all temperatures,steel TiN09has lower hardness levels than other plates,consistent with the lack of through hardening on quenching (Figure 3).A small secondary hardening ef-fect is observed in the higher Ti/N ratio steels (e.g.,TiN37and TiN46)in the temperature range of 593ЊC to 649ЊC,presumably due to the precipitation of fine titanium car-bides.D.Mechanical PropertiesThe mechanical properties of the Q &T 12.7-mm plates are shown in Table III.Most of the plates exhibit through hardening (Figure 3),which is indicative of a uniform,fully martensitic microstructure through the entire plate thick-ness.Consequently,since all steels have similar carbon lev-els,the strength levels of these plates are expected to be comparable.This is clearly the case for steels with Ti/N ratios less than about 3.0,as shown in Figure 5.However,at higher Ti/N ratios (i.e.,in the steels containing excess Ti),the strength increases continuously with increasing Ti/N ratio.This strength increment at the higher Ti/N ratios is probably due to fine Ti-rich precipitates formed on tem-pering.Consistent with this strength increase,the tensile ductility (both elongation and reduction in area)of these 12.7-mm plates decreases slightly with increasing Ti/N ra-tio,for Ti/N ratios above 3.0.Independent of changes in strength level,the CVN toughness generally decreases with increasing Ti/N ratio,as shown in Figures 6and 7.Presumably,a portion of the toughness reduction can be explained by an increase in the volume fraction of coarse TiN particles with increasing Ti/N ratio.Also,in steels with excess Ti,some additional loss of toughness could come from the precipitation of Ti-rich particles on tempering.Consequently,in the high-N steels,the best toughness is observed in the low Ti/N ratio steels.However,the toughness of the higher Ti/N ratio steels is significantly improved by reducing the N level (note the data for the low-N steels in Figures 6and 7).Even with a hyperstoichiometric Ti/N ratio,steel TiN36-LN ex-hibits a toughness level similar to that obtained in steels TiN13and TiN18(Figure 7).The changes in tensile and impact properties are not the(a)(b)(c )Fig.8—Fracture surfaces of Charpy specimens of (a )TiN23,showing MnS and TiN inside the dimple fractures;(b )TiN46,showing TiN particles inside large dimples;and (c )TiN46,showing a coarse TiN particle in the path of brittle fracture.result of variations in austenite grain size.As shown in Table III,the austenite grain size is nearly constant (range of ASTM 7.5to 8.4)for all steels.With this small differ-ence in grain size,the discussion of mechanical propertieswill be primarily focused on the effects of the Ti and N levels in the steels evaluated.E.SEM FractographyThe role of coarse TiN particles on toughness was in-vestigated by examination of the fracture surfaces of broken Charpy specimens (tested at Ϫ40ЊC)from plates TiN23and TiN46.The sample from steel TiN23exhibits predom-inantly ductile fracture,while that from steel TiN46shows about 50pct shear fracture.In the fully ductile fracture region of the TiN23sample,both MnS inclusions and coarse TiN particles (about 5to 10m in size)are observed inside the dimples (Figure 8(a)).This suggests that coarse TiN particles act like MnS inclusions;both types of parti-cles provide initiation sites for ductile fracture,presumably by decohesion of the inclusion/steel interfaces.[15]Similar ductile fracture behavior is observed in the sample from steel TiN46.For example,Figure 8(b)shows that coarse TiN particles are responsible for the large dimples found on sample TiN46.On the other hand,the role of coarse TiN particles in brittle fracture is less clear.Figure 8(c)shows a coarse TiN particle in the path of a brittle fracture in a Charpy sample from steel TiN46(tested at Ϫ101ЊC).This TiN particle does not contribute to the initiation of the cleavage fracture.In our fractography studies,we could find no evidence of TiN particles initiating brittle fracture,in contrast to an earlier report in the literature.[8]F.Quantitative Metallography—Coarse TiN Particles The tendency to form coarse TiN particles during solid-ification increases as the product of the steel Ti and N con-tents increases.The higher the (Ti)(N)product,the higher the supersaturation at a given temperature,and the greater the driving force for precipitation of TiN particles.At a constant temperature,the (Ti)(N)solubility product is fixed.In steels with (Ti)(N)products above this solubility limit,there is a potential for TiN precipitation.During solidifi-cation,high levels of Ti and N are expected in the inter-dendritic liquid due to microsegregation.The (Ti)(N)prod-uct in these interdendritic regions could exceed the solubility limit of TiN in liquid steel,leading to the precip-itation of TiN.[16]At these high temperatures,the TiN par-ticles can grow rapidly,resulting in coarse TiN particles in the interdendritic regions of as-cast structures.These coarse TiN particles eventually become somewhat dispersed dur-ing the ingot breakdown and plate hot rolling steps.Assum-ing that the degree of solute enrichment during solidification is proportional to the bulk solute content,steels TiN37and TiN46would be expected to have the highest volume fraction of coarse TiN particles.In contrast,steels TiN09and TiN13have the smallest (Ti)(N)products and should,therefore,have the fewest coarse TiN particles.The volume fraction of coarse TiN particles in each 12.7-mm plate was measured by optical microscopy techniques.These data,along with information on particle size and number,are provided in Table IV.Note that the average TiN particle size is similar in all the steels.As shown in Figure 9,the volume fraction of coarse TiN particles in-creases proportionally with the (Ti)(N)product,a result in good agreement with the trends discussed previously.Therefore,any effects related to coarse TiN particles shouldTableIV.Quantitative Metallography—Coarse TiN ParticlesSteel Ti,Wt Pct N,Wt Pct (Ti)(N)10Ϫ4ϫWt Pct 2Vol Pct of Coarse TiNParticles Number of Coarse TiN ParticlesAverage Edge Length of TiN Particles (m)TiN090.0100.0107 1.070.003848 4.69TiN130.0090.00700.6308 3.31TiN180.0160.0088 1.410.0153832 4.51TiN230.0160.0069 1.100.0076918 4.75TiN250.0200.0080 1.600.0115338 3.28TiN320.0250.0078 1.950.0230791 4.75TiN370.0320.0086 2.750.0423092 5.38TiN460.0390.0085 3.320.04230120 4.62TiN36-LN 0.0210.0058 1.200.01602100not measured TiN52-LN0.0300.00581.740.02212134not measuredFig.9—The volume fraction of coarse TiN particles measured in the Q &T,12.7-mm plates as a function of the corresponding (Ti)(N)product.Fig.10—The CVN absorbed energy at Ϫ40ЊC in the Q &T,12.7-mm plates as a function of the (Ti)(N)product.be analyzed using the (Ti)(N)product instead of the Ti/N ratio.In contrast,it is more appropriate to use the Ti/N ratio to explain the B-hardenability effect,and the effects of ex-cess Ti (or excess N)on mechanical properties.The average CVN energy at Ϫ40ЊC of the 12.7-mm fully martensitic,Q &T plates is plotted against the (Ti)(N)product for these steels in Figure 10.(Note that the data for steel TiN09are excluded since this steel did not through harden on quenching.)The data band shows that in these tempered martensitic structures,toughness is inversely pro-portional to the (Ti)(N)product;i.e.,toughness decreases as the volume fraction of coarse TiN particles increases.The beneficial effect of reducing both the Ti and N levels on toughness can be further illustrated by comparing the results for steels TiN36-LN and TiN37.These steels have similar Ti/N ratios,and therefore exhibit comparable har-denability (Table II)and strength (Table III).However,by reducing the (Ti)(N)product from 0.000275wt pct 2(steel TiN37)to 0.00012wt pct 2(steel TiN36-LN),the CVN en-ergy is significantly improved (from 34to 46J).Based on the results shown in Figure 10,it appears that if the (Ti)(N)product is maintained below about 0.00015wt pct 2,an av-erage CVN absorbed energy of 40J at Ϫ40ЊC should be achievable for this C-Mn-B steel.G.Electron Microscopy Analysis of Fine Precipitates The fine precipitates present in the Q &T condition for steels TiN23and TiN46were analyzed using aluminum extraction replicas.Figure 11(a)shows the microstructure at a junction of four prior austenite grains in steel TiN23.Many particles are observed on the prior austenite grain and martensitic lath boundaries,as well as within the grains.The size and location of these particles suggest they are cementite,as typically found in tempered martensitic steels.[17]At a higher magnification (Figure 11(b)),a large rectangular particle and some smaller square particles (in-dicated by arrows)are identified as TiN,based on STEM microanalysis.As discussed previously,steels with hyperstoichiometric Ti/N ratios have excess Ti,which is available for precipi-tation on tempering.The fine precipitates present in an ex-traction replica prepared from steel TiN46are shown in Figure 12(a).These particles are roughly spherical,with a(a)(b )Fig.11—TEM micrographs from an extraction replica specimen of steel TiN23showing (a )an area consisting of four prior austenite grains and (b )TiNparticles.(a)(b)(c )Fig.12—(a )TEM micrograph of an aluminum extraction replica for steel TiN46showing fine precipitates;(b )annular dark-field micrograph of fine Ti(C,N)precipitates;and (c )X-ray microanalysis for particle C,which is indicated by an arrow in (b).diameter in the range of 5to 10nm.The chemical com-positions of these precipitates were examined using STEM microanalysis.Figure 12(b)shows the annular dark-field image for a small area in steel TiN46,where several fine precipitates (bright spots)are indicated by arrows.The compositions of these particles are all very similar.A typ-ical X-ray spectrum (for particle C in Figure 12(b))is shown in Figure 12(c).In this spectrum,the Al and O sig-nals (from the replica substrate)have been subtracted using a spectrum acquired from a nearby precipitate-free area.The presence of the Ti,C,and N (overlaps the Ti L-line)signals suggests that this small spherical particle is a Ti(C,N)precipitate.Although the amount of C and N could not be quantitatively determined,since most of the N has been precipitated earlier as TiN,it is likely that these par-ticles are C rich.The presence of some N in these precip-itates may be the result of the mutual solubility of TiC and TiN,as reported for carbides and nitrides in most microal-loying systems.[16,18–21]This observation confirms the con-tribution of excess Ti to the small strength increment observed in the higher Ti/N ratio steels.This study has shown that a Ti/N ratio of about 2.9en-sures full protection of the B-hardenability effect in a0.18C-1.2Mn-0.002B steel.Any excess Ti,above that re-quired to combine with the available N as TiN,presumably precipitates as Ti carbonitrides in the as-rolled plate.During subsequent austenitizing,some of these particles dissolve, and the solute Ti contributes to hardenability on quenching. Subsequently,this dissolved Ti reprecipitates asfine Ti(C,N)particles during tempering,thereby providing a modest strength increment.A high(Ti)(N)product promotes the formation of rela-tively coarse TiN particles(≥1m)during solidification. These coarse nitrides have a negative effect on toughness. Consequently,a reduced(Ti)(N)product is desired for op-timum toughness.This can be achieved by reducing both the Ti and N levels,while maintaining a minimum Ti/N ratio to ensure adequate hardenability.For the C-Mn-B steel considered in the present study,it appears that the best combination of hardenability,strength,and toughness can be obtained if the following two conditions are satisfied.(1)There is a minimum Ti/N ratio≥2.9to achieve the fullB-hardenability effect.(2)The Ti and N levels are restricted to keep the(Ti)(N)product as low as possible.For example,if the N level is limited to50ppm,a Ti melt range of0.015to0.025 wt pct would be sufficient to maintain adequate har-denability.This would provide a(Ti)(N)product in the range of0.000075to0.000125wt pct2.IV.CONCLUSIONSThe keyfindings of the present investigation can be sum-marized as follows.plete protection of the B-hardenability effect in a0.18C-1.2Mn-0.002B steel is obtained with Ti/N ratios≥2.9;this ratio is slightly below the stoichiometric Ti/N ratio of3.4.2.Excess Ti(above that required to combine with N)pro-vides an increase in hardenability on quenching and a strength increase on tempering due to the precipitation offine Ti(C,N)particles.3.There is a linear relationship between the volume frac-tion of coarse(≥1m)TiN particles and the(Ti)(N) product.The higher the steel’s(Ti)(N)product,the more coarse TiN particles are formed during solidification.4.Coarse TiN particles act as inclusions to reduce tough-ness in the ductile fracture regime.The toughness of Q&T plates generally decreases as the volume fraction of coarse TiN particles increases.ACKNOWLEDGMENTSThe authors thank H.B.Leuckel,R.R.Lichty,J.C.Hlu-bik,R.E.Steigerwalt,R.J.August,wrence,L.L. Hahn,K.E.Downey,W.Furdanowicz,and G.F.Cartwright for their assistance in the experimental work and in the preparation of this article.REFERENCES1.B.M.Kapadia:in Hardenability Concepts with Applications to Steel,D.V.Doane and J.S.Kirkaldy,eds.,AIME-TMS,Warrendale,PA,1978,pp.448-82.2.R.W.Fountain and J.Chipman:Trans.AIME,1962,vol.224,pp.599-606.3.B.M.Kapadia,R.M.Brown,and W.J.Murphy:Trans.AIME,1968,vol.242,pp.1689-94.4.F.Nakasato and M.Takahashi:Met.Technol.,1979,vol.6,pp.102-05.5.R.Habu,M.Miyata,S.Sekino,and S.Goda:Tetsu-to-Hagane´,1974,vol.60,pp.1470-82.6.G.F.Melloy,P.R.Slimmon,and P.P.Podgurski:Metall.Trans.,1973,vol.4,pp.2279-89.7.S.Floreen,H.W.Hayden,and T.M.Devine:Metall.Trans.,1971,vol.2,pp.1403-06.8.M.Paju,H.P.Hougardy,and J.J.Grabke:Scand.J.Metall.,1989,vol.18,pp.235-42.9.Annual Book of ASTM Standards,ASTM Designation A255-89,ASTM,Philadelphia,PA,1989.10.Annual Book of ASTM Standards,ASTM Designation E112-88,ASTM,Philadelphia,PA,1988.11.Japanese Industrial Standards,JIS G0555(1977),JapaneseStandards Association,Tokyo,1980.12.M.A.Grossmann:Trans.AIME,1942,vol.150,pp.227-59.13.W.Craft and mont:Trans.AIME,1944,vol.158,pp.157-67.14.R.A.Grange:Metall.Trans.,1973,vol.4,pp.2231-44.15.R.W.K.Honeycombe:Steels—Microstructure and Properties,EdwardArnold,London,1981,pp.196-202.16.E.T.Turkdogan:Iron Steelmaker,1989,vol.16(5),pp.61-75.17.G.Krauss:Steels—Heat Treatment and Processing Principles,ASMINTERNATIONAL,Materials Park,OH,1990,pp.205-61.18.D.C.Houghton,G.C.Weatherly,and J.D.Embury:Advances in thePhysical Metallurgy and Applications of Steels,Book284,The Metals Society,London,1982,pp.136-46.19.J.Strid and K.E.Easterling:Acta Metall.,1985,vol.33,pp.2057-74.20.J.G.Speer,J.R.Michael,and S.S.Hansen:Metall.Trans.A,1987,vol.18A,pp.211-22.21.H.Zou and J.S.Kirkaldy:Metall.Trans.A,1991,vol.22A,pp.1511-24.。
G.F. Vander Voort, G.M. Lucas, and E.P. Manilova, Metallography and Microstructures of Stainless Steels and Maraging Steels, Metallography and Microstructures,Vol 9, ASM Handbook, ASM International, 2004, p. 670–700Metallography and Microstructures of Stainless Steels and Maraging SteelsGeorge F. Vander Voort and Gabriel M. Lucas, Buehler Ltd.; Elena P. Manilova, Polzunov Central Boiler and Turbine Institute, St. Petersburg, RussiaMicrostructures of Stainless SteelsThe microstructures of stainless steels can be quite complex. Matrix structures vary according to the type of steel, such as ferritic, austenitic, martensitic, precipitation hardenable, or duplex. A wide range of second-phase constituents (Table 10) can be observed; welding or high-temperature exposure increases the complexity. Additional information is available in Ref 7.Table 10 Second-phase constituents observed in stainless steelsPhase Crystalstructure Latticeparameters,nmReportedcompositionsCommentsM23C6Face-centeredcubic a0 = 1.057–1.068(Cr16Fe5Mo2)C6(Cr17Fe4.5Mo1.5)C6(Fe,Cr)23C6Most commonly observed carbide inaustenitic stainless steels. Precipitates from500–950 °C (930–1740 °F), fastest at 650–700 °C (1200–1290 °F)M6C Face-centeredcubic a0 = 1.085–1.111(Cr,Co,Mo,Ni)6C(Fe3Mo3)CFe3Nb3C(Fe,Cr)3Nb3CObserved in austenitic grades containingsubstantial molybdenum or niobium afterlong time exposureM7C3Hexagonal a0 = 1.398c0 = 0.4523Cr7C3Observed in martensitic gradesMC Cubic a0 = 0.430–0.470TiCNbC Observed in alloys with additions of titanium or niobium. Very stable carbide. Will usually contain some nitrogenSigma (σ) Tetragonal a0 = 0.8799–0.9188c0 = 0.4544–0.4599FeCrFeMoFe(Cr,Mo)(Fe,Ni)x(Cr,Mo)yFormation from δ-ferrite is much more rapidthan from austenite. Potent embrittler below595 °C (1105 °F). Forms with long timeexposure from 650–900 °C (1200–1650 °F)Chi (χ) Body-centeredcubic: (α-Mnstructure) a0 = 0.8862–0.892Fe36Cr12Mo10(FeNi)36Cr18Mo4M18CObserved in alloys containing substantialmolybdenum. Chi precipitates with exposureto 730–1010 °C (1345–1850 °F) (varies withalloy composition).Laves Hexagonal a0 = 0.470–Fe2Mo Forms in austenitic alloys with substantial The file is downloaded from (η)0.4744c 0 = 0.772–0.7725(Ti 21Mo 9)(Fe 50Cr 5Si 5) amounts of molybdenum, titanium, or niobium after long time exposure from 600–1100 °C (1110–2010 °F) Austenitic Stainless Steels. The most commonly used stainless steels are the austenitic grades, of which AISI 302, 304, and 316 are the most popular wrought grades, and CF-8 and CF-8M are the most popular cast grades. These grades contain 16% or more chromium, a ferrite-stabilizing element, and sufficient austenite-stabilizing elements, such as carbon, nitrogen, nickel, and manganese, to render austenite stable at room temperature. The grades containing silicon, molybdenum, titanium, or niobium—AISI 302B, 316, 317, 321, and 347, for example—will sometimes include a minor amount of δ-ferrite because of the ferrite-stabilizing influence of these elements.Alloys with substantial nickel are fully austenitic, for example, AISI 310 or 330. For alloys susceptible to δ-ferrite stabilization, the amount present will depend on the composition, chemical homogeneity, and hot working. Alloys with especially low carbon contents to minimize susceptibility to sensitization during welding (AISI 304L, 316L, or 317L, for example) will have a greater tendency toward δ-ferrite stabilization. Figure 26 shows examples of δ-ferrite stringers in wrought 203, 302-HQ, 304, and 316L stainless steels.Fig. 26 Examples of δ-ferrite stringers (arrows) in austenitic stainless steels. (a) 203 etched with Ralph's reagent. (b) 302-HQ etched with waterless Kalling's reagent. (c) 316L etched with glyceregia. (d) 304 etched with aqueous 20% NaOH at 3 V dc for 20 sAlloys CF-3 through CF-16F in Table 3 are austenitic, with limited amounts of ferrite; alloys CF-20, CK-20, and CN-7M are completely austenitic. They exhibit maximum corrosion resistance in the solution-treated condition. The corrosion resistance of certain alloys is enhanced by extralow carbon content (as in CF-3), a molybdenum addition (as in CF-3M and CF-8M), or the addition of niobium (as in CF-8C). Alloy CF-16F contains 0.20 to 0.35% Se for improved machinability. Figure 27 shows the microstructure of as-cast and as-cast and solution-annealed CF-8M. Figure 28 shows the microstructure of as-cast type 301, and Fig. 29 shows the microstructure of as-cast 316 stainless steel (wrought grades before hot working). Note that in the as-cast condition, both contain substantial ferrite. However, after hot working, they will be free or nearly free of ferrite.Fig. 27 Ferrite in CF-8M stainless steel in the (a) as-cast condition and (b) after solution annealing. Revealed using glyceregiaThe file is downloaded from Fig. 28 As-cast microstructure of type 301 stainless steel, revealed using Ralph's reagent. (a) Bright field.(b) Nomarski differential interference contrastFig. 29 As-cast microstructure of 316 stainless steel contains considerable δ-ferrite. Revealed using glyceregia.Numerous studies have been conducted to predict matrix phases based on chemical composition. Most of these studies have concentrated on predicting weldment microstructures (Ref 8, 9, 10, 11, 12, 13, 14, 15); others have concentrated on predicting cast microstructures (Ref 16, 17, 18) or predicting structures at the hot-working temperature (Ref 19) or after hot working (Ref 20). Measurement of the δ-ferrite content of stainless steels, particularly weldments, has been widely studied (Ref 21, 22, 23, 24).The austenite in these grades is not stable but metastable. Martensite can be formed, particularly in the leaner grades, by cooling specimens to very low temperatures or by extensive plastic deformation. Nonmagnetic, hexagonal close-packed ε-martensite and magnetic, body-centered cubic (bcc) α′-martensite have been observed. Empirical relationships have been developed to show how composition influences the resistance of such steel to deformation-induced martensite (Ref 25, 26). Figure 30 shows examples of martensite formed in cold-worked specimens of 203, 303, 303Se, and 304 stainless steels. In alloys where the austenite is more stable, cold working does not produce martensite. Because austenitic alloys are face-centered cubic, they have twelve well-developed slip systems, and only slip lines are observed, as shown in the examples for 302-HQ and 316L in Fig. 31. Figure 32 shows the slip in type 347 stainless steel, cold drawn with 5, 10, 15, and 30% The file is downloaded from reductions. Cold drawing affects the metal at the surface far more than in the interior; thus, the slip line density will be highest at the surface and lowest at the center.Fig. 30 Martensite (arrows) produced by cold working austenitic stainless steels. (a) 203 etched with Ralph's reagent. (b) 303 etched with Ralph's reagent. (c) 303 etched with Lucas reagent. (d) 303Se etched with waterless Kalling's reagent. (e) 304 etched with Vilella's reagent. (f) Same specimen as in (e) but higher magnificationFig. 31 Slip produced by cold working. (a) 302-HQ etched with waterless Kalling's reagent. (b) 316L stainless steel etched with glyceregiaFig. 32 Slip near the surface of cold-drawn 347 stainless steel reduced (a) 5%, (b) 10%, (c) 15%, and (d) 30% in diameter. Revealed using aqueous 60% HNO3 at 4 V dcCarbon content limits are generally 0.03, 0.08, or 0.15% in the austenitic grades. Solution annealing will usually dissolve all, or most of, the carbides present after hot rolling. Rapid quenching from the solution-annealing temperature of generally 1010 to 1065 °C (1850 to 1950 °F) will retain the carbon in solution, producing a strain-free, carbide-free austenitic microstructure. Some of these grades are water quenched from the hot working temperature. When properly performed, the solution-annealed structure should exhibit a single grain size distribution, with equiaxed grains containing annealing twins. Examples for a number of alloys are given in Fig. 33. The more highly alloyed grades can be quite difficult to etch and obtain full delineation of the grain structure. In such cases, use of Nomarski differential interference contrast illumination is very helpful in bringing out the grain structure as well as the alloy segregation, as shown in Fig. 33(i) to (l). However, grain structures are not always equiaxed and unimodal, especially in as-hot-worked specimens. Figure 34 shows examples of bimodal grain size distributions in austenitic stainless steels.The file is downloaded from Fig. 33 Austenitic grain boundaries revealed in (a) 302-HQ etched with waterless Kalling's, (b) 304 Modified etched with aqueous 60% HNO3 at 1 V dc for 90 s, (c) 316L etched as in (b) but for 20 s, (d) concast 316 etched with aqueous 60% HNO3 at 1.5 V dc for 60 s, (e) 330 etched as in (d), (f) Nitronic 50 etched with glyceregia, (g) 18-18 PLUS etched with 15 HCl-10 HNO3-10 acetic acid, (h) 20 Mo-6 etched as for (g), (i) AL-6XN plate etched as in (g), (j) same field as (i) but viewed with Nomarski differential interference contrast, (k) SCF-23 etched as in (g), and (l) same field as (k) but viewed with Nomarski differential interference contrast. (g) and (h) also viewed with Nomarski DIC.Fig. 34 Duplex grain structures observed in (a) Nitronic 50 etched with glyceregia, (b) SCF-19 etched with aqueous 60% HNO3 at 1 V dc for 60 s (“necklace”-type condition), (c) 22-13-5 etched with waterless Kalling's reagent, and (d) 330 etched as in (b) but at 1.5 V dcThe most widely observed carbide type in austenitic stainless steels is M23C6, which is often referred to as Cr23C6, but more properly is (Cr, Fe)23C6or (Cr, Fe, Mo)23C6. The precipitation of this carbide at grain boundaries during welding produces intergranular corrosion. To counter sensitization during welding, carbon contents are reduced or strong carbide formers are added, as in AISI 321 and 347.Precipitation of M23C6 carbide occurs as a result of heating solution-annealed grades to 500 to 950 °C (930 to 1740 °F); the fastest rate of precipitation takes place from 650 to 700 °C (1200 to 1290 °F). Precipitation occurs first at austenite/δ-ferrite phase boundaries, when present, followed by precipitation at other noncoherent interfaces (grain and twin boundaries), and finally by precipitation at coherent twin boundaries. In addition, M23C6 may precipitate at inclusion/matrix-phase boundaries.The appearance of M23C6varies with the precipitation temperature and time. It is most easily studied using extraction replicas. At the lower precipitation temperatures, M23C6has a thin, continuous, sheetlike morphology. When the precipitation temperature is 600 to 700 °C (1110 to 1290 °F), feathery dendritic particles form at boundary intersections. With time, these precipitates coarsen and thicken. At still higher precipitation temperatures, M23C6forms at grain boundaries as discrete globular particles whose shape is influenced by the boundary orientation, degree of misfit, and temperature (Ref 27). The M23C6 that precipitates at noncoherent twin boundaries is lamellar or rodlike; that which precipitates at coherent twin boundaries is platelike. The M23C6that forms at the lower precipitation temperatures is most detrimental to intergranular corrosion resistance. Examples of sensitized grain structures are shown in Fig. 35.The file is downloaded from Fig. 35 Grain-boundary carbides in sensitized (a) 304 etched with Ralph's reagent, (b) 304 etched with aqueous 10% ammonium persulfate at 6 V dc for 10 s, and (c) 316 etched as in (a)Alloys given deliberate minor additions of titanium or niobium—AISI 321 and 347, for example—form titanium or niobium carbides, rather than M23C6. To take full advantage of these additions, solution-annealed specimens are subjected to a stabilizing heat treatment to precipitate the excess carbon as titanium or niobium carbides. This treatment is commonly used with AISI 321 and involves holding the specimen several hours at 845 to 900 °C (1550 to 1650 °F). These MC-type carbides will precipitate intragranularly at dislocations or stacking faults within the matrix. Some may also precipitate on grain boundaries.Additions of titanium or niobium must be carefully controlled to neutralize the carbon in solution. In practice, titanium and niobium carbides can contain some nitrogen, and both can form rather pure nitrides. Titanium nitrides usually appear as distinct, bright-yellow cubic particles. Titanium carbide is grayish, with a less regular shape. Titanium carbonitride will have an intermediate appearance that varies with the carbon/nitrogen ratio. Chromium nitrides are not usually observed in the austenitic grades, unless the service environment causes substantial nitrogen surface enrichment or they are nitrogen strengthened.Carbides of the M6C type are observed in austenitic grades containing substantial molybdenum or niobium additions. It usually precipitates intragranularly. For example, in AISI 316 with 2 to 3% Mo, M6C will form after approximately 1500 h at 650 °C (1200 °F). Several types of M6C have been observed, including Fe3Mo3C, Fe3Nb3C, and (Fe, Cr)3Nb3C.Several types of sulfides have been observed in austenitic grades. The most common form is MnS. However, if the manganese content is low, chromium will replace some of the manganese in the sulfide. At manganese contents less than approximately 0.20%, pure chromium sulfides will form. Because these are quite hard, machinability (tool life) will be poor. Figure 36 shows manganese sulfides in types 203 and 303 resulfurized austenitic grades. Some free-machining grades have additions of selenium and sulfur to form manganese selenides as well as manganese sulfides. Figure 30(d) shows the manganese selenides in 303Se. In grades with substantial titanium, several forms of titanium sulfides have been observed, including Ti2S, Ti2SC, and Ti4C2S2. The file is downloaded from Fig. 36 Examples of the grain structures of resulfurized stainless steels revealed using Ralph's reagent.(a) and (b) 203. (c) and (d) 303Several intermetallic phases may be formed by high-temperature exposure. These phases form from titanium, vanadium, and chromium (“A” elements) and from manganese, iron, cobalt, and nickel (“B” elements). Some of these phases are stoichiometric compounds. Probably the most important is σ phase, first observed in 1927. The leaner austenitic grades free of δ-ferrite are relatively immune to σ-phase formation, but the higher alloy grades and those containing δ-ferrite are prone to its formation. Sigma is frequently described as FeCr, although its composition can be quite complex and variable, ranging from B4A to BA4.Certain elements, such as silicon, promote σ-phase formation. Cold working also enhances subsequent σ-phase formation. Empirical equations based on composition have been developed to predict the tendency toward σ-phase formation (Ref 28, 29). Sigma is a very potent embrittler whose effects are observable at temperatures below approximately 595 °C (1100 °F). Sigma also reduces resistance to strong oxidizers. The morphology of σphase varies substantially. Etching techniques (Ref 5, 30, 31, 32) have been widely used to identify σ phase in stainless steels (Fig. 19), but x-ray diffraction is more definitive. Although its crystal structure is tetragonal, σphase does not respond to crossed-polarized light.Chi phase (Ref 33, 34, 35, 36, 37, 38) is observed in alloys containing substantial additions of molybdenum subjected to high-temperature exposure. Chi can dissolve carbon and exist as an intermetallic compound or as a carbide (M18C). It is often observed in alloys susceptible to σ-phase formation and has a bcc, α-manganese-type crystal structure. Several forms of the intermetallic phase have been identified, as shown in Table 10. Chinucleates first at grain boundaries, then at incoherent twin boundaries, and finally intragranularly (Ref 38). Chi varies in shape from rodlike to globular. As with σ phase, cold work accelerates nucleation of χ phase.Laves phase (ηphase) can also form in austenitic stainless steels after long-term high-temperature exposure (Ref 37, 38). Alloys containing molybdenum, titanium, and niobium are most susceptible to Laves formation. Precipitation occurs from 650 to 950 °C (1200 to 1740 °F). Laves is a hexagonal intermetallic compound of AB2 form. Several types have been observed, as shown in Table 10. Laves phase precipitates intragranularly and exists as globular particles.Other phases have been observed in stainless steels but less often than those discussed previously. Among these is R phase (Ref 39, 40, 41), which has been observed in an Fe-12Cr-CoMo alloy and in welded AISI 316. A globular nickel-titanium silicide, G phase, was observed in a 26Ni-15Cr heat-resistant A-286-type alloy and was attributed to grain-boundary segregation (Ref 42). A chromium-iron-niobide phase, Z phase (Ref 43), was detected in an 18Cr-12Ni-1Nb alloy after creep testing at 850 °C (1560 °F). Table 10 summarizes the more common second-phase constituents observed in stainless steels. Austenitic grades, chiefly 304, have been modified with additions of boron to produce chromium borides. These steels have been used as control rods (using boron enriched in the B10 isotope, Fig. 37), and for nuclear waste containment (Fig. 38). Etching with waterless Kalling's reagent will outline the borides, and a deeper etch will bring up the austenite grain structure.Fig. 37 The microstructure of 304 stainless steel plus boron enriched in the B10isotope for nuclear reactors (Nautilus-class submarines). (a) Etched with waterless Kalling's reagent. (b) Etched with waterless Kalling's reagent but heavier than (a) to reveal the grain boundariesThe file is downloaded from Fig. 38 The microstructure of powder metallurgy 304 stainless steel plus 1.75% B for nuclear waste containment. (a) Etched with waterless Kalling's reagent. (b) Etched with waterless Kaling's reagent but heavier than (a) to reveal the grain boundariesThe ferritic stainless steels (Ref 44) are basically iron-chromium alloys with enough chromium and other elements to stabilize bcc ferrite at all temperatures. Carbon and nitrogen contents must be minimized. The microstructure of these alloys consists of ferrite plus small amounts of finely dispersed M23C6, but other phases may form due to high-temperature exposure. However, because of severe embrittlement problems, these alloys are generally not used for elevated-temperature service.The ferritic grades depend on solid-solution strengthening, because heat treatment cannot be used to harden the alloys or produce grain refinement. Quenching ferritic alloys from high temperatures produces only very slight increases in hardness. However, because many users desire higher strengths, steelmakers often make type 430 with a carbon content high in the allowable range (<0.12% C is specified), rather than keeping carbon as low as possible. This results in a duplex ferrite-martensite grade that can be heat treated to higher strength levels. Figure 39 illustrates the microstructure of a duplex 430 grade. Type 430 is also made with high sulfur for improved machinability (Fig. 40). However, the classic ferritic stainless steel contains only ferrite grains, as illustrated by the examples in Fig. 8 and 41. Figure 42 shows the microstructure of a weld in 29-4 ferritic stainless steel.Fig. 39 Microstructure of high-carbon type 430 stainless steel with a duplex martensite-ferrite grain structure, revealed using (a) glyceregia, (b) Beraha's tint etch, and (c) aqueous 60% HNO3 at 1 V dc for 60 sFig. 40 Microstructure of 430F resulfurized steel etched lightly with Ralph's reagentThe file is downloaded from Fig. 41 Ferritic grain structure of (a) Monit and (b) Seacure stainless steels etched with aqueous 60% HNO3 at 1.5 V dc for 120 sFig. 42 Ferritic grain structure of a welded 29-4 ferritic tube etched with aqueous 60% HNO3 at 1.5 V dc Three forms of embrittlement can occur in ferritic stainless steels: σ-phase embrittlement, 475 °C (885 °F) embrittlement, and high-temperature embrittlement. Sigma is difficult to form in alloys with less than 20% Cr but forms readily in alloys with 25 to 30% Cr when heated between 500 and 800 °C (930 and 1470 °F). Molybdenum, silicon, nickel, and manganese additions shift the σ-forming tendency to lower chromium contents. As with the austenitic grades, σ phase severely reduces ductility and toughness below approximately 600 °C (1110 °F). Sigma can be redissolved by holding for a few hours above 800 °C (1470 °F).Ferritic stainless steels are susceptible to embrittlement when heated from 400 to 540 °C (750 to 1005 °F), a condition referred to as 475 °C (885 °F) embrittlement. Embrittlement, which increases with time at temperature, is caused by production of chromium-rich and iron-rich ferrites but can be removed by heating above approximately 550 °C (1020 °F). Under identical aging conditions, embrittlement increases with increasing chromium content.High-temperature embrittlement occurs in alloys with moderate to high interstitial carbon and nitrogen contents heated above 950 °C (1740 °F) and cooled to room temperature, resulting in severe embrittlement and loss of corrosion resistance. This has been attributed to chromium depletion adjacent to precipitated carbides and nitrides. The properties of such a sensitized specimen can be improved by heating to 700 to 950 °C (1290 to 1740 °F), which allows chromium to diffuse to the depleted areas. A better procedure, however, is to reduce the carbon and nitrogen contents to very low levels, which also improves toughness and weldability. Strong carbide-forming elements, such as titanium and niobium, may also be added.Martensitic Stainless Steels. The hardenable martensitic stainless steels contain more than 10.5% Cr plus other austenite-stabilizing elements, such as carbon, nitrogen, nickel, and manganese, to expand the austenite phase field and permit heat treatment. The composition must be carefully balanced to prevent δ-ferrite formation at the austenitizing temperature. Delta-ferrite in the hardened structure should be avoided to attain the best mechanical properties. Empirical formulas have been developed to predict δ-ferrite formation based on the composition (Ref 45, 46). Temperature control during austenitization is also important for preventing δ-ferrite formation. To enhance the machinability of type 416 stainless steel, steelmakers deliberately form δ-ferrite, as shown in Fig. 43. The martensitic grades are generally immune from σ-phase formation.Fig. 43 Delta-ferrite and manganese sulfides in martensitic matrix of (a) 416 stainless steel etched with modified Fry's reagent and (b) 5F (modified 416) stainless steel etched with Ralph's reagentIncreases in strength when martensitic stainless steels are heat treated depend primarily on the carbon content, which can vary widely in these grades, and on the stability of δ-ferrite at the austenitizing temperature. The hardenability of these grades is very high due to the high chromium content. All these grades can be martempered to reduce the risk of quench cracking in complex shapes. The heat treatment of these grades is very similar to that of highly alloyed tool steels.The appearance of martensite in these grades varies with carbon content. With increasing carbon content, the martensite becomes finer, changing from lath to plate morphology, and the amount of residual retained austenite increases but will not cause problems unless excessively high austenitizing temperatures are used. Figure 44 shows tempered martensite in martensitic stainless steels over the range of carbon contents encountered. This series also shows the structure of powder metallurgy (P/M) alloys versus ingot technology alloys of the same grade. The difference is more noticeable when comparing the P/M versus ingot technology 440C (Fig. 44f and g) than for the 422 grade (Fig. 44d and e), due to the marked difference in carbide size and segregation in P/M 440C versus the conventional product. In most cases, martensitic stainless steels are sold in the annealed condition. It is very important to control the carbide size and distribution in these alloys. If carbide is precipitated in the grain boundaries (Fig. 45), they will be present in the part after quenching and tempering (Fig. 46), which will drastically reduce toughness and ductility. Figure 47 shows examples of annealed martensitic stainless steel microstructures. A uniform dispersion of carbides in ferrite is desired. Coarse carbides in type 440C, made by conventional technology, have been a problem, because this limits cold formability and toughness. Figure 48 shows cracked primary carbides in 440B and 440C grades (compare Fig. The file is downloaded from 48b to Fig. 47e, which has large, noncracked primary carbides). Segregation can be a problem in any stainless grade. Figure 49 shows an example of alloy segregation that apparently caused δ-ferrite formation and then carbide precipitation at the δ-ferrite phase boundaries. Subsequent processing removed the δ-ferrite but not the carbides. Control of the austenitizing temperature is vitally important in martensitic stainless steels to avoid grain growth. In 440C, excessive austenitizing temperatures will dissolve more carbide, thus lowering the martensite start and finish temperatures, resulting in incomplete transformation of austenite to martensite during quenching, as illustrated in Fig. 50. Figure 51 shows the microstructure of EP 428, an alloy similar to type 422, used for turbine blades and disks in electric power-generation systems. Figure 51(a) shows the microstructure after the standard heat treatment, while Fig. 51(b) and (c) show the alloy after 100,000 h service at 350 and 500 °C (660 and 930 °F). The microstructure appears to be coarser after extended service. The carbide composition has changed with service exposure, but this cannot be detected by light microscopy.Fig. 44 Examples of the appearance of martensite in quenched and tempered martensitic stainless steels.(a) 403 etched with 4% picral plus HCl. (b) 410 etched with Vilella's reagent. (c) 420 etched with Ralph's reagent. (d) Powder metallurgy 422 etched with Ralph's reagent. (e) EF-AOD/ESR 422 etched withThe file is downloaded from Ralph's reagent. (f) Ingot technology 440C etched with Vilella's reagent. (g) Powder metallurgy 440C etched with Ralph's reagentFig. 45 Grain-boundary carbide networks in annealed 420 stainless steel etched with Ralph's reagentFig. 46 Grain-boundary carbides in annealed 420 stainless steel tint etched with Beraha's sulfamic acid etch (No. 4)Fig. 47 Examples of annealed martensitic stainless steel microstructures. (a) 403 etched with 4% picral plus HCl. (b) Bushing-quality 416 etched with Vilella's reagent. (c) 420 etched with Ralph's reagent. (d) Trimrite etched with Vilella's reagent. (e) 440C etched with modified Fry's reagentThe file is downloaded from 。
钢的临界温度参考值(第7版)东北特殊钢集团徐效谦整理钢的临界温度参考值(第6版) 单位:℃注:1.钢的显微组织转变点A1、A3和A cm是在缓慢加热、缓慢冷却条件下测得的临界点,因同一牌号钢的化学成分不尽相同、加热和冷却速度也有差别,实测临界温度出现波动是正常的。
实际生产中,钢的组织转变总有滞后现象,实现组织转变,加热温度要高于临界点,冷却温度要低于临界点。
通常把加热时的临界点表示为Ac1、Ac3和Ac cm,把冷却时的临界点表示为Ar1、Ar3和Ar cm。
另外,用M s和M f表示马氏体开始转变和转变终了温度。
2. *表示计算值,计算采用安德魯斯()公式16A C1=723-%-%+%+%+290As%+% (℃)A C3=910-203%C-%+%+104V%+%+% (℃)M s=539-423C%-%-%-%-% (℃)3.按GB/T20878-2007规定,不锈耐热牌号表示方法变更如下:用牌号前()中的数字代替第1位数字,作为新牌号。
马氏体沉淀硬化不锈钢的临界点参考值(℃)半奥氏沉淀硬化不锈钢的临界点参考值(℃)超马氏体不锈钢的临界点参考值(℃)超临界机组用耐热钢的临界点参考值(℃)参考文献1《钢的过冷奥氏体转变曲线》第一图册,本溪钢铁公司第一炼钢厂、清华大学机械系金属材料教研组合编,1978(内部资料)。
2《合金钢钢种手册》第一册~第五册,冶金工业出版社,1983。
3《钢及热处理曲线手册》国防工业出版社,1986。
4《合金钢热处理手册》[苏] 尔格尔,中国铁道出版社。
5《热处理工作者手册》[美]机械工业出版社。
6《钢的热处理原理》[美]G.克劳斯,冶金工业出版社。
7《结构钢手册》王洪明编,河北科学技术出版社,。
8《微合金非调质钢》董成瑞等编,冶金工业出版社,9《轴承钢》钟顺思等编,冶金工业出版社,,第1版。
10《高速工具钢》邓玉昆等编,冶金工业出版社,11《模具钢》徐进等编,冶金工业出版社,12《中国航空材料手册》,中国标准出版社,,第2版。
1.IntroductionElectrical steels, or silicon steels, are used in electricpower applications, typically as magnetic core materials fortransformers, electric motors and generators.1–4)Broadlyspeaking, electrical steels can be classified into two cate-gories, one being grain-oriented and the other non-oriented.In the grain-oriented steels, the highly aligned texture is de-veloped through a process called secondary recrystalliza-tion. In the manufacture of grain-oriented 3% Si steels con-taining the (110)[001] Goss texture, two essential require-ments must be met to foster the process of secondary graingrowth: i) a grain growth inhibitor, MnS, MnSϩAlN etc.,must be added; ii) a suitable prior structure of completelyrecrystallized fine grains must be present, some of whichcontains the cube-on-edge Goss component.5–7)These two requirements are in turn affected by the slabreheating and hot rolling processes. The slabs or ingots areusually reheated at a high temperature prior to roughing andfinishing. By such a treatment, the grain growth inhibitorsare dissolved and subsequently reprecipitated as a fine dis-persion of particles during hot rolling. After hot rolling iscompleted, the basic distribution of the inhibiting particleshas been established, although it can still be modified bysubsequent heat treatment. A more profound understandingof the nucleation behavior of precipitates during hot defor-mation is therefore desirable. During slab reheating, be-cause of the very high temperatures involved (1250°C),some of slab surface is melted and accumulates on the floorof the furnace. Thus the furnace must be repaired after each
production campaign. Some researchers have thereforestudied the use of lower slab reheat temperatures; in thesecases, they employ AlN as the inhibitor instead of MnS orMnSϩAlN.8,9)Although aluminum nitride (AlN) with manganese sul-fide (MnS) has been extensively used as an elementary “in-hibitor” in commercial silicon steels, the precipitation ofAlN without MnS has not been as widely explored. Sinceprecipitates of AlN and MnS are of considerable impor-tance in improving the final texture and, therefore, the mag-netic properties of these steels, it is also of interest to studythe precipitation of AlN in the absence of MnS precipita-tion. Because it has been found that large particles only ex-hibit a very small pinning effect on grain boundaries, it isimportant to know how to produce a fine dispersion of AlNprecipitates during hot rolling. Thus the monitoring of AlNprecipitation at high temperatures is of considerable interestand requires detailed investigation.10–12)As is well known, a large number of studies have dealtwith the precipitation of sulfides or nitrides. By contrast,there has been little research related to the precipitation ofaluminum nitride in electrical steels.13,14)Furthermore, met-allurgists often concentrate on the hot working of steels inthe single-phase austenite or single phase ferrite range.However, the hot deformation and heat treatment of 3% sil-icon steels in industrial practice are carried out within theferrite range (from 80 to 90% volume fraction) of dual-phase steels; thus the events occurring during theseprocesses are particularly interesting and less familiar.Although the precipitation of Ti(C,N) in such dual-phase
ISIJ International, Vol. 41 (2001), No. 5, pp. 484–491©2001ISIJ484
AlN Precipitation in Dual-phase 3% Si Electrical SteelsJae-Hoon OH, Sang-Hyun CHO1)and John J. JONAS1)Si Steel Technical Team, Cold Rolling Department, Pohang Iron & Steel Co., Ltd., Pohang, Korea.1) Department of Metallurgical Engineering, McGill University, 3610 University Street, Montreal, H3A 2B2 Canada.
(Received on October 2, 2000; accepted in final form on February 14, 2001)
The existing approaches to the detection of precipitation are largely based on room temperature mea-surements on quenched samples. However, the direct measurement of precipitation kinetics at high tem-peratures is also possible through analysis of the mechanical properties of the specimens. In this work, acreep method was developed and applied to the detection of aluminum nitride precipitation in a dual phase3% silicon steel containing 0.038% C. Prior to loading, the specimens were solution treated for 20min andthen cooled to the test temperature. A constant stress was applied to each sample by means of a comput-erized MTS machine and the strain was recorded continuously during testing. Microstructural examinationrevealed that the austenite fraction and morphology and the microstructure of the ferrite matrix are quitedifferent depending on whether samples are directly heated or heated and then cooled to the test tempera-ture. The resulting creep rate is sensitive both to the occurrence of precipitation as well as to phase trans-formation; when the microstructure remains fixed, the slope of the true strain–log(time) curve decreasesimmediately after the initiation of precipitation. The precipitation-time-temperature diagrams determined inthis way are of classical C shape.