Cultivar,nitrogen,and water effects on productivity,
and nitrogen-use ef?ciency and balance for rice±wheat sequences of Bangladesh
J.Timsina a,*,U.Singh a,1,M.Badaruddin b,2,C.Meisner c ,M.R.Amin b
a
Agronomy,Physiology,and Agro-ecology Division,IRRI,P .O.Box 933,Manila,Philippines b
Department ofP lant Sciences,North Dakota State University,Fargo,ND 58105,USA
c
CIMMYT Of?ce,House 18,Road 4,Sector 4,Uttara,Dhaka,Bangladesh
Accepted 12June 2001
Abstract
Rice (Oryza sativa L.)and wheat (Triticum aestivum L.)are often grown in sequences under a range of nitrogen (N),water (W),and planting date in South Asia.Field experiments were conducted from 1994±1995to 1996±1997to de?ne the effects of two W and three N regimes on growth and productivity,N uptake and N-use ef?ciencies,and N balance for rice±wheat systems of northern Bangladesh.Mean grain yields of rice and wheat were greatest (4.9and 3.1t ha à1,respectively)during the ?rst and smallest (2.2and 2.4t ha à1,respectively)during the third year.The cultivars of rice and wheat responded to irrigation and to N,with greater response to irrigation in rice,but to N in wheat.Delayed wheat seeding reduced wheat yields in all years.Agronomic N-use ef?ciency (kg grain yield per kg N applied),physiological ef?ciency (kg grain yield per kg N absorbed),and fertilizer N-recovery ef?ciency (kg N absorbed per kg N applied,expressed as %)for rice across treatments ranged from 2.8to 10.8,5.2to 27.5,and 33to 61,respectively,and all were greater for N application at 90compared with 135kg N ha à1.For wheat,those values ranged from 15to 27,33to 51,and 45to 63,respectively,and were greater at 120compared with 180kg N ha à1,and under irrigation than rainfed.All those parameters had greater values under irrigation than rainfed.Total soil N increased slightly after 3years of cropping,while organic carbon and pH decreased slightly in all treatments.There was a net increase of soil ammonium N (80kg ha à1)and a zero balance of N after the ?rst year of cropping under irrigation with high N (135and 180kg ha à1for rice and wheat,respectively),but without N there was a decrease of soil mineral N (70kg ha à1)with a balance of 16kg ha à1.Biological N ?xation accounted for N balance in N-omitted as well as N-applied treatments.The results emphasize the need for regular monitoring of weather,crop performance,irrigation water,and soil and plant mineral N for further understanding the growth,productivity,N-use ef?ciencies,and balance in rice±wheat systems.#2001Elsevier Science B.V .All rights reserved.
Keywords:Cultivar;Nitrogen;Productivity;Rice±wheat;
Water
Field Crops Research 72(2001)143±161
1.Introduction
Rice±wheat cropping systems are a major cereal production system in South Asia,occupying approxi-mately14Mha of cultivated land that extends across the Indo-Gangetic Plain(IGP)into the Himalayan foothills(Timsina and Connor,2001).Weather pat-terns in the areas under rice±wheat sequences,espe-cially in the northeast IGP,are erratic and dominated by heavy monsoon rainfall and dry mild winters. Management practices(choice of cultivars,amounts of irrigation water and fertilizers,pest and disease control measures,etc.)vary tremendously in those areas,often with sub-optimal inputs,resulting in variable,and often low,grain yields.Choice of appro-priate cultivars in rice±wheat systems is important,as is the amount of irrigation water and nitrogen(N). Early-maturing cultivars of rice allow early harvest followed by timely sowing of succeeding wheat.In rice±wheat systems,timely sowing of wheat and use of early-maturing cultivars are important to complete the life cycle before the high temperatures occur later in the season.In Bangladesh,e.g.,yield loss,often attributed to high temperatures,is about1.3%or 44kg haà1for each day delay in seeding after30 November(Ahmed and Meisner,1996).Likewise, irrigation generally increases yield of wheat but mostly under the conditions of low residual soil moisture at sowing.With the high residual soil moist-ure that generally prevails during the wheat season, especially following heavy monsoon,e.g.,in northern Bangladesh,wheat yields under rainfed conditions are up to4t haà1(Timsina et al.,1998).
There are contradictory results regarding the long-term responses of rice and wheat in rice±wheat sequences to N fertilizer.For example,N application signi?cantly increased grain and straw yields,and uptake of N by these crops when sown at the optimum time in a sequence at Pantnagar,India(Singh and Modgal,1978).In contrast,also in India,when sowing of wheat was delayed after the harvest of rice,N fertilizer decreased N uptake by wheat(Kapur et al., 1985).Recent analyses from several long-term rice±wheat experiments in south Asia and China revealed site-to-site differences in response of rice and wheat to N.In all cases,however,N fertilizer increased grain yields of both crops.Over years,there were no declin-ing yield trends in high-N,but yields declined in control treatments(Dawe et al.,2000;Yadav et al., 2000a,b).
Apparent recovery of fertilizer N(RE)by rice varies widely from0to100%and for wheat,from6to89% (Craswell and Vlek,1979;Craswell and Godwin, 1984),while agronomic ef?ciency(AE)for rice ranges from0to45kg grain per kg N applied(Cras-well and Godwin,1984).In farmers'?elds of rice±wheat systems in Nepal,mean recovery ef?ciencies for rice and wheat,with researchers'recommended practices,were31and51%,respectively.The corre-sponding AEs were16and23kg grain per kg N applied,and the physiological ef?ciencies(PE)were 19and27kg grain per kg N uptake(Adhikari et al., 1999).A summary of eight long-term rice±wheat experiments from India also revealed lower agronomic N-use ef?ciency and lower N-recovery for rice than wheat(Duxbury et al.,2000).Lower N-use ef?cien-cies in rice are attributed to larger losses of N from the soil-ˉoodwater system than from the aerobic wheat system.As a result of N losses during rice cropping, the residual effects to wheat are minimal.
Year-to-year variability in growth and nutrient uptake by component crops,and the productivity of the rice±wheat systems as a whole may be due to differences in soil nutrient availability,water avail-ability,and weather.Studies at a number of sites over the period1967±1995established that mean soil organic carbon(OC)and total N(TN)in the top100cm declined by16.2and1.38t haà1,or, by580and49kg haà1per year,respectively,in Bangladesh(Ali et al.,1997a)as did pH,exchangeable bases,and effective CEC(Ali et al.,1997b).The soil OC and TN budgets showed a fall of42.8Gg C and 3.36Gg N during the28-year period of the10study areas covering2:99?106ha throughout Bangladesh. The changes in TN were mainly attributed to the intensive cultivation of land without replenishment of nutrient removed by crops,but the declines in OC were due to accelerated decomposition of organic matter,changes in cropping systems,and differences in soil characteristics of the various physiographic units.
Increased productivity of rice±wheat systems depends on choice of appropriate cultivars,timely planting,large inputs of inorganic N fertilizer,and appropriate management of water and N.The present experiments were,therefore,designed to determine
144J.Timsina et al./Field Crops Research72(2001)143±161
the effect of cultivar(C),N,and water(W)on grain and straw yields,total system productivity, dry matter accumulation,N uptake,use and eff-iciency,and N balances for rice±wheat sequences in Bangladesh.
2.Materials and methods
2.1.Site,treatments,and crop management Experiments were carried out on a Haplaquept,non-calcareous brownˉoodplain soil at the experimental farm of the Wheat Research Centre,Nashipur,Ban-gladesh(2585H N,8884H E,30m elevation)from1994to 1997.Soil texture was sandy clay loam,with bulk density of1.6g cmà3at all depths.Initial soil che-mical parameters reˉected lower values(TN:0.63, 0.41,0.33,0.30g kgà1;olsen available P:7.5,1.6,1.4, 2.5ppm;exchangeable K:0.15,0.12,0.13, 0.13cmol kgà1;OC:6.2,4.4,4.0,
3.6g kgà1;pH: 5.6, 6.0, 5.9,and 5.8,respectively,for0±0.15, 0.15±0.30,0.30±0.45,and0.45±0.60m depths)than most soils of the region.Two rice cultivars(cvs.BR14 and BR11,with seed-to-seed duration of130and150 days,respectively)were grown under three N(0,90, and135kg haà1)and two W(rainfed and irrigated) regimes.After rice harvest each year,plots were split to allow two sowing dates(early,mid-November;and late,early-to-mid-December)for two spring wheat cultivars(cvs.Kanchan and Sowgat,with105±108 days maturity)under two W(rainfed and irrigated) and three N(0,120,and180kg haà1)rates.Treat-ments for rice were on a split±split plot,whereas those for wheat were on a split±split±split plot design. The experimental plan and site,initial soil physical and chemical analyses,crop establishment and management,seasonal soil water measurements, and weather conditions for the?rst year have been described in detail elsewhere(Timsina et al.,1998). Treatments and crop management practices for second and third years were similar to those in the ?rst year.
2.2.Crop measurements and plant N analyses During the?rst year(1994±1995)of experimenta-tion,detailed measurements were made of crop growth and dry matter partitioning,and plant N con-centrations.During the second and third years(1995±1996and1996±1997),however,data collection was limited to?nal straw and grain yields,and yield components.Aboveground dry matter was sampled from two1.0m lengths at maximum tillering(MT), panicle initiation(PI),95%ˉowering(FL),and phy-siological maturity(PM)of rice,and at spike emer-gence(PI),booting(BT),FL,and PM of wheat.The sample plants were separated into leaves(blade), stems(leaf sheath plus culm),panicles(up to FL), and additionally into grain(during PM),and dried for dry matter content at608C for48h.Sub-samples from each treatment were ground and analyzed for TN in grain and straw at harvest.TN concentrations in plant tissue were determined using the Kjeldahl method (Yoshida et al.,1972)and N uptake was calculated from dry weight and concentrations.
2.3.Soil carbon and mineral N analyses
KCl-extractable soil mineral N NO3àand NH4 and TN for0±0.15,0.15±0.30,0.30±0.45,and0.45±0.60m depths were determined before the start,and after the?rst year of experimentation,according to procedures described in Bremner and Keeney(1966). Soil OC was determined by the modi?ed Walkley-Black method(Page et al.,1982)and TN by Kjeldahl digestion,distillation,and titration(Bremner and Keeney,1966)before the start,and after the comple-tion of the experiment.NO3àin KCl extracts was determined by Cd reduction and absorption measure-ments at a wavelength of540nm.NH4 ±N was determined by steam distillation with MgO.Both NO3àand NH4 ±N were expressed on a dry-soil basis in kilogram per hectare.
2.4.N-use ef?ciencies
Physiological ef?ciency(PE,kg grain yield per kg N absorbed),fertilizer N-recovery ef?ciency (RE,kg N absorbed per kg N applied),and agronomic N-use ef?ciency(AE,kg grain yield per kg N applied) were compared for various treatments.PE reˉects the ef?ciency in using the N actually absorbed and approximates the effects of plant factors,RE focuses on N absorption from applied N and explains the effects of soil factors,and AE reˉects the ef?ciency
J.Timsina et al./Field Crops Research72(2001)143±161145
of applied N(Novoa and Loomis,1981).System-level ef?ciency was calculated as follows:
https://www.doczj.com/doc/fe10025342.html, N balance
The N balance was calculated by accounting for changes in available mineral N before and after the ?rst year of experimentation:the N inputs from fer-tilizer,irrigation and rainfall,and weeds and crop residues;and net N removal in grain and straw,as follows:
Net N balance
N removed by crops change in mineral
N after1-year of cropping
à N additions through various sources Nitrogen inputs in rainfall and irrigation water were computed from rainfall and irrigation water measured at the site,and were similar to typical N concentrations of6.5and9.2g haà1mmà1,respectively,in rainfall and irrigation water in Bangladesh(Abedin et al., 1991).Other major pathways of N input or output not measured include N inputs from biological nitro-gen?xation(BNF),gaseous N losses from ammonia volatilization and denitri?cation,and leaching losses. Hence,the N balance estimates only net N gains or losses.Seepage and leaching losses were probably small,however,because plots were separated with plastic sheets.
2.6.Statistical analyses
Statistical analyses using SAS software(SAS, 1989)on grain and straw yields,and harvest indices (HI)were performed using standard procedures of split±split plot design for rice and split±split±split plot design for wheat.In the analyses of variance (ANOV A)for rice,the degrees of freedom(d.f.)were partitioned as:replication R 3,water regime W 1,nitrogen N 2,cultivar C 1; W?N 2;W?C 1;N?C 2;W?N?C 2; and W?R or error a 3;W?N?R or error b 12;and W?N?C?R or error c 18. For wheat,the ANOV A also included sowing date
(PD)in the sub-sub-sub-plots and thus was also partitioned to PD 1;W?PD 1;N?PD 2; W?N?PD 2,C?PD 1;W?PD?C 1; N?PD?C 2;W?N?PD?C 2;W?N?PD?R or error c 18;and W?N?PD?C?R or error d 36.For remaining data sets,standard errors for means(S.E.)for various treatments were computed.In long-term trials,where the treatments for any1-year or season cannot be re-randomized,and is inˉuenced by previous-season factors,repeated measures of variances(SAS,1988)can be used to overcome the dependence in estimates of variance. The data presented in these experiments,which were conducted for3years,were subjected to repeated measures of analysis.
3.Results
3.1.Crop environment
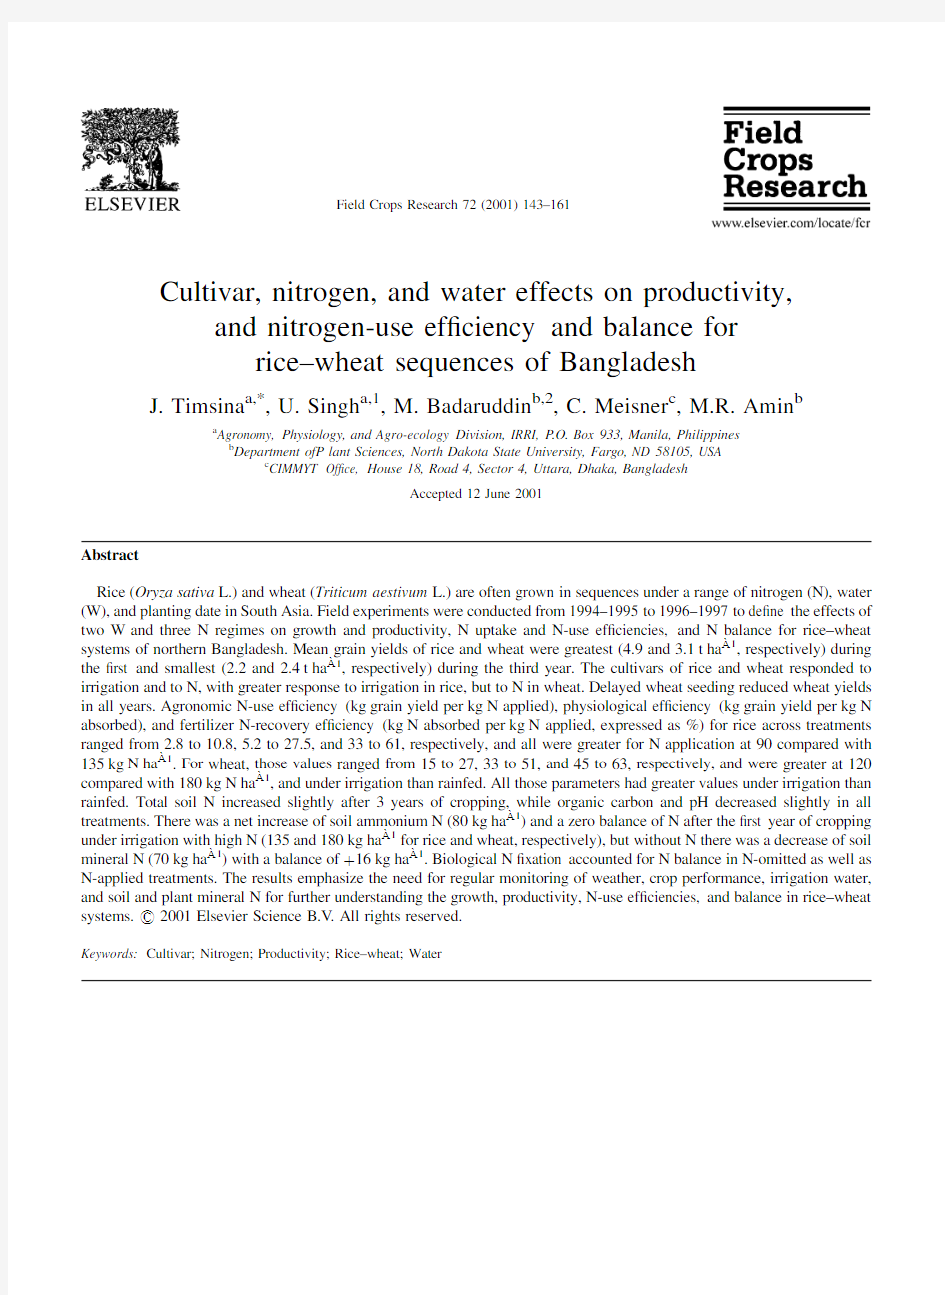
Temperature,rainfall,and radiation data are pre-sented for each of the three experimental years(1994±1997)in Fig.1.That summary,in the form of daily averages of maximum and minimum temperatures for consecutive2-week periods and rainfall totals for the same intervals,reveals the relative year-to-year consistency of maximum temperature,solar radiation, and the duration of the rainless period.In contrast, minimum temperature varied signi?cantly from year-to-year during the winter season.In1994±1995,a relatively cold period commenced in November and persisted,compared with1995±1996,until March. While the timing of the rainy season is relatively pre-dictable,there is considerable variation in the amount, intensity,and distribution.Rainfall totals for the three cropping years were840,600,and1490mm,respec-tively.Insolation is relatively stable and constant from year-to-year,but low(ca.15MJ mà2per day)in sum-mer,and10±15MJ mà2per day in winter.Clear-day
System-level efficiency
146J.Timsina et al./Field Crops Research72(2001)143±161
sunshine hours at this latitude would be 10±11h in winter,and about 13±14h in the rainy,season.The low radiation during the cloudy and wet (monsoon)season is not surprising,but the low radiation during the prolonged dry season reveal the importance of haze to insolation,and hence to crop productivity.There was incidence of rice bug (Leptocorisa ora-torius (Fabricious )),especially in the 135kg N ha à1treatment,in the second and third years.Substantial rain,together with strong winds in those years caused lodging in rice,especially in that treatment.Scorings for rice bug damage and lodging together at 135kg N treatment revealed about 20%un?lled spikelets in the second,and 40%in the third year.Yield data were adjusted accordingly for those years.We suspect that heavy rainfall (1490mm)in the third,and substantial water application from rainfall and irrigation (>1100mm)in the second year might have resulted loss of water and N,especially from the N-added plots.Those losses could not,however,be estimated.
3.2.Grain and straw yields
3.2.1.Rice
The reproductive and vegetative yields of rice as inˉuenced by water,nitrogen,and cultivar are pre-sented in Table 1.ANOV A for grain yield revealed that during the ?rst year,only the main effects of W and C were signi?cant,while during the second year,most main and interaction effects were signi?cant.In the third year,however,only the W ?N interaction was signi?cant.Yields of individual treatments ranged widely from 1.7to 7.4t ha à1over the 3-year period during which mean yield fell consistently from 4.9to 3.0t ha à1and then to 2.4t ha à1,respectively.Within this period,the effect of cultivar was signi?cant because the late-maturing BR11(mean 3.7t ha à1)always out-yielded the early-maturing BR14(mean 3.2t ha à1).While there was an overall response to irrigation (4.1t ha à1vs.2.8t ha à1),it was large in the ?rst year (6.3t ha à1vs.3.5t ha à1),small in the second (3.4t ha à1vs.2.5t ha à1),and nonexistent in the third (mean 2.4t ha à1).Overall,crops responded to N fertilizer up to 90kg ha à1(overall 3.6t ha à1vs.3.1t ha à1),but with no further response to the addi-tional N (to 135kg ha à1)for which mean yield was 3.6t ha à1.Overall,while irrigation and 90kg N ha à1resulted in higher yield,the response declined and was ?nally reversed during the period of experimentation.In the ?rst year,it was large (6.8±3.8t ha à1),smaller in the second year (3.6±2.4t ha à1),and negative in the third year (2.3±2.6t ha à1).
Vegetative yields (straw mass at harvest)are also presented in Table 1.Across the years,the main effects of N and C were signi?cant but not the interactions.The response of vegetative growth to irrigation,culti-var,and N fertilizer is most readily interpreted by reference to HI.That characteristic reveals little impact of treatment on the partition of biomass between vegetative and reproductive growth.There was no signi?cant effect of cultivar on HI,and irrigation increased HI signi?cantly in the ?rst year only.The most consistent effect was that of N fertilizer,which reduced HI signi?cantly each year.With the exception of the irrigated treatment in the ?rst year (mean HI 0:43),HI was generally low,with a minimum of 0.25for the rainfed treatment in the second year.Repeated measures of ANOV A for grain yield showed signi?cant p 0:05 main effects of W,
N,
Fig.1.Rainfall,temperature (maximum and minimum),and solar radiation for rice±wheat cropping during 1994±1995,1995±1996,and 1996±1997seasons.
J.Timsina et al./Field Crops Research 72(2001)143±161147
C,and Y,and interaction effects for W?N,Y?W, and Y?C.For straw yield,there were signi?cant p0:05 main effects of W,N,C,and Y and for the interaction effect of Y?C only,while for HI,the signi?cant effects were observed for W;N;Y;Y?W,and Y?N(detailed analyses not shown).
3.2.2.Wheat
The reproductive and vegetative yields of wheat as inˉuenced by water,nitrogen,cultivar,and time of sowing are presented in Table2.ANOV A for grain yield revealed signi?cant p0:01 main effects of N across years and sowing date(PD)for the?rst2years, while most other means were not signi?cant.As with rice,individual treatments resulted in a wide range of yields although smaller,i.e.from0.9to5.0t haà1over the3years.As with rice,mean yield was highest in the ?rst(3.1t haà1)and lowest in the third(2.4t haà1) year.The two cultivars responded similarly to irriga-tion and N fertilizer,although the early-sown crops yielded consistently more than the late-sown ones (overall mean2.8t haà1vs.2.6t haà1).There was a consistent response to fertilizer at120kg N haà1 (1.2t haà1vs.3.3t haà1)that continued to the higher application level of180kg N haà1(overall mean 3.7t haà1).Surprisingly,irrigation had a relatively minor effect,with2.8t haà1grain yield for irrigated, compared to2.6t haà1for rainfed crops.Overall, irrigation and180kg N applied to early-sown crops resulted in the highest average yield over3years (4.0t haà1)compared with the lowest yield in the late-sown crops without fertilizer or irrigation (1.2t haà1).
The vegetative yields at harvest are also presented in Table2.There was no consistent effect of cultivar or N
Table1
Grain and straw yields(kg haà1)and HI of rice as inˉuenced by W,N,and C during1994±1996(WRC,Nashipur,Bangladesh)a
Water regime Nitrogen b Cultivar199419951996Mean(3years)
Grain
yield
Straw
yield
HI Grain
yield
Straw
yield
HI Grain
yield
Straw
yield
HI Grain
yield
Straw
yield
HI
Rainfed
0BR14272542270.39166743820.28173540850.30204242310.33 BR11326052310.38225557480.28170832850.34240847550.34 90BR14352975050.32181472680.20281769830.29272072520.27 BR11414277780.35304794950.24240075500.24319682740.28 135BR14348077940.31258889640.22308783490.27305283690.27 BR11392277760.34400596380.29266361870.30353078670.31
Mean351067350.34256375820.25240260730.29282567970.29 Irrigated
0BR14532765890.45333365420.34271550540.35379260620.38 BR11640583600.43377575010.33247545890.35421868170.38 90BR14623881560.43274597790.22224580130.22374386490.30 BR11737797120.434412102680.25234258150.29471085990.35 135BR14573686030.40270784760.24249378720.24364583170.30 BR116789103050.403823103920.27235660760.28432389240.33
Mean631286210.42346688260.28243862370.29407278950.34 S.E.
W means63NS c NS NS NS NS NS NS
N means NS169532180.004NS1500.005
C means356725111NS NS69NS
W?N means NS NS106NS NS118NS NS
N?C means NS NS76NS NS NS NS NS
W?N?C means NS NS NS NS NS NS NS NS a*Signi?cant at5%level.
b Nitrogen rate is in kg haà1.
c Not signi?cant.
148J.Timsina et al./Field Crops Research72(2001)143±161
on HI,but it was consistently lower under irrigation. Likewise,late sowing consistently resulted in lower HI in all years.
Repeated measures of ANOV A for grain yield across years showed signi?cant p0:01 effects for W,N,PD,Y,Y?W,Y?N,and Y?W?N?P.For straw yield,only the main effects of W, N,and Y,and interaction effects of W?N,Y?W, and Y?N were signi?cant p0:01 ,whereas,for HI,main effects of W,N,and Y and interaction effects of Y?N and Y?PD were signi?cant(detailed ana-lyses not shown).
Table2
Grain and straw yields(kg haà1)and HI of wheat as inˉuenced by W,N,C,and PD during1994±1995to1996±1997(WRC,Nashipur, Bangladesh)a
Water regime Sowing Cultivar Nitrogen b1994±19951995±1996c1996±1997c Mean of3years
Grain
yield
Straw
yield
HI Grain
yield
Straw
yield
HI Grain
yield
Straw
yield
HI Grain
yield
Straw
yield
HI
Rainfed
Early Sowgat0119317920.4125830130.396315370.39113821140.36
120369647030.44325562760.35266365870.29320558550.36
180427453320.45375069270.35303672140.30368764910.37 Kanchan0120118030.4135428650.32103814630.43119820430.38
120366248310.43343867190.34258762460.29322959320.35
180410147650.46375071880.35318775640.30367965050.37 Mean302138710.43280154980.34224651020.33268948230.37 Late Sowgat094115520.38125833260.28157613410.39125820730.35
120355344790.4316669380.32277569750.29316561310.34
180400255680.42318369220.31255761940.29324762280.34 Kanchan099115190.39127533080.28134616550.47120421610.38
120339745190.43299163840.32268258180.32302355740.36
180368050530.42335169620.33270276320.27324465490.34 Mean276137820.41253756400.31227349360.34252447860.35 Irrigated
Early Sowgat0123519190.39125023960.36146024150.40131522430.38
120444369010.39308670700.32284285440.29345775050.33
180497976960.39385472920.35345688250.24409679370.33 Kanchan0135922150.38130225520.34137724150.37134623940.36
120432065360.39296969790.3317893270.29348976140.33
180503874790.4389670940.36383990730.27425878820.34 Mean356254580.39272655640.34269267660.31299359290.35 Late Sowgat0115616620.4189123650.28106220210.36103620160.35
120418566590.38311070980.3286793000.24338776860.31
180436770370.38294277350.28299481730.27343476480.31 Kanchan0119216800.4192932380.2493617310.36101922160.34
120379166450.36300171550.3265283490.24314873830.30
180420468380.38322380540.29311285970.27351378290.31 Mean314950870.39234959410.28227063620.29259057960.32 S.E.
W means NS28.80.0007NS NS NS22.242.9NS
N means21.827.80.000534.260.2NS30.974.70.01
PD means11.9NS0.000313.9NS0.002NS NS NS
C means NS NS0.0004NS NS NS NS NS NS
W?N means NS55.60.0009NS NS NS NS NS NS
W?PD means NS NS0.0007NS NS NS NS NS NS
N?PD means NS NS0.001NS NS NS NS NS NS
W?N?PD means NS NS0.002NS NS NS113.2NS0.03
N?PD?C means NS NS0.003NS NS NS NS NS NS a*Signi?cant at5%level.
b Nitrogen rate is in kg haà1.
c During1995±1996and1996±1997,Sowgat was replace
d by Protiva cultivar.
J.Timsina et al./Field Crops Research72(2001)143±161149
3.3.Total system productivity
Total annual and mean system productivity for rice±wheat systems as inˉuenced by cultivar,moisture,and N are presented in Table3.System productivity for individual treatments and years ranged from2.7to 11.4t haà1,while for the mean of3years across treatments it ranged from3.2to8.0t haà1.Annual system productivity across treatments was greatest (3.9±11.4t haà1)during the?rst,and smallest(2.7±6.2t haà1)during the third year.Across years,system productivity was greatest for the irrigated treatments with N applications(ranging from5.1to11.4t haà1) and smallest for the rainfed treatments without N applications(ranging from2.7to4.2t haà1).
3.4.Biomass accumulation
3.4.1.Rice
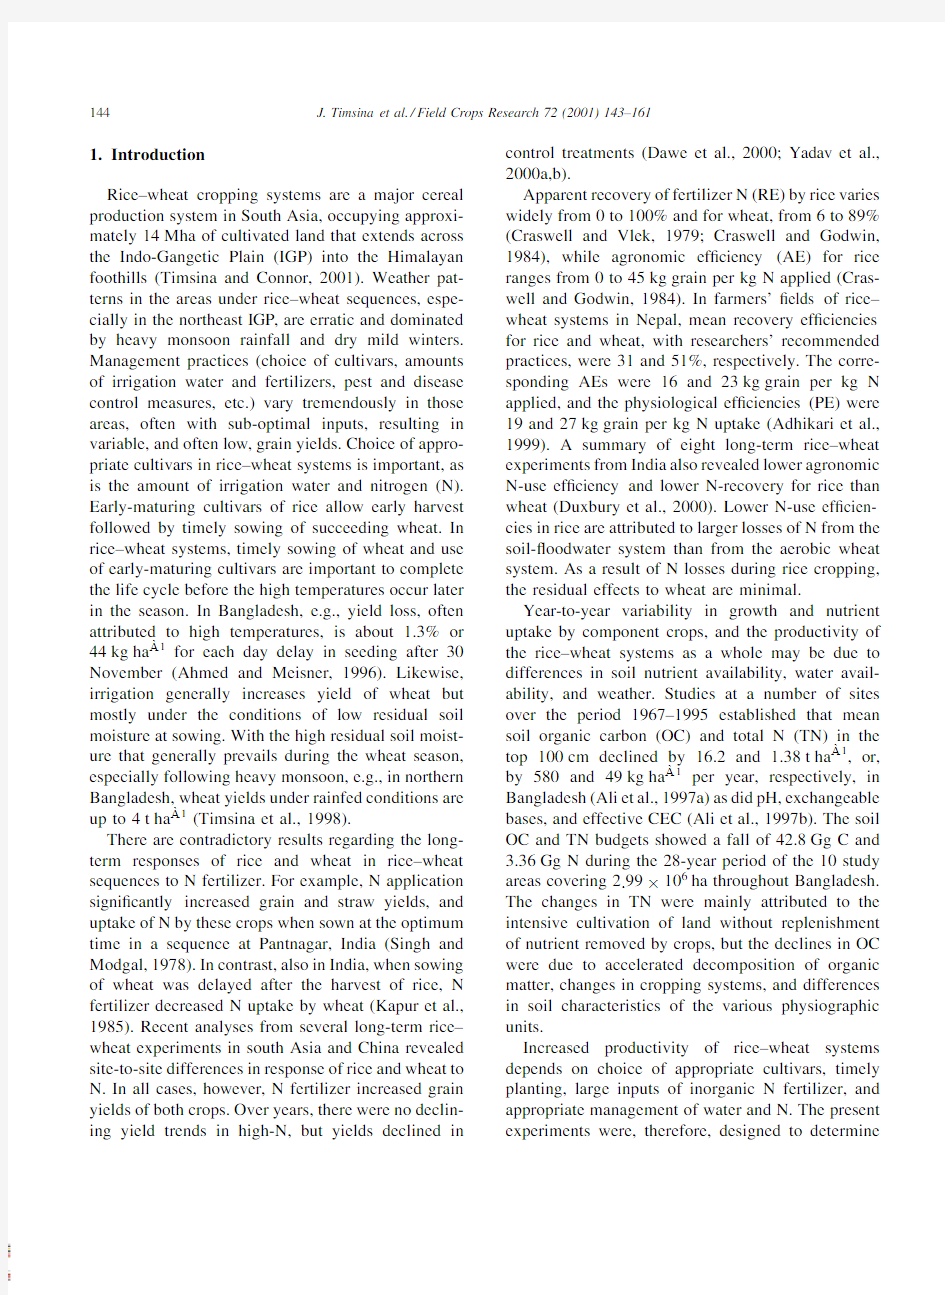
Total biomass accumulation during the growth cycle strongly varied between the two rice cultivars and was signi?cantly affected by W and N regimes (Fig.2).Biomass accumulation up to PI was similar for both cultivars in all N regimes,but was slightly greater under irrigation.From PI,however,the pattern of biomass accumulation altered under two W and N regimes.By FL stage,total biomass of BR11,the late-maturing cultivar,was signi?cantly greater than of BR14,the early-maturing cultivar,under all N and W regimes.Total biomass tended to increase continu-ously up to PM and remained greater for BR11than for BR14.The greater biomass accumulation at PM by BR11was due to longer duration up to FL. Within each N regime,biomass accumulation by both cultivars was signi?cantly faster under irrigation than rainfed.In each W and N regime,BR11parti-tioned a greater proportion of biomass to leaves than did BR14during early-vegetative growth(at MT stage).Under rainfed conditions,at PI,BR11had greater partitioning of biomass to stems than to leaves, while under irrigation,BR14partitioned more bio-mass to leaves than to stems.Atˉowering,stem was the dominant assimilate sink for both cultivars,but BR14partitioned more biomass to panicles than did BR11.At maturity,however,both cultivars had parti-tioned similar proportions of biomass to panicles(data not shown).The results reveal that HI was similar for both cultivars.
3.4.2.Wheat
Total dry matter accumulation by each cultivar at each sowing date was signi?cantly affected by N rate (Figs.3and4).At all rates,total biomass progres-sively increased up to PM.At PI,more than70%of biomass was partitioned to leaves,while at BT and FL, stem contained the greatest proportion of biomass.At PM,panicle dry weight accounted for at least55%of biomass.The pattern of biomass accumulation in wheat contrasted with rice in which leaves and stems accounted for the major proportion of dry matter at all growth stages(data not shown).Crop growth was poor without any added N;only35%as much dry matter accumulated as with N applied at180kg haà1.The dry matter was less in cv.Sowgat than in cv.Kanchan. Total dry matter was lower under rainfed conditions than under irrigation at all N rates and for both sowing times.The relative dry weight of both cultivars without-added N under rainfed conditions was,how-ever,greater than that under180kg N haà1,because biomass production was limited by drought stress. Contrary to the results of Pearman et al.(1978)and
Table3
Annual and mean total system productivity(kg haà1)for rice±
wheat systems,a with wheat grown after early(BR14)and late
(BR11)rice under three nitrogen and two water regimes
Nitrogen b Cultivar Year1Year2Year3Mean
Rainfed
0±0BR143922297327353210
BR114226352131693639
90±120BR147208516054425937
BR117617612551286290
135±180BR147668633861986735
BR117763727252926776
Mean6401523246615431
Irrigated
0±0BR146624460941345122
BR117579468434745246
90±120BR1410620577352557216
BR1111365746751017978
135±180BR1410745658261417823
BR1111075690554097796
Mean9668600449196863
a Total system productivity refers to combined yields of rice
and wheat,respectively.
b Nitrogen rate is in kg haà1(the?rst value is for rice and the
second is for wheat).
150J.Timsina et al./Field Crops Research72(2001)143±161
Makunga et al.(1978),the effect of N on dry matter distribution varied with water regime and sowing date,with delayed sowing slightly reducing total biomass (Figs.3and 4).
3.5.Total N uptake and N-use ef?ciencies
3.5.1.Rice
Effective soil N supplying capacity,estimated by crop N uptake in the control treatment under irriga-tion,was about 94kg ha à1for BR14and 95kg ha à1for BR11,but was almost half (46and 54kg ha à1,respectively)under rainfed conditions.The initial values of KCl-extractable soil NH 4 ±N were 18and 14.5mg kg à1and NO 3à±N was 50.7and 27.6mg kg à1for 0±0.3and 0.3±0.6m depths,respec-tively.Incorporated weeds and rice stubble in year 1
contained 23.3kg N ha à1,about 80%of which was derived from weeds with N concentration of 0.97%(Timsina et al.,1998).For both cultivars,grain yields increased with N uptake to a maximum before declin-ing (data not shown).Our results are similar to other experiments in the irrigated rice±wheat systems in South Asia,where there were also increases in TN uptake by rice with increased N application (Subra-manian and Rajagopalan,1980;Adhikari et al.,1999).Both cultivars,under either water regime,had similar AE values ranging from 8.9to 10.8kg grain kg à1N applied at 90kg N ha à1.AE of BR11under irrigation decreased from 10.8to 2.8and that of BR14from 10.1to 3.0when N rate was increased from 90to 135kg N ha à1.PE of BR14at 90kg N was 17.0and 24.9and that of BR11was 27.5and 17.7kg grain yield per kg N absorbed under rainfed and
irrigation,
Fig.2.Total dry biomass of two rice cultivars for three nitrogen and two water regimes during 1994season.Standard error bars compare differences among nitrogen means for each cultivar and water interaction.MT,PI,FL,and PM represent maximum tillering,panicle initiation,ˉowering,and physiological maturity stages,respectively.
J.Timsina et al./Field Crops Research 72(2001)143±161151
respectively.These values reduced to 11.9and 7.0in BR14,and 14.6and 5.2in BR11,at 135kg ha à1.RE for both cultivars decreased,but not signi?cantly,with increase of N from 90to 135kg ha à1under both water regime.Under rainfed conditions,RE was greater for BR14(53%vs.41%)but under irrigation,it was greater for BR11(61%vs.36%)(Table 4).The former was associated with much lower N uptake under rainfed conditions than under irrigation in the control treatment.As noted earlier,we suspect N losses in high-N treatments,resulting in lower grain yields and ultimately lower RE and AE under 135kg N ha à1,in comparison with 90kg N ha à1.
3.5.2.Wheat
TN uptake by the two cultivars of wheat at PM varied with sowing date,water,and N (Table 5).TN uptake across treatments ranged from 17to 119kg ha à1.Under rainfed conditions,TN uptake ranged from 17to 108kg ha à1but under irrigation from 19to 119kg ha à1.Early-sown crops had greater
uptake (22±119kg ha à1)than late-sown ones (17±107kg ha à1).Uptake without N application ranged from 17to 26kg ha à1,but with 180kg N,from 102to 119kg ha à1.The early-sown sowgat cultivar,with 180kg N ha à1under irrigation,had the highest N uptake (119kg ha à1),slightly higher than for the same cultivar under rainfed conditions (108kg ha à1).Under late-sown conditions,the corresponding values were 105and 103kg ha à1(Table 5).
All N-use ef?ciency parameters were signi?cantly affected by C,N,and W.PE under irrigation ranged from 36to 51kg grain per kg N absorbed,while under rainfed conditions it was 33±45.PE for early sowing was signi?cantly higher (33±44kg grain per kg N absorbed)than for late sowing (33±44grain per kg N absorbed).RE under irrigation was 47±63%,while under rainfed conditions it was 45±51%.RE for late sowing was higher (45±63%)than for early sowing (45±52%).RE for Sowgat was greater (46±63%)than for Kanchan (45±57%).AE was signi?cantly higher under irrigation (19±27kg
grain
Fig.3.Total dry biomass of two wheat cultivars for three nitrogen and two water regimes under early-sowing condition during 1994±1995season.Standard error bars compare differences among nitrogen means for each cultivar and water interaction.PI,BT,FL,and PM represent panicle initiation,booting,ˉowering,and physiological maturity,stages,respectively.
152J.Timsina et al./Field Crops Research 72(2001)143±161
Fig.4.Total dry biomass of two wheat cultivars for three nitrogen and two water regimes under late-sowing condition during 1994±1995season.Standard error bars compare differences among nitrogen means for each cultivar and water interaction.PI,BT,FL,and PM represent panicle initiation,booting,ˉowering,and physiological maturity,stages,respectively.
Table 4
N-use ef?ciency parameters and N uptake for 2rice cultivars as inˉuenced by nitrogen and water (1994season)
N uptake (kg ha à1)
N efficiency parameters a PE (kg kg à1)
RE (%)AE (kg kg à1)Rainfed N0BR1446±±±BR1154±±±N90BR149417.052.78.9BR118627.535.79.8N135BR1411011.947.2 5.6BR119914.633.0 4.9Irrigated N0BR1494±±±BR1195±±±N90BR1413024.940.710.1BR1115017.761.010.8N135BR141527.043.0 3.0BR11
168 5.254.0 2.8S.E.(mean)
15.5
3.3
0.12
2.4
a
PE,RE,and AE denote physiological ef?ciency,recovery ef?ciency,and agronomic ef?ciency,respectively.
J.Timsina et al./Field Crops Research 72(2001)143±161153
per kg N applied)than under rainfed conditions (15±21kg grain per kg N applied),but did not differ between the two sowing dates.All ef?ciencies were lower when N was increased from120to 180kg haà1.For example,PE ranged from40to 51kg grain per kg N absorbed at120kg N and from 35to40at180kg N.RE ranged from45to63%at 120kg N and from45to52%at180kg N.AE decreased from20to27kg grain at120kg N to 15±21kg at180kg N.
3.5.3.System-level ef?ciencies
System-level N ef?ciencies for various treatments as shown in Table6ranged from70to82%for rainfed, and from98to112%for irrigated treatments.The ef?ciencies under irrigation were highest for the con-trol treatments but the reverse was the case under rainfed conditions.Similar to these results,Tripathi et al.(1997)reported24±93%system-level ef?cien-cies in the Philippines,and Singh et al.(1999)reported 53±100%ef?ciencies in India,both for rainfed-rice-based cropping systems.
3.6.Mineral N balance
TN,OC,and pH as affected by N and W after3 years of rice±wheat cropping are shown in Table7. Total soil N for most treatments increased signi?cantly at all depths whereas OC and pH decreased at most depths.The control treatments generally had greater decline in pH than the N treatments.
Of the total input of459kg N haà1in the highest N treatment under irrigation,277and260kg haà1 was removed by irrigated rice(BR11and BR14,
Table5
N-use ef?ciency parameters and N uptake for two wheat cultivars as affected by nitrogen,water,and sowing dates(1994±1995season)
N uptake(kg haà1)N efficiency parameters a
PE(kg kgà1)RE(%)AE(kg kgà1) Rainfed
14November Sowgat N022±
N1207844.647.0020.9
N18010836.048.0017.1
Kanchan N022
N1208340.251.0020.5
N18010236.245.0016.1 7December Sowgat N022
N1208239.551.0020.0
N18010334.846.0015.8
Kanchan N017
N1207244.445.0020.1
N18010032.746.0014.9 Irrigated
14November Sowgat N025
N1208851.152.0026.7
N18011939.952.0020.8
Kanchan N026
N1208450.749.0024.7
N18010944.446.0020.4 7December Sowgat N019
N1209542.763.0027.0
N18010539.548.0019.0
Kanchan N024
N1208542.351.0021.7
N18010735.947.0016.7
S.E.12.414.9 3.5 4.5
a PE,RE,and AE denote physiological ef?ciency,recovery ef?ciency,and agronomic ef?ciency,respectively.
154J.Timsina et al./Field Crops Research72(2001)143±161
respectively)and wheat(Kanchan)crops in the sys-tem.Thus,in the315kg N haà1treatment,there was a net increase in mineral N of80kg haà1,with net N balance of8andà9kg haà1for the rotation of wheat sown after late and early rice,respectively.In contrast, without fertilizer N,TN input was144kg haà1,with total combined crop uptake of121and119kg haà1, respectively.This results in a net decrease in available soil N of70kg haà1,with balances of17and 15kg haà1,respectively,after1-year of rice±wheat cropping(Table6).The irrigated treatments main-tained greater available N than rainfed ones.Nitrogen accumulation occurred in irrigated treatments,despite greater N removal in harvested grain and straw than in rainfed treatments.Since N balances have already accounted for N inputs from irrigation and atmo-spheric deposition,the net balances of15±17kg N haà1under irrigation without N were presumably derived from BNF.A small net positive N balance (8kg haà1)in the high-N treatment with BR11rice also indicates N input from BNF.In the rainfed treatments,net N losses exceeded N inputs by 34±93kg haà1.In all treatments,however,BNF con-tribution would be underestimated by the amount of N losses from volatilization or denitri?cation.
4.Discussion and conclusions
The release of photoperiodically insensitive culti-vars of rice and wheat made timely sowing and harvesting of both crops possible in rice±wheat sys-tems.Though shortening the growth cycle without the inclusion of other physiological bene?ts almost inevi-tably reduces site potential of individual crops,the issue in rice±wheat systems is the aggregate yield of the system.Now,short-duration cultivars of both crops are available;e.g.,in Bangladesh,rice cultivars BR14, BR32,BR33,and BR39are now being introduced into the rice±wheat systems to the bene?t of greater aggre-gate yields.Further,the requirement for selection or breeding of cultivars with appropriate patterns of phenological development is evident for rice±wheat areas in subtropical Asia where high temperatures (>30/258C,day/night)frequently occur during the ˉowering and grain-?lling stages of late-seeded wheat.High temperature shortens the grain-?lling period(Midmore et al.,1984;Rawson,1988)induces water stress leading to slow growth rates and even some level of sterility(Saini and Aspinall,1982),and thus becomes a major constraint to wheat production, especially when sowing is delayed beyond the opti-mum date(Saunders and Hettel,1994).In Bangladesh, e.g.,there is reduction by44kg haà1for each day delay in sowing after1December(Ahmed and Meis-ner,1996).In such heat-stressed environments,where rice±wheat systems are practised,either short-or medium-season cultivars of rice are required so that wheat can be sown early to complete its growth cycle before the high temperatures of the ensuing spring,or wheat cultivars with heat tolerance during grain-?lling are required.
Table7
TN and OC(g kgà1),and pH at0.15m depth intervals as affected by nitrogen and water after3years of cropping a
TN(g kgà1)Organic C(g kgà1)pH
0±0.150.15±0.300.30±0.450.45±0.600±0.150.15±0.300.30±0.450.45±0.600±0.150.15±0.300.30±0.450.45±0.60 Rainfed
N00.650.370.350.25 4.8 2.9 2.6 2.0 4.8 5.4 5.6 5.6
N10.730.420.350.30 6.2 3.0 2.8 2.2 4.9 5.4 5.6 5.6
N20.740.430.500.40 6.3 3.5 3.7 3.2 5.1 5.5 5.7 5.7 Irrigated
N00.700.540.500.45 5.3 3.8 4.4 3.7 4.9 5.0 5.1 5.1
N10.720.550.500.45 5.4 3.9 4.1 4.0 5.2 5.6 5.5 5.5
N20.900.580.450.40 5.8 4.2 3.9 3.1 4.7 5.4 5.3 5.4
S.E.0.10.120.10.120.140.160.120.13NS NS NS NS
a Initial soil analysis taken before rice during July1994showed the following values:TN:0.63,0.41,0.33,0.30g kgà1;OC:6.2,4.4,4.0,
3.6g kgà1;pH(H2O;1:1):5.6,6.0,5.9,5.8,for0±0.15,0.15±0.30,0.30±0.45,0.45±0.60m,respectively.
156J.Timsina et al./Field Crops Research72(2001)143±161
Another important issue in rice-wheat systems is the need for the timely sowing and establishment of wheat after rice,of which two aspects cause concern(Tim-sina and Connor,2001).One is the need for rapid germination to avoid entrapment under surface seals that often result from the structural decline of puddled soils.The second is tolerance to water-logging during establishment where previously saturated paddies are exposed to rainfall and irrigation.Crop establishment techniques,such as zero-,reduced-,or minimum-tillage,and surface seeding,and the use of raised beds and small machines are now available to facilitate timely sowing and establish wheat quickly and reli-ably after rice.Timely sowing and rapid establishment allow the crop to grow and mature before high tem-perature occur during the grain-?lling stage.The development of wheat cultivars able to withstand water-logging during the seedling stage,however,still remains a challenge for breeders,because that ability should also be combined with resistance to drought and heat during grain?lling(Timsina and Connor, 2001).
Across the3years of experimentation in northern Bangladesh,grain yields of rice in rice±wheat systems varied widely.Rice yields under irrigation and without N ranged from2.5to6.4t haà1,while under rainfed conditions and without N they ranged from1.7to 3.3t haà1(Table1).The yields without N were gen-erally greater than in the N-applied treatments during the second and third years,which was attributed to rapid mineralization and recovery and utilization of soil organic matter(SOM)by rice plants in the warm moist conditions during the monsoon season.Bouldin (1986)also reported that lowland rice soil can supply adequate N for grain yields of2.5±3.5t haà1without the addition of fertilizer N at least for the initial few years.Recent data from IRRI indicate that N supplied by lowland rice soils ranges from30to105kg haà1, suf?cient to produce3.0±7.0t haà1grain yield(Singh et al.,1995).In a1-year study in farmers'?elds in Bangladesh and Nepal,Adhikari et al.(1999)reported 3.3and2.9t haà1of rice yield in rice±wheat systems without N application.However,although lowland rice soils can supply substantial N,especially under irrigation,soil N will be exhausted in the long run due to its continued uptake by the crop.This requires the supply of inorganic N fertilizer to meet crop demand and maintain N balance in the soil.
Heavy rainfall in the third(1490mm),and sub-stantial rainfall plus irrigation in the second (>1100mm)year added approximately10.0and 9.0kg haà1of N to rice(6.5and9.2g N haà1mmà1, respectively,in rainfall and irrigation water).These concentrations of N were similar to those earlier reported by Abedin et al.(1991)for Bangladesh. Considering a percolation rate of6mm per day for that soil for a120-day period,the estimates of leaching losses are around4.7kg haà1.Further,there would be similar magnitudes of losses through lateral seepage. Thus,additions of N through rain and irrigation would probably balance losses through leaching and seepage. It is also possible that there were signi?cant N losses through volatilization(up to50kg haà1)as has been reported by the same authors.Further,there might have been losses through denitri?cation.The environ-mental conditions during the second and third years were perhaps not as suitable as in the?rst year as evident from the lower grain yields of rice in all treatments.As mentioned previously,yields in the second and third years were also affected by insect attacks and lodging due to heavy rain,and hence the yields during those years were much lower than in the ?rst year.
Low mean minimum temperatures and high solar radiation throughout the wheat growth cycle during the?rst year were more favorable for yield than the relatively higher temperatures and lower solar radia-tion in the second and third years.There was a favorable water balance during the wheat sowing and establishment period due to plentiful rainfall during and after harvest of rice in the?rst and second years,resulting in high yields even under rainfed conditions.High temperatures coupled with high solar radiation during the grain-?lling period,especially for the late sowing,caused heat stress to wheat resulting into lower yields,especially in the second and third years.
Annual system productivities were small during the second and third years because,as discussed earlier, rice yields were reduced by lodging and insect damages.The overall results,however,suggest that system productivity of rice±wheat systems could be increased with greater amounts of N and irrigation. The lower RE,AE,and PE for rice at135kg N haà1 compared with those at90kg haà1revealed no yield bene?t from additional application of N above
J.Timsina et al./Field Crops Research72(2001)143±161157
90kg haà1.AE and PE values are much smaller, whereas the RE values are similar to those reported for wetland rice in tropical and temperate environ-ments(Cassman et al.,1993;Craswell and Godwin, 1984).For Bangladesh,an earlier study conducted by FAO/IAEA(IAEA,1978)reported an apparent recov-ery of6±53%,PE of16±85kg grain yield per kg N uptake,and an AE of4±16kg grain per kg N applied. In?eld experiments,depending on how N is applied,ˉooded rice generally recovers20±40%of applied N, whereas under non-ˉooded situations,upland crops normally recover about40±60%of N(Vlek and Byrnes,1986).
Under both rainfed and irrigated conditions,all the N-use ef?ciencies were higher for wheat than for rice. AE was much lower for rice than for wheat under both rainfed(4.9±9.8vs.14.9±20.9kg grain per kg N applied)and irrigated(2.8±10.8vs.16.7±27.0kg grain per kg N applied)conditions.The mean REs for wheat were substantially higher than for rice(45±51%vs.33±53%).Likewise,PE was also much greater in wheat than rice under rainfed(32.7±44.6 vs.11.9±27.5kg grain kgà1N absorbed)as well as under irrigated(35.9±51.1kg grain kgà1N absorbed vs.5.2±24.9kg grain kgà1N absorbed)conditions. Our results are similar to those of Adhikari et al. (1999),who reported mean RE of31and51%,PE of31and53kg grain per kg N uptake,and AE of8.5 and23.5kg grain per kg N applied for rice and wheat, respectively,in rice±wheat systems in Nepal,and of Bronson et al.(1997),who reported greater PE for wheat than rice in northwest India.The results,how-ever,differ from those of Yadav et al.(2000a),who reported smaller mean AE for wheat(12.0±21.5kg grain per kg N applied)than for rice(12.6±25.1kg grain per kg N applied)from long-term rice±wheat experiments conducted at six locations in India,and of Duxbury et al.(2000),who reported almost similar mean AE(16±17kg grain per kg N applied),but different RE(21and26%for rice and wheat,respec-tively)from eight long-term experiments,also from India.In all of those studies,as in our study,loss processes were not measured.We suspect that nitri-?cation±denitri?cation and leaching losses of fertili-zer N were greater in rice than in wheat,resulting in smaller N-use ef?ciencies in rice.
Cassman et al.(1993),on the other hand,found nearly identical PE for irrigated wheat in California and for dry-season irrigated rice in the Philippines.In our study,there was greater PE for wheat than rice, which was probably due to the greater solar radiation and the cooler temperature during the wheat season. Seasonal conditions were,therefore,more conducive to favorable grain development for wheat than for rice, resulting in greater PE in wheat.High temperatures can exacerbate volatile losses of N during grain?lling in both rice(Stutte and da Silva,1981)and wheat (Papakosta and Gagianas,1990),and would result into greater PE in the cool wheat,compared to warm rice, season.Further,high N concentration in wheat plants at maturity would have contributed to yield formation, leading to higher PE in wheat.
The supply of N is inˉuenced by soil conditions. Nitrate leaching,denitri?cation,ammonia volatiliza-tion,immobilization,and mineralization of SOM are inˉuenced by water supply.Fernandez and Laird (1959)showed that wheat yielded24kg grain per kg applied N under optimum soil water but only 11kg grain kgà1N when water was limiting.This, however,could also be due to the inability of N being `diluted'due to lack of photosynthates.Decreased water supply affects growth rate,availability of soil-N,and recovery of fertilizer-N(Spratt and Gasser, 1970a,b).The present?ndings also reveal that AE of wheat is lower under rainfed conditions than under irrigation.During the wheat season,there is less N loss by various processes,resulting in greater N-use ef?-ciency,compared toˉooded rice where N-use ef?-ciency is low due to substantial loss.Further,overall system-level ef?ciencies were lower under rainfed conditions due to more losses during wetting and drying cycles compared to under irrigation,suggesting that irrigated rice±wheat systems are more ef?cient than the rainfed systems in terms of utilization of N. In a few earlier studies(Bansal et al.,1980;Sharma et al.,1980),N fertilizer increased available N content of the soil.Other studies(e.g.Cassman et al.,1995) indicate that rice±rice cropping is generally associated with the release of N from SOM and its conservation or even increase over time,but with lower availability. Rice±wheat cropping,on the other hand,may promote breakdown of SOM compared to rice±rice systems, and thus may reduce SOM over time(Hegde and Dwivedi,1992).
Net BNF inputs to the irrigated rice±wheat system without applied N were estimated to be about
158J.Timsina et al./Field Crops Research72(2001)143±161
15±17kg N haà1,and a smaller balance of up to 8kg haà1for high-N treatments implies a smaller net BNF input than in the control treatment.Assuming that30±40%of the applied N was lost to volatilization, which is typical for irrigated lowland rice(Fillery et al.,1986),net BNF inputs in the high-N(135 and180kg haà1for rice and wheat,respectively) treatment of the irrigated rice±wheat system would be more than that for the control.Our results are similar to those of Cassman et al.(1998),who reported 40kg BNF haà1per crop in control plots.Likewise, Witt et al.(2000)estimated net BNF inputs of 50kg haà1per crop in control and10kg haà1per crop in high-N plots of rice±rice systems(190and 120kg N haà1for dry-and wet-season rice),and of $22kg N haà1per crop in control plots of maize±rice systems in the Philippines.Although BNF is generally negatively affected by the presence of inorganic N (Greenland,1997),our results do not suggest inhibi-tion of BNF by applied N fertilizer when most of the N is broadcast intoˉoodwater in several split applications(Witt et al.,2000).
The N balance was largely inˉuenced by N losses and N inputs that were not measured directly.Deni-tri?cation losses would occur in both irrigated and rainfed systems during soil drying and wetting cycles between rainfall events in fallow periods and upon soilˉooding before puddling for the rice crop (George et al.,1993).The primary N-loss pathways probably differed in rainfed and irrigated systems, because most gaseous N losses inˉooded rice result from volatilization(Freney et al.,1985),while denitri?cation would account for most N losses in ˉooded-drained systems that occurred in the rainfed rice±wheat system.
There has often been concern about yield declines and of slower rates of yield gains than achieved previously,and thus of the viability and sustainability of rice±wheat systems in south Asia.This is mostly because rice and wheat extract a lot of nutrients, especially at high levels of productivity.For example, for rice±wheat systems with grain yields of5t haà1 and HI of0.5for each crop,N concentrations in grain of1.26and1.98%,and in straw of0.70and0.48%, respectively for rice and wheat,the system would extract162kg N haà1in grain,or221kg N haà1,if straw were also removed.If a legume(e.g.mungbean, 1t haà1;HI,0.4;N concentrations of4.5and1.5%,respectively,in grain and straw)were also included further intensifying those systems,as has been com-monly practised in Bangladesh,the extraction would increase to207and289kg haà1in grain and grain plus straw,respectively.If extraction is continued year-after-year without replenishment,then there will be nutrient mining from the soil.Management should aim to apply fertilizer adequate for crop demand and to do so ways that minimize loss,maximize the ef?ciency of use,and maintain N balance.The amount required depends on many factors,including the indi-genous or native sources(e.g.irrigation and rainwater, BNF,soil microbial pool,etc.)of N.However,though indigenous sources can supply some N,they are generally small compared to its extraction.Thus, yields in rice±wheat systems can be sustained at high productivity levels if they are supplied with adequate amounts of inorganic fertilizers,coupled with organic and indigenous sources of N.
Finally,it must be stressed that application of N fertilizer and optimum irrigation water according to the demand of component crops as well as their improved management are essential for increasing the productivity of the rice±wheat systems and for meeting the food demand of the growing population of South Asia,where these systems contribute largely to food security of farmers.Our results emphasize further need for detailed measurements of water and nutrient losses,losses to pests and diseases,and of losses due to lodging and catastrophic events(e.g.ˉoods,typhoon, etc.)in irrigation and N studies.There are,however, increasing challenges because the erratic,and often high,monsoonal rainfall damages crops as well as contributing to both nutrient inputs into and losses from the systems.Nevertheless,for proper under-standing of the N demand of the component crops, and to devise N fertilizer recommendations and water-management strategies for rice±wheat systems,con-tinuing analyses of N-and water-use ef?ciencies and their thorough balance sheets are essential.
Acknowledgements
We thank David Connor for valuble able sugges-tions that have improved the manuscript.The work was undertaken as part of a research project funded by IRRI and IFDC and CIMMYT.
J.Timsina et al./Field Crops Research72(2001)143±161159
References
Abedin,M.J.,Blume,H.P.,Bhuiyan,Z.H.,Eaqub,M.,1991.Water and nutrient dynamics of a paddy soil in Bangladesh.Z.
Pˉanzenernaehr Bodenkd.153,93±99.
Adhikari,C.,Bronson,K.F.,Panaullah,G.M.,Regmi,A.P.,Saha, P.K.,Dobermann,A.,Olk,D.C.,Hobbs,P.R.,Pasquin,E., 1999.On-farm soil N supply and N nutrition in the rice±wheat system of Nepal and Bangladesh.Field Crops Res.64, 273±286.
Ahmed,S.M.,Meisner,C.,1996.Wheat research and development in Bangladesh.Bangladesh±Australia Wheat Improvement Project.CIMMYT-Bangladesh Publishers,Dhaka,Bangladesh, 201pp.
Ali,M.,Saheed,S.M.,Kubota,D.,1997a.Soil degradation during the period1967±1995in Bangladesh.I.Carbon and nitrogen.
Soil Sci.Plant Nutr.43,863±878.
Ali,M.,Saheed,S.M.,Kubota,D.,1997b.Soil degradation during the period1967±1995in Bangladesh.II.Selected chemical characters.Soil Sci.Plant Nutr.43,879±890.
Bansal,S.K.,Omanwar,P.K.,Bharwaj,V.,1980.Effect of intensive cropping and fertilization on organic carbon and total and available nitrogen in a soil from Pantnagar.J.Ind.Soc.Soil Sci.
28,519±521.
Bouldin,D.R.,1986.The chemistry and biology ofˉooded soils in relation to the nitrogen economy in rice?elds.In:De Datta, S.K.,Patrick Jr.,W.H.(Eds.),Nitrogen Economy of Flooded Rice Soils.Martinus Nijhoff,Dordrecht,pp.1±14. Bremner,J.M.,Keeney,D.R.,1966.Determination and isotope-ratio analysis of different forms of nitrogen in soils.III.
Exchangeable ammonium,nitrate,and nitrite by extraction±distillation methods.Soil Sci.Soc.Am.Proc.30,577±582. Bronson,K.F.,Singh,Y.,Singh,B.,Singh,Y.,Singh,U.,1997.
Nitrogen-15balances in rice±wheat systems of North India.
Agronomy Abstracts.1997Annual Meetings.American Society of Agronomy,Madison,WI,225pp. Cassman,K.G.,Kropff,M.J.,Gaunt,J.,Peng,S.,1993.Nitrogen use ef?ciency of rice reconsidered:what are the key constraints?Plant Soil155/156,359±362.
Cassman,K.G.,De Datta,S.K.,Olk,D.C.,Alcantara,J.,Samson, M.,Descalsota,J.,Dizon,M.,1995.Yield decline and nitrogen economy of long-term experiments on continuous,irrigated rice systems in the tropics.In:Lal,R.,Stewart,B.A.(Eds.),Soil Management:Experimental Basis for Sustainability and Environmental Quality.Lewis/CRC Press,Boca Raton,FL, pp.181±222.
Cassman,K.G.,Peng,S.,Olk,D.C.,Ladha,J.K.,Reichardt,W., Dobermann,A.,Singh,U.,1998.Opportunities for increased nitrogen-use ef?ciency from improved resource management in irrigated rice systems.Field Crops Res.56,7±38. Craswell,E.T.,Godwin,D.C.,1984.The ef?ciency of nitrogen fertilizers applied to cereals grown in different climates.In: Tinker,P.B.,Lauchli,A.(Eds.),Advanced Plant Nutrition,V ol.
1.Praeger,New York,pp.1±56.
Craswell,E.T.,Vlek,P.L.G.,1979.Fate of fertilizer nitrogen applied to wetland rice.In:Nitrogen and Rice.IRRI,Los Banos,Philippines,pp.175±192.Dawe,D.,Dobermann,A.,Moya,P.,Abdulrachman,S.,Singh,B., Lal,P.,Lil,S.Y.,Lin,B.,Panaullah,G.,Sarim,O.,Singh,Y., Swarup,A.,Tan,P.S.,Zhen,Q.,2000.How widespread are yield declines in long-term rice experiments in Asia?Field Crops Res.66,175±193.
Duxbury,J.M.,Abrol,I.P.,Gupta,R.K.,Bronson,K.F.,2000.
Analysis of long-term soil fertility experiments with rice±wheat rotations in south Asia.In:Abrol,I.P.,Bronson,K.F.,Duxbury, J.M.,Gupta,R.K.(Eds.),Long-term Soil Fertility Experiments in Rice±Wheat Cropping Systems.Rice±Wheat Consortium Paper Series6.Rice±Wheat Consortium for the Indo-Gangetic Plains,New Delhi,pp.VII±XXII.
Fernandez,R.,Laird,R.T.,1959.Yield and protein content of wheat in Central Mexico as affected by available soil water and nitrogen fertilization.Agron.J.51,33±36.
Fillery,I.R.,Roger,P.A.,De Datta,S.K.,1986.Ammonia volatilization from nitrogen sources applied to rice?elds.II.
Floodwater properties and submerged photosynthetic biomass.
Soil Sci.Soc.Am.J.50,86±91.
Freney,J.R.,Leuning,R.,Simpson,O.T.,Muirhead,W.A.,1985.
Estimating ammonia volatilization fromˉooded rice?elds by simpli?ed techniques.Soil Sci.Soc.Am.J.49,1049±1054. George,T.,Ladha,J.K.,Garrity,D.P.,Buresh,R.J.,1993.Nitrate dynamics during the aerobic soil phase in lowland rice-based cropping systems.Soil Sci.Soc.Am.J.57,1526±1532. Greenland,D.J.,1997.The sustainability of rice farming.CAB International/IRRI,Wallingford,UK/Manila,Philippines,273pp. Hegde,D.M.,Dwivedi,B.S.,1992.Nutrient management in rice±wheat cropping system in India.Fert.News37,27±41. IAEA,1978.Isotope studies on rice fertilization.Technical Report Series181.International Atomic Energy Agency,Vienna,pp.
1±131.
Kapur,M.L.,Rana,D.S.,Sharma,K.N.,Singh,B.,Sodhi,J.S., 1985.Nitrogen uptake pattern of four dwarf wheat varieties as inˉuenced by nitrogen levels and date of sowing.Ind.J.Agron.
30,455±458.
Makunga,O.H.D.,Pearman,I.,Thomas,S.M.,Thorne,G.N.,1978.
Distribution of photosynthate produced before and after anthesis in tall and semi-dwarf winter wheat as affected by nitrogen fertilizer.Ann.Appl.Biol.88,429±437. Midmore,D.J.,Cartwright,P.M.,Fischer,R.A.,1984.Wheat in tropical environments.II.Crop growth and grain yield.Field Crops Res.8,207±227.
Novoa,R.,Loomis,R.S.,1981.Nitrogen and plant production.
Plant Soil58,177±204.
Page,A.L.,Miller,R.H.,Keeney,D.R.,1982.Methods of Soil Analysis,Part2.American Society of Agronomy,Madison, WI,1572pp.
Papakosta,D.K.,Gagianas,A.A.,1990.Nitrogen and dry-matter accumulation,remobilization,and losses for Mediterranean wheat during grain-?lling.Agron.J.83,864±870. Pearman,I.,Thomas,S.M.,Thorne,G.N.,1978.Effects of nitrogen fertilizer on the distribution of photosynthate during growth of spring wheat.Ann.Bot.42,91±99.
Rawson,H.M.,1988.Effects of high temperatures on the development and yield of wheat and practices to reduce deleterious effects.In:Klatt,A.R.(Ed.),Wheat Production
160J.Timsina et al./Field Crops Research72(2001)143±161
Constraints in Tropical Environments.CIMMYT,Mexico,DF, pp.44±62.
Saini,H.S.,Aspinall,D.,1982.Sterility in wheat induced by water de?cits or high temperature:possible mediation of abscisic acid.Aust.J.Plant Physiol.9,529±537.
SAS Institute,1988.SAS/STAT Users Guide,Release6.03Edition.
SAS Institute,Cary,NC,1028pp.
SAS Institute.1989.SAS Users Guide,Version6,4th Edition,V ols.
1and2.SAS Institute,Cary,NC.
Saunders,D.A.,Hettel,G.P.(Eds.),1994.Wheat in Heat-stressed Environments:Irrigated,Dry Areas,and Rice±Wheat Farming Systems.CIMMYT,Mexico,DF,402pp.
Sharma,K.N.,Singh,B.,Rana,D.S.,1980.Fertility status of a Tolewal loamy sand after six years of its use under nine multiple cropping systems.J.Ind.Soc.Soil Sci.36,165±168. Singh, B.K.,Modgal,S.C.,1978.Dry matter production, phosphorus,and potassium uptake as inˉuenced by levels and methods of nitrogen application under rainfed upland rice.
Plant Soil50,691±694.
Singh,U.,Cassman,K.G.,Ladha,J.K.,Bronson,K.F.,1995.
Innovative nitrogen management strategies for lowland rice systems.In:Fragile Lives in Fragile Ecosystems.Proceedings of the International Rice Research Conference.IRRI,Los Banos,Philippines,pp.229±254.
Singh,U.,Patil,S.K.,Das,R.O.,Padilla,J.L.,Singh,V.P.,Pal,
A.R.,1999.Nitrogen dynamics and crop growth on an al?sol
and a vertisol under rainfed lowland rice-based cropping system.Field Crops Res.61,237±252.
Spratt,E.D.,Gasser,J.K.R.,1970a.Effects of fertilizer nitrogen and water supply on the distribution of dry matter and nitrogen between the different parts of wheat.Can.J.Plant Sci.50,613±625.
Spratt,E.D.,Gasser,J.K.R.,1970b.Effects of ammonium and nitrate form of nitrogen and restricted water supply on growth and nitrogen uptake of wheat.Can.J.Soil Sci.50,263±273.Stutte,C.A.,da Silva,P.R.F.,1981.Nitrogen volatilization from rice leaves.I.Effects of genotype and air temperature.Crop Sci.21,596±600.
Subramanian,S.,Rajagopalan,K.,1980.Effect of water manage-ment and nitrogen levels on nutrient uptake in rice.Ind.J.
Agric.25,77±82.
Timsina,J.,Connor,D.J.,2001.Productivity and management of rice±wheat cropping systems:issues and challenges.Field Crops Res.69,93±132.
Timsina,J.,Singh,U.,Badaruddin,M.,Meisner,C.,1998.Cultivar, nitrogen,and water effects on rice±wheat sequence:experi-mentation and simulation.Agron.J.90,119±130. Tripathi, B.P.,Ladha,J.K.,Timsina,J.,Pascua,S.R.,1997.
Nitrogen dynamics and balance in intensi?ed rainfed lowland rice-based cropping systems.J.Soil Sci.Soc.Am.
61,812±821.
Vlek,P.L.G.,Byrnes,B.H.,1986.The ef?cacy and loss of fertilizer N in lowland rice.Fert.Res.9,131±147.
Witt,C.,Cassman,K.G.,Olk,D.C.,Biker,U.,Liboon,S.P., Samson,M.I.,Ottow,J.C.G.,2000.Crop rotation and residue management effects on carbon sequestration,nitrogen cycling, and productivity of irrigated rice systems.Plant Soil225, 263±278.
Yadav,R.L.,Dwivedi,B.S.,Pandey,P.S.,2000a.Rice±wheat cropping system:assessment of sustainability under green manuring and chemical fertilizer inputs.Field Crops Res.65, 15±30.
Yadav,R.L.,Dwivedi,B.S.,Prasad,K.,Tomar,O.K.,Shurpali, N.J.,Pandey,P.S.,2000b.Yield trends,and changes in soil organic-C and available NPK in a long-term rice±wheat system under integrated use of manures and fertilizers.Field Crops Res.68,219±246.
Yoshida,S.,Forno, D.A.,Cock,J.H.,Gomez,K.A.,1972.
Laboratory Manual for Physiological Studies of Rice.IRRI, Los Banos,Philippines,70pp.
J.Timsina et al./Field Crops Research72(2001)143±161161
随着国家政府对环境保护的重视以及近几年连续出台的大气污染防治攻坚战文件来看,各地环保局对当地企业强制要求并执行燃煤锅炉更换为低氮燃气锅炉,普通的燃气锅炉实施低氮改造。普通的燃气锅炉尾气排放的有害颗粒物,例如氮氧化物、一氧化碳等,成为大气污染的罪魁祸首,因此锅炉的低氮改造将会是一些生产企业及供暖单位迫切面临的任务。那么,大家只知道锅炉需要改造,但是,燃气锅炉超低氮排放改造的原理是什么,需要什么技术能实现超低氮排放呢?下面,由中鼎锅炉专业技术人员给大家简单介绍一下。 1、氮氧化物危害 氮氧化物即一氧化氮、二氧化氮等气体,为高温条件下,空气中的氮气和氧气化合反应生成。氮氧化物与空气中的水结合最终会转化成硝酸和硝酸盐,硝酸是酸雨的成因之一;它与其他污染物在一定条件下能产生光化学烟雾污染。酸雨危害是多方面的,包括对人体健康、生态系统和建筑设施都有直接和潜在的危害。酸雨可使儿童免疫功能下降,慢性咽炎、支气管哮喘发病率增加,同时可使老人眼部、呼吸道患病率增加。酸雨还可使农作物大幅度减产,特别是小麦,在酸雨影响下,可减产13%至34%。大豆、蔬菜也容易受酸雨危害,导致蛋白质含量和产量下降。酸雨对森林和其他植物危害也较大,常使森林和其他植物叶子枯黄、病虫害加重,最终造成大面积死亡。 2、氮氧化物排放标准 我们知道用燃气锅炉替代燃煤锅炉能够大大降低污染,普通的燃气锅炉氮氧化物排放高于30毫克,这意味着大部分普通的燃气锅炉都达不到30mg以下,除非配有低氮燃烧机,但是使用低氮燃烧机的锅炉本身也是需要有特殊的要求的,那就是对锅炉炉膛尺寸需要加大,中鼎锅炉最新生产的低氮燃气锅炉专门针对环保政策要求的NOX排放30mg以下,且配置超低氮燃烧器,能安全、稳定、高效地运行,每一台出厂的低氮锅炉均能达到低氮排放达标。
燃气锅炉低氮改造方案 燃气锅炉低氮排放成为了新时代的新要求,为了保护环境,保证国人健康,燃气锅炉低氮排放势在必行,使命必达。 远大锅炉紧跟时代步伐,积极响应国家政策,时刻不忘研发新产品,不忘为用户谋福利。 远大低氮燃气锅炉:FGR烟气再循环低氮燃烧技术;国外原装进口低氮燃烧器; 压力、水位多重安全防护;PLC触摸屏智能化控制技术。 远大锅炉低氮技术研发历程: 保护环境,节能减排,绿色生产,可持续发展是每一个企业的使命,远大锅炉每年按销售额的5%提取新产品研发费用,专注低氮、节能锅炉技术的研发。 2015年,远大锅炉与芬兰奥林、德国欧科、意大利利雅路、意科法兰等积极合作,通过使用超低NOx燃烧器,增加烟气外循环设计,实现氮氧化物<30mg/m 3排放标准。 NOx成分分析及产生机理: 在燃烧过程中所产生的氮的氧化物主要为NO和NO2,通常把这两种氮氧化物通称为氮氧化物NOx。大量实验结果表明,燃烧装置排放的氮氧化物主要为NO,平均约占95%,而NO2仅占5%左右。
燃料燃烧过程生成的NOx,按其形成分类,可分为三种: 1、热力型NOx (Thermal NOx),它是空气中的氮气在高温下氧化而生成的NOx; 2、快速型NOx(Prompt NOx),它是燃烧时空气中的氮和燃料中的碳氢离子团如CH等反应生成的NOx; 3、燃料型NOx(Fuel NOx),它是燃料中含有的氮化合物在燃烧过程中热分解而又接着氧化而生成的NOx; 燃烧时所形成NO可以与含氮原子中间产物反应使NO还原成NO2。实际上除了这些反应外,NO 还可以与各种含氮化合物生成NO2。在实际燃烧装置中反应达到化学平衡时,[NO2]/[NO]比例很小,即NO转变为NO2很少,可以忽略。 降低NOx的燃烧技术: NOx是由燃烧产生的,而燃烧方法和燃烧条件对NOx的生成有较大影响,因此可以通过改进燃烧技术来降低NOx,其主要途径如下: 1选用N含量较低的燃料,包括燃料脱氮和转变成低氮燃料; 2降低空气过剩系数,组织过浓燃烧,来降低燃料周围氧的浓度; 3在过剩空气少的情况下,降低温度峰值以减少“热反应NO”; 4在氧浓度较低情况下,增加可燃物在火焰前峰和反应区中停留的时间。 减少NOx的形成和排放通常运用的具体方法为:分级燃烧、再燃烧法、低氧燃烧、浓淡偏差燃烧和烟气再循环等。 目前低氮改造方案 1、FGR技术: 即自身再循环燃烧器,对于天燃气锅炉来说目前主流成熟低氮排放技术就是分级燃烧加烟气再循环法即FGR技术,
1.重度胃食管反流病的治疗应采用 A A.质子泵抑制剂与促动力药联用 B.H2受体拮抗剂与促动力药联用 C.质子泵抑制剂与粘膜保护药联用 D.促动力药与H2受体拮抗剂联用 E.促动力药、H2受体拮抗剂及粘膜保护药联用2.胃食管反流病治疗至少应维持用药B A.3个月 B.6个月 C.1年 D.1年半 E.2年 3.有关非甾体抗炎药哪项是正确的C A.诱发消化性溃疡与剂量和疗程无关 B.长期服用者约50%有消化性溃疡 C.可穿透上皮细胞而破坏粘膜屏障 D.为弱酸性水溶性药物 E.可促进促胃液素分泌致消化性溃疡 4.抗幽门螺杆菌的根除方案哪项不正确E A.质子泵抑制剂+克拉霉素+阿莫西林 B.质子泵抑制剂+克拉霉素+甲硝唑 C.质子泵抑制剂+阿莫西林+甲硝唑 D.胶体铋+阿莫西林+甲硝唑 E.胶体铋+质子泵抑制剂+甲硝唑
5.消化性溃疡治疗中不属于抑制胃酸分泌的药物是A A.氢氧化铝 B.普鲁本辛(澳丙胺太林) C.丙谷胺 D.雷尼替丁 E.奥美拉唑 6.降低胃酸最有效的药物是D A.H2受体拮抗剂 B.抗胆碱药物 C.促胃液素受体拮抗剂 D.质子泵抑制剂 E.抗酸剂 7.轻、中型溃疡性结肠炎治疗的首选是B A.肾上腺皮质激素 B.水杨酸偶氮磺胺吡啶 C.免疫抑制剂 D.抗生素 E.双歧杆菌制剂 8.治疗重型溃疡性结肠炎应首选C A.水杨酸偶氮磺胺吡啶 B.免疫抑制剂 C.大剂量肾上腺糖皮质激素 D.手术治疗
E.大剂量抗生素 9.治疗轻中度溃疡性结肠炎的主要口服药物有C A.泼尼松 B.环磷酰胺 C.SASP D.甲硝唑 E.抗生素 10.下列哪项不是SASP的副作用E A.恶心、呕吐 B.食欲不振 C.自身免疫性溶血 D.粒细胞减少 E.不可逆性男性不育 11.柳氮磺胺吡啶治疗溃疡性结肠炎的机制是B A.降低肠腔酸度,促进溃疡愈合 B.抑制炎症反应 C.促进肠上皮细胞再生 D.抑制细菌生长 E.免疫抑制作用 12.服用硫酸镁导致的腹泻从发病机制上分类应属于D A.胃肠运动功能异常性腹泻 B.分泌性腹泻 C.渗出性腹泻
燃气锅炉低氮改造施工方案 项目名称:xxx燃气锅炉低氮改造工程编制单位: 编制时间:2016年10月13日
第一章工程概况 1.1工程简介 1.1.1本工程为xxx燃气锅炉低氮改造工程。首先需采购新锅炉,拆除原有锅炉、烟囱、电气设备、部分水暖和燃气管道等;然后安装新锅炉,管道、烟囱重新布置。 1.1.2本项目施工范围 1.锅炉房内原有锅炉、采暖及燃气管线、电气设备、烟囱的拆除; 2.锅炉房设备管道安装,其中有锅炉、管道等安装; 3.电气工程,包括电气动力和电气照明; 4.烟囱安装; 5.燃气工程。 第二章施工准备 在工程正式开工前,需现场勘查,确认实际施工条件和工程量,以利于施工的计划的安排和顺利进行。另一方面应该积极设备供货厂家,了解设备技术参数、基础做法、安装尺寸等,为施工做好充足准备。 2.1临时设施 根据现场实际情况,由甲方指定地点作为临时设施存放和现场预制场地。 2.2临时用电 临时用电由甲方指定的地点挂表接入,现场用电包括生产用电和生活用电,施工用电主要为电焊机、切割机、磨光机、照明设施等。临时用电采用三级配电,两级保护,保证用电安全。 2.3临时用水 临时用水从甲方指定地点接入。主要用于生活用水和施工用水,施工用水主要为土建砌筑用水和混凝土基础养护、打压和冲洗用水等。 2.4生产准备
重点完成工作场地布置、临时水源、临时电源、人员组织及进场、机械设备组织及进场计划、工程材料准备及进场计划、图纸会审及设计交底、现场纵横基准线与标高基准点复核等。 2.5技术准备 施工前要认真研究和熟悉本工程设计文件并进行现场核实,组织有关人员学习设计文件,图纸及其它有关资料,使施工人员明确设计者的设计意图,熟悉设计图纸的细节,对设计文件和图纸进行现场校对。 2.6材料准备 针对本工程的施工内容,在开工之前对工程所需锅炉设备、电气、管道、烟囱等制定采购计划,积极联系资质优良的材料厂家并提出详细的进场计划,严格执行验收与检测程序,确保原材料的质量。 第三章施工进度安排 3.1施工部署 本工程为低氮改造工程,首先得安排设备采购订货,尤其是锅炉的采购,预计需要四十天; 其次,组织施工进场,在甲方指定位置引入水电,安排临时生活设施和现场预制加工场地; 第三,拆除需改造设备,锅炉、管路、线路、烟囱等; 第四,根据设计文件和设备参数复核设备基础位置标高,规划管线安装路由、力求布局科学合理; 第五,锅炉、烟囱、电气等新购设备的进场验收; 第六,锅炉、烟囱、管道、仪器仪表、燃气管道设备及电气管线设备安装; 第七,管道系统水压试验、冲洗、防腐保温; 第八,系统冷态调试; 第九,锅炉点火试运行;
柳氮磺吡啶使用注意事项 本品口服后,少部分药物在胃和上部肠道吸收。大部分药物进入远端小肠和结肠,在肠微生物作用下分解成5-氨基水杨酸和磺胺吡啶。磺胺吡啶在药物分子中主要起载体作用,在肠道碱性条件下,微生物使重氮键破裂而释出有作用的药物。5-氨基水杨酸有抗炎和免疫抑制作用,能抑制溃疡性结肠炎的急性发作并延长其缓解期。治疗溃疡性结肠炎用肠溶片,口服,成人常用量:初剂量为一日2-3g(8-12片),分3-4次口服,无明显不适,可渐增至一日4-6g(6-24片),待肠病症状缓解后逐渐减量至维持量,一日1.5g-2g(6-8片)。 不良反应:血清磺胺吡啶及其代谢产物的浓度(20-40μg/ml)与毒性有关。浓度超过50μg/ml时具毒性,故应减少剂量,避免毒性反应。 1.过敏反应较为常见,可表现为药疹,严重者可发生渗出性多形红斑、剥脱性 皮炎和大疱表皮松解萎缩性皮炎等;也有表现为光敏反应、药物热、关节及肌肉疼痛、发热等血清病样反应。 2.中性粒细胞减少或缺乏症、血小板减少症及再生障碍性贫血。患者可表现为 咽痛、发热、苍白和出血倾向。 3.溶血性贫血及血红蛋白尿。缺乏葡萄糖6-磷酸脱氢酶患者使用后易发生,在 新生儿和小儿中较成人为多见。 4.高胆红素血症和新生儿核黄疸。由于可与胆红素竞争蛋白结合部位,致游离 胆红素增高。新生儿肝功能不完善,故较易发生高胆红素血症和新生儿黄疸。 偶见发生核黄疸。 5.肝脏损害,可发生黄疸、肝功能减退,严重者可发生急性肝坏死。 6.肾脏损害,可发生结晶尿、血尿和管型尿。偶有患者发生间质性肾炎或肾管 坏死的严重不良反应。 7.恶心、呕吐、胃纳减退、腹泻、头痛、乏力等。一般症状轻微,不影响继续 用药。偶有患者发生艰难梭菌肠炎,此时需停药。 8.甲状腺肿大及功能减退偶有发生。 9.中枢神经系统毒性反应偶可发生,表现为精神错乱、定向力障碍、幻觉、欣 快感或抑郁感。一旦出现均需立即停药。 10.罕见有胰腺炎、男性精子减少或不育症。 注意事项: 1.缺乏葡萄糖-6-磷酸脱氢酶、肝功能损害、肾功能损害患者、血卟啉症、血小 板、粒细胞减少、血紫质症、肠道或尿路阻塞患者应慎用。 2.应用磺胺药期间多饮水,保持高尿流量,以防结晶尿的发生,必要时亦可服 碱化尿液的药物。如应用本品疗程长,剂量大时宜同服碳酸氢钠并多饮水,以防止此不良反应。治疗中至少每周检查尿常规2-3次,如发现结晶尿或血尿时给予碳酸氢钠及饮用大量水,直至结晶尿和血药消失。失水、休克和老年患者应用本品易致肾损害,应慎用或避免应用本品。 3.对呋塞米、砜类、噻嗪类利尿药、磺脲类、碳酸酐酶抑制药及其他磺胺类药 物呈过敏的患者,对本品亦会过敏。 4.治疗中须注意检查以下几项: (1)全血象检查,对接受较长疗程的患者尤为重要。 (2)直肠镜与乙状结肠镜检查,观察用药效果及调整剂量。 (3)治疗中定期尿液检查(每2-3日查尿常规一次)以发现长疗程或高剂量治
空气中氮氧化物(NOx)的测定 (盐酸萘乙二胺分光光度法) 摘要:本文采用盐酸萘乙二胺分光光度法测定室内空气中氮氧化物(NOx),根据配置标准溶液用分光光度计测定其吸光度,绘制标准曲线,分析空气中氮氧化物的含量结果。 关键词:氮氧化物分光光度法含量 综述 大气中氮氧化物主要包括一氧化氮和二氧化氮,其中绝大部分来自于化石燃料的燃烧过程,包括汽车及一切内燃机所排放的尾气,也有一部分来自与生产和使用硝酸的化工厂、钢铁厂、金属冶炼厂等排放的废气中。动物实验证明,氮氧化物对呼吸道和呼吸器官有刺激作用,是导致目前支气管哮喘等呼吸道疾病不断增加的原因之一,二氧化氮与二氧化硫和浮游颗粒物共存时,其对人体的影响不仅比单独二氧化氮对人体的影响严重的多,而且也大于各自污染物之和。对人体的实际影响是各污染物之间的协同作用。因此大气氮氧化物的监测分析是环境保护部门日常工作的重要项目之一。 采用化学发光法测定空气中氮氧化物较以往的盐酸禁乙二胺分光光度法具有灵敏度高、反应速度快、选择性好等特点 ,现已被很多国家和世界卫生组织全球监测系统作为监测氮氧化物的标准方法 ,也已引起我国环保部门的注意和重视 ,相信不久将来 ,此方法也会成为我国环境空气监测氮氧化物的首推方法。 1、实验目的 (1)熟悉、掌握小流量大气采样器的工作原理和使用方法; (2)熟悉、掌握分光光度计的工作原理及使用方法。 (3)掌握大气监测工作中监测布点、采样、分析等环节的工作内容及方法。2、实验原理 ,测定氮大气中的氮氧化物(NOx)主要是一氧化氮(NO)和二氧化氮(NO 2) )氧化管将一氧化氮成二氧化氮。二氧化氧化物浓度时,先用三氧化铬(CrO 3 ),与对氨基苯磺酸起重氧化反应,再与盐氮被吸收在溶液中形成亚硝酸(HNO 2
燃气锅炉低氮改造施工方案
项目名称:xxx燃气锅炉低氮改造工程 编制单位: 编制时间:2016年10月13日 第一章工程概况 1.1工程简介 1.1.1本工程为xxx燃气锅炉低氮改造工程。首先需采购新锅炉,拆除原有锅炉、烟囱、电气设备、部分水暖和燃气管道等;然后安装新锅炉,管道、烟囱重新布置。 1.1.2本项目施工范围 1.锅炉房内原有锅炉、采暖及燃气管线、电气设备、烟囱的拆除; 2.锅炉房设备管道安装,其中有锅炉、管道等安装; 3.电气工程,包括电气动力和电气照明; 4.烟囱安装; 5.燃气工程。 第二章施工准备 在工程正式开工前,需现场勘查,确认实际施工条件和工程量,以利于施工的计划的安排和顺利进行。另一方面应该积极设备供货厂家,了解设备技术参数、基础做法、安装尺寸等,为施工做好充足准备。 2.1临时设施 根据现场实际情况,由甲方指定地点作为临时设施存放和现场预制场地。
2.2临时用电 临时用电由甲方指定的地点挂表接入,现场用电包括生产用电和生活用电,施工用电主要为电焊机、切割机、磨光机、照明设施等。临时用电采用三级配电,两级保护,保证用电安全。 2.3临时用水 临时用水从甲方指定地点接入。主要用于生活用水和施工用水,施工用水主要为土建砌筑用水和混凝土基础养护、打压和冲洗用水等。 2.4生产准备 重点完成工作场地布置、临时水源、临时电源、人员组织及进场、机械设备组织及进场计划、工程材料准备及进场计划、图纸会审及设计交底、现场纵横基准线与标高基准点复核等。 2.5技术准备 施工前要认真研究和熟悉本工程设计文件并进行现场核实,组织有关人员学习设计文件,图纸及其它有关资料,使施工人员明确设计者的设计意图,熟悉设计图纸的细节,对设计文件和图纸进行现场校对。 2.6材料准备 针对本工程的施工内容,在开工之前对工程所需锅炉设备、电气、管道、烟囱等制定采购计划,积极联系资质优良的材料厂家并提出详细的进场计划,严格执行验收与检测程序,确保原材料的质量。 第三章施工进度安排 3.1施工部署 本工程为低氮改造工程,首先得安排设备采购订货,尤其是锅炉的采购,预计需要四十天; 其次,组织施工进场,在甲方指定位置引入水电,安排临时生活设施和现场预制加工场地;
化学预防在AOM/DSS模型基础研究中的启示 虽然利用AOM/DSS模型进行化学预防研究的报道数量是十分有限,但是最近和刚出现的研究表明:炎症相关的结肠癌被认为是一种可预防的疾病。到目前为止的基础研究支持用AOM/DSS诱导的小鼠模型作为一个高度相关的系统,而且这种模型在体内化学预防性干预研究中是有意义的。 下面几个部分是概述各种合成和天然膳食成分抑制AOM/DSS诱导肿瘤形成的能力。 环氧合酶(COX-2)抑制剂 在基础研究和临床研究中COX-2对散发性大肠肿瘤发展过程中的明显促进作用已经非常明确,但是抗炎物质如5-氨基水杨酸(5-ASA)对炎症相关性大肠癌的影响仍然存在争议。5-ASA及其衍生物对大肠肿瘤形成的影响已经在AOM/DSS小鼠模型中得到评估。Grimm et al利用低剂量(100mg/kg)和高剂量(300mg/kg)的5-ASA作用于AOM/DSS小鼠模型,研究其化学预防的效果。在这项研究中,小鼠经单次腹腔注射AOM(8mg/kg)后予以2个循环的DSS处理。 同样,给予另一种5-ASA衍生物,即用水杨酸偶氮磺胺吡啶处理AOM/DSS 小鼠,并与与对照组相比,高度异常增生区域的数量减少了20%。在这项研究中仅评估单剂量注射水杨酸偶氮磺胺吡啶后的效果,但是没有评估这种剂量对病变和炎症的形态学亚型的影响。Kohno et al研究报道称在该疾病发生过程中的发展阶段给予水杨酸偶氮磺胺吡啶烟处理,药物对大肠癌抑制效果相对弱些。这种不一致可能是因为实验计划和小鼠品系方面存在着差异。 Kohno et al也报道了用胆烷酸(UDCA)进行处理小鼠,结果抑制AOM/DSS诱导的大肠癌,也没有引起任何有害的影响。 Clapper et al做了一项研究关于评估5-ASA在模型中抑制炎症相关性大肠肿瘤的能力。研究结果表明长期暴露于5-ASA能够减轻炎症相关性大肠癌的损伤。尽管5-ASA大部分有利的影响都归因于它对抑制环氧合酶和前列素H合酶的能力,但是在这项研究中用AOM/DSS诱导的结肠癌模型对照组小鼠与给予5-ASA 处理该模型的小鼠相进行比较,两组的COX-2(基质细胞、上皮细胞)表达水平没有明显差异,该研究结果提示5-ASA的化学预防活性与COX-2表达水平没有关系。实际上,在先前研究中已经表明5-ASA能抑制缺乏COX-2的DLD1结肠癌细胞增值。 Weber等人研究表明5-ASA具有抑制NF-KB活性的能力。NF-KB与靶基因结合力下降会减少一些因子的表达,如促炎性因子、粘附分子、生长因子、炎症介质及抗凋亡基因。5-ASA 衍生物2-14,即一种新的5-ASA衍生物,该衍生物抑制结肠癌细胞增殖的作用是5-ASA的10倍。增殖的细胞核抗原(PCNA)染色证实2-14抗增殖的效果。通过对比,用2-14处理的正常小鼠的结肠黏膜在PCNA染色下并没有明显的变化,从而证实这种化合物基本上不会影响正常结肠
知识脉络图 走 进 化 学 世 畀第一单元走进化学世界 组戚■(物质都是由元素组成的)?…一…一' ------- ..结构(分子、原子、离子及其内部结构)畅赏觥诡「娄花:谨<性质(物理性质,化学性质〉 化学研究的对 研究化学的重要逸径是科学探究*而其重要手段是化学实验 化学实验 基本操作 变化规律 化学学习的特点是关注 化的过程及其现象“ 物理变化 化学变化T匕合、分解、置换、复分解 f提出间题 诜计实验方案,确定起歩骤 分析与讨论? 结论 I问题及建议 观察 描述和记录 「交徹 I体验 第二单元我们周围的空气 知识脉络图 }本质区别 C认识常用的九种仪器(名称、实物、示盍图,用途及其注育專项)药品 的取用规则(三不匱则、节约原则、剩余药品处理O) r块状固触锻子》 氮气詡)」约占空气总体积的73%。无色、无味、气体。化学性质不活徴,一般巩F他J [不可燃,也不助燃?用作保护气焊接\灯泡、食品等〉° 稀有气体(He Nev Ar等〉;占6 9毬。狼不活激作保护气,通电发不同颜色光。 二氧化碳(CO?):占0.03% o详见第六单元* 其他气体和杂匮:占0.03% ■, f物理性质:无色、 化学性质 (比较活』 泼,具有、氧 化性,是常 用的氧化剂) 无味、气体,宪度比空气略大,不易溶于水。 严、墮匹(白光、放热、澄清石灰水变浑浊)占燃Z、 2C + 02 = 2 CO 占姝 S +°2 =恥藍紫色火焰、放热、刺激性气味气体〉占墩 4P + 5屯=2P£05(^<放热、浓厚白烟、白色固体) 皎---- 3氏+2% = Fe304(火星四射、放热、黑色固体〕〔蔚可2Mg + 02 =刖耀眼白光、放热、白色固体) 4A1+3O£= 2A1E03<耀眼白光、放热、白色固休) 占懈 2H2+ 0 2= 2H2O 勺 占妒 2C0 + 02= 2C0£ VCH4+202=C02 +-2H20. G炎蓝色或蓝色火焰,放熟 厂工业制法:分离液态空气* (发生物理变化〉 (f 2H2O22H20 + 02f 原理f 2KMnO4= K2HnO4 + MnO£ + O£f I 2KC1O3警 2KC1 + 3O£f 片年奘詈J固体加恐制駿气体(棉花人或反王六直 [固体与鮫氏影温下制取气体 妝第皱詈I排水法〔氧气不易溶于水〉 叹耒衣直丫向上排空气法盪气密度比空气大)固慷,耕末状固体(药匙) I定量(托盘天平:精确到0.1Q 「多童-倾倒(标签、容器口) 少堡T用胶头滴管(垂直、悬空*不能横放或倒置) L定壘T壘筒(平稳、平视)(注意规格的选#)(0. lnL) 使用方法(火柴点燃’外焰加热) 注意事项(使用前,使用时、使用后〉 仪器(试管、蒸发皿、烧杯,烧瓶) ?(l/3x短柄、移动、管口〉 固体(管口〉 物质的加热彳 I注意事项(都要预热、外壁擦干等等) r■方法(水淋刷洗、酸洗或洙涤剂〉 洗涤仪器彳注意事项(热的玻璃仪器不能用冷水恋不能用力刷洗等) I玻璃仪器洗涤干净的标准:不聚水滴、不成股流下 实验步骤:查、装、定、点、收、离、熄4 津賁重 丽j 加热固体制氧就并用排半法收集完汪息事坝 [毕.应先播导管.后停住加热等。验满方法;将带 火星木条伸至瓶口、木条复燃。 l检验方法:将带火星木条伸至瓶中,木条复燃。田 抹J供给呼吸:潜水、/tJ H Jct.LhLJMe- Xi-Jknt 1毕?应先撤导管*后停止加热等。 支持側:炼钢、 I 测定空气中氧气的含量; 、医疗、航空等* 、化工生产、宇航等。 .JW足量红磷在盛有空气的巒闭容器中燃烧。 注竜貝体的实验方法、扌桑作注宣事项等。
煤粉燃烧器的分析 摘要:本文分析了几种有代表性的预燃室型煤粉稳燃装置的原理及其特性,并根据其原理提出了几种改进的方案。 关键词:回流区;煤粉锅炉燃烧器;钝体 前言:我国电力行业以劣质媒为主要燃料,这是我国能源政策的要求,同时也是我国煤碳资源分布状况、开采运输条件等所决定的。从经济性和发展趋势看,燃油锅炉和燃用优质煤锅炉所占比重将越来越少,燃用劣质煤锅炉,特别是大容量劣质煤锅炉将越来越多。锅炉燃用劣质煤时普遍存在着火困难、燃烧稳定性差、燃尽率低等问题。对于有些煤种,还存在着炉膛水冷壁结焦、尾部受热面磨损腐蚀、排放物严重污染环境等问题。另一方面,要求越来越多的锅炉机组参加电网调峰。锅炉参加电网调峰时,需要改变负荷和调整运行方式,这就进一步加剧了劣质煤锅炉己存在的问题的严重性。这些问题急需解决,而解决这些问题的重要手段就是研制和开发新燃烧设备。 我们小组从《燃烧学》课本上介绍的两种传统煤粉燃烧稳燃装置出发: 旋流稳燃器: 稳燃原理: 旋流射流的一个最大特点就是射流内部有一个反向回流区,旋转的射流不但从射流外侧卷吸周围的介质,而且还从内部回流区内卷吸介质,而内部回流区的烟气温度很高,能有效助燃和稳燃。 存在的问题: 1.预燃筒壁的积粉和结渣: 不能作为主燃烧器在锅炉运行中长期使用,甚至在短期的锅炉点火启动和低负荷稳燃运行使用时也成问题,因预燃室简壁结焦严重或出现局部温度过高而烧毁预燃室. 2.旋流叶片的磨损: 在长期多变负荷运行过程中,旋流叶片受到高速煤粉流的冲刷,容易磨损变形,造成煤粉流的堵塞,影响旋流效果 3.低负荷条件下工作不稳定,容易熄火,需要喷油助燃。 4.对无烟煤等低挥发分含量煤种的效果不好。 钝体直流稳燃器: 稳燃原理: 钝体是不良流线型体,在大雷诺数下流体流经钝体时在钝体的某个位置会是
溃疡性结肠炎常用药物 …… (1)磺胺类: 40年代开始用磺胺药治疗本病,其中以水杨酸偶氮磺胺吡啶(SASP)效果最佳。口服后易在肠内分解为磺胺吡啶及5-氨基水杨酸,对结肠壁组织有亲合力,起到消炎作用。常用于轻、中型病人。始量为0.5g,每日4次,口服。每隔2~3天增加1g,直到获得疗效。每日总量3~6g,个别可达8g。病情稳定,维持量为1.5~2g/日,持续4周以上,后隔3~5 日减量1次,直到每天服用1~2g为止,至少持续1年。然后考虑停药,以降低复发率。对停药后易复发者,可选最小剂量长期维持治疗。有效率在80%以上。其副作用常有恶心呕吐、头痛、全身不适。或引起白细胞减少、关节痛、皮疹、蛋白尿等。尤其是服用每日超过4g 以上者,副作用明显。其他如琥珀酰磺胺噻唑、肽酰磺胺噻唑及复方新诺明等也可选用。 (2)抗生素: 尤对急性暴发型及中毒作结肠扩张者采用抗生素治疗,用前应做细菌培养。如青霉素类、氯霉素、可林达要素、妥布霉素、新型头孢霉素和先锋霉素均可酌情选用。不宜口服以避免胃肠道刺激症状。 (3)灭滴灵:
每日1200mg,分3~4次口服,3~6个月为一疗程,目前尚未有严重副作用的报道。病程越短疗效越佳,病程在一年以上者,有效率在60%~70%。 (4)激素治疗: 包括糖皮质和促肾上腺皮质激素。本类药物能抑制炎症和免疫反应,缓解毒性症状,近期疗效较好,有效率达90%。另外激素可增加食欲,改善病人情绪。如小剂量强的松15mg,可明显减少复发率。并发腹膜炎或腹腔内脓肿形成者不宜应用。 ①口服皮质激素:病情活动期且病变广泛者,强的松每日40~60mg,分3~4次口服。病情稳定逐渐减量,每日10~15mg,持续半年后停药。在减量过程中或停药后,给以柳酸偶氮磺胺吡啶,以防停药后或减量过程中病情复发。 ②局部给药:病变只限于乙状结肠直肠者,可选:含氢化可的松10mg的肛门栓剂,每日2~ 3次;琥珀酸氢化可的松50~100mg 或强的松龙20~40mg溶于50~100ml液体中,每日1~2次,保留灌肠,同时加用SASP及适量的普鲁卡因或中药煎剂,10~15天为一疗程。灌肠后嘱病人平卧位或俯卧位,左、右、侧位等各15~20分钟,以利药后均匀分布粘膜面上。 ③静脉用药:如暴发型、严重活动型及口服无效者多采用。氢化可的松200~300mg或半琥珀酸钠氢化可的松200~300mg,或α-1-磷酸强的松龙40~60mg,10~14天为一疗程。病情稳定后改口服剂,强的松60mg/日口服。
LHX-高效节能型锅炉煤粉燃烧器 产 品 说 明 书 西安路航机电工程有限公司
一、工作原理: ①燃烧器是锅炉的主要燃烧设备,他通过各种形式,将燃料和燃烧所需要的空气送入炉膛使燃料按照一定的气流结构迅速、稳定的着火:连续分层次供应空气,使燃料和空气充分混合,提高燃烧强度。 煤粉燃烧器就是利用二次风旋转射流形成有利于着火的回流区,以及旋转射流内和旋转射流与周围介质之间的强烈混合来加强煤粉气流的着火特性。旋转射流的工质除了二次风外,还可以有一次风。在二次风蜗壳的入口处装有舌形挡板,用以调节气流的旋流强度,蜗壳煤粉燃烧器的结构简单,对于燃烧烟煤和褐煤有良好的效果,也能用于燃烧贫煤 运行参数:一次风率r1,一、二次风量比,一、二次风速w1和w2及风速比w1 /w2有关。。锅炉燃烧器使用的是气化原理,能使燃油完全 气化,整个燃烧器采用三级点火方式,先用高能点火器点燃轻柴油,再用轻柴油点燃浓煤粉,最后点燃淡煤粉,实现煤粉全部燃烧。 ②为避免工业锅炉积灰过多,本产品采取炉外排渣系统.进入锅炉体内的烟气灰渣尘只占燃料燃烧总的渣量的15%,其中只有小部分沉于锅炉体内,绝大部分烟气尘随烟气流入炉外的收尘系统.工业锅炉本体只需采用压缩空气吹灰系统即可避免锅炉本体人工掏渣。本产品的使用效果与燃油燃气的工业锅炉效果基本一致。
③本产品燃烧煤种与水煤浆燃烧煤种大大放宽,而不需要特优烟煤,而对于一般烟煤、无烟煤、褐煤等甚至劣质杂煤均可.使用其煤粉燃烬率可达到99%,炉渣含碳量为1%左右.炉渣为黄白色是农业化肥和建材的良好的混合材,以达到循环利用的目的.其耗煤量与一般链条锅炉可节省煤耗为25-30%以上。 二.环保技术指标: 由于燃烧系统的彻底改进,相对于链条式的工业锅炉,由燃煤层燃燃烧方式改为煤粉燃烧方式,同时又采用炉外排渣技术。其中燃烧筒(立式、卧式)的捕渣率能达到85%以上,进入工业炉的炉渣量几乎小于15%以上,只有极小部分烟尘沉于炉内,大部分随烟气流进炉后收尘系统.这样极大的减轻了炉尾部的收尘器的收尘量,进入锅炉内的细微烟尘只需要设置采用压缩空气吹灰孔即可,锅炉必须设置专用检查炉门。本公司依据水膜旋风除尘器的基本原理研发成功:文氏管双级脱硫水雾除尘器(不锈钢等钢结构见另外产品说明书),进而彻底淘汰多年普遍使用的水膜麻石除尘器,使锅炉后的除尘系统简单化,而除尘效果更优。经测算:除尘效率可达到99%,粉尘含量≤100mg/m3,SO2≤250~ 300mg/m3, NO2≤400mg/m3,总体排放指标,可达到国家城市二类地区的环保指标。 三.全线实现PLC全自动热工仪表控制系统
为有效解决当前大气污染防治工作进入瓶颈期、氮氧化物浓度持续高位、夏季O 3反弹的问题,按照环保要求,各相关单位按照文件精神开展燃气锅炉及锅炉的氮氧化物改造工作。 持续开展大气污染防治行动,坚决打赢蓝天保卫战,实现环境效益、经济效益和社会效益多赢。至2020年经过3年努力,大幅减少主要大气污染物排放总量,协同减少温室气体排放,燃气锅炉及锅炉均完成低氮改造,进一步明显降低细颗粒物(PM ) 2.5浓度,明显减少重污染天数,明显改善环境空气质量,明显增强人民的蓝天幸福感。 专业从事燃气锅炉低氮改造工作,以下为改造具体方案,可供参考: 改造施工现场 一、改造施工前准备工作如下: 做好施工人员进场准备,办理各项有关手续,按规定搭设临时设施,如现场布置、工地办公室、仓库、材料堆放场地、临时水、电到位,以及生活、卫生设施的落实。 1.对施工图纸进行全面会审,技术复核,熟悉图纸,了解各种工艺技术、材料性能及施工方法。 2.进一步深化施工组织设计,确定施工方案,认真做好对各工种施工前的技术交底。了解消防配套、弱电综合布线以及土建施工单位的工程实施计划,制定相应的配合施工计划。 3.按材料种类分类,做好垃圾清运工作。 4.根据燃烧器厂家提供的锅炉燃烧器图纸和辅机资料对燃烧器及辅机进行检验。对技术资料、图纸进行检查、清点。
5.仔细阅读燃烧器安装使用说明书,查看厂家对燃烧器安装有无特别要求。 6.带施工图纸到安装现场查看,锅炉基础及附件基础是否与图纸相符,施工现场是否与图纸一致。 7.在施工改造前,锅炉房内先进行断水、断电、断气后,确认无安全隐患,再进行原有燃烧器拆除,必要时采用专用工具。 8.在拆除后对燃烧器法兰接口尺寸进行校核,否则重新加工处理。 9.按照安装图纸施工现场配料,材料包括附件、阀门、仪表、管道、和保温材料等。所用的主要材料、设备及半成品应符合国家或相关部门标准,燃烧器厂家应提供国家特检院出具的燃烧器形式试验报告及证书。 10.之后到现场查看是否具备安装条件,包括锅炉运输道路是否畅通,是否具备锅炉就位的条件,现场是否干净,基础硬化情况,以及水电、工人施工居住条件等。 11.落实技术交底工作:组织各班组长及各工种技术业务骨干进行技术交底、质量交底、安全交底及文明施工交底,并逐级下达全体施工人员进行实施。 已改造完毕20t/h燃气锅炉 二、改造施工工艺及步骤: 1、打开锅炉前盖板,拆除旧燃烧机。 2、拆除后,测量盖板上固定燃烧机的螺栓孔。若孔距和低氮燃烧机的孔距相同,就可以直接安装新的燃烧机。若孔距不同,就要采取相应措施把新燃烧机固定在盖板上。
消化系统疾病病人护理测试题及答案 姓名分数 一、单选题(每题2.5分,共100分) 1、消化性溃疡并发大出血急救的中心环节是: A.补液输血 B.禁食输液 C.止血抗休克 D.手术治疗 E.以上均不是 答案:C 2、对消化性溃疡出血不适用的是 A.口服去甲肾上腺素 B.双气囊三腔管压迫 C.冰盐水洗胃 D.甲氰咪胍静脉注射 E.纤维胃镜下高频电灼 答案:B 3、在西方国家急性胰炎的主要病因除因胆道疾病外是 A.大量饮酒 B.暴饮暴食 C.手术创伤 D.药物刺激 E.钙离子 答案:A 4、肝昏迷病人经治疗神志恢复后可逐渐给予蛋白质饮食,最适宜的选择是 A.动物蛋白质
B.蔬菜、水果 C.碳水化合物 D.植物蛋白质 E.每日蛋白质在40g以上 答案:D 5、哪些药物不引起消化性溃疡 A.阿斯匹林 B.消炎痛 C.强的松 D.碳酸氢钠 E.保泰松 答案:D 6、肝硬化腹水病人为何发生呼吸困难A.合并肺瘀血 B.腹水抬高膈肌 C.引起右心衰竭 D.腹水压迫支气管 E.合并呼吸 答案:B 7、下列消化系统疾病的护理哪项不妥A.呕吐后应漱口 B.便秘时可多吃蔬菜水果 C.腹泻时可多吃高蛋白、高脂饮食D.腹胀时可用肛管排气 E.消化道出血后不宜立即灌肠 答案:C 8、肝昏迷昏迷前驱期最突出的表现是 A.表情欣快,定向力减退 B.精神错乱 C.运动失调
D.肌张力,腱反射亢进 E.意识错乱,行为失常 答案:E 9、结核性腹膜炎最多见的病理分型是 A.粘连型 B.渗出型 C.干酪型 D.混合型 E.坏死型 答案:B 10、关于胃窦炎的治疗,最正确的是 A.维生素B12治疗 B.稀盐酸口服 C.铁剂 D.杀灭HP E.肾上腺皮质激素 答案:D 11、急性胰腺炎产生休克的主要原因是:A.低血容量休克 B.心源性休克 C.疼痛引起神经性休克 D.失血性休克 E.过敏性休克 答案:A 12、轻、中度溃性疡性结肠炎治疗首选药物是A.肾上腺皮质激素 B.水杨酸偶氮磺胺吡啶 C.抗生素 D.手术治疗 E.免疫抑制剂
《环境化学实验》报告 实验考核标准及得分
空气中氮氧化物的日变化曲线 一、实验目的与要求 1、了解氮氧化物的具体种类及其来源。 2、掌握氮氧化物测定的基本原理以及实验方法。 3.绘制城市交通干线空气中氮氧化物的日变化曲线。 二、实验方案 1、实验仪器:大气采样器:流量范围0.2L/min、分光光度计(波长540nm)、多孔吸收玻管、比色管(两个)、移液管、洗耳球、比色皿、烧杯。装置连接图见图1 图1 实验装置图 2、实验药品:氮氧化物吸收原液、蒸馏水、亚硝酸钠标准溶液。 3、实验原理:在测定氮氧化物时,先用三氧化铬将一氧化氮等低价氮氧化物氧化成二氧化氮,二氧化氮被吸收在溶液中形成亚硝酸,与对氨苯磺酸发生重氮化反应,再与盐酸萘乙二胺偶合,生成玫瑰红色偶氮染料,用比色法测定。方法的检出限为0.01mg/L(按与吸光度0.01相应的亚硝酸盐含量计)。限行范围为0.03-1.6mg/L。当采样体积为6L时,氮氧化物(一二氧化氮计)的最低检出浓度为0.01ug/m3。盐酸萘乙二胺盐比色法的有关反应式如下:
4、实验步骤: 实验步骤简图: (1)氮氧化物的采集:向一支多孔吸收玻管中加入4mL氮氧化物吸收原液和1mL蒸馏水,接上大气采样器,置于椅子上,以每分钟0.2L流量抽取空气30min。记录采样时间和地点,根据采样时间和流量,算出采样体积。把一天分成几个时间段进行采样7次,分别为10:00~10:30、11:00~11:30、12:00~12:30、13:00~13:30、14:00~14:30、15:00~15:30、16:00~16:30。 (2)标准曲线的绘制:吸取100mg/L的亚硝酸钠标准溶液5mL定容至100mL,再取7支比色管,按下表配制标准系列。
燃气锅炉低氮改造完成河北艺能锅炉有限责任公司
近年来,北京作为国家的首都,为响应国家的号召节能减排,绿色环保,北京在全国率先开展燃气锅炉低氮改造,从氮氧化物产生源头进行控制。从北京市环保局了解到,截至目前,今年北京市已完成锅炉低氮改造约7000台、2.3万蒸吨,年减排氮氧化物4800吨。 北京市环保局介绍,研究表明,燃气锅炉所排放的氮氧化物,在一定条件下,可成为PM2.5的原料。“燃气锅炉低氮改造”可实现氮氧化物的深度减排。 艺能锅炉有限责任公司是“清煤降氮”的主力企业。该企业技术管理部说,2017年企业的清煤降氮工作,改造共涉及锅炉房330座、锅炉1569台、8777.15蒸吨,建设新供热管线12.47公里,共计投资10多亿元。锅炉企业的此番改造,在单个采暖季可直接减少烟气及氮氧化物排放约1844吨。 据锅炉企业介绍,锅炉清煤降氮、实现达标排放,首先是“超净排放”,在北京市的方庄、科丰等供热厂的大型锅炉,采取“超低氮燃烧器+烟气再循环+尾部SCR”等多种组合脱硝方式,燃气锅炉氮氧化物排放低于15毫克/立方米。 艺能锅炉有限责任公司还推广非化石能源供热,燃煤、燃油锅炉实现清洁能源替代,宜气则气、宜电则电,推广空气源热泵、电蓄热等技术应用。 “十三五”期间,将致力于扩大清洁电蓄热、污水源、地热源、光伏等可再生能源利用。 为确保按期完成国家下达的节能目标任务,河北省政府办公厅日前印发《河北省节能“十三五”规划》。“十三五”期间,河北省将本着“强化双控、倒逼转型,严控增量、优化存量,培育市场、创新机制,突出重点、全面推进”原则,着力推进重点领域、重点区域、重点用能单位节能。 根据规划,河北省节能约束性目标是:到2020年,全省能源消费总量控制在32785万吨标准煤以内,万元国内生产总值能耗下降17%;2017年比2012年削减煤炭消费4000万吨,“十三五”期间煤炭消费总量下降10%左右。
喹诺酮类、磺胺类及其他合成抗菌药 一、喹诺酮类 第一代:奈啶酸(1962) 第二代:吡哌酸(1974),仅适用于泌尿道和肠道感染 疗效差、耐药性发展迅速、应用日趋减少 第三代:氟喹诺酮类(1979) 诺氟沙星(氟哌酸)、氧氟沙星、 环丙沙星、左氧氟沙星、依诺沙星、培氟沙星 口服有效、副作用小、耐药性还未大量产生、发展迅速、临床广泛使用 第四代:新氟喹诺酮类 格帕沙星、加替沙星、莫西沙星、克林沙星 【喹诺酮类药物抗菌作用机制】 DNA回旋酶→干扰DNA复制 ◇对细菌选择性高,不良反应少。 (真核细胞不含有DNA回旋酶) 【喹诺酮类共同特点】 1.抗菌谱广、杀菌 ①尤其对革兰阴性杆菌作用强,包括铜绿假单胞菌在内有强大的杀菌作用(环丙沙星最强); ②对部分革兰阳性菌,如金葡菌及产酶金葡菌也有良好抗菌作用(左氧氟沙星最强); ③某些品种(环丙、左氧氟)对结核杆菌、支原体、衣原体及厌氧菌也有作用; ④新喹诺酮类抗革兰阳性菌作用增强,特别是对肺炎球菌和葡萄球菌;莫西沙星还具有其他氟喹诺酮类所缺乏的抗厌氧菌活性。 阳盛阴不衰 霸气抗厌氧 2.口服吸收良好,体内分布广 可进入骨、关节; 氧氟沙星、环丙沙星、培氟沙星可进入脑脊液; 血浆蛋白结合率低; t1/2较长; 多数以原形经肾排泄,尿药浓度高; 部分经肝脏代谢后,由肾排出; 3.不良反应少,耐受性良好 (1)消化道反应:常见恶心、呕吐、食欲减退。氧氟沙星可致伪膜性肠炎。 (2)过敏:皮疹、血管神经性水肿、光敏性皮炎(洛美沙星多见)等。 (3)中枢神经系统:头痛、眩晕等。 不宜用于中枢神经系统病史者,尤其癫痫病史者。 (4)关节软骨损害:所有氟喹诺酮类在在儿童可引起关节痛及肿胀 故不应用于青春期前儿童或妊娠期妇女。
环境空气氮氧化物(一氧化氮和二氧化氮)的测定 盐酸萘乙二胺分光光度法 方法一:高锰酸钾氧化法 1 适用范围 本法规定了测定环境空气中氮氧化物的分光光度法,适用于环境空气中氮氧化物、二氧化氮、一氧化氮的测定。 本标准的方法检出限为μg/10 ml 吸收液。当吸收液总体积为10 ml,采样体积为24 L 时,空气中氮氧化物的检出限为mg/m3。当吸收液总体积为50 ml,采样体积288 L 时,空气中氮氧化物的检出限为mg/m3。当吸收液总体积为10 ml,采样体积为12~24 L 时,环境空气中氮氧化物的测定范围为~mg/m3。 2 方法原理 空气中的二氧化氮被串联的第一支吸收瓶中的吸收液吸收并反应生成粉红色偶氮染料。空气中的一氧化氮不与吸收液反应,通过氧化管时被酸性高锰酸钾溶液氧化为二氧化氮,被串联的第二支吸收瓶中的吸收液吸收并反应生成粉红色偶氮染料。生成的偶氮染料在波长540 nm 处的吸光度与二氧化氮的含量成正比。分别测定第一支和第二支吸收瓶中样品的吸光度,计算两支吸收瓶内二氧化氮和一氧化氮的质量浓度,二者之和即为氮氧化物的质量浓度(以NO2计) 3 试剂和材料 除非另有说明,分析时均使用符合国家标准或专业标准的分析纯试剂和无亚硝酸根的蒸馏水、去离子水或相当纯度的水。必要时,实验用水可在全玻璃蒸馏器中以每升水加入高锰酸钾(KMnO4)和氢氧化钡[Ba(OH)2]重蒸。 冰乙酸。 盐酸羟胺溶液,ρ =~g/L。 硫酸溶液,c(1/2H2SO4)=1 mol/L:取15 ml 浓硫酸(ρ20= g/ml),徐徐加到500 ml 水中,搅拌均匀,冷却备用。 酸性高锰酸钾溶液,ρ (KMnO4)=25 g/L:称取25g 高锰酸钾于1 000 ml 烧杯中,加入500 ml 水,稍微加热使其全部溶解,然后加入 1 mol/L 硫酸溶液()500 ml,搅拌均匀,贮于棕色试剂瓶中。 N-(1-萘基)乙二胺盐酸盐贮备液,ρ (C10H7NH(CH2)2NH2·2HCl)= g/L:称取g N-(1-
2018年河南省燃气锅炉低氮改造奖补方案 河南远大锅炉是国内最早建立起来的工业锅炉生产单位,我公司主要从事燃气锅炉,生物质锅炉,燃煤锅炉等环保锅炉的研发与生产,燃煤锅炉改造以及低氮锅炉改造等。 很多用户对我省的煤改气,燃气锅炉低氮改造项目不是很清晰,下面简答介绍一下。 为落实国家财政部、环保部《大气污染防治专项资金管理办法》,省财政厅、省环保厅《河南省省级大气污染防治专项资金管理办法》,推动我市大气污染防治工作,进一步改善环境空气质量,市政府决定对2018年度大气污染防治治理项目实施资金奖励或补助,现结合我市实际,制定本方案。 一、奖补原则和范围 (一)奖补原则 “早完成、严标准、多减排、多奖励”原则。 (二)奖补范围 1.严于国家或地方污染物排放标准实施的大气污染工程 治理示范工程改造项目; 2.严于国家、省要求的结构调整项目; 3.在工程治理、节能改造等领域严于国家、省有关要求 的、具有前瞻意义的试点工程项目或科研攻关项目; 4.严于国家、省有关要求的,鼓励类清洁能源结构改造 项目。 (三)资金来源 奖补资金来源中央及省财政拨给本市可用于大气污染防治项目的资金,不足部门由市级财政承担。 二、奖补标准 (一)燃煤锅炉拆改。10蒸吨以上燃煤锅炉拆改实施逐年递减的资金奖补方式,对2018年10月底前(含2016年、2017
年)完成拆改的燃煤锅炉,给予不低于6万元/蒸吨奖补;对2019 年10 月底前完成拆改的燃煤锅炉,给予不低于4 万元/蒸吨奖补。 2016 年、2017 年按期完成拆除任务的10 蒸吨以下(含10 蒸吨)燃煤锅炉给予不低于2万元/蒸吨奖补。 (二)煤气发生炉拆改。2018年10月底前煤气发生炉(含2016 年、2017 年)完成实施拆除或改用清洁能源的,给予拆除单位每台10万元奖补。 (三)生物质锅炉拆改。2018年10月底前(含2016年、2017 年)生物质锅炉实施拆改的,给予不低于2 万元/蒸吨资金奖补。 (四)重点行业示范工程建设。 1.2018 年9 月底前,完成烟气超低排放示范工程建设,污染物排放浓度颗粒物≤10毫克/立方米、二氧化硫≤50毫克/立方米、氮氧化物≤100毫克/立方米的熟料生产水泥企业,市级财政按照设备投资额的15%进行奖补,最高不超过500万/家。 2.2018 年9 月底前,完成烟气超低排放改造示范工程建设,煅烧、焙烧工序烟尘、二氧化硫、氮氧化物排放浓度要分别不高于10毫克/立方米、35毫克/立方米、50毫克/立方米的碳素企业,市级财政按照设备投资额的15%进行奖补,最高不超过500万/家。 3.2018 年9 月底前,完成烟气超低排放改造示范工程建设,烟尘、二氧化硫、氮氧化物排放浓度要分别不高于10毫 克/立方米、35毫克/立方米、50毫克/立方米的生活垃圾焚烧发电、医疗废物、危险废物焚烧处置等设施,市级财政按照设备投资额的15%进行奖补,最高不超过500万/家。 (五)天然气锅炉低氮改造项目。2018年6月底前,完成低氮改造示范工程建设,氮氧化物排放浓度要不高于30毫克/立 方米的天然气锅炉,市级财政按照设备投资额的40%进行奖补; 2018 年9 月底前,完成低氮改造示范工程建设,氮氧化物排放浓度要不高于30毫克/立方米的天然气锅炉,市级财政按照设备投资额的30%进行奖补;2019年4月底前,完成低氮改造工程建设,氮氧化物排放浓度要不高于30毫克/立方米的天然气锅炉,市级财政按照设备投资额的15%进行奖补。