2012 Studies Mid Exam
- 格式:doc
- 大小:3.52 MB
- 文档页数:24
考试种种考试examination(常简写为exam)或test 期中考试mid-term examination期终考试final exam, terminal exam 口语考试oral exam(或test)笔试written exam补考make-up exam统考unified examination高考college entrance examination 面试interview(多指应聘人员的面试)初试preliminary tests小考quiz(多用于美国)普通水平考试0 level examination 分班考试placement tests成绩考试achievement tests水平考试proficiency tests学能(潜能)考试aptitute tests瞻前性考试tests for prospective purposes 诊断性考试diagnostic tests回顾性考试tests for retrospective purposes评估性考试assessment tests备考性考试tests in preparative for another test交际性考试communicative tests 基准(常模)参照性考试norm-referenced tests 语用性考试pragmatic tests目标(标准)参照性考试criterion-referenced tests主观性考试subjective tests客观性考试objective tests速度考试speed tests难度考试power tests能力考试ability tests自适性考试adaptive tests大规模考试large-scaled tests小范围考试small-scaled tests公共考试public tests直接性考试direct/performance tests 强制性考试compulsory tests自愿性考试voluntary tests分级考试graded tests升学考试matriculation tests竞赛性考试contest tests标准化考试standardized tests内部考试restricted tests随堂考试classroom tests进度考试progressive tests期中考试mid-term tests期末考试final tests形成性考试formative tests总结性考试summative tests笔试型考试written tests口语型考试oral tests公开考试(开卷考试) open tests或open-book examination。
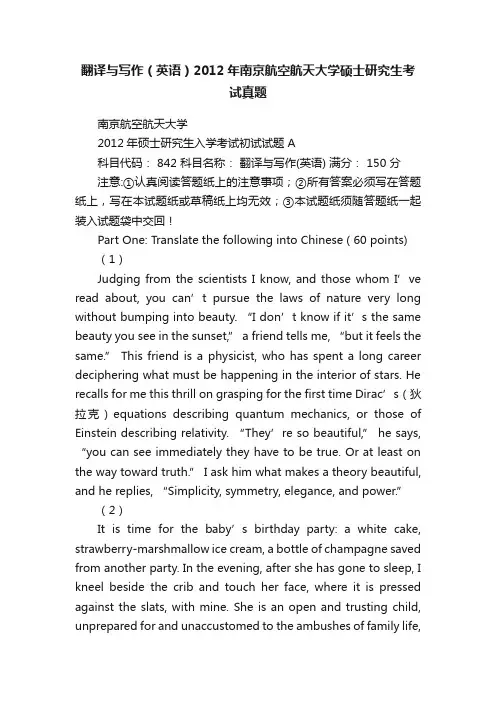
翻译与写作(英语)2012年南京航空航天大学硕士研究生考试真题南京航空航天大学2012年硕士研究生入学考试初试试题 A科目代码: 842 科目名称:翻译与写作(英语) 满分: 150 分注意:①认真阅读答题纸上的注意事项;②所有答案必须写在答题纸上,写在本试题纸或草稿纸上均无效;③本试题纸须随答题纸一起装入试题袋中交回!Part One: Translate the following into Chinese ( 60 points)(1)Judging from the scientists I know, and those whom I’ve read about, you can’t pursue the laws of nature very long without bumping into beauty. “I don’t know if it’s the same beauty you see in the sunset,” a friend tells me, “but it feels the same.” This friend is a physicist, who has spent a long career deciphering what must be happening in the interior of stars. He recalls for me this thrill on grasping for the first time Dirac’s(狄拉克)equations describing quantum mechanics, or those of Einstein describing relativity. “They’re so beautiful,” he says, “you can see immediately they have to be true. Or at least on the way toward truth.” I ask him what makes a theory beautiful, and he replies, “Simplicity, symmetry, elegance, and power.”(2)It is time for the baby’s birthday party: a white cake, strawberry-marshmallow ice cream, a bottle of champagne saved from another party. In the evening, after she has gone to sleep, I kneel beside the crib and touch her face, where it is pressed against the slats, with mine. She is an open and trusting child, unprepared for and unaccustomed to the ambushes of family life,and perhaps it is just as well that I can offer her little of that life.I would like to give her more. I would like to promise her that she will grow up with a sense of her cousins and of rivers and of her great-grandmother’s teacups, would like to pledge her a picnic on a river with fried chicken and her hair uncombed, would like to give her home for her birthday, but we live differently now and I can promise her nothing like that.(3)I desire urbanity. I believe this is the rarest quality in the world. Indeed, it probably does not exist anywhere. A really urbane person — a mortal open-minded and affable to conviction of his own shortcomings and errors, and unguided in anything by irrational blind prejudices — could not but in a world of men and women be regarded as a monster. We are all of us, as if by instinct, intolerant of that which is unfamiliar: we resent its impudence, and very much the same principle which prompts small boys to jeer at a straw-hat out of season induces their elders to send missionaries to the heathen.Part Two: Translate the following into English (40 points)(1)从小学到中学,所修习的无非是一些普通的基本知识。
屯溪一中2012-2013学年高一上学期期中考试英语试题第一部分:听力(共两节,满分30分)第一节(共5小题;每小题1.5分,满分7.5分)听下面5段对话。
每段对话后有一个小题,从题中所给的A、B、C三个选项中选出最佳选项,并标在试卷的相应位置,听完每段对话后,你都有10秒钟的时间来回答有关小题和阅读下一小题,每段对话仅读一遍。
1. When is the man’s mid-term exam?A. In one week.B. In two weeks.C. In two days.2. How was the weather yesterday?A. Rainy.B. Sunny.C. Snowy.3. What are the two speakers doing?A. Having dinner.B. Cooking.C. Clearing the table.4. What did the woman buy for her mother?A. A necklace.B. A handbag.C. A dress.5. What will the woman do this weekend?A. Visit her grandparents.B. Travel with the man.C. Go out playing with Jenny.第二节(共15小题;每小题1.5分,满分22.5分)听下面5段对话或独白。
每段对话或独白后有几个小题,从题中所给的A、B、C三个选项中选出最佳选项,并标在试卷的相应位置。
听每段对话或独白前,你将有时间阅读各个小题,每小题5秒钟;听完后,各小题将给出5秒钟的作答时间,每段对话或独白读两遍。
听第6段材料,回答第6和第7题。
6. Who answered the man’s phone yesterday morning?A. Lily’s brother.B. Lily’s nephew.C. Ted.7. What did Ted receive in the end?A. 20 dollars.B. Some sweets.C. A phone.请听第7段材料,回答第8和第9题。

2012考研英语二真题2012考研英语二真题文字版(网络版)Section1 Use of EnglishDirections:Millions of Americans andforeigners see GI.Joe as a mindless war toy ,the symbol of American military adventurism, but that’s not how it used to be .To the men and women who 1 )in World War II and the people they liberated ,the GI.was the 2) man grown into hero ,the pool farm kid torn away from his home ,the guy who 3) all the burdens ofbattle ,who slept in cold foxholes,who went without the 4)of food and shelter ,who stuck it out and drove back the Nazi reign ofmurder.this was not a volunteer soldier ,not someone well paid ,5) an averageguy ,up 6 )the best trained ,best equipped ,fiercest ,most brutalenemies seen in centuries.His name is not much.GI. isjust a military abbreviation 7) Government Issue ,and it was onall of the article 8) to soldiers .AndJoe? A common name for a guy who never 9) it to the top .Joe Blow ,Joe Magrac …a workingclass name.The United States has 10)had a president or vicepresident or secretary of state Joe.GI .joe had a (11)career fightingGerman ,Japanese ,and Korean troops . He appers as acharacter ,or a (12 ) of american personalities, in the 1945 movie The Story ofGI. Joe, based on the last days of war correspondent Ernie Pyle. Some of thesoldiersPyle(13)portrayde themselves in the film. Pyle was famous for coveringthe (14)side of the warl, writing about the dirt-snow –and-mud soldiers, nothow many miles were(15)or what towns were captured or liberated, Hisreports(16)the “willie” cartoons of famed Stars and Stripes artist BillMaulden. Both men(17)the dirt andback [D]passed down9.[A]pushed [B]got [C]made [D]managed10.[A]ever [B]never [C]either [D]neither11.[A]disguised [B]disturbed [C]disputed[D]distinguished12.[A]company [B]collection [C]community[D]colony13.[A]employed [B]appointed[C]interviewed [D]questioned14.[A]ethical [B]military [C]political[D]human15.[A]ruined [B]commuted[C]patrolled [D]gained16.[A]paralleled [B]counteracted[C]duplicated [D]contradicted17.[A]neglected [B]avoided [C]emphasized[D]admired18.[A]stages [B]illusions [C]fragments[D]advancea19.[A]With [B]To [C]Among [D]Beyond20.[A]onthe contrary [B] by this means[C]from the outset [D]at that pointSection II Resdiong ComprehensionPart ADirections:Read the following four texts. answer thequestion after each text by choosing A,B,C orD. Mark your answers on ANSWERSHEET1.(40 points)Text 1Homework has never been terribly popular with students and even many parents, but in recent years it has been particularly scorned. School districts across the country, most recently Los Angeles Unified, are revising their thinking on his educational ritual. Unfortunately, L.A. Unified has produced an inflexible policy which mandates that with the exception of some advanced courses,homework may no longer count for more than 10% of astudent’s academic grade.This rule is meant to address the difficulty that students from impoverished or chaotic homes might have in completing their homework. But the policy is unclear and contradictory. Certainly, no homework should be assigned that students cannot do without expensive equipment. But if the district is essentially giving a pass to students who do not do their homework because of complicated family lives, it is going riskily close to the implication that standards need to be lowered for poor children.District administrators say that homework will still be a pat of schooling: teachers areallowed to assign as much of it as they want. But with homework counting for nomore than 10% of their grades, students can easily skip half their homework andsee vey little difference on their report cards. Some students might do well onstate tests without completing theirhomework, but what about the students whoperformed well on the tests and did their homework? It is quite possible that the homework helped. Yet rather than empowering teachers to find what worksbest for their students, the policy imposes a flat,across-the-board rule.At the same time, the policy addresses none of the truly thorny questions abouthomework. If the district finds homework to be unimportant to its students’academic achievement, it should move to reduce or eliminate the assignments,not make them count for almost nothing. Conversely, if homework does nothing toensure that the homework students are not assigning more than they are willingto review and correct.The homework rules should be put on hold while the school board, which is responsiblefor setting educational policy, looks into the matter and conducts publichearings. It is not too late for L.A. Unified to do homework right.21.It is implied in paragraph 1 that nowadays homework_____.[A]is receiving more criticism[B]is no longer an educational ritual[C]is not required for advanced courses[D]is gaining more preferences22.L.A.Unified has made the rule about homework mainly because poor students_____.[A]tend to have moderate expectations for their education[B]have asked for a different educational standard[C]may have problems finishing their homework[D]have voiced their complaints about homework23.According to Paragraph 3,one problem with the policy is that it may____.[A]discourage students from doing homework[B]resultin students' indifference to their report cards[C]undermine the authority of state tests[D]restrict teachers' power in education24.As mentioned in Paragraph 4, a key question unanswered about homework is whether______.[A] it should be eliminated[B]it counts much in schooling[C]it places extra burdens on teachers[D]it is important for grades25.A suitable title for this text couldbe______.[A]Wrong Interpretation of an Educational Policy[B]A Welcomed Policy for Poor Students[C]Thorny Questions about Homework[D]A Faulty Approach to HomeworkText2Prettyin pink: adult women do not rememer being so obsessed with the colour, yet itis pervasive in our young girls’ lives. Tt is not that pink is intrinsicallybad, but it is such a tiny slice of the rainbow and, though it may celebrategirlhood in one way, it also repeatedly and firmly fuses girls’ identity toappearance. Then it presents that connection, even among two-year-olds, between girls as not only innocent but as evidence of innocence. Looking around, Idespaired at the singular lack of imagination about girls’ lives and interests.Girls’attraction to pink may seem unavoidable, somehow encoded in their DNA, butaccording to Jo Paoletti, an associate professor of American Studies, it isnot. Childrenwere not colour-coded at all until the early 20th century: in theera before domestic washing machines all babies wore white as a practicalmatter, since the only way of getting clothes clean was to boil them. What’smore, both boys and girls wore what were thought of as gender-neutraldresses.When nursery colours were introduced, pink was actually considered themore masculine colour, a pastel version of red, which was associated withstrength. Blue, with its intimations of the Virgin Mary, constancy andfaithfulness, symbolised femininity. It was not until the mid-1980s, whenamplifying age and sex differences became a dominant children’s marketingstrategy, that pink fully came into its own, when it began to seem inherentlyattractive to girls, part of what defined them as female, at least for thefirst few critical years.I hadnot realised how profoundly marketing trends dictated our perception of what isnatural to kins, including our core beliefsabout their psychologicaldevelopment. Take the toddler. I assumed that phase was something expertsdeveloped after years of research into children’s beh aviour: wrong. Turnsout,acdording to Daniel Cook, a historian of childhood consumerism, it waspopularised as a marketing trick by clothing manufacrurers in the 1930s.Tradepublications counselled department stores that, in order to increase sales,they should create a “third stepping stone” between infant wear and older kids’clothes. Tt was only after “toddler”became a common shoppers’ term that itevolved into a broadly accepted developmental stage. Splitting kids, oradults,into ever-tinier categories has proved a sure-fire way to boost profits.And one of the easiest ways to segment a market is to magnify genderdifferences – or invent them where they did not previously exist.26.Bysaying "it is...the rainbow"(Line 3, Para.1),the author meanspink______.[A]should not be the sole representation of girlhood[B]should not be associated with girls' innocence[C]cannot explain girls' lack of imagination[D]cannot influence girls' lives and interests27.According to Paragraph 2, which of the following is true of colours?[A]Colours are encoded in girls' DNA.[B]Blue used to be regarded as the colour for girls.[C]Pink used to be a neutral colour in symbolising genders.[D]White is prefered by babies.28.The author suggests that our perception of children's psychological development wasmuch influenced by_____.[A]the marketing of products for children[B]the observation of children's nature[C]researches into children's behavior[D]studies of childhood consumption29.Wemay learn from Paragraph 4 that department stores were advised to_____.[A]focuson infant wear and older kids' clothes[B]attach equal importance to different genders[C]classify consumers into smaller groups[D]create some common shoppers' terms30.It can be concluded that girls' attraction to pink seems to be____.[A]clearly explained by their inborn tendency[B]fully understood by clothing manufacturers[C]mainly imposed by profit-driven businessmen[D]well interpreted by psychological expertsText 3In 2010. a federal judge shook America's biotech industry to its core. Companies had won patents for isolated DNA for decades-by 2005 some 20% of human genes were parented. But in March 2010 a judge ruled that genes were unpatentable. Executives were violently agitated. The Biotechnology Industry Organisation (BIO), a trade group, assured members that this was just a “preliminary step” in a longer battle.On July 29th they were relieved, at least temporarily. A federal appeals court overturned the prior decision, ruling that Myriad Genetics could indeed holb patents to two genss that help forecast a woman's risk of breast cancer. Thechief executive of Myriad, a company in Utah,said the ruling was a blessing to firms and patients alike.But as companies continue their attempts at personalised medicine, the courts will remain rather busy. The Myriad case itself is probably not over Critics make three main arguments against gene patents: a gene is a product of nature, so it may not be patented; gene patents suppress innovation rather than reward it; and patents' monopolies restrict access to genetic tests such as Myriad's. A growing number seem to st year a federal task-force urged reform for patents related to genetic tests. In October the Department of Justice filed a brief in the Myriad case, arguing that an isolated DNA molecule “is no less a product of nature... than are cotton fibres that have been separated from cotton seeds. ”Despite the appeals court's decision, big questions remain unanswered. For example, it isunclear whether the sequencing of a whole genome violates the patents of indivi dual genes within it. The case may yet reach the Supreme Court.ASthe industry advances ,however,other suits may have an evenpanies are unlikely to file many more patents for human DNAmolecules-most are already patented or in the public domain .firms are now studying how genes intcract,looking forcorrelations that might be used to determine the causes of disease or predict adrug’s efficacy,companies are eager to win patents for ‘connecting thedits’,expaains hans sauer,alawyer for the BIO.Their success may be determined by a suitrelated to this issue, brought by the Mayo Clinic, which the Supreme Court willhear in its next term. The BIO rtcently held a convention which includedseddions to coach lawyers on the shifting landscape for patents. Each meetingwaspacked.31.it canbe learned from paragraph I that the biotech companies would like-----A.their executives to be activeB.judges to rule out gene patentingC.genes to be patcntablcD.the BIO to issue a warning32.those who are against gene patents believe that----A.genetic tests are not reliableB.only man-made products are patentableC.patents on genes depend much on innovatiaonD.courts should restrict access to gene tic tests33.according to hans sauer ,companies are eager to win patents for----A.establishing disease comelationsB.discovering gene interactionsC.drawing pictures of genesD.identifying human DNA34.By saying “each meeting waspacked”(line4,para6)the author means that -----A.the supreme court was authoritativeB.the BIO was a powerful organizationC.gene patenting was a great concernwyer swere keen to attend conventiongs35.generallyspeaking ,the author’s attitude toward gene patenting is----A.criticalB.supportiveC.scornfulD.objectiveText 4The great recession may be over, but thisera of high joblessness is probably beginning. Before it ends,itwill likely change the life course and character of a generation of youngadults. And ultimately, it is likely to reshape our politics,our culture, andthe character of our society for years.Noone tries harder than the jobless to find silver linings in this nationaleconomic disaster. Many said that unemployment, while extremely painful, hadimproved them in some ways; they had become less materialistic and morefinancially prudent; they were more aware of the struggles of others. Inlimited respects, perhaps the recession will leave society better off. At thevery least, it has awoken us from our national fever dream of easy riches andbiggerhouses, and put a necessary end to an era of reckless personal spending.Butfor the most part, these benefits seem thin, uncertain, and far off. In TheMoral Consequences of Economic Growth, the economic historian Benjamin Friedmanargues that both inside and outside the U.S. ,lengthy periods of economicstagnation or decline have almost always left society more mean-spirited andless inclusive, and have usually stopped or reversed the advance of rights andfreedoms. Anti-immigrant sentiment typically increases, as does conflictbetween races and classes.Incomeinequality usually falls during a recession, but it has not shrunk in thisone,. Indeed, this period of economic weakness may reinforce class divides, anddecrease opportunities to cross them--- especially for young people. Theresearch of Till Von Wachter, the economist in Columbia University, suggeststhat not all people graduating into arecession see their life chances dimmed:those with degrees from elite universities catch up fairly quickly to wherethey otherwise would have been if they had graduated in better times; it is themasses beneath them that are left behind.In the internet age, it is particularlyeasy to see the resentment that has always been hidden winthin Americansociety. More difficult, in the moment , is discerning precisely how these leantimes are affecting society’s character. In many respects, the U.S. was moresocially tolerant entering this resession than at any time in its history, anda variety of national polls on social conflict since then have shown mixedresults. We will have to wait and see exactly how these hard times will reshapeour social fabric. But they certainly it, and all the more so the longer theyextend.36.Bysaying “to find silver linings”(Line 1,Para.2)the author suggest that thejobless tryto___.[A]seek subsidies from the govemment[B]explore reasons for the unermployment[C]make profits from the troubled economy[D]look on the bright side of the recession37.Accordingto Paragraph 2,the recession has made people_____.[A]realize the national dream[B]struggle against each other[C]challenge their lifestyle[D]reconsider their lifestyle38.BenjaminFriedman believe that economic recessions may_____.[A]impose a heavier burden on immigrants[B]bring out more evils of human nature[C]Promote the advance of rights andfreedoms[D]ease conflicts between races and classes39.Theresearch of Till Von Wachther suggests that in recession graduates from eliteuniversities tend to _____.[A]lag behind the others due to decreased opportunities[B]catch up quickly with experienced employees[C]see their life chances as dimmed as the others’[D]recover more quickly than the others40.Theauthor thinks that the influence of hard times on society is____.[A]certain[B]positive[C]trivial[D]destructivePart BDirections:Readthe following text and answer the questions by finding information from theleft column that corresponds to each of the marked details given in the rightcolumn. There are two extra choices in the right column. Mark your answers onANSWER SHEERT 1.(10 points)“Universal history, the history of what man has accomplishedin this world, is at bottom the History of the Great Men who have worked here,”wrote the Victorian sage Thomas Carlyle. Well, not any more it is not.Suddenly,Britain looks to have fallen out with its favourite historical form. This couldbe no more than a passing literary craze, but it also points to a broader truthabout how we now approach the past: less concerned with learning fromforefathers and more interested in feelingtheir pain. Today, we want empathy,not inspiration.Fromthe earliest days of the Renaissance, the writing of history meant recountingthe exemplary lives of great men. In 1337, Petrarch began work on his ramblingwriting De Viris Illustribus – On Famous Men, highlighting the virtus (orvirtue) of classical heroes. Petrarch celebrated their greatness in conqueringfortune and rising to the top. This was the biographical tradition whichNiccolo Machiavelli turned on its head. In The Prince, the championed cunning,ruthlessness, and boldness, rather than virtue, mercy and justice, as theskills of successful leaders.Over time, the attributes ofgreatness shifted. The Romantics commemorated the leading painters and authorsof their day, stressing the uniqueness of the artist's personal experiencerather than public glory. By contrast, the Victorian author Samual SmileswroteSelf-Help as a catalogue of the worthy lives of engineers , industrialists andexplores . "The valuable examples which they furnish of the power ofself-help, if patient purpose, resolute working and steadfast integrity,issuing in the formulation of truly noble and many character,exhibit,"wrote Smiles."what it is in the power of each to accomplishfor himself"His biographies of James Walt, Richard Arkwright and Josiah Wedgwood were held up as beaconsto guide the working man through his difficult life.Thiswas all a bit bourgeois for Thomas Carlyle, who focused his biographies on thetruly heroic lives of Martin Luther, Oliver Cromwell and Napoleon Bonaparte.These epochal figures represented lives hard to imitate, but to be acknowledgedas possessing higher authority than mere mortals.Communist Manifesto. For them,history did nothing, it possessed no immense wealth norwaged battles:“It isman, real, living man who does all that.” And history should be the story ofthe masses and their record of struggle. As such, it needed to appreciate theeconomic realities, the social contexts and power relations in which each epochstood. For:“Men make their own history, but they do not make it just as theyplease; they do not make it under circumstances chosen by themselves, but undercircumstances directly found, given and transmitted from the past.”Thiswas the tradition which revolutionized our appreciation of the past. In placeof Thomas Carlyle, Britain nurtured Christopher Hill, EP Thompson and EricHobsbawm. History from below stood alongside biographies of great men. Wholenew realms of understanding — from gender to race to cultural studies — wereopened up as scholars unpicked the multiplicity of lost societies. And ittransformed public history too: downstairs became just as fascinating asupstairs.[A] emphasized the virtue of classical heroes.41. Petrarch[B] highlighted the public glory of the leading artists.42. Niccolo Machiavellli[C] focused on epochal figures whose lives were hard to imitate.43. Samuel Smiles[D] opened up new realms of understanding the great men in history.44. Thomas Carlyle[E] held that history should be the story of the masses and their record of struggle.45. Marx and Engels[F] dismissed virtue as unnecessary for successful leaders.[G] depicted the worthy lives of engineer industrialists and explorersSection III Translation46.Directions:Translate the following text from Englishinto Chinese.Write your translationon ANSWER SHEET2.(15 points)When people in developing countries worryabout migration,they are usually concerned at the prospect of ther best and brightest departure toSilicon Valley or to hospitals anduniversities in the developed world ,These are the kind of workers that countries like Britian ,Canada and Australia try to attract byusing immigration rules that privilegecollege graduates .Lots of studies have foundthatwell-educated people from developing countries are particularly likely to emigrate .A big survey of Indian householdsin 2004 foundthat nearly 40%ofemigrants had more than a high-school education,compared with around 3.3%of all Indians over the age of25.This "brain drain "has longbothered policymakers in poor countries ,They fear that it hurts their economies ,depriving them ofmuch-needed skilled workers who could have taught at their universities ,worked in their hospitals and come up withclever new products for their factoriesto make .10.0%Section IV WritingPart A47.DirectionsSupposeyou have found something wrong with the electronic dictionary that you bought from an onlin store the other day ,Write an email to the customerservice center to1)makea complaint and2)demanda prompt solutionYoushould write about 100words on ANSERE SHEET 2Donot sign your own name at the end of the letter ,Use "zhang wei"instead .48 、write an essay based on the followingtable .In your writing you should1)describe the table ,and2)give your commentsYou should write at least150words(15points)某公司员工工作满意度调查满意不清楚不满意年龄-------满意度16.7% 50.0% 33.3%小于等于40岁41-50岁0.0% 36.0% 64.0%大于50岁40.0 50.0% 10.0%。
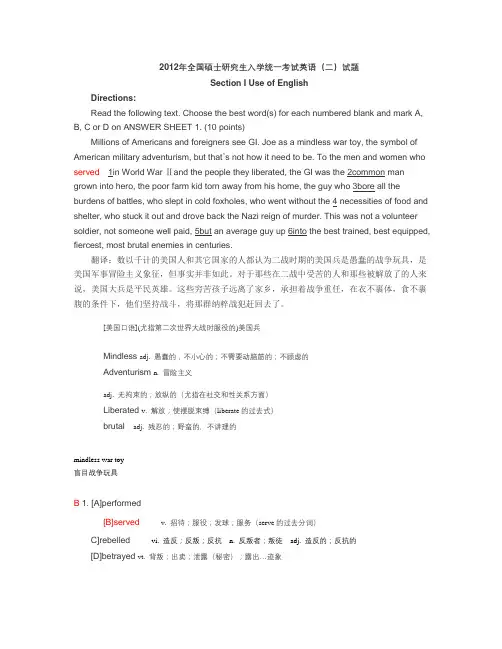
2012年全国硕士研究生入学统一考试英语(二)试题Section I Use of EnglishDirections:Read the following text. Choose the best word(s) for each numbered blank and mark A, B, C or D on ANSWER SHEET 1. (10 points)Millions of Americans and foreigners see GI. Joe as a mindless war toy, the symbol of American military adventurism, but that’s not how it need to be. To the men and women who served 1in World War Ⅱand the people they liberated, the GI was the 2common man grown into hero, the poor farm kid torn away from his home, the guy who 3bore all the burdens of battles, who slept in cold foxholes, who went without the 4 necessities of food and shelter, who stuck it out and drove back the Nazi reign of murder. This was not a volunteer soldier, not someone well paid, 5but an average guy up 6into the best trained, best equipped, fiercest, most brutal enemies in centuries.翻译:数以千计的美国人和其它国家的人都认为二战时期的美国兵是愚蠢的战争玩具,是美国军事冒险主义象征,但事实并非如此。
2012年6月六级真题Directions: In this part. You will have 15 minutes to go over the passage quickly and answer the questions on Answer Sheet 1. For questions 1-7, choose the best answer from the four choices marked A)、B)、C)and D). For questions 8-10, complete the sentences with the information given in the passage.The Three-Year Solution Hartwick College, a small liberal-arts自由教育school in upstate New York, makes New York, makes this offer to well prepared students: earn your undergraduate degree in three years instead of four, and save about 543,000—the amount of one year’s tuition学费and fees规费. A number of innovative colleges are making the same offer to students anxious焦虑的about saving time and money. That’s both an opportunity and a warning for the best higher-education system in the world.The United States has almost all of the world’s best universities. A recent Chinese survey调查ranks 35 American universities among the top 50, eight among the top 10. Our research universities have been the key to developing the competitive advantages that help Americans produce 25% of all the world’s wealth. In 2007, 623,805 of the world’s bright est students were attracted to American universities.Yet, there are signs of peril 危险within American higher education. U.S. colleges have to compete in the marketplace. Students may choose among 6,000 public, private, nonprofit非盈利, for profit, or religious宗教的institutions机构of higher learning. In addition此外, almost all of the 532 billion the federal government联邦政府provides for university research is awarded受赏competitively.But many colleges and universities are stuck in the past. For instance例如, the idea of the fall-to-spring “school year”hasn’t changed much since before the American Revolution, when wewere a summer stretch no longer makes sense. Former前任的George Washington University president Stephen Trachtenberg estimates估算that a typical college uses its facilities设备for academic purposes目的、用途a little more than half the calendar日历year.“While college facilities sit idle闲置, they continue to generate maintenance维护expenses that contribute to the high cost of running a college,” he has written.Within academic departments部门, tenure终身职位,combined with age-discrimination歧视、辨别laws, makes faculty系、科turnover流通—critical关键的for a university to remain current趋势、流通in changing times—difficult. Instead of protecting speech and encouraging diversity and innovative thinking, the tenure system often stifles压制them: younger professors must win the approval认同of established已建立的colleagues for tenure, encouraging like-mindedness类似心理and sometimes inhibiting抑制the free flow of ideas.Meanwhile, tuition学费has soared飙升, leaving graduating students with unprecedented空前的loan借、贷款debt. Strong campus校园presidents to manage these problems are becoming harder to find, and to keep. In fact, students now stay on campus almost as long as their presidents. The average amount数量of time students now take to complete an undergraduate degree has stretched to six years and seven months as students interrupted by work, inconvenienced by unavailable classes, or lured诱惑by one more football season find it hard to graduate.Congress国会has tried to help students with college costs through Pell Grants and other forms of tuition support. But some of their fixes have made the problem worse. The stack堆of congressional regulations条例、规程governing federal student grants津贴and loans now stands twice as tall as I do. Filling out填these forms consume 7% of every tuition dollar.For all of these reasons, some colleges like Hartwick are rethinking the old way of doing things and questioning decades-old assumptions设想、假定about what a college degree学位means. For instance, why does it have to take four years to earn a diploma毕业证? This fall, 16 first-year students and four second-year students at Hartwick enrolled in参加the school’s new three year degree program. According to the college, the plan is designed for high-ability, highly motivated studentwho wish to save money or to move along more rapidly迅速的toward advanced degrees.By eliminating消除that extra year, three year degree students save 25% in costs. Instead of taking 30 credits学分a year, these students take 40. During January, Hartwick runs a four week course during which students may earn three to four credits on or off campus, including a number of international sites. Summer courses are not required必需的, but a student may enroll in them—and pay extra. Three year students get first crack破裂at course registration注册、登记. There are no changes in the number of courses professors teach or in their pay.The three-y ear degree isn’t a new idea. Geniuses have always breezed through轻松做. Judson College, a 350-student institution in Alabama, has offered students a three-year option for 40 years. Students attend “short terms” in May and June to earn the credits required fo r graduation. Bates College in Maine and Ball State University in Indiana are among other colleges offering three-year options.Changes at the high-school level阶段、水平are also helping to make it easier for many students to earn their undergraduate degrees in less time. One of five students arrives at college today with Advanced Placement大学预修课(AP) credits amounting to a semester学期or more of college level work. Many universities, including large schools like the University of Texas, make it easy for these AP students to graduate faster.For students who don’t plan to stop with an undergraduate degree本科学历, the three-year plan may have an even greater appeal呼吁、吸引力. Dr. John Sergent, head of Vanderbilt University Medical School’s residency 住院医生program, enrolled in Vanderbilt’s undergraduate college in 1959. He entered medical school after only three years as did four or five of his classmates.” My first year of medical school counted as my senior毕业year, which meant I had to take three to four labs实验室a week to get all my sciences in. I basically skipped my senior year,” says Sergent. He still had time to be a student senator参议员and meet his wife.There are, however, drawbacks缺点to moving through school at such a brisk轻快的、敏锐的pace步伐.For one, it deprives剥夺students of the luxury of time to roam 遨游intellectually理性的、智力的. Compressing everything into three years also leaves less time for growing up, engaging从事、占用in extracurricular业余的、课外的activities, and studying abroad. On crowded campuses it could mean fewer opportunities to get into a prized珍贵的professor’s class. Iowa’s Waldorf College has graduated several hundred students in its three-year degree program, but it now phasing out逐步淘汰the option. Most Waldorf students wanted the full four-year experience—academically, socially, and athletically. And faculty学院、系members will be wary of提防、当心any change that threatens the core核心curriculum in the name of moving students into the workforce.“Most high governmental officials seem to conceive设想of education in this light—as a way to ensure economic competitiveness and continued economic growth,” Derek Bok, former president of Harva rd, told The Washington Post. “I strongly disagree with this approach.” Another risk: the new campus schedules might eventually produce less revenue税收for the institution and longer working hours for faculty members.Adopting采用a three-year option will not come easily to most school. Those that wish to tackle处理tradition and make American campus more cost-conscious成本意识may find it easier to take Trachtenberg’s advice: open campuses year-round. “You could run two complete colleges, with two complete faculties, ”he says.“That’s without cutting the length of students’ vacations, increasing class sizes, or requiring faculty to teach more.”Whether they experiment with three-year degrees, offer year-round classes, challenge the tenure system—or all of the above—universities are slowly realizing that to stay competitive and relevant有意义的、相关的they must adapt to a rapidly changing world.Expanding扩大the three-year option may be difficult, but it may be less difficult than asking Congress for additional financial help, asking legislators立法者for more state support, or asking students even higher tuition payments. Campuses willing to adopt convenient schedules along with more focused, less-expensive degrees may find that they have a competitive advantage in attracting bright, motivated students. These sorts of innovations can help American universitiesavoid the perils风险of success.注意:此部分试题请在答题卡 1 上作答。
2012同等学力人员申请硕士学位考试英语A卷Passage OneA 10-year-old boy decided to study judo(柔道) despite the fact that he had lost his left arm in a terrible car accident. The boy began lessons with an old Japanese judo master,and he was doing well. But he couldn't understand why,after three months of training,the master had taught him only one move."Sir," the boy finally said,"shouldn't I be learning more moves?“This the only move you know,but this is the only move you'll ever need to know," the master replied.Not quite understanding,but believing in his teacher,the boy kept training.Several months later,the master took the boy to his first tournament(锦标赛).Surprising himself,the boy easily won his first two matches. The third match proved to be more difficult,but after some time,his opponent became impatient and charged; the boy skillfully used his one move to win the match. Still amazed by his success,the boy was now in the finals.This time,his opponent was bigger,stronger,and more experienced. For a while,the boy appeared to be overmatched. Concerned that the boy might get hurt, the referee called a time-out ,He was about to stop the match when the judo master intervened."No," the judo master insisted,"Let him continue."Soon after the match resumed,his opponent made a critical mistake: he dropped his guard. Instantly,the boy used his move to pin him. The boy had won the match and the tournament. He was the champion.On the way home,the boy and his judo master reviewed every move in each and every match. Then the boy summoned the courage to ask what was really on his mind."Sir,how did I win the tourτlament with only one move?""You won for two. reasons," the master answered."First,you've almost mastered one of the most difficult throws in all of judo.Second,the only known defense for that move is for your opponent to grab your left arm”31.Why did the boy want to learn judo?A. He wanted to get over the accident.B. He wanted to make up for his disability.C. He wanted to exercise his right arm.D .The reason was not mentioned in the passage32.When a referee calls a "time-out”__________A. the time has run outB. the game stops for a short timeC. either side can claim victoryD. the game ends in a tie33. Why did the master insist on continuing the match?A. He didn't want to give the opponent an advantage.B. The boy was confident of winning.C. He had confidence in the boy's skill.D. All he cared about was winning the final.34.What probably caused the defeat of the boy's opponent in the final?A. Over-confidence. B .Impatience.C. Inexperience.D. Exhaustion.35. Why did the master teach the boy only that one move?A. The boy could not do other moves with only one arm.B. It was the only move the master knew well.C. It was the move his opponent would not be good at.D. His opponent would be helpless once he made that move.36. What does the passage mainly tell us?A. One can turn a weakness into an advantage.B. It is very difficult to have a good teacher.C Even a disabled person can win a match.D. Practice makes perfect.Passage TwoMy five-year-old daughter knew exactly what she wanted for Christmas of 1977,and told me so. Yes,she still would like the pink-and-green plastic umbrella,books,long nightgown,slippers-fine. But really,there was only one thing that mattered: a Barbie Townhouse,with all the accessories.This was a surprise. Rebecca was not a Barbie girl,preferred stuffed animals to dolls,and wasn't drawn to play in a structured environment. Always a make-up-the-rules,design-my-own-world,do-it-my-way kid. Maybe,I thought,the point wasn't Barbie but the house,which she could claim,for herself,since we’d already moved five times during her brief life.Next day,I stopped at the mall. The huge Barbie Townhouse box was there: "3 Floors of High-Styled Fun! Elevator Can Stop on All Floors!" Some Assembly Required. Uh-oh. My track record for assembling things was miserable. Brooklyn-born,I was raised in apartment buildings in a family that didn't build things. A few years earlier,I'd spent one week assembling a six-foot-tall jungle gym from a kit containing so many parts. I spent the first four hours sorting and the last two hours trying to figure out why there were so many pieces. The day after I finished building it,as if to remind me of my limitations,a tornado(龙卷风) touched down close enough to scatter the jungle gym across an acre of field.I assembled the Barbie Townhouse on Christmas Eve. Making it level,keeping the columns from looking like they'd melted and been refrozen,and getting that elevator to work were almost more than I could manage. And building it in curse-free silence so my daughter would continue sleeping--if,in fact,she was sleeping-added a layer of challenge .By dawn I was done.Shortly thereafter,my daughter walked into the living room. Her surprise may not be real ,but her delight was utterly genuine and moves me. to this day,34 years later. Rebecca had spurred me to do something、I didn't think I could do. It was for her,and一like so much of the privilege of being her farther--it brought me further outside myself and let me overcome doubts about me capacities .37. In the author’s eyes, his little daughter was_______A. obedientB. unstableC. originalD. stubborn38 .The author thought that his daughter’s choice of the Barbie Townhouse, ________A .was natural for a five-year-old girlB.was influenced by her life experienceC.reflected the change in her tasteD.brought her back normal39. For the author,assembling things_______A. was largely in his bloodB. was a challenge he enjoyedC. was always his weak pointD. was part of his family education40. Assembling the Barbie Townhouse_________________.A. brought out the author's potentialsB. turned out to be easier than expectedC. actually drove the author crazy.D. D. was a bad memory for the author41. In the last paragraph the author mainly expressed______A. his pride in being a father.B. his gratitude to his daughterC. his concern about his capabilityD. his delight in helping his daughter42. What can be learned about the relationship between the author and his daughter?A. They are on good terms with each other.B. They barely speak to each other.C. They are polite but cold to each other.D. They keep secrets from each other.Passage ThreeIt is all very well to blame traffic jam,the cost of petrol and the fast pace of modem life,but manners on the roads are becoming deplorable. Everybody knows that the nicest men become monsters behind the wheel. It is all very well,again ,to have a tiger in the tank,but to have one in the driver's seat is another matter. You might tolerate the odd road-hog(占道者),but nowadays the well-mannered motorist is the exception to the rule. Perhaps the situation calls for a "Be Kind to Other Drivers" campaign,otherwise it may get completely out of hand.Road courtesy is not only good manners,but good sense too, It takes the most good-tempered of drivers to resist the temptation to hit back when subjected to uncivilized behavior. A friendly nod or a wave of acknowledgement in response to an act of courtesy helps to create an atmosphere of goodwill and tolerance so necessary in modem traffic conditions. But such acknowledgements of courtesy are all too rare today. Many drivers nowadays don't even seem able to recognize courtesy when they see it.Contrary to general opinion,young drivers have better manners than their seniors. But this isshort-lived in the world of modern driving where many drivers neither expect nor give any mercy. This may be encouraged on the battlefield but is out of place on the roads.Lorry drivers say they have almost abandoned the practice of signaling cars to overtake when the road is clear, because many of the cars took too long to pass. They couldn't be bothered to select a lower gear. The car drivers, after overtaking, slowed down again and hogged the road. Again, a motoring magazine has recently drawn attention to the increasing number of drivers who never wait for gaps." They manufacture them by force,using their direction indicators as a threat rather than a warning." Punch-ups(打群架)are quite common. It can't be long before we hear of pistols and knives being used.Driving is essentially a state of mind. However technically skilled a driver may be,he can't be an advanced motorist if he is always arrogant and aggressive.43. The author is most concerned about.A. traffic jamB. road mannersC. fast pace of lifeD. high cost of petrol44. The word “deplorable” (Para. 1) most probably means " ".A. more seriousB. more temptingC. disturbingD. noticeable45. What is the main idea of Paragraph 2?A. Many drivers tend to fight back against rude behaviors.B. A little courtesy may help ease the tensions on the road.C. Goodwill and tolerance may help relieve traffic jam.D. Many drivers nowadays lack a good sense of courtesy.46. It can be learned from Paragraph 3 that .A. young drivers are more aggressiveB. young drivers would soon lose their good mannersC. elder drivers are more cautiousD. elder drivers should improve their driving skills47. An example of good manners on the roads is .A. signaling cars to overtakeB. manufacturing a gapC. selecting a lower gearD. using the direction indicator48. According to the author,a good driver should .A. be technically skilledB. have a good state of mindC. be sympathetic with othersD. take good care of his vehiclePassage FourOn how the world has changed over the last 50 years,not all of it has been good. As you are looking for organic food information, you have obviously become aware that a better alternative exists and you are taking a critical look at the source and production practices of the companies producing the world's food supplies.The purpose of organic food information is to give you an understanding of what is going into your food. You will see that there are many benefits to organic food that you didn't know before.The basis behind knowing about organic food information is the fact that farmers are resorting to using artificial fertilizers and pesticides(杀虫剂)to control disease and insect attack in order to produce more crops to satisfy growing demand. These artificial fertilizers leave something poisonous in and on the fruit and vegetables we consume which in turn is absorbed and stored by our bodies.Even the quality of food has gone down in recent years. Today's fruits have nowhere near the Vitamin C levels they did at one time. However,with organic food information you learn that organic food has fifty percent more nutrients,minerals and vitamins than any other form of produce that has been grown under intensive farming. If you are eating non-organic produce you will have to eat more fruit in order to make up for this deficiency. But then the dangerous cycle continues since you will be eating more chemicals that are worse for your health than they are good for you.Another aspect of organic food information is the production of meat and poultry (家禽). Most only consider produce when it comes to organic food information disregarding the antibiotics and hormones that are given to both cattle and poultry that are being force fed. Ask yourself what happens to all these antibiotics and hormones when the animal is killed,the remaining of these antibiotics and growth hormones reside in the meat which are then consumed,digested and stored in human bodies. There is no way that an animal that isn't kept in healthy conditions can produce healthy food for humans to eat.You have nothing to lose by trying organic product,not only will it be healthy for you but you will also be able to eat produce and meat the way they are supposed to be. You will likely be so impressed with the taste of organic fruit that you will never return to the mass-produced fruit again. While cost and availability can be a big issue for some,you can do a bit of research online and finda local store that stocks organic produce for a reasonable price.49. It is stated in Paragraph 1 that organic food .A. is considered as a better choiceB. is mostly supplied by world-famous companiesC. has become popular over the last 50 yearsD. reflects the change of production practices50. Farmers use artificial fertilizers and pesticides to .A. satisfy people's critical demandB. develop better farming technologyC. get a higher crop yieldD. keep people in better health51. According to Paragraph 3,organic food .A. has gone down in qualityB. has more nutrientsC. can replace mass-produced foodD. lacks Vitamin C52. What does the author say about meat and poultry?A. Organic meat and poultry is hardly available.B. A great amount of meat is consumed every year.C. Merciless killing of the animals lowers their quality.D. They may contain antibiotics and growth hormones.53. In the last paragraph, people are advised to .A. eat traditional produce and meatB. return to mass-produced fruitsC. do the cost and availability researchD. try organic product for better health and taste54. This passage is mainly about .A. the benefits of organic food informationB. the challenges facing the world food industryC. changes in food production practicesD. a growing demand high quality foodPassage FiveDrinking wastewater? The idea may sound distasteful,but new federally funded research says more Americans are doing so-whether they know or not-and this reuse will be increasingly necessary as the U.S. population expands.Treated wastewater poses no greater health risks than existing water supplies and,in some cases, may be even safer to drink,according to a report released by the National Research Council. “We believe water reuse is an option to deal with growing water scarcity, especially in coastal areas,” says Jorg Drewes,an engineering professor at the Colorado School of Mines. "This can be done reliably without putting the public at risk," he says,citing technological advances. He says it's a waste not to reuse the nation's wastewater,because almost all of it is treated before discharge. This water includes storm runoff(径流) as well as used water from homes,businesses and factories.In many places,the report says,the public does not realize it's drinking water that was treated after being discharged as wastewater somewhere upstream: For example,wastewater discharged into the Trinity River from Dallas/Fort Worth flows south into Lake Livingston,the source for Houston's drinking water.Despite the growing importance of this reuse,the report says there's been no systemic analysis of its extent nationwide since a 1980 study by the U.S. Environmental Protection Agency (EPA). Alan Roberson of the American Water Works Association says wastewater reuse is common, so the council's report is important but not surprising. Roberson expects this recycling will continue to increase,especially for irrigation and industrial needs. He says it will take longer to establish potable(适于饮用的) uses because of public nervousness about drinking wastewater,however treated.“We have to do something to address water scarcity”,says Olga Naidenko,a senior scientist at the non-profit Environmental Working Group. “Less than 10 of potable water is used for drinking,cooking,showering or dishwashing. We flush it down the toilet,literally.” Technologies exist to safely treat the water,she says,although some are expensive.The report says water reuse projects tend to cost more,than most water conservation options but less than seawater desalination(脱盐) and other supply alternatives. It calls on the EPA to develop rules that set safe national standards.55. As can be learned from Paragraph 1, drinking wastewater .A. is to become a growing necessityB. is well received by the AmericansC. has caused heated public debatesD. has become the dominant option56. Which of the following statements would Jorg Drewes agree to?A. Water reuse may eventually put the public at risk.B. Water reuse is preferable to wasting water.C. Water reuse is far from a solution to water shortage.D. Water reuse is possible only after greater tech advances.57. Lake Livingston is mentioned to show that the public .A. accepts the fact of drinking wastewater calmlyB. is concerned about the safety of the drinking waterC. does not believe that wastewater is safe to drink.D. is not aware of the nature of their drinking water58. According to Alan Roberson, .A. it is not safe to drink wastewaterB. the report has surprised the publicC. the report helps build up public confidenceD. the public has yet to accept drinking waster water59. Olga Naidenko’s remarks emphasize .A. the recent progressB. the existing problemsC. the new perspectiveD. the potential risks60. What does the report suggest to the EPA?A. Weighing different water conservation options.B. Exploring new technologies to treat wastewater.C. Setting up national standards for water reuse.D. Monitoring water supplies at a national level.Part IVCloze (15 minutes,15 points,1 for each)Directions: In this part,there is a passage with J 5 blanks. For each blank there are 4 choices marked A,B,C,and D. Choose the best answer for each blank and mark the corresponding letter with a single bar across the square brackets on your machine-scoring ANSWER SHEET.Why do kids hate Brussels sprouts(芽甘苦)? Because Brussels sprouts are bitter,and kids generally don't like bitter tastes. But it's not their 61 . Researchers say that a dislike for bitter and sour is a survival instinct,since most toxic substances 62 that way too. On the other hand,sweetness typically indicates that something is 63 to eat,so children are born with a 64 for sweets.What we like to eat changes over time. As we age,we realize that 65 something tastes bitter or sour,it won't kill us,and we learn to 66 it. When we're older,we 67 some of our smell sensitivity .Humans need smell to experience flavor, which is different from taste. With our semes diminished,we'll probably begin 68 sugar and salt to our food,to heighten the flavor. 69 ,there's a theory that the reason many especially "big" –tasting wines in recent years have won awards is that wine critics are getting older and finding subtle flavors 70 to sense.If someone is71 to detect flavors at all,he may have a taste72,which can be caused by a tongue injury or brain damage. Or it could be a problem with73 .The channel that separates the mouth from the nose allows us to smell behind our nose and is 74 enjoying most complex flavors. That's why food seems 75 when we have a stuffy nose-except chicken noodle soup. It's so salty.61. A. fault B. choice C. habit D. regret62. A. feel B. look C. sound D. taste63. A. strange B. necessary C. safe D. ready64.A. capacity B. preference C. awareness D. consideration65.A. now that B. in case C. if only D. even though66. A. enjoy B. improve C. treat D. alter67.A. form B. lose C. reduce D. gain68.A. putting B. balancing C. adding D. limiting69.A. In essence B. In conclusion C. In fact D. In short70. A. softer B. nicer C. worse D. harder71.A. unlikely B. unable C. impossible D. improbable72. A.. disorder B. symptom C. therapy D. illusion73.A. mood B. taste C. flavor D. smell74.A. subject to B. liable to C. crucial for D. beneficial for75.A. delicious B. flavorless C. bitter D. smellyPaper two(60minutes)Part I Translation (30 minutes, 20 points, 10 for each section)Section ADirections: Translate the following passage into Chinese. Write your translation on the ANSWER SHEET.In many ways the Internet has had a very positive effect on society.It has improved communication ,simplified handling tasks,offered a huge convenience,enabled faster processing ,and provided more options,all of which frees more time to do other things .Yet,interestingly enough ,the Internet has in some ways had negative effects.The quality of communication has declined and people are impatient because they have become accustomed to instant satisfaction,and using the Internet also takes up a lot of time.Section BDirections: Translate the following passage into English. Write your translation on the ANSWER SHEET.乔布斯(Steve Jobs)去世后备受敬仰,原因之一是他创造了科技产品的美感。
2012年英语专升本真题及答案1、He has grown rich lately. [单选题] *A. 后来B. 以后C. 终于D. 最近(正确答案)2、During the Mid-Autumn Festival, family members often gather together _________ ameal, admire the moon and enjoy moon cakes. [单选题] *A. shareB. to share(正确答案)C. having sharedD. shared3、Helen is new here, so we know _______ about her. [单选题] *A. somethingB. anythingC. everythingD. nothing(正确答案)4、There are trees on both sides of the broad street. [单选题] *A. 干净的B. 狭窄的C. 宽阔的(正确答案)D. 宁静的5、You might not like the way Sam behaves, but please be kind to him. _____, he is your grandfather. [单选题] *A. After all(正确答案)B. Above allC. In allD. At all6、Allen is looking forward to _______ his American partner at the trade fair. [单选题] *A. meetB. meeting(正确答案)C. be meetingD. having meeting7、53.On your way home, you can buy some fruit, meat, vegetables and ________. [单选题] *A.something else(正确答案)B.else somethingC.everything elseD.else everything8、—Where ______ you ______ for your last winter holiday?—Paris. We had a great time. ()[单选题] *A. did; go(正确答案)B. do; goC. are; goingD. can; go9、People cut down many trees ______ elephants are losing their homes. ()[单选题] *A. ifB. butC. so(正确答案)D. or10、The notice put _______ on the wall says “No Smoking”. [单选题] *A. up(正确答案)B. offC. awayD. out11、Don’t swim in the river. It’s too _______. [单选题] *A. interestingB. easyC. difficultD. dangerous(正确答案)12、( ) What other books have you read___ this English novel? [单选题] *A. besides(正确答案)B. exceptC.inD. about13、35.Everyone in China ______ Mid-Autumn Day. [单选题] * A.likes(正确答案)B.likeC.is likingD.are like14、_______ your parents at home last week? [单选题] *A. IsB. WasC. AreD. Were(正确答案)15、I passed the test, I _____ it without your help. [单选题] *A.would not passB. wouldn't have passed(正确答案)C. didn't passD.had not passed16、—How do you find()birthday party of the Blairs? —I should say it was __________ complete failure.[单选题] *A.a; aB. the ; a(正确答案)C.a; /D.the; /17、____ China is ____ old country with ____ long history. [单选题] *A. /, an, a(正确答案)B. The, an, aC. /, an, /D. /, the, a18、Tom didn’t _______ his exam again. It was a pity. [单选题] *A. winB. pass(正确答案)C. beatD. Fail19、I’m sorry there are ______ apples in the fridge. You must go and buy some right now.()[单选题] *A. a littleB. littleC. a fewD. few(正确答案)20、I’m still unable to make myself_____in the discussion, which worries me a lot. [单选题]*A.understandB.understood(正确答案)C.understandingD.to be understood21、You have been sitting on my hat and now it is badly out of(). [单选题] *A. dateB. shape(正确答案)C. orderD. balance22、27.Will it ______ warm in the room? [单选题] *A.areB.be(正确答案)C.isD.going to be23、—______ you speak French?—Yes, I can.()[单选题] *A. NeedB. Can(正确答案)C. MightD. Must24、Grandfather lives with us. We all _______ him when he gets ill. [单选题] *A. look after(正确答案)B. look atC. look forD. look like25、He didn't allow _____ in his room. Actually he didn't allow his family _____ at all. [单选题] *A. to smoke; to smokeB. smoking; to smoke(正确答案)C. to smoke; smokingD. smoking; smoking26、______ the morning of September 8th, many visitors arrived at the train station for a tour.()[单选题] *A. FromB. ToC. InD. On(正确答案)27、Its’time to go to bed. _______ your computer, please. [单选题] *A. Turn onB. Turn inC. Turn off(正确答案)D. Turn down28、It usually takes him about 15 minutes _______ his bike to school. [单选题] *A. ridesB. ridingC. rideD. to ride(正确答案)29、We need two ______ and two bags of ______ for the banana milk shake.()[单选题]*A. banana; yogurtB. banana; yogurtsC. bananas; yogurt(正确答案)D. bananas; yogurts30、The classmates can' t()Alice from her twin sister. [单选题] *A. speakB. tell(正确答案)C. talkD. say。
湖南…大学研究生考试试题纸课程名称:__ 基础英语__开课学院:外国语上课专业:年级:2012 学生人数:命题教师:…审核人:考试形式:闭卷考试时间:2012 至2013 学年第 1 学期考试时量:120 分钟Passage two The 6 must-have FriendsFriends are like shoes -- and not just because both pals and the perfect pair of pumps (高跟鞋)can bring you profound joy. Friendship experts agree: Just as your favorite old sneakers aren't perfect for every occasion, neither is every friend. It's crucial to have a colorful assortment of friends -- from comfy to professional -- to match the varied parts of your life.Says Jessica, 31, of Dix Hills, New York, "When I feel low, I always think, 'Well, I have a friend who is this and a friend who is that -- the super-successful impressive friend, the crazy creative friend, the beyond-loyal friend, the since-seventh-grade friend' -- and it makes me feel better to be able to say, 'I am so good at having friends that I've got them in all different shapes and sizes!'" Why else are multiple friendships so important? What are some key friendships to foster? And what's the best way to do that when we're always so on the go?"When we're younger, it's fine to have one or two all-purpose friends," says Marla Paul, author of The Friendship Crisis: Finding, Making, and Keeping Friends When You're Not a Kid Anymore (Rodale, 2004). "But as adults, when our lives and needs and interests become more complex, we need a diverse group of friends who cover all of our dimensions."Just as you can't expect your great black loafers to work with a strappy sundress, you can't expect your single friend to discuss at length the ins and outs of diaper rash. "It's unrealistic to expect one friend to offer everything," says Jan Yager, PhD, author of Who's That Sitting at My Desk? Workship, Friendship, or Foe? (Hannacroix Creek, 2004). "You're drawing on the strengths and benefits that each one offers, not trying to mold someone into something she isn't."Seeing different friendships for what they are can preserve and prolong them, as Eleanor, 38, of Syracuse, New York, discovered. "I have a dear friend who's great about doing things only a close friend will, like helping me move," she says. But Eleanor found it frustrating to confide in her pal about her single-woman hardships. "I hated her cool, no-nonsense responses -- she'd basically tell me I just needed to 'get over it.' I would think, 'She has no idea what it's like!' But then it hit me -- her very long-term boyfriend became her husband. She actually does have no idea what it's like!" Since then, Eleanor says,"I've learned to appreciate what we do share: frustrations with work and politics, similar senses of humor. Now I know she's not the one to call about dating blues. I have plenty of other girlfriends who relate to that!"The Well-Rounded FriendsSo what are the five types of friends that will round out your social wardrobe?The Work Friend. This relationship is so important that Dr. Yager coined a term for it: a "workship." Having an office pal, she says, "boosts productivity, makes the day go faster, and work more fun." Sylvia, 36, of Brookline, Massachusetts, says her workship is the only reason she survives her "heinous(可憎的)job" at all. "She saves my life every day. We bitch about our boss, fantasize about changes we'd make if we overthrew her, share dirt on who's good to work with and who's not. And we laugh," Sylvia says. "My husband commiserates when I come home, sure, but he's not there."Just be on guard: If only one of you gets that promotion, things could get uncomfortable. Try to discuss it in advance if you can. Also, if one of you happens to leave the job, the friendship still has promise, says Yager. "Workships often blossom into friendships when they're no longer workships -- because then you can really let down your guard."The Friend in Your Kid's Class. Your kids are angels, no doubt, but that doesn't mean they have an adult perspective on what's going on in school. "You absolutely need someone to help you check out whether the teacher is really that 'unfair,' the sixth-graders are really dating, or the cliques are really that bad," says Paul. For Nicole, 35, of Charleston, South Carolina, her co-mom keep her not only informed, but also less isolated. "Almost everyone is all coiffed and perfect, and I'm just talking about the kids -- so you can imagine what the moms are like," she says. "My messy self really doesn't fit in. Thank goodness for Lara, the one other mom like me, and the only one I can hang out with at the science fair."The Friend Who's Known You Forever. "This friendship is priceless," says Paul, noting that when she recently bumped into an old crush at the mall, there was only one friend she could call to giggle about it. "She keeps your memories alive by sharing them with you.""If I met her today we might not be friends -- that's one thing I love most. She's so。
扬州中学教育集团树人学校2012–2013学年第二学期期中试卷八年级英语2013.4(满分:140分;考试时间:110分钟)第Ⅰ卷(选择题80分)二、单项选择(共15小题;每小题1分,计15分)在下列各题A、B、C、D四个选项中选择一个能填入题干空白处的最佳答案。
21. great fun it is to fly in a balloon!A. WhatB. What aC. How aD. Ho w22. —Don’t pour the _________ water into the river.—Sorry, I won’t.A. pollutionB. pollutedC. polluteD. polluting23. He ________a worker in a factory, but he________ a pop star two years ago.A. used to be; has becomeB. used to be; becameC. was used to be; becomesD. was used to being; has become24. A book on travelling has just ________, You can get it in any bookshop.A. been come outB. come outC. came outD. coming out25. —How long have you been away from Yangzhou ?—________.A. Since 2 yearsB. In 1999C. For half a year ago D.Since 200726. —He is _______ in class and has _________ for two hour.—He is so tired these days preparing for the mid-term exam.A. alseep; sleepingB. sleep; sleepingC. slept; asleepD. sleeping; been asleep27. —When shall we go to watch the basketball match in the sports centre?—Not until the work _________ tomorrow.A. will be finishedB. is finishedC. will finishD. has been finished28. They __________ day and night. So they are in poor health.A. are made workB. are made to workC. made to be workedD. are making to work29.—Is this coat yours?—No, mine __________ over there near the window.A. hangsB. is hangingC. hungD. has hung30. —Do you have Jay’s CDs?—Sorry, they are _______. But we’ll get more next week because they _______.A. sold out; are sold wellB. sell out; sold wellC. selling out; sell wellD. sold out; sell well31. —We can’t stop there because a car accident ____ last night and the scene was marked______ red.—Ok, let’s find another place to have a rest.A. happened; inB. was happened; inC. happened; withD. has happened; with32. —What do you think of the life in the center of the city?—Better but I feel lonely ______ because it has become difficult to see some of my friends.A. some timesB. some timeC. from time to timeD. one time33. —The earth has been seriously polluted over the past thirty years.—Yes, people must be told that the earth is our home. It ______well.A. must be protectedB. should protectC. need protectingD. should protected34. —The light in his office is still on. Do you know ___________?—To prepare for the mid-term exam.A. if he works hardB. why he keeps workingC. why is he so busyD. when he will stop working35. —Do you mind my sitting here?—___________.The woman sitting here has just left.A. You’d better not.B. Of course notC. Yes, pleaseD. No, you can’t三、完形填空(共15小题;每小题1分,计15分)阅读下列短文,从文后各题所给的四个选项中选出一个最佳答案。
2012年全国硕士研究生入学统一考试英语试题Section Ⅰ Use of EnglishDirections:Read the following text. Choose the best word(s) for each numbered blank and mark A, B, C or D on ANSWER SHEET 1. (10 points)The ethical judgments of the Supreme Court justices have become an important issue recently.The court cannot 1 its legitimacy as guardian of the rule of law 2 justices behave likepoliticians. Yet, in several instances, justices acted in ways that 3 the court's reputation forbeing independent and impartial.Justice Antonin Scalia, for example, appeared at political events. That kind of activity makesit less likely that the court's decisions will be 4 as impartial judgments. Part of the problem isthat the justices are not 5 by an ethics code. At the very least, the court should make itself6 to the code of conduct that7 to the rest of the federal judiciary.This and other similar cases 8 the question of whether there is still a 9 between thecourt and politics.The framers of the Constitution envisioned law 10 having authority apart from politics.They gave justices permanent positions 11 they would be free to 12 those in power andhave no need to 13 political support. Our legal system was designed to set law apart from politicsprecisely because they are so closely 14 .Constitutional law is political because it results from choices rooted in fundamental social15 like liberty and property. When the court deals with social policy decisions, the law it 16 isinescapably political—which is why decisions split along ideological lines are so easily 17 asunjust.The justices must 18 doubts about the court's legitimacy by making themselves 19 tothe code of conduct. That would make ruling more likely to be seen as separate from politics and, 20 , convincing as law.1. [A] emphasize [B] maintain [C] modify [D] recognize2. [A] when [B] lest [C] before [D] unless3. [A] restored [B] weakened [C] established [D] eliminated4. [A] challenged [B] compromised [C] suspected [D] accepted5. [A] advanced [B] caught [C] bound [D] founded6. [A] resistant [B] subject [C] immune [D] prone7. [A] resorts [B] sticks [C] loads [D] applies8. [A] evade [B] raise [C] deny [D] settle9. [A] line [B] barrier [C] similarity [D] conflict10. [A] by [B] as [C] though [D] towards11. [A] so [B] since [C] provided [D] though12. [A] serve [B] satisfy [C] upset [D] replace13. [A] confirm [B] express [C] cultivate [D] offer14. [A] guarded [B] followed [C] studied [D] tied15. [A] concepts [B] theories [C] divisions [D] conceptions[D] controls [C] shapes [B] questions 16. [A] excludes17. [A] dismissed [B] released [C] ranked [D] distorted18. [A] suppress [B] exploit [C] address [D] ignore19. [A] accessible [B] amiable [C] agreeable [D] accountable20. [A] by all means [B] at all costs [C] in a word [D] as a resultSection Ⅰ Reading ComprehensionPart ADirections:Read the following four texts. Answer the questions below each text by choosing [A], [B], [C] or [D]. Mark your answers on ANSWER SHEET 1.(40 points)Text 1Come on—Everybody's doing it. That whispered message, half invitation and half forcing, iswhat most of us think of when we hear the words peer pressure. It usually leads to no good—drinking, drugs and casual sex. But in her new book Join the Club, Tina Rosenberg contends thatpeer pressure can also be a positive force through what she calls the social cure, in which organizations and officials use the power of group dynamics to help individuals improve their lives and possibly the world.Rosenberg, the recipient of a Pulitzer Prize, offers a host of examples of the social cure inaction: In South Carolina, a state-sponsored antismoking program called Rage Against the Haze sets out to make cigarettes uncool. In South Africa, an HIV-prevention initiative known as LoveLife recruits young people to promote safe sex among their peers.The idea seems promising, and Rosenberg is a perceptive observer. Her critique of the lamenessof many pubic-health campaigns is spot-on: they fail to mobilize peer pressure for healthy habits, and they demonstrate a seriously flawed understanding of psychology. “Dare to be different, please don't smoke!”pleads one billboard campaign aimed at reducing smoking among teenagers-teenagers, who desire nothing more than fitting in. Rosenberg argues convincingly that public-healthadvocates ought to take a page from advertisers, so skilled at applying peer pressure.But on the general effectiveness of the social cure, Rosenberg is less persuasive. Join the Clubis filled with too much irrelevant detail and not enough exploration of the social and biological factors that make peer pressure so powerful. The most glaring flaw of the social cure as it's presented here is that it doesn't work very well for very long. Rage Against the Haze failed once state funding was cut. Evidence that the LoveLife program produces lasting changes is limited and mixed.There's no doubt that our peer groups exert enormous influence on our behavior. An emergingbody of research shows that positive health habits—as well as negative ones—spread through networks of friends via social communication. This is a subtle form of peer pressure: we unconsciously imitate the behavior we see every day.Far less certain, however, is how successfully experts and bureaucrats can select our peergroups and steer their activities in virtuous directions. It's like the teacher who breaks up the troublemakers in the back row by pairing them with better-behaved classmates. The tactic never really works. And that's the problem with a social cure engineered from the outside: in the real world, as in school, we insist on choosing our own friends.21. According to the first paragraph, peer pressure often emerges as.[A] a supplement to the social cure [B] a stimulus to group dynamics[D] a cause of undesirable behaviors [C] an obstacle to social progress22. Rosenberg holds that public-health advocates should .[A] recruit professional advertisers [B] learn from advertisers' experience[C] stay away from commercial advertisers [D] recognize the limitations of advertisements23. In the author' s view, Rosenberg' s book fails to .[A] adequately probe social and biological factors[B] effectively evade the flaws of the social cure[C] illustrate the functions of state funding[D] produce a long-lasting social effect24. Paragraph 5 shows that our imitation of behaviors .[A] is harmful to our networks of friends [B] will mislead behavioral studies[C] occurs without our realizing it [D] can produce negative health habits25. The author suggests in the last paragraph that the effect of peer pressure is .[A] harmful [B] desirable[C] profound [D] questionableText 2A deal is a deal—except, apparently, when Entergy is involved. The company, a major energy supplier in New England, provoked justified outrage in Vermont last week when it announced it was reneging on a longstanding commitment to abide by the state's strict nuclear regulations.Instead, the company has done precisely what it had long promised it would not: challenge the constitutionality of Vermont's rules in the federal court, as part of a desperate effort to keep its Vermont Yankee nuclear power plant running. It's a stunning move.The conflict has been surfacing since 2002, when the corporation bought Vermont's onlynuclear power plant, an aging reactor in Vernon. As a condition of receiving state approval for the sale, the company agreed to seek permission from state regulators to operate past 2012. In 2006, the state went a step further, requiring that any extension of the plant's license be subject to Vermont legislature's approval. Then, too, the company went along.Either Entergy never really intended to live by those commitments, or it simply didn't foreseewhat would happen next. A string of accidents, including the partial collapse of a cooling tower in 2007 and the discovery of an underground pipe system leakage, raised serious questions about both Vermont Yankee's safety and Entergy's management—especially after the company made misleading statements about the pipe. Enraged by Entergy's behavior, the Vermont Senate voted 26 to 4 last year against allowing an extension.Now the company is suddenly claiming that the 2002 agreement is invalid because of the 2006 legislation, and that only the federal government has regulatory power over nuclear issues. The legal issues in the case are obscure: whereas the Supreme Court has ruled that states do have some regulatory authority over nuclear power, legal scholars say the Vermont case will offer a precedent-setting test of how far those powers extend. Certainly, there are valid concerns about the patchworkregulations that could result if every state sets its own rules. But had Entergy kept its word, that debate would be beside the point.The company seems to have concluded that its reputation in Vermont is already so damaged that it has nothing left to lose by going to war with the state. But there should be consequences. Permission to run a nuclear plant is a public trust. Entergy runs 11 other reactors in the United States, including Pilgrim Nuclear station in Plymouth. Pledging to run Pilgrim safely, the company has applied for federal permission to keep it open for another 20 years. But as the Nuclear Regulatory Commission (NRC) reviews the company's application, it should keep in mind what promises from Entergy are worth.26. The phrase “reneging on”(Line 3, Paragraph 1) is closest in meaning to .[A] condemning [B] reaffirming [C] dishonoring [D] securing27. By entering into the 2002 agreement, Entergy intended to .[A] obtain protection from Vermont regulators.[B] seek favor from the federal legislature.[C] acquire an extension of its business license.[D] get permission to purchase a power plant.28. According to Paragraph 4, Entergy seems to have problems with its .[A] managerial practices [B] technical innovativeness[C] financial goals [D] business vision29. In the author's view, the Vermont case will test .[A] Entergy's capacity to fulfill all its promises[B] the nature of states' patchwork regulations[C] the federal authority over nuclear issues[D] the limits of states' power over nuclear issues30. It can be inferred from the last paragraph that .[A] Entergy's business elsewhere might be affected.[B] the authority of the NRC will be defied.[C] Entergy will withdraw its Plymouth application.[D] Vermont's reputation might be damaged.Text 3ln the idealized version of how science is done, facts about the world are waiting to be observedand collected by objective researchers who use the scientific method to carry out their work. But in the everyday practice of science, discovery frequently follows an ambiguous and complicated route. We aim to be objective, but we cannot escape the context of our unique life experience. Prior knowledge and interests influence what we experience, what we think our experiences mean, and the subsequent actions we take. Opportunities for misinterpretation, error, and self-deception abound.Consequently, discovery claims should be thought of as protoscience. Similar to newly staked mining claims, they are full of potential. But it takes collective scrutiny and acceptance to transform a discovery claim into a mature discovery. This is the credibility process, through which the individual researcher's me, here, now becomes the community's anyone, anywhere, anytime.Objective knowledge is the goal, not the starting point.Once a discovery claim becomes public, the discoverer receives intellectual credit. But, unlikewith mining claims, the community takes control of what happens next. Within the complex social structure of the scientific community, researchers make discoveries; editors and reviewers act as gatekeepers by controlling the publication process; other scientists use the newfinding to suit their own purposes; and finally, the public (including other scientists) receives the new discovery and possibly accompanying technology. As a discovery claim works its way through the community, the interaction and confrontation between shared and competing beliefs about the scienceand the technology involved transforms an individual's discovery claim into the community's credible discovery.Two paradoxes exist throughout this credibility process. First, scientific work tends to focuson some aspect of prevailing knowledge that is viewed as incomplete or incorrect. Little reward accompanies duplication and confirmation of what is already known and believed. The goal is new-. Not surprisingly, newly published discovery claims and credible discoveriesre-search, not searchthat appear to be important and convincing will always be open to challenge and potential modification or refutation by future researchers. Second, novelty itself frequently provokes disbelief. Nobel Laureate and physiologist Albert Szent-Gyorgyi once described discovery as “seeing what everybody has seen and thinking what nobody has thought.”But thinking what nobody else has thought and telling others what they have missed may not change their views. Sometimes years are required for truly novel discovery claims to be accepted and appreciated.ln the end, credibility “happens”to a discovery claim—a process that corresponds to what philosopher Annette Baier has described as the commons of the mind. “We reason together, challenge, revise, and complete each other's reasoning and each other's conceptions of reason.”31. According to the first paragraph, the process of discovery is characterized by its .[A] uncertainty and complexity [B] misconception and deceptiveness[C] logicality and objectivity [D] systematicness and regularity32. It can be inferred from Paragraph 2 that the credibility process requires .[A] strict inspection [B] shared efforts[C] individual wisdom [D] persistent innovation33. Paragraph 3 shows that a discovery claim becomes credible after it .[A] has attracted the attention of the general public[B] has been examined by the scientific community[C] has received recognition from editors and reviewers[D] has been frequently quoted by peer scientists34. Albert Szent-Gyorgyi would most likely agree that .[A] scientific claims will survive challenges [B] discoveries today inspire future research[C] efforts to make discoveries are justified [D] scientific work calls for a critical mind35.Which of the following would be the best title of the text?[A] Novelty as an Engine of Scientific Development.[B] Collective Scrutiny in Scientific Discovery.[C] Evolution of Credibility in Doing Science.[D] Challenge to Credibility at the Gate to Science.Text 4If the trade unionist Jimmy Hoffa were alive today, he would probably represent civilservants.When Hoffa's Teamsters were in their prime in 1960, only one in ten American government workers belonged to a union; now 36%do. In 2009 the number of unionists in America's public sector passed that of their fellow members in the private sector. In Britain, more than half ofpublic-sector workers but only about 15% of private-sector ones are unionized.There are three reasons for the public-sector unions' thriving. First, they can shut things down without suffering much in the way of consequences. Second, they are mostly bright and well-educated.A quarter of America's public-sector workers have a university degree. Third, they nowdominate left-of-centre politics. Some of their ties go back a long way. Britain's Labor Party, as its name implies, has long been associated with trade unionism. Its current leader, Ed Miliband, oweshis position to votes from public-sector unions.At the state level their influence can be even more fearsome. Mark Baldassare of the PublicPolicy Institute of California points out that much of the state's budget is patrolled by unions. The teachers'unions keep an eye on schools, the CCPOA on prisons and a variety of labor groups on health care.ln many rich countries average wages in the state sector are higher than in the private one. Butthe real gains come in benefits and work practices. Politicians have repeatedly “backloaded”public-sector pay deals, keeping the pay increases modest but adding to holidays and especially pensions that are already generous.Reform has been vigorously opposed, perhaps most egregiously in education, where charter schools, academies and merit pay all faced drawn-out battles. Even though there is plenty of evidence that the quality of the teachers is the most important variable, teachers' unions have fought against getting rid of bad ones and promoting good ones.As the cost to everyone else has become clearer, politicians have begun to clamp down. InWisconsin the unions have rallied thousands of supporters against Scott Walker, the hardline Republican governor. But many within the public sector suffer under the current system, too.John Donahue at Harvard's Kennedy School points out that the norms of culture in Westerncivil services suit those who want to stay put but is bad for high achievers. The only American public-sector workers who earn well above $ 250,000 a year are university sports coaches and the president of the United States. Bankers'fat pay packets have attracted much criticism, but apublic-sector system that does not reward high achievers may be a much bigger problem for America.36.It can be learned from the first paragraph that .[A] Teamsters still have a large body of members[B] Jimmy Hoffa used to work as a civil servant[C] unions have enlarged their public-sector membership[D] the government has improved its relationship with unionists37.Which of the following is true of Paragraph 2?[A] Public-sector unions are prudent in taking actions.[B] Education is required for public-sector union membership.[C] Labor Party has long been fighting against public-sector unions.[D] Public-sector unions seldom get in trouble for their actions.38.It can be learned from Paragraph 4 that the income in the state sector is .[A] illegally secured [B] indirectly augmented[C] excessively increased [D] fairly adjusted39.The example of the unions in Wisconsin shows that unions .[A] often run against the current political system[B] can change people's political attitudes[C] may be a barrier to public-sector reforms[D] are dominant in the government40.John Donahue's attitude towards the public-sector system is one of .[A] disapproval [B] appreciation [C] tolerance [D] indifferencePart BDirections:In the following text, some sentences have been removed. For Questions 41—45, choose the most suitable one from the list A-G to fit into each of the numbered blanks. There are two extra choices, which do not fit in any of the blanks. Mark your answers on ANSWER SHEET 1. (10 points) Think of those fleeting moments when you look out of an aeroplane window and realise that you are flying, higher than a bird. Now think of your laptop, thinner than a brown-paper envelope,or your cellphone in the palm of your hand. Take a moment or two to wonder at those marvels. You are the lucky inheritor of a dream come true.The second half of the 20th century saw a collection of geniuses, warriors, entrepreneurs and visionaries labour to create a fabulous machine that could function as a typewriter and printing press, studio and theatre, paintbrush and gallery, piano and radio, the mail as well as the mail carrier. (41)__________________.The networked computer is an amazing device, the first media machine that serves as the mode of production, means of distribution, site of reception, and place of praise and critique. The computeris the 21 st century's culture machine.But for all the reasons there are to celebrate the computer, we must also act with caution. (42)__________________. I call it a secret war for two reasons. First, most people do not realise that there are strong commercial agendas at work to keep them in passive consumption mode. Second, the majority of people who use networked computers to upload are not even aware of the significance of what they are doing.All animals download, but only a few upload. Beavers build dams , birds make nests. Yet for the most part, the animal kingdom moves through the world downloading. Humans are unique in their capacity to not only make tools but then turn around and use them to create superfluous material goods—paintings, sculpture and architecture—and superfluous experiences—music, literature, religion and philosophy. (43)__________________.For all the possibilities of our new culture machines, most people are still stuck in download mode. Even after the advent of widespread social media, a pyramid of production remains, with a small number of people uploading material, a slightly larger group commenting on or modifying that content, and a huge percentage remaining content to just consume. (44)__________________.Television is a one-way tap flowing into our homes. The hardest task that television asks of anyone is to turn the power off after he has turned it on.(45)__________________.What counts as meaningful uploading? My definition revolves around the concept of “stickiness”—creations and experiences to which others adhere.[A] Of course, it is precisely these superfluous things that define human culture and ultimately what it is to be human. Downloading and consuming culture requires great skills, but failing to move beyond downloading is to strip oneself of a defining constituent of humanity.[B] Applications like tumblr, com, which allow users to combine pictures, words and other media in creative ways and then share them, have the potential to add stickiness by amusing, entertaining and enlightening others—and engendering more of the same.[C] Not only did they develop such a device but by the turn of the millennium they had also managed to embed it in a worldwide system accessed by billions of people every day.[D] This is because the networked computer has sparked a secret war between downloading and uploading—between passive consumption and active creation—whose outcome will shape our collective future in ways we can only begin to imagine.[E] The challenge the computer mounts to television thus bears little similarity to one format being replaced by another in the manner of record players being replaced by CD players.[F] One reason for the persistence of this pyramid of production is that for the past half-century, much of the world's media culture has been defined by a single medium—television—and television is defined by downloading.[G] The networked computer offers the first chance in 50 years to reverse the flow, to encourage thoughtful downloading and, even more importantly, meaningful uploading.Part CDirections:Read the following text carefully and then translate the underlined segments into Chinese. Your)10 points(translation should be written carefully on ANSWER SHEET 2.Since the days of Aristotle, a search for universal principles has characterized the scientificenterprise. In some ways, this quest for commonalities defines science. Newton's laws of motion and Darwinian evolution each bind a host of different phenomena into a single explicatory frame work.(46) In physics, one approach takes this impulse for unification to its extreme, and seeks a theory of everything—a single generative equation for all we see. It is becoming less clear,however,that such a theory would be a simplification, given the dimensions and universes that it might entail.Nonetheless, unification of sorts remains a major goal.This tendency in the natural sciences has long been evident in the social sciences too. (47) Here,Darwinism seems to offer justification, for if all humans share common origins, it seems reasonable to suppose that cultural diversity could also be traced to more constrained beginnings.Just as the bewildering variety of human courtship rituals might all be considered forms of sexual selection,perhaps the world's languages, music, social and religious customs and even history are governed by universal features. (48) To filter out what is unique from what is shared might enableus to understand how complex cultural behavior arose and what guides it in evolutionary or cognitive terms.That, at least, is the hope. But a comparative study of linguistic traits published online today supplies a reality check. Russell Gray at the University of Auckland and his colleagues consider the evolution of grammars in the light of two previous attempts to find universality in language.The most famous of these efforts was initiated by Noam Chomsky, who suggested that humans are born with an innate language-acquisition capacity that dictates a universal grammar. A few generative rules are then sufficient to unfold the entire fundamental structure of a language, which is why children can learn it so quickly.(49) The second, by Joshua Greenberg, takes a more empirical approach to universality, identifying traits (particularly in word-order) shared by many languages, which are considered to represent biases that result from cognitive constraints.Gray and his colleagues have put them to the test by examining four family trees that between them represent more than 2,000 languages. (50) Chomsky's grammar should show patterns oflanguage change that are independent of the family tree or the pathway tracked through it, whereas Greenber-gian universality predicts strong co-dependencies between particular types of word order relations. Neither of these patterns is borne out by the analysis, suggesting that the structures of thelanguages are lineage-specific and not governed by universals.Section Ⅰ WritingPart A51.Directions:Some international students are coming to your university. Write them an email in the name ofthe Students' Union to1) extend your welcome and2) provide some suggestions for their campus life here.You should write about 100 words on ANSWER SHEET 2.Do not sign your name at the end of the letter. Use “Li Ming”instead.Do not write the address. (10 points).Part B52.Directions:Write an essay of 160-200 words based on the following drawing. In your essay, you should1) describe the drawing briefly,2) explain its intended meaning, and3) give your comments.You should write neatly on ANSWER SHEET 2. (20 points)2012年全真试题答案Section I Use of English10. B 9. A 8. B 4. D 5. C 6. B 7. D 1. B 2. A 3. B20. D19. D 18. C 13. C 14. D 15. A 16. C 17. A 11. A 12. CSection II Reading ComprehensionPart A 25. D 24. C 21. D 22. B 23. A Text 130. A 29. D 28. A 27. D 26. C Text 235. C34. D 33. B 32. B Text 3 31. A40. A 38. B 39. C 36. C Text 4 37. DPart B45.G 44.F 41.C 42.D 43.APart C试图寻找包含一切的物理学领域,一种做法把这种寻求大同理论的冲动推向极端,46.理论——一个涵括我们所看到的一切的成性公式。
2012年6月英语四级真题,答案,答案解析,及听力原文2012年6月全国大学英语四级考试试卷Part ⅠWriting (30minutes)Directions: For this part, you are allowed 30 minutes to write a short essay entitled Excessive Packaging f ollowing the outli ne given below. Y ou should write at least 120 words but no more than 180 words.1.目前许多商品存在过度包装的现象2.出现这一现象的原因3.我对这一现象的看法和建议On Excessive PackagingPart ⅡReading Comprehension(Skimming and Scanning)(15minutes)Directions: In this part, you will have 15 minutes to go over the passage quickly and answer the questions on Answer s heet 1. For questions 1-7,choose the best answer f rom the f our choices marked A),B),C)and D). For questions 8-10,complete the sentences with the inf ormation given in the passage.Small Schools RisingThis year?s list of the top 100 high schools shows tha t today, those with f ewer students are f lourishing.Fif ty years ago, they were the latest thing in educational ref orm: big, modern, suburban high schools with students counted i n the thousands. As baby boomers(二战后婴儿潮时期出生的人) came of high-school age, big schools promised economic eff i ciency. A great er choice of courses, and, of course, better f ootball teams. Only years later did we understand the trade-off s this involved: the creation of excessive bureaucracies(官僚机构),the diff iculty of f orging personal connections between teachersand students.SA T scores began dropping in 1963;today,on average,30% of students do not complete high s chool in f our years, a f igure that rises to 50% in poor urban neighborhoods. While the emphasis on teaching to higher, test-driven standards as set in No Child Lef t Behind resulted in signif icantly better perf ormance in elementary(and some middle)schools, high schools f or a variety of reasons seem ed to have made little progress.Size isn?t everything, but it does matter, and the past decade has seen a noticeable countertrend toward smaller schools. This has been due ,in part ,to the Bill and Melinda Gates Foundation, which has invested $1.8 billion in American high schools, helping to open about 1,000 small schools-most of them with about 400 kids each with an average enrollment of only 150 per grade, About 500 more are on the drawing board. Districts all over the country are taking notice, along with mayors in cities like New Y ork, Chicago and San Diego. The movement includes independ ent public charter schools, such as No.1 BASIS in Tucson, with only 120 high-schoolers and 18 graduates this year. It embraces district-sanctioned magnet schools, such as the Talented and Gif ted School, with 198 students, and the Science and Engineering Magnet,with383,which share a building in Dallas, as well as the City Honors School in Buf falo, N.Y., which grew out of volunteer evening seminars f or students. And it includes alternative schools with students selected by lott ery(抽签),such as H-B Woodlawn in Arlington, V a. And most noticeable of all, there is the phenomenon of l arge urban and suburban high schools that have split up into smaller units of a few hundred, generally housed in the same grounds that once boasted thousands of students all marching to the same band.Hillsdale High School in San Mateo, Calif, is one of those,ranking No.423—among the top 2% in the country—on Newsweek?s annual ranking of America?s top high schools. The success of small schools is apparent in the listings. T en years ago,when the f irst Newsweek list based on college-level test participation was published, only three of the top 100 schools had graduating Classes smaller than 100 students. This year there are 22. Nearly 250 schools on the f ull ,Newsweek list of the top 5% of schools nationally had f ewer than 200 graduates in 2007.Although many of Hillsdale?s students came f rom wealthy households, by the late 1990 average test scores were sliding and it had earned the unaff ectionate nickname (绰号) “Hillsjail. ”Jeff Gilbert.A Hillsdale teacher who became principal last year, remembers sitting with other teachers watching students f ile out of a graduation ceremony and asking one another in astonishment, “How did that student graduate?”So in 2003 Hillsdale remade itsel f into three “houses,” romantically named Florence, Marrakech and Kyoto. Each of the 300 arriving ninth graders arerandomly(随机地) assigned to one of the houses. Where they will keep the same f our core subject teachers f or two years, bef ore moving on to another f or 11th and 12th grades. The closeness this system cultivates is reinf orced by the institution of “advisory” classes Teachers me et wi th students in groups of25, f ive mornings a week, f or open-ended discussions of everything f rom homework problems to bad Saturday-night dat es. The advisers also meet with students privately and stay in touch with parents, so they are deeply invested in the students?success.“We?re constantly talking about one another?s advisers,” says English teacher Chris Crockett. “If you hear that yours isn?t doing well in math, or see them sittingoutside the dean?s off ice, it?s like a personal f ailure.” Alon g with the new structure cam e a more demanding academic program, the percentage of freshmen taking biology jumped from 17 to 95.“It w as rough f or som e. But by senior year, two-thirds have moved up to physics,”says Gilbert “Our kids are coming to school in part because they know there are adults here who know them and care f or them.”But not all schools show advances af ter downsizing, an d it remains to be seen whether smaller schools will be a cure-all solution.The Newsweek list of top U.S. high schools was made this year, as in years past, according to a single metric, the proportion of students taking college-level exams. Over the yea rs this system has come in f or its share of criticism f or its simplicity. But that is also its strength: it?s easy f or reader s to understand, and to do the arithmetic f or their own schools if they?d like.Ranking schools is always controversial, and this year a group of 38 superintendents(地区教育主管)from f ive states wrot e to ask that their schools be excluded fro m the calculation.“It is impossible to know which high schools are …the best? in the nation, ”their letter read. in part. “Determining whether differe nt schools do or don?t off er a high quality of education requires a look at man diff erent measures, including students? overa ll academic accomplishments and their subsequent perf ormance in college. And taking into consideration the unique needs of their co mmunities.”In the end, the superintendents agreed to provide the data we sought, which is, af ter all, public inf ormation. There is, in o ur view, no real dispute here, we are all seeking the same thing, which is schools that better serve our children and our nation by encouraging students to tackle tough subjects under theguidance of gi f ted teachers. And if we keep working toward that goal, someday, perhaps a list won?t be necessary.注意:此部分试题请在答卡1上作答.1. Fif ty years ago. big. Modern. Suburban high schools were established in the hope of __________.A) ensuring no child is lef t behindB) increasing economic eff i ciencyC) improving students? perf ormance on SA TD)providing good education f or baby boomers2. What happened as a result of setting up big schools?A)Teachers? workload increased.B)Students? perf ormance declined.C)Administration became centralized.D)Students f ocused more on test scores.3.What is said about the schools f orded by the Bill and Melinda Gates f oundation?A)They are usually magnet schools.B)They are of ten located in poor neighborhoods.C)They are popular with high-achieving students.D)They are mostly small in size.4.What is most noticeable about the current trend in high school education?A)Some large schools have split up into smaller ones.B)A great vari ety of schools have sprung up in urban and suburban areas.C)Many schools compete f or the Bill and Melinda Gates Foundation f unds.D)Students have to meet higher academic standards.5.Newsweek ranked high schools according to .A)their students? academic achi evementB)the number of their students admitted to collegeC)the size and number of their graduating classesD)their college-level test participation6.What can we learn about Hill sdale?s students in the late 1990s?A)They were made to study hard like prisoners.B)They called each other by unaffectionate nicknames.C)Most of them did not have any sense of discipline,D)Their school perf ormance was getting worse.7.According to Jeff Gilbert, the “advisory” classes at Hillsdale were set up so that students could .A)tell their teachers what they did on weekendsB)experience a great deal of pleasure in learningC)maintain closer relationships with their teachersD)tackle the demanding biology and physics courses8. is still considered a strength of Newsweek?s school ranking system in spite of the criticism it receives_________.9.According to the 38 superintendents, to rank schools scientif ically, it is necessary to use_________.10.To better serve the children and our nation, schools students to take_________ .Part ⅢListening Comprehension (35minutes)Section ADirections: in this section you will hear 8 short conversations, one or more questions will be asked about what was said. Both the conversation and the questions will be spoken only once. Af t er each question there will be a pause. During the pause, you must read the f our choices marked A)、B)、C)and D)、and decide which is the best answer. Then mark the corresponding letter on Answer sheet 2 with a single line through the centre.注意:此部分试题请在答案卡2上作案。
2012研究生考试英语一Section I Use of EnglishDirections:Read the following text. Choose the best word(s)for each numbered blank and mark A,B, C or D on ANSWER SHEET 1. (10 points)Read the following text。
Choose the best word(s)for each numbered blank and mark A, B, C or D on ANSWER SHEET 1。
(10 points)The ethical judgments of the Supreme Court justices have become an important issue recently。
The court cannot _1_ its legitimacy as guardian of the rule of law _2_ justices behave like politicians. Yet, in several instances,justices acted in ways that _3_ the court’s reputation for being independent and impartial.Justice Antonin Scalia, for example,appeared at political events。
That kind of activity makes it less likely that the court’s decisions will be _4_ as impartial judgments。
Part of the problem is that the justices are not _5_by an ethics code。
2012年同等学力人员申请硕士学位英语考试真题Paper One 试卷一(90minutes)PartⅠDialogue Communication (10 minutes, 10 points, 1 for each) Section A Dialogue CompletionDirections: In this section, you will read 5 short incomplete dialogues between two speakers, each followed by 4 choices marked A, B, C, and D. Choose the answer that best suits the situation to complete the dialogue. Then mark the corresponding letter with a single bar across the square brackets on your machine-scoring ANSWER SHEET.1. A: Frank,where are the cookies? Don't tell me you ate them all!B: _______They were so good.A. Yes,forget it.B. Yes,I couldn't help it.C. No,I'm sorry.D. No,don't be mad2. A: The train is delayed again.B: _____How long do we have to wait?A: About forty minutes.A. What a pity!B. How annoying!C. I'm sorry to hear that.D. So far so good.3. A: When Lisa saw me at the mall,she didn't even say hello to me. B: I can’t understand why______. I thought you were good friends.A. you greeted her firstB. B. she was also there at the timeC. she gave you the cold shoulderD. you should have cared4. A: I used to make delicious pies, but this one tastes terrible.B: I think you're really .A. out of dateB. out of touchC. out of handD. out of practice5. A: Dr. Smith, what's wrong with my father?B: Well, ______ considering his advanced age.A. he's in pretty good shapeB. B. don't ask me such a questionC. I have no ideaD. I have nothing to say for the momentSection B Dialogue ComprehensionDirections: In this section, you will read 5 short conversations between a man and a woman. At the end of each conversation there is a questionfollowed by 4 choices marked A, B, C, and D. Choose the best answer to the question from the 4 choices by marking the corresponding letter with a single bar across the square brackets on your machine-scoring ANSWER SHEET.6. Woman: Bob,if you weed the garden,I'll do the dishes.Man: It's a deal.Question: What does the man mean?A. He agrees to the proposal.B. He rejects the idea.C. He thinks it's unfair.D. He stands to gain.7. Woman: Can I go skiing with you and your fiends this weekend?Man: The more,the merrier.Question: what does the man mean?A. There are already too many people.B. He can't promise the woman now.C. The woman is welcome to join them.D. The woman can come next time.8. Man: This suitcase cost me 200 dollars.Woman: 200 dollars for a piece of junk like that? That’s a rip-off!Question: What does the woman mean?A. It's a bit expensive.B. It's a real bargain.C. It's not worth the price. D: It's unexpected.9. Woman: The house seems in a bad shape.Man: Yes, we've decided to rebuild it from scratch……Question: What would the man probably do-to the house?A. He would scratch the paint off its surface.B. He would tear it down first.C. He would make some repairs.D. He would rebuild it by himself.10.Ted: I ate four hamburgers,Mom.Mother: Well,you've made a pig of yourself.Question: What do we learn from the conversation?A. Pigs love hamburgers too.B. Ted looks overweight.C. The hamburgers were delicious.D. Ted ate too many hamburgers.Part II Vocabulary (20 minutes, 10 points, 0.5 for each)Section ADirections:In this section, there are 10 sentences, each with one word or phrase underlined. Choose the one from the 4 choices marked A, B, C, and D that best keeps the meaning of the sentence. Then mark thecorresponding letter with a single bar across the square brackets on your machine-scoring ANSWER SHEET.11. In his closing remarks,the chairman expressed his thanks to all thosewho had contributed to the success of the conference.A. commentsB. speechC. criticism D lecture12. Both Tom and his brother take after their father not only in appearancebut also in character.A. commentsB. speechC. criticismD. lecture13. The hurricane was incredibly devastating and left thousands homeless.A. forceful B .memorize C .protect D. observe14. Readers are required to comply with the rules of the library and mindtheir manners.A. evaluateB. memorizeC. protectD. observe15. Economic factors aside, the imbalanced distribution of educationalresources also affects fairness of education.A .unjustB .impartial C. protect D. observe16. Watching me pulling the calf awkwardly to the barn, the Irish milkmaidfought hard to hold back her laughter.A. checkB. keepC. stopD. retain17. The government has called for an independent inquiry into the incident.A. requirementB. examinationC. analysisD. investigation18. A great number of houses would have to be removed to make way for thenew amusement park.A. take the place of B .give space for C. build up D. work out19. Drug use accounts for approximately three-quarters of all reported casedof HIV in the country.A. possibly B .roughly C .generally D. contained20 .For their own safety, household pets should be confined to their own yard.A. tamedB. regainedC. restricted D .containedSection BDirections: In this section, there are 10 incomplete sentences. For each sentence there are 4 choices marked A, B, C, and D. Choose the one that best completes the sentence. Then mark the corresponding letter with a single bar across the square brackets on your machine-scoring ANSWER SHEET.21. By a strange_______, both candidates have come up with the samesolution to the problem.A. coincidenceB. EncounterC. chanceD. overlap22. The discussion was so prolonged and exhausting that ______the speakersstopped for refreshments.A. at large B .at intervals C. at ease D. at random23. Mr Tunick filed suit against the New York police department after cityofficials________ his request.A. turned downB. turned inC. turned offD. turned out24. The fire man had a _______escape when a staircase collapsed beneath hisfeet.A. CloseB. NarrowC. hardD. near25. Many painters, rock singers, and dancers have distinct hair style,________to their group.A. particularB. essentialC. specialD. peculiar26. That he brought the company big profits wouldn't ______ putting thecompany's money into his own pockets.A. justifyB. clarifyC. testifyD. amplify27. We’re _______50 new staff this year as business grows.A. taking overB. taking inC. taking onD. taking up28. Is the theory of evolution direct _____ with religious teachings, or does itleave room for debate?A .comparison B. distinction C. disturbance D. contradiction29. Libraies are an investment for the future and should not be allowed to fallinto______.A. dissolutionB. decayC. declineD. depression30. A transplant operation is successful only doctors can prevent the bodyform rejecting the ______ organ.A. borrowedB. strangeC. novelD. foreignPart III Reading Comprehension (45 minutes, 30 points, 1 for each)Directions: There are 5 passages in this part. Each passage is followed by 6 questions or unfinished statements. For each of them there are 4choices marked A, B, C and D. Choose the best one and mark thecorresponding letter with a single bar across the square brackets on your machine-scoring ANSWER SHEET.Passage OneA 10-year-old boy decided to study judo(柔道) despite the fact that he had lost his left arm in a terrible car accident. The boy began lessons with an old Japanese judo master,and he was doing well. But he couldn't understand why,after three months of training,the master had taught him only one move."Sir," the boy finally said,"shouldn't I be learning more moves?"“This the only move you know,but this is the only move you'll ever need to know," the master replied.Not quite understanding,but believing in his teacher,the boy kept training.Several months later,the master took the boy to his first tournament(锦标赛).Surprising himself,the boy easily won his first two matches. The third matchproved to be more difficult,but after some time,his opponent became impatient and charged; the boy skillfully used his one move to win the match. Still amazed by his success the boy was now in the finals.This time,his opponent was bigger,stronger,and more experienced. For a while,the boy appeared to be overmatched. Concerned that the boy might get hurt, the referee alled a time-out, He was about to stop the match when the judo master intervened."No," the judo master insisted,"Let him continue."Soon after the match resumed,his opponent made a critical mistake: he dropped his guard. Instantly,the boy used his move to pin him. The boy had won the match and the tournament. He was the champion.On the way home,the boy and his judo master reviewed every move in each and every match. Then the boy summoned the courage to ask what was really on his mind."Sir,how did I win the tournament with only one move?""You won for two reasons," the master answered."First,you've almost mastered one of the most difficult throws in all of judo. Second,the only known defense for that move is for your opponent to grab your left arm.”31.Why did the boy want to learn judo?A. He wanted to get over the accident.B. He wanted to make up for his disability.C. He wanted to exercise his right arm.D. The reason was not mentioned in the passage32. When a referee calls a "time-out”________.A. the time has run outB. the game stops for a short timeC. either side can claim victoryD. the game ends in a tie33. Why did the master insist on continuing the match? ________.A. He didn't want to give the opponent an advantage.B. The boy was confident of winning.C. He had confidence in the boy's skill.D. All he cared about was winning the final.34. What probably caused the defeat of the boy's opponent in the final?_______.A. Over-confidence.B. Impatience.C. Inexperience.D. Exhaustion.35. Why did the master teach the boy only that one move?A. The boy could not do other moves with only one arm.B. It was the only move the master knew well.C. It was the move his opponent would not be good at.D. His opponent would be helpless once he made that move.36. What does the passage mainly tell us?A. One can turn a weakness into an advantage.B. It is very difficult to have a good teacher.C. Even a disabled person can win a match.D. Practice makes perfect.Passage TwoMy five-year-old daughter knew exactly what she wanted for Christmas of 1977, and told me so. Yes,she still would like the pink-and-green plastic umbrella,books,long nightgown,slippers-fine. But really,there was only one thing that mattered: a Barbie Townhouse, with all the accessories.This was a surprise. Rebecca was not a Barbie girl,preferred stuffed animals to dolls,and wasn't drawn to play in a structured environment. Always a make-up-the-rules,design-my-own-world,do-it-my-way kid. Maybe,I thought,the point wasn't Barbie but the house,which she could claim,for herself,since we’d already moved five times during her brief life.Next day,I stopped at the mall. The huge Barbie Townhouse box was there. "3 Floors of High-Styled Fun! Elevator Can Stop on All Floors!" Some Assembly Required. Uh-oh. My track record for assembling things was miserable. Brooklyn-born,I was raised in apartment buildings in a family that didn't build things. A few years earlier,I'd spent one week assembling a six-foot-tall jungle gym from a kit containing so many parts.I spent the first four hours sorting and the last two hours trying to figureout why there were so many pieces. The day after I finished building it,as if to remind me of my limitations,a tornado(龙卷风) touched down close enough to scatter the jungle gym across an acre of field.I assembled the Barbie Townhouse on Christmas Eve. Making it level,keeping the columns from looking like they'd melted and been refrozen,and getting that elevator to work were almost more than I could manage.And building it in curse-free silence so my daughter would continuesleeping--if,in fact,she was sleeping-added a layer of challenge . By dawn I was done.Shortly thereafter,my daughter walked into the living room. Her surprise may not be real ,but her delight was utterly genuine and moves me. to this day,34 years later. Rebecca had spurred me to do something. I didn't think I could do. It was for her,and—like so much of the privilege ofbeing her farther--it brought me further outside myself and let meovercome doubts about me capacities .37. In the author’s eyes, his little daughter was_______A. obedientB. unstableC. originalD. stubborn38. The author thought that his daughter’s choice of the Barbie Townhouse________.A. was natural for a five-year-old girlB. was influenced by her life experienceC. reflected the change in her tasteD. brought her back normal39. For the author,assembling things_______.A. was largely in his bloodB. was a challenge he enjoyedC. was always his weak pointD. was part of his family education40. Assembling the Barbie Townhouse_______.A. brought out the author's potentialsB. turned out to be easier than expectedC. actually drove the author crazyD. was a bad memory for the author41. In the last paragraph the author mainly expressed______.A. his pride in being a fatherB. B. his gratitude to his daughterC. his concern about his capabilityD. his delight in helping his daughter42. What can be learned about the relationship between the author and hisdaughter?A. They are on good terms with each other.B. They barely speak to each other.C. They are polite but cold to each other.D. They keep secrets from each other.Passage ThreeIt is all very well to blame traffic jam, the cost of petrol and the fast pace of modem life, but manners on the roads are becoming deplorable. Everybody knows that the nicest men become monsters behind the wheel. It is all very well, again , to have a tiger in the tank,but to have one in the driver's seat is another matter. You might tolerate the odd road-hog(占道者),but nowadays the well-mannered motorist is the exception to the rule. Perhaps the situation calls for a "Be Kind to Other Drivers" campaign,otherwise it may get completely out of hand.Road courtesy is not only good manners,but good sense too. It takes the most good-tempered of drivers to resist the temptation to hit back when subjected to uncivilized behavior. A friendly nod or a wave of acknowledgement in response to an act of courtesy helps to create an atmosphere of goodwill and tolerance so necessary in modem traffic conditions. But such acknowledgements of courtesy are all too rare today. Many drivers nowadays don't even seem able to recognize courtesy when they see it.Contrary to general opinion,young drivers have better manners than their seniors. But this is short-lived in the world of modern driving where many drivers neither expect nor give any mercy. This may be encouraged on the battlefield but is out of place on the roads.Lorry drivers say they have almost abandoned the practice of signaling cars to overtake when the road is clear, because many of the cars took too long to pass. They couldn't be bothered to select a lower gear. The car drivers, after overtaking, slowed down again and hogged the road. Again, a motoring magazine has recently drawn attention to the increasing number of drivers who never wait for gaps." They manufacture them by force,using their direction indicators as a threat rather than a warning." Punch-ups(打群架) are quite common. It can't be long before we hear of pistols and knives being used.Driving is essentially a state of mind. However technically skilled a driver may be,he can't be an advanced motorist if he is always arrogant and aggressive.43. The author is most concerned about________.A. traffic jamB. road mannersC. fast pace of lifeD. high cost of petrol44. The word "deplorable" (Para. 1) most probably means ________.A. more seriousB. more temptingC. disturbingD. noticeable45. What is the main idea of Paragraph 2? ________.A. Many drivers tend to fight back against rude behaviors.B. A little courtesy may help ease the tensions on the road.C. Goodwill and tolerance may help relieve traffic jam.D. Many drivers nowadays lack a good sense of courtesy.46. It can be learned from Paragraph 3 that ________.A. young drivers are more aggressiveB. young drivers would soon lose their good mannersC. elder drivers are more cautiousD. elder drivers should improve their driving skills47. An example of good manners on the roads is_______.A. signaling cars to overtakeB. manufacturing a gapC. selecting a lower gearD. using the direction indicator48. According to the author,a good driver should_______.A. be technically skilledB. have a good state of mindC. be sympathetic with othersD. take good care of his vehiclePassage FourOn how the world has changed over the last 50 years,not all of it has been good. As you are looking for organic food information, you have obviously become aware that a better alternative exists and you are taking a critical look at the source and production practices of the companies producing the world’s food sup plies.The purpose of organic food information is to give you an understanding of what is going into your food. You will see that there are many benefits to organic food that you didn't know before. The basis behind knowing about organic food information is the fact that farmers are resorting to using artificial fertilizers and pesticides(杀虫剂) to control disease and insect attack in order to produce more crops to satisfy growing demand. These artificial fertilizers leave something poisonous in and on the fruit and vegetables we consume which in turn is absorbed and stored by our bodies.Even the quality of food has gone down in recent years. Today’s fruits have nowhere near the Vitamin C levels they did at one time. However,with organic food information you learn that organic food has fifty percent more nutrients,minerals and vitamins than any other form of produce that has been grown under intensive farming. If you are eating non-organic produce you will have to eat more fruit in order to make up for this deficiency. But then the dangerous cycle continues since you willbe eating more chemicals that are worse for your health than they are good for you.Another aspect of organic food information is the production of meat and poultry (家禽). Most only consider produce when it comes to organic food information disregarding the antibiotics and hormones that are given to both cattle and poultry that are being force fed. Ask yourself what happens to all these antibiotics and hormones when the animal is killed,the remaining of these antibiotics and growth hormones reside in the meat which are then consumed,digested and stored in human bodies. There is no way that an animal that isn't kept in healthy conditions can produce healthy food for humans to eat.You have nothing to lose by trying organic product,not only will it be healthy for you but you will also be able to eat produce and meat the way they are supposed to be. You will likely be so impressed with the taste of organic fruit that you will never return to the mass-produced fruit again. While cost and availability can be a big issue for some,you can do a bit of research online and find a local store that stocks organic produce for a reasonable price.49. It is stated in Paragraph 1 that organic food ________.A. is considered as a better choiceB. is mostly supplied by world-famous companiesC. has become popular over the last 50 yearsD. reflects the change of production practices50. Farmers use artificial fertilizers and pesticides to________.A. satisfy people's critical demandB. develop better farming technologyC. get a higher crop yieldD. keep people in better health51. According to Paragraph 3,organic food________. .A. has gone down in qualityB. has more nutrientsC. can replace mass-produced foodD. lacks Vitamin C52. What does the author say about meat and poultry? ________.A. Organic meat and poultry is hardly available.B. A great amount of meat is consumed every year.C. Merciless killing of the animals lowers their quality.D. They may contain antibiotics and growth hormones.53. In the last paragraph, people are advised to ________. .A. eat traditional produce and meatB. return to mass-produced fruitsC. do the cost and availability researchD. try organic product for better health and taste54. This passage is mainly about________. .A. the benefits of organic food informationB. the challenges facing the world food industryC. changes in food production practicesD. a growing demand high quality foodPassage FiveDrinking waste water? The idea may sound distasteful,but new federally funded research says more Americans are doing so-whether they know or not-and this reuse will be increasingly necessary as the U.S. population expands.Treated wastewater poses no greater health risks than existing water supplies and, in some cases, may be even safer to drink,according to a report released by the National Research Council. “We believe water reuse is an option to deal with growing water scarcity, especially in coastal areas”, says Jorg Drewes, an engineering professor at the Colorado School of Mines. "This can be done reliably without putting the public at risk”,he says,citing technological advances. He says it's a waste not to reuse the nation's wastewater,because almost all of it is treated before discharge. This water includes storm runoff(径流) as well as used water from homes,businesses and factories.In many places,the report says,the public does not realize it's drinking water that was treated after being discharged as wastewater somewhere upstream. For example,wastewater discharged into the Trinity Riverfrom Dallas/Fort Worth flows south into Lake Livingston,the source for Houston's drinking water.Despite the growing importance of this reuse,the report says there's been no systemic analysis of its extent nationwide since a 1980 study by the U.S. Environmental Protection Agency (EPA). Alan Roberson of the American Water Works Association says wastewater reuse is common, so the council's report is important but not surprising. Roberson expects this recycling will continue to increase,especially for irrigation and industrial needs. He says it will take longer to establish potable(适于饮用的) uses because of public nervousness about drinking wastewater, however treated.“We have to do something to address water scarcity”, says Olga Naidenko, a senior scientist at the non-profit Environmental Working Group. “Less than 10 of potable water is used for drinking,cooking,showering or dishwashing. We flush it down the toilet,literally.” Technologies exist to safely treat the water,she says,although some are expensive.The report says water reuse projects tend to cost more,than most water conservation options but less than seawater desalination(脱盐) and other supply alternatives. It calls on the EPA to develop rules that set safe national standards.55. As can be learned from Paragraph 1, drinking wastewater_______.A. is to become a growing necessityB. is well received by the AmericansC. has caused heated public debatesD. has become the dominant option56. Which of the following statements would Jorg Drewes agree to?_______.A. Water reuse may eventually put the public at risk.B. Water reuse is preferable to wasting water.C. Water reuse is far from a solution to water shortage.D. Water reuse is possible only after greater tech advances.57. Lake Livingston is mentioned to show that the public________.A. accepts the fact of drinking wastewater calmlyB. is concerned about the safety of the drinking waterC. does not believe that wastewater is safe to drink.D. is not aware of the nature of their drinking water58. According to Alan Roberson, ________.A. it is not safe to drink wastewaterB. the report has surprised the publicC. the report helps build up public confidenceD. the public has yet to accept drinking waste water59. Olga Naidenko’s remarks emphasize________.A. the recent progressB. the existing problemsC. the new perspectiveD. the potential risks60. What does the report suggest to the EPA?________.A. Weighing different water conservation options.B. Exploring new technologies to treat wastewater.C. Setting up national standards for water reuse.D. Monitoring water supplies at a national level.Part IV Cloze (15 minutes, 15 points, 1 for each)Directions: In this part, there is a passage with 15 blanks. For each blank there are 4 choices marked A, B, C and D. Choose the best answer for each blank and mark the corresponding letter with a single bar across the square brackets on your machine-scoring ANSWER SHEET.Why do kids hate Brussels sprouts(芽甘苦)? Because Brussels sprouts are bitter,and kids generally don't like bitter tastes. But it's not their _61 _. Researchers say that a dislike for bitter and sour is a survival instinct,since most toxic substances _62_ that way too. On the other hand,sweetness typically indicates that something is _63_ to eat, so children are born with a _64_ for sweets.What we like to eat changes over time. As we age, we realize that _65 _ something tastes bitter or sour,it won't kill us,and we learn to _66_ it. When we're older,we _67_ some of our smell sensitivity .Humans needsmell to experience flavor, which is different from taste. With our senses diminished,we'll probably begin _68_ sugar and salt to our food,to heighten the flavor. _69_, there's a theory that the reason many especially "big"—tasting wines in recent years have won awards is that wine critics are getting older and finding subtle flavors _70_ to sense.If someone is_71_ to detect flavors at all,he may have a taste _72_,which can be caused by a tongue injury or brain damage. Or it could be a problem with _73_. The channel that separates the mouth from the nose allows us to smell behind our nose and is _74_ enjoying most complex flavors. That's why food seems _75_ when we have a stuffy nose-except chicken noodle soup. It's so salty.61. A. fault B. choice C. habit D. regret62.A. feel B. look C. sound D. taste63. A. strange B. necessary C. safe D. ready64. A.capacity B. preference C.awarenessD.consideration65. A. nowthatB. in caseC. if onlyD. even though66. A.enjoyB. improveC. treatD. alter67.A. form B. lose C. reduce D. gain68. A.puttingB. balancingC. addingD. limiting69. A. Inessence B. InconclusionC. In factD. In short70. A. softer B. nicer C. worse D. harder71. A. unlikely B. unable C.impossibleD. improbable72. A.disorderB. symptomC. therapyD. illusion73. A. mood B. taste C. flavor D. smell74. A. subjectto B. liable to C. crucialforD. beneficialfor75. A. delicious B. flavorless C. bitter D. smellyPaper Two(60 minutes)Part I Translation (30 minutes, 20 points, 10 for each section) Section ADirections: Translate the following passage into Chinese. Write your translation on th e ANSWER SHEET.。
Mid-term Examination Paper for Grade 2003(To be finished within one hour. Be sure to put all your answers on the ANSWER SHEET)Class ___________ Name _________ Score_________I.Vocabulary (20%)A.Spell the following words with the help of their meanings and the first letters:1.fr_____________ v. defeat(one’s effort)2. th____________ a. careful and complete3. co____________ v. cause to work together4. com____________ n. state of being devoted to sth.5. rh______________ n. a regular pattern of sounds that come again and again6.co______________ a. always having the same attitudes, quality, etc.7.p_____________ v. hit sb. or sth. hard with fists8.ph____________ a. of the body rather than the mind or soul9.fa______________ a. most liked10.de_____________ ad. without doubt, clearlyplete each of the following sentences with the proper form of the wordgiven in brackets:11.(forget) We went to a beautiful town and spent a(n) ____________ day.12. ( peace) I want my children to be brought up in a __________ world.13.(health) This book is not _________ reading for children.14. (complain) He made a _________ to the local police about the terrible noise fromthe next door.15. (present) I have been asked to give a short ________ on the aims of the plan.16. (consciously) John has a(n) ________ habit of tapping his fingers on the desk.17. (wake) The children are still ____________, waiting for their mother to comeback.18. (explain) Is there any _______ for his strange way of doing things?19. (envy) She will always be ________ of her sister’s beauty.20. (worth) He felt himself quite ________ of her.II. There are 60 incomplete sentences in this part. For each sentence there are four choices marked A, B, C, and D. Choose the ONE that best completes the sentence. (60%)1.Over a third of the world population was estimated to have no _______ to thehealth service.A. assessmentB. assignmentC. exceptionD. access2.In Australia the Asians made their influence ______ in businesses large and small.A. feelingB. feelC. feltD. to be felt3.Nuclear science should be developed to benefit the people ______ harm them.A. more thanB. other thanC. rather thanD. better than4.Very few scientists _______ completely new answers to the world’s problems.A. come up withB. come outC. come aroundD. come up to5.________ for an explanation of the social customs of this country, I woulddefinitely find it difficult.A. If askedB. If askingC. AskingD. Asked6.This is a subject ________ we might argue for a long time.A. whichB. about whichC. whatD. about that7. Although he is talkative, he is ________ to tell us anything about his family.A. willingB. reluctantC. alertD. complacent8.Those who _______ hearing the story again come over and add themselves to theaudience.A. joined inB. felt likeC. tended toD. sat on9._____ the secret is known to all, nobody will be interested in him any more.a. before B. Once C. Although D. Unless10.We are aware that, _______ the situation will get worse.A. if not dealing with carefullyB. if dealt not carefully withC. if not carefully dealt withD. if not carefully dealing withst night, we caught a thief ________ John’s bike.A. when stealingB. that he stoleC. to stealD. stealing12.It is vital that you ______ quickly to whatever is asked.A. respondB. respondedC. will respondD. are responding13.We have all learnt a lot from the ______.A. three month’s training courseB. three-month training courseC. three-month-training courseD. three-month’s training course14.However much ______, it will be worth the money.A. does the dictionary costB. the dictionary costsC. the dictionary will costD. costs the dictionary15.Neither the revolution in manufacture nor that in agriculture _______ without thebrilliant inventions in transportation and communication.A. could have proceededB. should have proceededC. ought to have proceededD. must have proceeded16.A man of words and not of deeds is _______ a garden full of weeds.A. just asB. just likeC. alikeD. as if17.I had a lot of trouble ______ the car _____ this morning.A. to get, startedB. to get, startingC. getting startedD. getting , starting18.She’ fainted. Throw some water on her face and she may _____.A. come toB. come backC. come outD. come up19.This milk must be bad; it’s ______ a nasty smell.A. givingB. giving awayC. giving offD. sending off20.He feels ______ to be a supermarket manager.A. it challengedB. challengingC. that challengingD. it challenging21.When I feel very tired of serving the customers, _______ is a smile from them”.A. all what is neededB. that what is neededC. what all is neededD. all that is needed22._________, her heart was beating faster and faster.A.Listening to the coming footstepsB.As she listened to the coming footstepsC.When listening to the coming footstepsD.To the coming footsteps as she listened23.This sentence is extremely difficult ______.A. to understand itB. to understandC. for me to understand itD. to have understood24.That night many people watched the ______ object in the sky with great interest.A. bright unknown flyingB. unknown bright flyingC. flying unknown brightD. unknown flying bright25._______, the idea of working under a woman frustrated him.A. Wanting the job very muchB. Though he wanted the job very muchC. When wanting the job very muchD. Wanted the job very much26.When you have finished reading the novel, you will find the hero _______.A. a person too perfect to be not trueB. a too perfect person to be trueC. too perfect a person to be trueD. too perfect a person to be not true27._______, we decided to leave at once, as we didn’t want to risk missing the lastbus.A. Being pretty lateB. It being pretty lateC. As it being pretty lateD. It was being pretty late28.He won’t feel tired this morning if he _______ to bed immediately after you toldhim so.A. wentB. would goC. had goneD. would have gone29._________, water should be regarded with caution as it can be dangerous.A. Beautiful as it isB. It is beautifulC. As it is beautifulD. Beautiful it is30.______, I might have ended up dead.A. Were he not to come to the rescueB. Should he not come to the rescueC. Had he not come to the rescueD. If he did not come to the rescue31.At first I thought that math problem would be rather difficult, but it ______ to befairly easy.A. turned outB. turned upC. turned onD. turned over32.I have been looking at the letter for half an hour, but I still can’t _______ thesignature.A. write downB. make outC. find outD. watch over33._______ makes men different from the other animals is that they can think andspeak.A. ThatB. The thingC. AllD. What34.Look at this room. Never in my life _______ such a mess.A. do I seeB. I seeC. have I seenD. I have seen35.I have to _______ my expenditure to my income.A. treatedB. adjustedC. adoptedD. remedied36.Every time I read Chairman Mao’s “On Practice”, I derive fresh ______ from itspages.A. advantageB. benefitC. profitD. value37.The ________ rain has destroyed the crop of the year.A. continuousB. constantC. continualD. frequently38.She __________ to the compliment with a smile.A. answeredB. repliedC. respondedD. turned39.Online learning greatly _______ the interest of the public.A. aroseB. arousedC. raisedD. roused40.With the population explosion, scientists will have to _________ new methods ofincreasing the world’s food supply.A. lead toB. carry outC. come up withD. stick to41. You don’t have to tell him! He is fully ______ the danger.A. sure ofB. aware ofC. blind toD. confident of42.Overwork often _______ illness.A. results fromB. depends onC. leads toD. breaks into43.You look very tired. You ______ too hard these days.A. could have workedB. ought to have workedC. should have workedD. must have worked44.Many animals _______ green plants for their food.A. carry outB. base onC. depend onD. look for45.European students seldom live on campus. ________, they live at home and travelto classes.A. InsteadB. For exampleC. What’s moreD. However46.These are the decisions you have to weigh _______.A. when to choose a college to attendB. when choosing a college to attendC. a college chosen to attendD. a college you choose to attend47.Either walking to school or washing dishes after a meal _________ I hate most.A. are whatB. are thatC. is whatD. is that48.He talked so much during the chess match that he _______ the game.A. distracted me fromB. kept me fromC. prevented me fromD. stopped me from49.A voice _______ the program to announce the election results.A. broke intoB. broke offC. cut downD. cut out50.She talked to him for a long time and _______ him into accepting that job.A. persuadedB. dissuadedC. overcameD. conquered51.Don’t talk about her son’s behavior at school. It’s a(n) ________ subject to her.A. awkwardB. embarrassingC. nervousD. disgraced52.Mooncakes are still the food for the Mid-Autumn Festival in China, ______ theywere decades ago.A. thatB. sinceC. asD. which53.His family found it hard to ________ into the local community after they movedto the city.A. associateB. assimilateC. diveD. contact54.I am able to _________ others and bridge the gap between my language andculture and theirs.A. reach forB. reach out forC. gain access toD. reach out to55.The senator’s son __________ his father’s name when ran for mayor.A. traded forB. exchanged forC. traded onD. turned down56.In a time of social reform, people’s state of mind tends to keep _______ with therapid changes of society.A. stepB. progressC. paceD. touch57.Only under special circumstances _______ to take up tests.A. are freshmen permittedB. freshmen are permittedC. permitted are freshmenD. are permitted freshmen58.Louis was asked to _______ the man who stole her purse.A. confirmB. recognizeC. defyD. identify59.These goods are ________ for export, though a few of them may be sold on homemarket.A. essentiallyB. completelyC. necessarilyD. remarkably60.After _________ relations for more than 20 years, China and the U.S.reestablished their diplomatic ties in 1972.A. breaking offB. breaking inC. breaking intoD. breaking out of II.Put the following sentences into proper English (20%)1.生活中并非所有的事情都值得我们冒险.2.会上该教授对人类当前对这门科学所了解的现状作了完整的陈述3.父亲极力注意不让我的许多业余时间白白浪费.4.这种产品在投放市场前必须进行数次严格测试.5.这两国一向友好相处, 几百年没有发生过战争.KeyA. 1. frustrate 2. thorough 3. coordinate 4. commitment5. rhythm6. consistent7. punch8. physical9.favorite 10. definitelyB. 11. unforgettable 12. peaceful 13. healthy 14. complaint15. presentation 16. unconscious 17. awake 18. explanation 19. envious 20. unworthyII.1. D2.C3.C4. A5. A6. B7. B8.B 9B. 10. C 11. D 12.A 13. B 14. B 15. A 16. B 17. C 18. A 19. C 20. D.21. D 22. B 23. B 24. A 25. B 26. C 27. B 28. C 29. A 30. C 31. A 32. B 33.D 34. C 35. B 36. B 37. C 38. C 39. B 40. C 41. B 42. C 43. D 44. C 45. A 46. B 47. C 48. A 49. A 50. A 51. B 52. C 53. B 54. D 55.C 56. C 57. A 58. D 59. A 60. A III.1.Not everything in life is worth our risk.2.At the meeting the professor made a complete presentation of the present status ofhuman knowledge of science.3.Father saw to it that much of my spare time was not wasted.4.This type of product must be subjected to a number of severe tests before cominginto the market.5.These two countries have been friendly and remained at peace for hundreds ofyears.。
PLEASE TURN OVER 1 NAME_______________________________ CLASS__________
Approved dictionaries, notes, calculators may be used. INSTRUCTIONS TO CANDIDATES:
1. You will have 10 minutes to read the paper. In that time you may make notes on the scribbling paper provided. You must not write in your script book nor use your calculator until instructed to do so. 2. Answer all parts of Questions 1 to 14. 3. Correct answers (including appropriate working ) to all questions are required for full marks 4. Diagrams, where given, are not necessarily drawn to scale. 5. Show all workings. (You are strongly advised not to use scribbling paper. Work which you consider incorrect should be crossed out with a single line but should not be erased or rendered unreadable.). You may write on page 16, 19 and 24 if you need more space, making sure to label each answer clearly. 6. Please use only black or blue pens for all work other than graphs and diagrams, which may be done in pencil. 7. Complete the box on the top right-hand side of this page with information about the electronic technology you are using in this examination. 8. Total marks is 150. Question 1 2 3 4 5 6 7 8 9 10 11 12 13 14 Marks 11 12 13 12 7 7 5 14 19 4 15 9 7 15
Graphics calculator Brand Model
Computer software
MATHEMATICAL STUDIES PLEASE TURN OVER 2 QUESTION 1 Find dxdy if (a) Find
dy
dx if y=
x2+1
x2–1
(Do not simplify your answer)
(3 marks) (b) 31)2ln(4xeyx (Do not simplify your answer)
(4 marks) (c) 2325xyxy
(4 marks) PLEASE TURN OVER 3
QUESTION 2 Consider the function )(xfy where 186)(24xxxxf. (a) Find an expression for )(xf and classify (using an appropriate sign diagram) all stationary points of the function.
(4 marks) (b) Find algebraically any non-stationary (non-horizontal) point(s) of inflection.
(4 marks) (c) For the interval 33x, find all the values of x where 186)(24xxxxf attains its maximum and minimum values. (Show your working.)
(4 marks) PLEASE TURN OVER 4
QUESTION 3 Let xxf31)(. The graph of )(xfy, for 0x, and the chord through points )0,3(A and )21,6(B are shown below:
(a) (i) Find the slope of the chord AB. (1 mark) (ii) Describe what the slope of the chord ABrepresents.
(1 mark)
Ax-11234567
y
-1-12
12
1B PLEASE TURN OVER 5
(b) Find, from first principles, )6(f.
(5 marks) (c) Check your answer to part (b) using direct differentiation.
(2 marks) (d) Give a geometric interpretation for the value of )6(f.
(1 mark) (e) Find the equation of the normal to the curve at 6x in the form EDyCx.
(3 marks) PLEASE TURN OVER 6
QUESTION 4 Below is the graph of )(xfy where 161282)(xxxf, for 40x.
(a) (i) Using two appropriate rectangles, obtain an upper estimate UA for 4
0)(dxxf.
(2 marks) (ii) On the graph above sketch the two rectangles you used for your upper estimate UA. (1 mark)
(iii) Find the corresponding lower estimate LA for 40)(dxxf.
(2 marks)
x1234
y48y = f(x) PLEASE TURN OVER 7 (b) The graph of )(xfy, where 161282)(xxxf, is now sketched for bx0, where b is an unknown positive constant. The areas of two regions of the graph are shown.
(i) Write an equation which shows the relationship between bdxxf0)(, 4
0)(dxxf, 124)(dxxf and bdxxf12)(.
(2 marks) (ii) If 11)(12bdxxf, evaluate bdxxf0)(.
(2 marks) (iii) From the graph it appears that 1918b, but we cannot rely on the scale of the graph being accurate. Use appropriate calculations to verify that 1918b.
(3 marks)
x481216
y4812y = 2x–82x+1+16
Area = 10 23 units2
Area = 5 13 units2b PLEASE TURN OVER 8
QUESTION 5 Mathematician Fibonacci wishes to analyse historical records of rabbit population in Australia. He discovers that in 1859 an early settler had a population of 24 rabbits sent out from England so that they could be released on his property and provide hunting sport. Fibonnacci finds the following data which estimates the population )(tPof rabbits t years after the arrival of the initial 24 rabbits.
t 0 2 4 6 8 10 )(tP 24 350 1,500 60,000 200,000 1,500,000 (a) (i) Consider the power, exponential and quadratic models. Explain clearly which model you think is best for this data and why each of the other two are less suitable.
(4 marks) (ii) Write the equation of your chosen model.
(2 marks) (b) Fibonnaci discovers some new data for the 1900s which suggests that while the population of rabbits continues to grow, the growth rate of the population of rabbits decreases. That is, since the food source is limited, the population tends to stabilise. Name a type of model which can accomodate both the original data and this new information.