GST家族cotton
- 格式:pdf
- 大小:5.12 MB
- 文档页数:16
不同产地美棉代表符号及其特点1、SJV ACALA棉花:是指加利福尼亚州的SAN JOAQUIN VALLEY峡谷地区种植的“ACALA”品种棉花。
该地区气候条件最好,高等级棉花比例大,棉花品质最好,同等级价格最贵。
平均长度在1-1/8‘之上,强力不低于30 GPT,细度在4.2,整齐度高于82%,总产量的80%为三级以上。
是纱厂用来纺30或40支精梳纱的主体棉。
2、ALIFORNIA UPLAND(SJV UPLAND)棉花:是指在SAN JOAQUIN VALLEY 峡谷地区种植的非“ACALA”品种棉花,未经三年试种得到确认的其他品种。
此种棉花价格比SJV ACALA便宜,比其它地区的贵。
目前该种棉花的总产量占SAN JOAQUIN VALLEY 总产量的10%左右。
3、C/A棉花:是指在加利福尼亚州IMPERIAL VALLEY/阿里桑那州/新墨西哥州/西南沙漠地区种植的“DPL-90”品种的棉花。
价格排在第三位。
平均长度高于1-3/32’,强力26-29GPT。
75%的等级高于三级。
在国际市场主要和澳棉,中国T/129,T/229,中亚PERVYI,西非棉竞争。
上述三种棉花产于西部棉区,约占美总产量的22%,大部分供出口。
4、MEMPHIS/EASTERN:是指田那西州孟菲斯及东部的棉花,包括美东南和中南产区,价格排在第四位。
产量占美总产量的49%,平均长度高于1-1/16’。
东南产区棉花主要供国内纱厂,中南产区部分供出口。
5、M/O/T:理论上是指孟菲斯/奥尔良/德克萨斯棉花,实际目前主要是指德克萨斯州/堪萨斯/俄克拉荷马产的棉花。
在美棉中,该地区棉花同等级价格最低。
产量占美总产量的29%,长度低于1-1/16’。
一半以上供出口。
主要用来做气流纺。
6、美PIMA长绒棉主要产于亚里桑那/加州/新墨西哥/德克萨斯。
产量介于6-10万吨。
主要品种为S-7(67%)和S-6(15%)。
品质如下:PIMA S-6 PIMA S-7长度:1-3/8’----1-7/16’1-3/8’-------1-7/16’细度:3.5-4.9 3.5-4.9强力:95000-115000 PSI 95000-120000 PSI或36 GPT 或38 GPT美国棉花一般都和期货进行套期保值,价格上有随期货波动而波动的特点,因此价格波动幅度很大。
附录一:美国棉花分级标准介绍I. 引言1907 年国际棉花业的一群代表在佐治亚州的亚特兰大市开会,讨论在棉花销售过程中出现的一些严重问题。
大会通过一项议案,议制定一个统一的棉花标准,以“消除市场间的价格差别,为解决争端提供方法,使棉农更好地认识其产品的价值,因而使其处于更有利的协商地位,并为棉花交易带来很大的益处”。
为对此及随后几年的相似呼吁作出响应,国会通过法律授权美国农业部 (简称 USDA) 制订棉花等级标准并提供棉花分级服务。
这样便开始了工业界与政府部门间的合作,该合作一直很强并延续到今天。
这种长期的伙伴关系展示了政府与工业界如何相互配合,彼此尊重对方所起的作用,从而为国家和国外客户带来持续的利益。
II. 概述棉花特征从植物学角度讲,主要有三类棉花具有重要的商业意义。
第一类 (Gossypium hirsutum) 源于墨西哥和中美洲地区,已在美国得到开发并广泛使用,在美国棉花产量中占百分之九十五以上。
此类棉花在美国称为美洲陆地棉,其长度在大约 7/8 至 l 5/16 英寸(2.22 - 2.38cm)范围之间。
第二类 (G. barbadense) 约占美国棉花产量的百分之五,源于南美洲地区。
它在美国称为美洲长绒棉,但通常也称为特长纤维 (简称 ELS) 棉花,其长度在 1 1/4 至 1 9/16 英寸(3.18 - 3.97cm)范围之间。
第三类 (G. herbaceum和 G. arboreum) 为短纤维 (1/2 至 1 英寸)(1.27 - 2.54cm) 棉花,它们源于印度和东亚,美国不生长此类棉花。
在一磅棉花中可能有一亿根或更多纤维,每根纤维是单个细胞在棉籽表层生长出来的。
在生长早期纤维以薄壁管的形式达到其最大长度。
当成熟时,纤维素沉积在管内壁上从而使纤维壁增厚,而中心是空的。
当生长结束以及有机质死亡时,纤维收缩并围绕其自身的轴扭曲。
USDA 有 13 个棉花分级设施,分布在棉花产地。
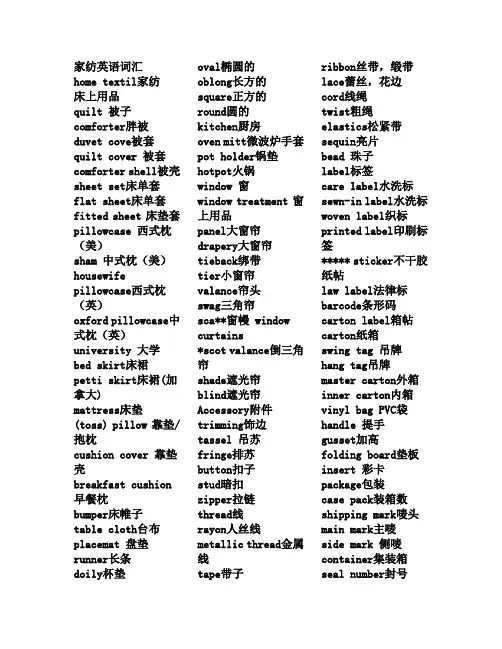
count纱支数 yarn count纱支数 count密度 thread count密度 embroidery绣花 embroidery绣花 technique工艺 technique工艺 applique贴布 applique贴布 patchwork拼布 patchwork拼布 cutwork扣锁 cutwork扣锁 lace百带丽 battenburg lace百带丽 quilting绗缝 quilting绗缝 quilting手绗 hand quilting手绗 quilting机绗 machine quilting机绗 computerized quilting 电脑绗 sew缝 sew缝 cut 剪 finish整理 finish整理 iron整烫 iron整烫 stitch绷针 satin stitch绷针 stitch刷针 chain stitch刷针 embroidery锁链绣 chain embroidery锁链绣 embroidery丝带绣 ribbon embroidery丝带绣 embroidery机绣 machine embroidery机绣 chenille embroidery刀切瓣 embroidery刀切瓣 work雪丽绣 crewel work雪丽绣 platform床裙的面 platform床裙的面 skirt/drop床裙的裙 skirt/drop床裙的裙 corner开 split corner开*式拐角 corner对脸折拐角 pleated corner对脸折拐角 ruffle 自由折 pleat对脸折 box pleat对脸折 seam 接缝 allowance缝头 缝头 seam allowance缝头 hem卷边 hem卷边 face/ face/front 面 back/reverse底 back/reverse底 filling/batting/ filling/batting/wadding 填充物棉子 flap舌头 flap舌头 overlap大压小 overlap大压小 header上库库 header上库库pocket下库库 rod pocket下库库 hem侧卷边 side hem侧卷边 hem底卷边 bottom hem底卷边 hem顶卷边 top hem顶卷边 overlock锁边 overlock锁边 blanket stitch needle针 needle针 opening/closure开口 opening/closure开口 closure纽扣封口 button closure纽扣封口 zipper closure 拉链封口 zipper暗拉链 hidden zipper暗拉链 flange飞边 flange飞边 scallop荷叶边 scallop荷叶边 layout布局 layout布局 scatter分散的 scatter分散的 horizontal水平的 horizontal水平的 vertical垂直的 vertical垂直的 cuff/.hem西式枕的复边 /.hem cuff/.hem西式枕的复边 overlay覆盖物 overlay覆盖物 joint接缝 joint接缝 office办事处 office办事处 namecard名片 namecard名片 card名片 business card名片 telephone电话 telephone电话 phone/call电话 phone/call电话 fax传真 fax传真 meeting会议 meeting会议 hotel旅馆 hotel旅馆 programme项目 programme项目 project项目 project项目 order订单 order订单 order( .)订单 purchase order(P.O.)订单 training培训 training培训 presentation 推介 negotiate谈判 negotiate谈判 approve/confirm确认 approve/confirm确认 production生产 production生产 bulk production 批量生产production大规模生产 mass production大规模生产 manager经理 manager经理 manager总经理 general manager总经理 director董事 董事, director董事,主管 lightbox灯箱 lightbox灯箱 labdip烧杯样 labdip烧杯样 off印花布的挂钩样 strike off印花布的挂钩样 handloom手织样 handloom手织样 system系统 system系统 flight航班 flight航班 forwarder货代 forwarder货代 consolidator集运公司 集运公司、 consolidator集运公司、人 logistics后勤 logistics后勤 payment付款 payment付款 term付款条件 payment term付款条件 inspection检验 inspection检验 audit审查 审查, audit审查,验厂 list一览表 一览表, list一览表,清单 namelist名单 namelist名单 defect缺陷 defect缺陷 facility设施 facility设施 customer顾客 customer顾客 buyer买方 买方, buyer买方,买手 compliance遵守 compliance遵守 source资源 资源, source资源,开发 cost成本 cost成本 price价格 price价格 quote报价 quote报价 quotation报价 quotation报价 quota配额 quota配额 duty税 duty税 freight运费 freight运费 commission佣金 commission佣金 center配货中心 distribution center配货中心 review查看 review查看 shipping出运 shipping出运 delivery发货 delivery发货 seal红封样 red seal红封样booking预订 booking预订 update更新 update更新 download下载 download下载 upload上载 upload上载 submit提交 提交, submit提交,递交 contact联系 联系, contact联系,联系人 register注册 register注册 meter立方米 cubic meter立方米 meter平方米 square meter平方米 foot英尺 foot英尺 inch英寸 inch英寸 centimeter厘米 centimeter厘米 ounce盎司 ounce盎司 gram克 gram克 kilogram千克 kilogram千克 file文件 file文件 attachment附件 attachment附件 catalogue目录 catalogue目录 warehouse仓库 warehouse仓库 standard标准 standard标准 quality质量 quality质量 quantity数量 quantity数量 team/group组 team/group组,队 sample样品 sample样品 comment意见 comment意见 change/amend更改 change/amend更改 exclusive专门 exclusive专门 logo标志 logo标志 picture/photo图片 picture/photo图片 finish后处理 finish后处理 pre-treatment前处理 pre-treatment前处理 content成分 content成分 bleach漂白 bleach漂白 width 幅宽 weight面料克重 fabric weight面料克重 construction组织结构 construction组织结构 screen网 平网/圆网印花) screen网(平网/圆网印花) mercerize 丝光sanforize预收缩 sanforize预收缩 preshrink 预收缩 shrinkage缩水率 shrinkage缩水率 cloth坯布 grey cloth坯布 goods坯布 piece goods坯布 greige 坯布 calender 砑光 coating 涂层 resin 树脂 emboss 压花的 sanding 磨光 soften 柔软 seersucker 泡泡纱 wash 水洗 launder.(动词) .(动词 launder.(动词) 洗涤 laundry. 名词) laundry.(名词) 水洗 梭织的, woven 梭织的,机织的 knit 针织的 felt 毛毡 mattelasse 凸纹布 plush 长毛绒 terry 毛圈布 开士米, cashmere 开士米,山羊绒 wool 毛的 test 测试 test request form 测试申请单 test report 测试报告 test result 测试结果 colo* **stness colo* **stness 色牢度 dry crocking 干磨 wet crocking 湿磨 wash手洗 hand wash手洗 dry clean 干洗 machine wash 机洗 flammability 阻燃性 appearance retention 外观持久性 dimension stability 尺寸稳定性。
收藏家族的前世今生——古根海姆家族(中)作者:蒋成龙来源:《世界博览》2014年第16期古根海姆博物馆建成并对外开放。
在家族收藏中,另一位起到重要作用,且同样叱咤风云的人物登上艺术舞台。
艺术帝国的崛起经过了将近40年的收藏过程,所罗门于1937年共同成立了“所罗门·R·古根海姆基金会”以寄托他对当代艺术的热忱。
接下来的1939年,他与希拉在纽约市54街东24号的一间展室中共同创办了“非具象艺术绘画博物馆”,在这里公开展室自己的藏品,并由希拉担任馆长。
自博物馆建成后,首次展览于当年6月1日举办,以“明日的艺术”为主题。
此次展览在希拉的指导和授意下展出了当时最为重要的艺术作品,其中包括康定斯基的“Composition 8 (1923)”、莱热的“Contrast of Forms(1913)”以及德劳内的“Simultaneous Windows (2nd Motif, 1st Part)(1912)”等。
直至1940年,他们开始意识到博物馆中那为数庞大的先锋派绘画作品需要一个永久、稳定的环境用于展示和储藏,而这一需求随着展品的增加变得更加迫切。
于是在1943年,所罗门与希拉共同出资,聘请建筑大师弗兰克·劳埃德2赖特(Frank Lloyd Wright)设计了博物馆的新楼。
当然,设计者的人选也是希拉推荐的。
在希拉写给弗兰克的信中,她以“艺术神殿”(museum-temple)来形容自己对新博物馆的期望。
在1948年,得益于一次对艺术品经销商卡尔·尼尔伦多夫(Karl Nierendorf)的收购,博物馆又从他的730多件藏品中选购了一批作品加入到自己的收藏之中,其中主要以一些德国的表现主义绘画作品为主。
这次购买也许对于古根汉姆的未来发展是更加重要的,尼尔伦多夫以丰富的表现主义和超现实主义作品为主的藏品扩展了博物馆的原有收藏方向。
直至此时,整个博物馆的藏品范围已经涵盖了各类表现主义和超现实主义作品,其中也包括了保罗·克利、奥斯卡·考考斯卡(Oskar Kokoschka)以及胡安·米罗(Joan Miró)的作品。
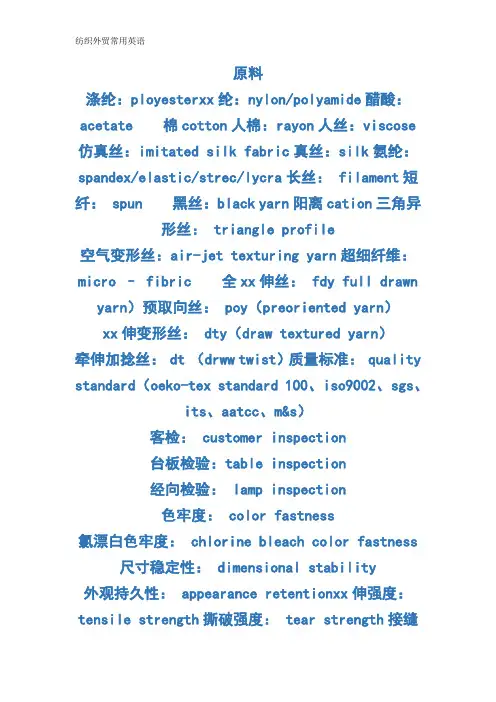
原料涤纶:ployesterxx纶:nylon/polyamide醋酸:acetate 棉cotton人棉:rayon人丝:viscose 仿真丝:imitated silk fabric真丝:silk氨纶:spandex/elastic/strec/lycra长丝: filament短纤: spun 黑丝:black yarn阳离cation三角异形丝: triangle profile空气变形丝:air-jet texturing yarn超细纤维:micro – fibric 全xx伸丝: fdy full drawn yarn)预取向丝: poy(preoriented yarn)xx伸变形丝: dty(draw textured yarn)牵伸加捻丝: dt (drww twist)质量标准: quality standard(oeko-tex standard 100、iso9002、sgs、its、aatcc、m&s)客检: customer inspection台板检验:table inspection经向检验: lamp inspection色牢度: color fastness氯漂白色牢度: chlorine bleach color fastness 尺寸稳定性: dimensional stability外观持久性: appearance retentionxx伸强度:tensile strength撕破强度: tear strength接缝滑裂: seam slippage抗起xx起球性: pilling resistance耐磨性: abrasion resistance拒水性:water repellency抗水性: water resistance织物密度: thread per inch/stich density纱支: yarn count xx: weight wool 羊xxm mohair xxrh、 rabbit hair 兔xxal alpaca 羊驼xx s silk 真丝j jute xx l linen 亚xx ram ramie 苎xx hem hemp 大xx t polyester 涤纶ws cashmere 羊绒wa angora xxxxxx la lambswool 羊羔xx ts tussah silk 柞蚕丝yh yark hair 牦xxxx md modal xx ch camel hair 驼绒cu cupro 铜 ms mulberry silk xx ly lycra xx卡 kender kender xx silkool silkool 大豆蛋白纤维cvc cvc 涤棉倒比n nylon xx纶r rayon 人棉v viscose 粘胶sp spendex 氨纶pp polypropylene 丙纶pv polyvinyl 维纶 a acrylic 腈纶tel tencel 天丝纱线纱线 yarns棉及其混纺纱线 cotton, cotton mixed & blendedyarns棉纱 cotton yarns涤棉纱 t/c & cvc yarns粘棉纱 cotton/rayon yarns棉晴纱 cotton/acrylic yarns棉/氨纶xx cotton/spandex yarns棉与其他混纺纱 cotton/others blended yarns xx纺系列纱线 woollen yarn seriesxx cashmere yarn series全羊xx纱 wool (100%) yarnsxx晴纱 wool/acrylic yarnsxx wool/polyester yarnsxx粘纱 wool/viscose yarnsxx/丝纱wool/silk yarnss羊xx/其他 wool/other yarns兔xx纱 angora yarnsxxxx线 shetland yarns牦xxxx纱 yak hair yarnsxxxx纱 lambswool yarns真丝系列纱线 silk yarn seriesxx white steam filature yarnsxx duppion silk yarns柞蚕丝 tussah silk yarns绢丝 spun silk yarns柞绢丝 tussah spun silk yarns柚丝 silk noil yarns真丝线 silk threads丝棉混纺纱 silk/cotton blended yarns xx纺系列纱线 halm yarn series***系列纱线 hemp yarn series亚xx系列纱线 linen yarn series苎xx系列纱线 ramie yarn seriesxx系列纱线 jute yarn series其他植物纤维纱线 other plant yarns剑xx系列纱线 sisal yarn series人造纤维和合成纱线 manmade & synthetic yarns晴纶纱 acrylic yarns晴纶仿羊绒 cashmere-like acrylic yarns仿兔xx sunday angora yarnsxx纶丝 polyamide yarns涤纶纱/丝 polyester yarns人造棉纱 spun rayon yarns天丝纱 tencel yarns弹力纱线 elastane yarns涤粘纱 t/r (polyester/rayon) yarns人棉混纺纱 spun rayon blended yarns其他化纤纱线 other synthetic yarns人造长丝或线 viscose filament yarns or threads花色纱线xx纱 chenille yarns大肚纱 big-belly yarns带子纱 tape yarnsxx纱 mohair yarns羽xx纱 feather yarns蜈蚣纱 centipede like yarns项链纱 neckline yarns辫子纱 pigtail yarns梯子纱 ladder yarns圈圈纱 loop yarnstt 纱 tt yarns结子纱 knot yarns乒乓纱 ping-pong yarns其它花色纱线 other fancy yarnsxx属纱线 metal yarns绳、xx缆 twine, cordage, rope & cables面料靛xx青年xx:indigo chambray人棉xx植绒:rayon cloth flockingpvc植绒:pvc flocking针织xx植绒:knitting cloth flocking珠粒绒:claimond veins倒xx:down pile making平绒:velveteen (velvet-plain)仿麂皮:micro suedexx皮植绒:jeans flocking xx丝纺:nylon taffeta (nylon shioze) xx塔夫泡泡纱:nylon seersucker taffeta 素面植绒:plain flockingxx花植绒:flocking(flower)雕xx植绒:embossing flocking皮革沟底植绒:leather imitation flocking xx植绒雕xx:embossing jeans flocking 兔羊绒大衣呢:angora cachmere overcoating 羊xx双面呢:double-faced woolen goods立绒呢:cut velvet顺xx呢:over coating粗花呢:costume tweed弹力呢:lycra woolen goods塔丝绒: nylon taslon塔丝绒xx子:n/taslon ripstop桃皮绒:polyester peach skin涤塔夫:polyester taffeta春亚纺:polyester pongee超细xxxx:micro fiberxx棉稠(平纹):nylon-cotton fabric (plain)重平xx棉稠:nylon-cotton-cotton fabric(doubleweft)人字xx棉纺:nylon-cotton fabric 斜纹xx棉纺:nylon-cotton fabric (twill)素色天鹅绒:solid velvet抽条磨xx天鹅绒:rib fleece velvet雪花天鹅绒:melange velvet轧花天鹅绒:ginning velvet粒粒绒xx:pellet fleece velvet xx棉混纺xx:linen/cotton blended fabricxx棉交织xx:linen/cotton mixed fabric素色xx巾xx:solid terry蚂蚁xx:fleece in one side素色xx:solid fleece鱼网xx:fleece彩条汗xx:color-stripes single jerseyt/r弹力xx:t/r bengalinet/c色织xx:t/c yarn dyed check fabric弹力仿麂皮:micro suede with spandext/r仿麂皮:t/r micro suede仿麂皮瑶粒绒复合xx:100%polyester micro suede bounding with polar fleece仿麂皮针织xx复合:100% polyester bounding with knitting micro suede fabric仿麂皮羊羔绒复合xx:100% polyester micro suedebounding with lamb fur蜡光缎:cire satine全消光xx丝纺:full dull nylon taffeta半消光xx丝纺:semi-dull nylon taffeta亮光xx:trilobal nylon全消光xx:full dull nylon taslan 全消光xx津xx:full dull nylon oxfordxxxx:nylon rip-stopxxxx:taslan rip-stop哑富xx:full dull micro polyester pongee 全消光春亚纺:full dull polyester pongee春亚纺xx子:polyester pongee rip-stop全消光涤纶桃皮绒:full dull polyester peach宽斜纹桃皮绒:big twill polyester peach 涤xx复合桃皮绒:poly/nylon peach 涤纶xx子:polyester taffeta rip-stop涤纶蜂巢xx:polyester honey taslan全消光涤纶低弹xx津xx:full dull poly texturedoxford涤xx交织桃皮绒:nylon/polyester inter-woven peach synthetic fibre 合成纤维chemical fibre 化学纤维 jute xx gunny cloth (bag) xxxx(袋) mixture fabric, blend fabric 混纺织物woven fabric 机织织物spun silk 绢丝 linen xx织物 woolen fabrics xx织物(品) cotton textiles 棉纺织品 cotton velvet 棉绒 cotton fabrics 棉织物(品) non-crushable 耐绉的 viscose acetal fibre 黏胶纤维 matching, colourcombinations 配色rayon fabrics 人造丝织物 artificial fibre 人造纤维 crewel work 绒线刺绣 mulberry silk xx, 家蚕丝 silk fabrics 丝织物silk spinning 丝纺 linen cambric 手帕亚xx纱 plain 素色figured silk 提花丝织物 jacquard 提花织物applique embroidery 贴花刺绣discolourization 褪色mesh fabric 网眼织物bondedfibre fabric 无纺织物 embroidered fabric 绣花织物 flax 亚xxlinen yarn 亚xx纱knitting 针织knitwear 针织品 hosiery 针织物 textile fabric 织物 ramee,ramie 苎xxtussah silk 柞蚕丝calico xx;本xx serge 哔叽camel hair cloth 长xx骆驼绒 plush 长xxtweed 粗(花)呢overcoating 大衣呢satin 缎子 flannel 法xx绒 worsted flannel 精纺法xx绒canvas 帆xx valetin xx tartan xx admiralty cloth 海军呢 cotton prints xxgabardinexxpongee茧绸brocadexx缎khaki drillsxxreversible khaki 双面卡cashmere 开司米anti-pressing standing velvet 抗xx力绒sheetings 阔幅平xx;被单xxfaille, bengaline, tussore xx melton 麦尔登呢wool serge xx哔叽cotton cloth, cotton piecegoods 棉xx bleached cotton cloth 漂白棉xx cottonserge 棉哔叽trueran 棉涤纶vinylon 维xx纶cotton sateen 棉缎cotton poplin 棉府绸cotton pongee 棉茧绸cotton plush 棉织长xxcotton gabardine 棉织xxpalace 派力斯seersucker, blisger crepe, plisse crepe 泡泡纱georgette xx纱herringbone 人字呢;xxflannelette 绒xxtaffeta xxcotton venetians xx缎broche quilts 提花床单xxmosquito netting 蚊帐纱grass cloth xxmackintosh cloth 橡胶防雨xxdrills 斜纹xxembroidered gauze 绣花纱罗linen, linencloth xxlinen canvas 亚xx帆xxlinen checks 亚xxxx iondanthren cloth 阴丹士林xxcamblet 羽纱tapestry satin 织xx缎crepe satin 绉(背)缎bobbin net xxacrylic fibres 腈纶artificial cotton 人造棉artificial silk, rayon 人造丝artificial wool 人造xxcapron, kapron xxdacron, terylene 的确良modelon xx涤纶nylon xx纶(耐纶)nylon chiffon xx薄绸orlon 奥纶terylene 涤纶c cotton 棉关于面料的缩写c::cotton 棉w:wool 羊xxm:mohair xxrh:rabbit hair 兔xxal:alpaca 羊驼xxs:silk真丝j:jute xxl:linen 亚xxts:tussah silk 柞蚕丝yh:yark hair 牦xxxxly:lycraxx卡ram:ramine 苎xxhem:hemp ***t:polyester 涤纶ws:cashmere 羊绒n:nylon xx纶(xx)a:acrylic 腈纶tel:tencel 天丝,是lyocellxx赛尔纤维的商品名la:lambswool 羊羔xxmd:model xxch:camel hair 驼xxcvc:chief value of cotton涤棉倒比(涤含量低于60%以下)ms:mulberry silk xxr:rayon 粘胶里料: lining面料:fabric平纹: taffeta斜纹:twill缎面: satin / charmeuse绡: lustrine提花: jacquard烂花: burnt-out春亚纺:pongeexx子: check条子: stripe双层: double –layer双色: two –tonexx: faille高士xx: koshibo雪纺: chiffonxx:georgette弹力xx: spandex/elastic/strec/lycra xxxx:jeanetxx津xx: oxford帆xx: cambric 涤棉p/c涤捻: t/r白条纺: white stripe黑条纺:black stripe 空齿纺: empty stripe水洗绒/桃皮绒: peach skinxx: peach twill绉绒: peachmoss玻璃纱: organdy常用服装xx语缩写a.h. armhole 夹圈abs area bounded staple fabric 面粘非织造xx adl acceptable defect level 允许疵点标准aql acceptable quality level 验收合xx标准attn. attention 注意aud. audit 稽查b. back 后b.h. button hole xx门/扣眼b.l. back length 后长b.p. bust point 胸点bk. black 黑色bl bust line 胸围线bmt basic motion time 基本动作时间bnl back neckline 后领圈线bnp/bnpt back neck point 后领点br back rise 后浪bsp back shoulder point 后肩颈点btm. bottom 衫脚btn. button xx扣c.v.c. chief value of cotton 棉为主的混纺物c/b (c.b.) center back 后中c/f (c.f.) center front 前中cad computer aided design 电脑辅助设计cae computer aided engineering 电脑辅助工程cal computer aided layout 电脑辅助排料cam computer aided manufacture 电脑辅助制造cap computer aided pattern 电脑辅助画样cbf center back fold 后中对折cbl center back line 后中线cbn-w center back neck point to waist 后颈点至腰cfl center front fold 前中对折ci corporate identify 企业标识cif cost, insurance & freight 到岸价clr. color 颜色cmt cutting, making, trimming 来料加工col. color 颜色cord. corduroy 灯心绒cs commercial standards 商业标准ctn. cotton 棉ctn. no. carton no. 纸箱编号d. denier 旦d. & k. damaged & kept 染厂对疵xx的认赔d.b. double-breasted 双襟d/y delivery 出货, 交付dbl double 双dbl ndl double needle 双针dept. department 部门dk. dark 深色doz. dozen 打e.g. exampli gratia / for example 例如el elbow line 手肘线emb. embroidery 绣花, 车花etc. et cetera=and so forth 等等exp. export 出口f. front 前fab. fabric xx料faq fair average quality 中等品fb freight bill 装货清单fnp front neck point 前颈点fob free on board 离岸价fqc field quality control 现场质量控制fty. factory 工厂g. green 绿色g.w. gross weight xx重gl grain line xx纹h. hips 坐围hl hips line 坐围线in. inch xx寸jkt. jacket 夹克k knit 针织l. large 大号l. line xxxx/号(纽扣大小单位)l. length xxl. left 左l.g. length grain 经向, 直纹lb. pound 磅lbl label 唛头, 商标loa length over all 全长m medium 中码m/b must be 必须m/c machine 机械mat. material 物料meas. measurement 尺寸mhl middle hips line 中臀围线mkt. market 市场mmts. measurements 尺寸n. to w.(n.-w.) nape to waist 腰直n.p. neck point 肩颈点ndl. needle 针nil nothing 无nk. neck 颈圈o/n order no. 定单号ojt on-the-job training 在职培训os over size 超大号ovrlk. overlock 及骨, 包缝p. purple 紫色p.o. no. production order no. 生产制造单编号p.o.b. post office box 邮箱p.p. paper pattern 纸样p.s.i. per square inch 每平方xx寸p/c polyester/cotton 涤棉混纺织物pa polyamide 聚酰胺pap posterior armpit point 腋窝后点pb private brand 个人商标pc. price 价xxpcs. pieces 件, 个pkg. package 包装pkt. pocket 口袋pls. please 请pnt point 点p-o-r product-o-rial system 吊挂系统pos. position 位置pp poly propylene 聚丙烯pv polyvinyl fibre 聚乙烯纤维pvc polyvinyl chloride 聚氯乙烯qc quality control 质量控制qly. quality 质量qpl qualified products list 合xx产品目录qty. quantity 数量r. right 右r.s. right side 正面r.t.w. ready to wear 成衣ref. reference 参考, 参照rej. reject 拒绝rm. room 场所rn. rayon 人造丝s small 小码s.a. seam allowance 止口s.b. single breasted 单排纽扣, 单襟s.p. shoulder point 肩端点s.p.i. stitch per inch 每xx寸线迹数s.p.m. stitch per minutes 每分钟线迹数s/b should be 应该sc shopping center 购物中心sgl ndl single needle 单针slv. sleeve 袖子smpl sample 样板snl single 单snp side neck point 颈侧点spec. specification 细则sq. ft. square feet 平方xx尺sty. style 款式sz. size 尺码t/c terylence/cotton 涤棉织物t/s top stitches 间面线tqc total quality control 全面质量控制tqm total quality management 全面质量管理t-s t-shirt t恤衫ubl under bust line 下胸围线v. violet 紫色w woven 梭织w. waist 腰围w. width 宽度w.b. waistband 裤头w.i.p. work in process 半成品w.l. waist line 腰线w.s. wrong side 反面w/ withwmsp. workmanship 手工, 车工wt. weight 重量x king size 特大号xl extra large 特大号xxl extra extra large 超特大号y. yellow 黄色yd. yardage 码数gws garment wash sample 成衣洗水样板rn # reference number 参考号lcl less container loaded 拼柜?p/c polyester/cotton 涤纶/棉t/c terylene/cotton 涤纶/棉ext. extension number分机号cell. cellular phone 手机upc universal product code 通用产品码,通用货单代码cmpt cut/make/pack/trimiq including quotaeq excluding quotas/y sample yardagelsaw. 穿后左侧骨(left side as weared)sku stock keeping unit为储存单位。
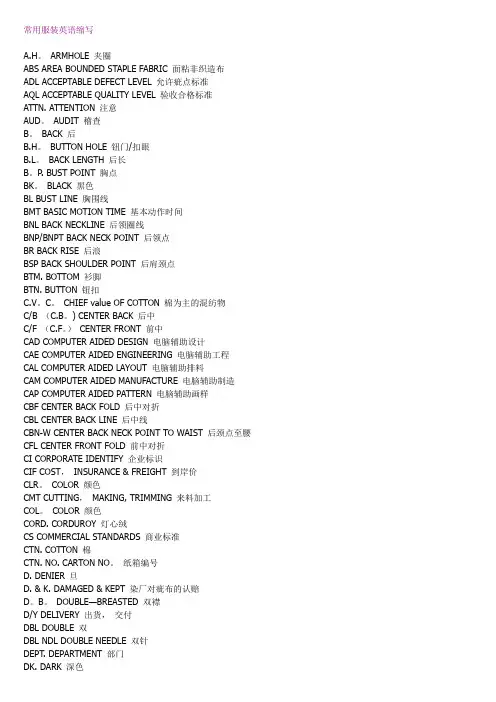
常用服装英语缩写A.H。
ARMHOLE 夹圈ABS AREA BOUNDED STAPLE FABRIC 面粘非织造布ADL ACCEPTABLE DEFECT LEVEL 允许疵点标准AQL ACCEPTABLE QUALITY LEVEL 验收合格标准ATTN. ATTENTION 注意AUD。
AUDIT 稽查B。
BACK 后B.H。
BUTTON HOLE 钮门/扣眼B.L。
BACK LENGTH 后长B。
P. BUST POINT 胸点BK。
BLACK 黑色BL BUST LINE 胸围线BMT BASIC MOTION TIME 基本动作时间BNL BACK NECKLINE 后领圈线BNP/BNPT BACK NECK POINT 后领点BR BACK RISE 后浪BSP BACK SHOULDER POINT 后肩颈点BTM. BOTTOM 衫脚BTN. BUTTON 钮扣C.V。
C。
CHIEF value OF COTTON 棉为主的混纺物C/B (C.B。
) CENTER BACK 后中C/F (C.F。
)CENTER FRONT 前中CAD COMPUTER AIDED DESIGN 电脑辅助设计CAE COMPUTER AIDED ENGINEERING 电脑辅助工程CAL COMPUTER AIDED LAYOUT 电脑辅助排料CAM COMPUTER AIDED MANUFACTURE 电脑辅助制造CAP COMPUTER AIDED PATTERN 电脑辅助画样CBF CENTER BACK FOLD 后中对折CBL CENTER BACK LINE 后中线CBN-W CENTER BACK NECK POINT TO WAIST 后颈点至腰CFL CENTER FRONT FOLD 前中对折CI CORPORATE IDENTIFY 企业标识CIF COST,INSURANCE & FREIGHT 到岸价CLR。
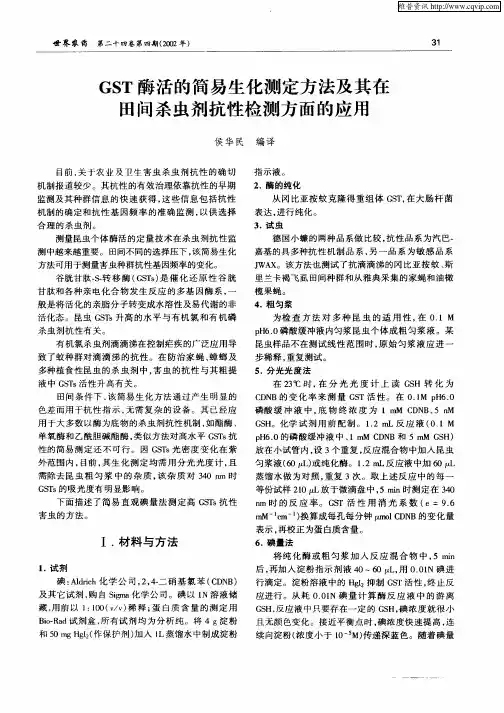
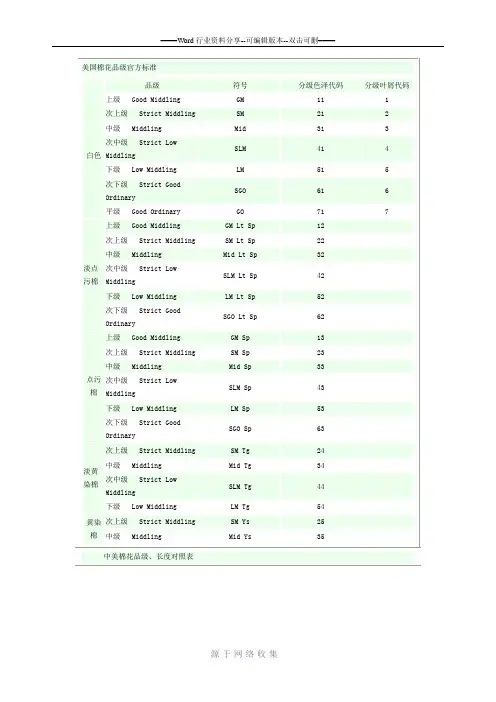
美国棉花品级官方标准品级符号分级色泽代码分级叶屑代码白色上级 Good Middling GM 11 1 次上级 Strict Middling SM 21 2 中级 Middling Mid 31 3 次中级 Strict LowMiddlingSLM 41 4 下级 Low Middling LM 51 5 次下级 Strict GoodOrdinarySGO 61 6 平级 Good Ordinary GO 71 7淡点污棉上级 Good Middling GM Lt Sp 12 次上级 Strict Middling SM Lt Sp 22 中级 Middling Mid Lt Sp 32 次中级 Strict LowMiddlingSLM Lt Sp 42 下级 Low Middling LM Lt Sp 52 次下级 Strict GoodOrdinarySGO Lt Sp 62点污棉上级 Good Middling GM Sp 13 次上级 Strict Middling SM Sp 23 中级 Middling Mid Sp 33 次中级 Strict LowMiddlingSLM Sp 43 下级 Low Middling LM Sp 53 次下级 Strict GoodOrdinarySGO Sp 63淡黄染棉次上级 Strict Middling SM Tg 24 中级 Middling Mid Tg 34 次中级 Strict LowMiddlingSLM Tg 44 下级 Low Middling LM Tg 54黄染棉次上级 Strict Middling SM Ys 25 中级 Middling Mid Ys 35 中美棉花品级、长度对照表美棉品级中棉品级上级 Good Middling 1次上级 Strict Middling 2中级 Middling 3次中级 Strict Low Middling 4下级 Low Middling 5次下级 Strict Good Ordinary 6平级 Good Ordinary 7级以上美棉长度(单位:英寸)中棉长度(单位:毫米)1 251 1/32 261 1/16 271 3/32 281 1/8 291 5/32 291 3/16 301 7/32 311 1/4 321 9/32 331 5/16 331 11/32 341 3/8 35。
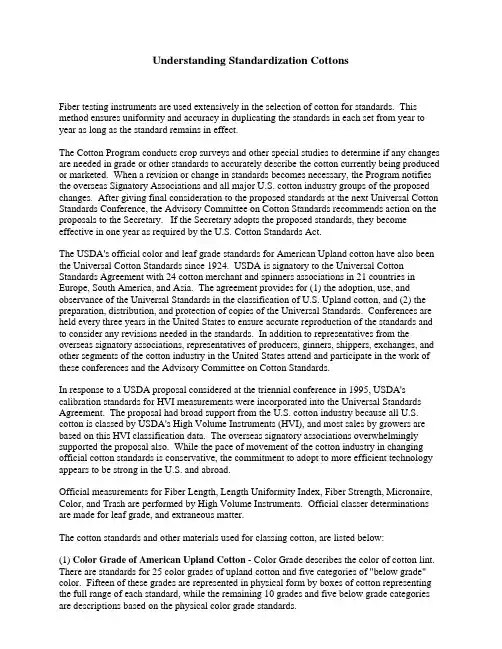
Understanding Standardization CottonsFiber testing instruments are used extensively in the selection of cotton for standards. This method ensures uniformity and accuracy in duplicating the standards in each set from year to year as long as the standard remains in effect.The Cotton Program conducts crop surveys and other special studies to determine if any changes are needed in grade or other standards to accurately describe the cotton currently being produced or marketed. When a revision or change in standards becomes necessary, the Program notifies the overseas Signatory Associations and all major U.S. cotton industry groups of the proposed changes. After giving final consideration to the proposed standards at the next Universal Cotton Standards Conference, the Advisory Committee on Cotton Standards recommends action on the proposals to the Secretary. If the Secretary adopts the proposed standards, they become effective in one year as required by the U.S. Cotton Standards Act.The USDA's official color and leaf grade standards for American Upland cotton have also been the Universal Cotton Standards since 1924. USDA is signatory to the Universal Cotton Standards Agreement with 24 cotton merchant and spinners associations in 21 countries in Europe, South America, and Asia. The agreement provides for (1) the adoption, use, and observance of the Universal Standards in the classification of U.S. Upland cotton, and (2) the preparation, distribution, and protection of copies of the Universal Standards. Conferences are held every three years in the United States to ensure accurate reproduction of the standards and to consider any revisions needed in the standards. In addition to representatives from the overseas signatory associations, representatives of producers, ginners, shippers, exchanges, and other segments of the cotton industry in the United States attend and participate in the work of these conferences and the Advisory Committee on Cotton Standards.In response to a USDA proposal considered at the triennial conference in 1995, USDA's calibration standards for HVI measurements were incorporated into the Universal Standards Agreement. The proposal had broad support from the U.S. cotton industry because all U.S. cotton is classed by USDA's High Volume Instruments (HVI), and most sales by growers are based on this HVI classification data. The overseas signatory associations overwhelmingly supported the proposal also. While the pace of movement of the cotton industry in changing official cotton standards is conservative, the commitment to adopt to more efficient technology appears to be strong in the U.S. and abroad.Official measurements for Fiber Length, Length Uniformity Index, Fiber Strength, Micronaire, Color, and Trash are performed by High Volume Instruments. Official classer determinations are made for leaf grade, and extraneous matter.The cotton standards and other materials used for classing cotton, are listed below:(1) Color Grade of American Upland Cotton - Color Grade describes the color of cotton lint. There are standards for 25 color grades of upland cotton and five categories of "below grade" color. Fifteen of these grades are represented in physical form by boxes of cotton representing the full range of each standard, while the remaining 10 grades and five below grade categories are descriptions based on the physical color grade standards.(2) Leaf Grade of American Upland Cotton - Leaf grade describes the leaf or trash content in the cotton. There are seven leaf grades designated as leaf grade A1" through A7" , and all are represented by physical standards. In addition, there is a descriptive Abelow grade@ (leaf grade 8) designation.The current reserve set of the Universal Standards for Color and Leaf Grades of American Upland Cotton is sealed and deposited in a vault in Memphis, TN. Copies of these standards, containing six samples or biscuits, known as practical forms, are prepared and sold for $125f.o.b. Memphis, or $130 domestic delivery. The utmost care is taken to keep the range of color and leaf in all copies of each grade standard as nearly the same as possible. The standards for the seven White color grades contain the leaf content of the respective leaf grades. For example, the standard for Good Middling White (11) color contains the standard leaf content for Leaf Grade "l" and the standard for Low Middling White contains the standard leaf content of Leaf Grade "5".The color of cotton deepens with age more in the high grades than in the low grades. The color of the cotton in the standards may differ considerably as time goes by, especially when the standards are stored under extreme conditions of temperature and/or relative humidity. Because of this natural propensity for change, copies of the grade standards must be freshly prepared annually and are effective for one year beginning each July 1.(3) Grades of American Pima Cotton - There are six official grades (Grades A1" through A6") for American Pima cotton, all represented by physical standards. In addition, there is a descriptive "below grade" designation. Copies of the American Pima Grade Standards are sold for $160 f.o.b. Memphis, or $165, surface delivery.(4) Fiber Length, Length Uniformity Index, and Fiber Strength - The Cotton Program uses High Volume Instruments for the classification of all Upland and American Pima cotton. There are Universal HVI Calibration Standards for American Upland cotton for calibrating length, length uniformity index, and strength. The present official standards for fiber or staple length provide for various lengths in terms of inches and fractions of an inch ranging from 13/16 inches upward, generally in graduations of one thirty-seconds of an inch. The upper half mean length of fiber is measured by the HVI system in hundredths of an inch and length is converted to thirty-seconds of an inch. Length uniformity index is the ratio between the mean length and the upper half mean length expressed as a percentage. Fiber strength is measured in grams per tex and represents the force in grams to break a bundle of fibers one tex unit in size. Both the Universal HVI Calibration Standards for Upland cotton and the USDA HVI Calibration Cottons for American Pima cotton are available, in 5-pound boxes, for $95 f.o.b. Memphis, TN or $100 domestic delivery. Two such cottons, which span a range in length and strength, are required for instrument calibration.(5) Micronaire - Official cotton standards for micronaire or fiber fineness and maturity are described as the measure of such qualities provided by air flow instrument tests in terms of micronaire readings in accordance with established procedures. These procedures include descriptions of approved weighing and testing equipment and standard operating instructions for the equipment. Mike readings are expressed in units to the nearest one tenth, (e.g. 3.1, 3.2, 3.3, 3.4); however, common practice within the industry is to drop the decimal point when reporting "mike" readings (e.g. 31, 32, 33, 34). Mike readings of American Upland cotton range from 2.4 to 6.0. About 75 percent of the cotton crop falls in the 3.5 to 4.9 range.The Cotton Program participates and manages the International Calibration Cotton Standards (ICCS) Program which, under the guidance of the ICCS Committee, establishes standard valuesfor International Calibration Cottons. Currently, there are six International Calibration Cotton Standards for Micronaire Only that span the range of micronaire scale from 2.6 to 5.5. The price for a 1-pound roll of the micronaire-only calibration cotton standards is $28 f.o.b. Memphis, or $31 domestic delivery. This price also includes the cost of a semiannual check test program which aids in achieving a common test level on a global basis. Each laboratory that purchases calibration cottons receives two samples for check tests each six-month period, and upon return of data, receives a report on its results compared to other participants. These standards have been purchased by more than 500 laboratories worldwide, and about 250 of the laboratories participated in the most recent semiannual check test. In addition to the semiannual check test, a quarterly check test for micronaire equipment is available to overseas arbitration laboratories. This program, which ensures a common level of test results, is available for a fee of $21 per quarter per laboratory.(6) Trash - The trash measurement is made by the HVI video trashmeter which measures the percentage area and particle count of trash on the sample's surface. A trashmeter calibration tile and cotton trash level samples, mounted under glass, are available for calibration and verification of the trash measurements. The cost of the trash tile is $30 f.o.b. Memphis, TN or $33 domestic delivery. The cost of the trash level samples is $40 f.o.b. Memphis, TN ($240 for full set of six) or $44 domestic delivery ($264 for full set of six). The range of trash levels usually encountered is included in a set of six samples.(7) Color - The HVI colormeter measures reflectance (Rd) and yellowness (+b). The Rd indicates the sample's degree of grayness and +b indicates how much yellow color is in the sample. Ceramic color calibration tiles for the HVI colormeter are distributed by the Cotton Program. The cost for a five tile set is $125 f.o.b. Memphis, TN or $130 domestic delivery. (8) Other Standards - There are also Universal Standards for descriptions of laboratory atmospheric conditions and conditioning practices and procedures. In addition, a brochure entitled "Guidelines for HVI Testing" has been prepared that contains standardized procedures for HVI testing which will enable users of HVI systems to achieve a common test results level for each measured property.Programs for Checking HVI Measurements - An HVI Check Test Program is conducted to ensure a standard level of testing. Two samples are sent to participants each month for testing. The returned data are summarized and each participant receives a report comparing their results to established values for the samples. The annual cost of the HVI check test program is $168 domestic and $324 overseas. An HVI Level Assessment Program was initiated in 1993 in response to the worldwide proliferation in the use of HVI measurements in trading Upland cotton in the world markets. Participants submit check samples that have been tested by HVI for retesting by the Quality Assurance Unit in much the same manner as the Cotton Programs internal supervisory procedures. The participant receives a report showing how well the results of the two tests compare. This program has been beneficial in achieving a common test level worldwide. Cost for this program is $4 per sample in lots of 10 samples.Summary - USDA's cotton standards are used almost exclusively within the U.S. and are broadly accepted in the foreign marketing of Upland-type cotton, especially that grown in the United States. The standards provide a sound base for establishing market values that gain more acceptance with each year's crop. International trading disputes are settled by utilizing U.S. standards. The check test programs contribute to the growing confidence in USDA's cotton standards and also ensure a common level of test results for all users.。
1.Cotlook A和Cotlook B棉价指数的含义是什么?答:Cotlook棉价指数是反映国际棉花市场现货价格水平的一个指标,由Cotton Outlook 出版。
Cotlook棉价指数分Cotlook A指数和Cotlook B指数。
报价单位为美分/磅。
Cotlook A指数:是国际陆地棉贸易中选择十五个国家中五个最低的北欧现货到岸价的平均值。
A指数的基准质量标准是M级1-3/32英寸(相当于中国328级)。
报价的地理基础是北欧,所报的条件为到岸价(C.I.F),其中包括运输费、保险费以及盈利和代理商的佣金。
目前这十五个棉花报价点是:孟菲斯、乌兹别克斯坦、墨西哥、土耳其、坦桑尼亚、加利福尼亚、巴基斯坦、澳大利亚、印度、巴拉圭、中国(329级)、非洲法属区、希腊、叙利亚、西班牙。
Cotlook B指数:是国际上八个陆地棉品种中三个最低的北欧现货到岸价的平均值。
B指数的基准质量标准是SLM级1-3/32英寸(相当于中国428级)。
2.美国七大棉花现货市场价格是指什么价格?答:美国七大棉花现货市场价格:是指美国东南市场、北三角洲、南三角洲、东德克萨斯、西德克萨斯、西南市场以及圣约金流域市场标准级(相当于国棉427级)棉花的产地提货价。
美国农业部农业市场司棉花项目处负责每天收集整理发布七个市场的平均报价,七市场价格基本代表美国棉花现货价格水平。
美国陆地棉标准级是指白棉SLM 1-1/16'(相当于国棉427级),叶屑等级4,马克隆值3.5,3.6-4.3,4.9,强力26.5-28.4克/特克斯;美棉中等级是指白棉M 1-3/32'(相当于国棉328级)。
七市场的皮马棉主要是指2级和3级,长度为35毫米和37毫米。
交易量以包为单位,每包480磅。
3.外棉中国主港报价指的是什么价格?答:外棉主港报价是世界主要棉花主要出口国棉花的CNF参考报价,包括成本和运费,不含保险;完税价包含关税、增值税和港口费用。
22个瑞⼠家族,掌控了“世界名表”michel Parmigiani以拥有Sandoz家族基⾦会著名,其财富来⾃Sandoz家族名下的制药企业如诺华(Novartis)。
该基⾦会是Parmigiani Fleurier表⼚和MHF(包括⾼端机芯制造⼚Manufacture Vaucher)的主要持有⼈,还拥有⼀系列的古董艺术品及钟表收藏。
由此可知Parmigiani为何有底⽓在各地扩张,以及它为何在修理古董钟表这样需要巨⼤投⼊的领域⾥如此强势。
排名第⼆:Wertheimer家族(60-70亿瑞⼠法郎)。
Gérard 和 Alain Wertheimer兄弟Gérard 和 AlainWertheimer兄弟拥有⾹奈⼉制表公司,同时是Bell & Ross的投资⼈。
⾹奈⼉为何能够如此⼀步步推出⾃⼰不断提⾼的腕表产品就不难理解了吧。
排名第三: ⼤名⿍⿍的Hayek家族(40-50亿瑞⼠法郎)。
⼩海耶克Nick hayek⽼海耶克Nicholas hayek该家族是斯沃琪集团的最⼤股东,Nick Hayek Jr.是集团总裁,Nayla是集团董事会主席、Harry Winston总裁,其⼦Marc Hayek是Breguet、Blancpain、Jaquet Droz总裁,Hayek家族还在持续加强着对于集团的控制。
宝玑排名第四:Johann Rupert(40-50亿瑞⼠法郎)。
Johann Rupert是仅次于LVMH的全球第⼆⼤奢侈品集团历峰集团执委会主席。
排名第五: Mouawad家族(20-30亿瑞⼠法郎)。
Fred和Pascal该家族拥有⼀系列欧洲珠宝店。
三兄弟中,Fred和Pascal负责经营珠宝业务,Alain管理⾃⼰2011年在⽇内⽡创⽴的Mouawad Watch Division和Manufacture Mouawad SA,专注开发复杂功能机芯和Blacksand品牌产品,⼀般圈外⼈⼠对于这个富豪家族所知不多。
ORIGINALRESEARCHpublished:12February2016doi:10.3389/fpls.2016.00139
FrontiersinPlantScience|www.frontiersin.org1February2016|Volume7|Article139Editedby:PaulaCasati,CentrodeEstudiosFotosintéticosyBioquímicos-CONICET,Argentina
Reviewedby:SebastianPabloRius,CentrodeEstudiosFotosintéticosyBioquímicos-CONICET,ArgentinaCaiguoZhang,UniversityofColorado,Denver,USA
*Correspondence:JinhongChenjinhongchen@zju.edu.cn;ShuijinZhushjzhu@zju.edu.cn
Specialtysection:ThisarticlewassubmittedtoPlantGeneticsandGenomics,asectionofthejournalFrontiersinPlantScience
Received:11December2015Accepted:27January2016Published:12February2016
Citation:DongY,LiC,ZhangY,HeQ,DaudMK,ChenJandZhuS(2016)GlutathioneS-TransferaseGeneFamilyinGossypiumraimondiiandG.arboreum:ComparativeGenomicStudyandtheirExpressionunderSaltStress.Front.PlantSci.7:139.doi:10.3389/fpls.2016.00139
GlutathioneS-TransferaseGeneFamilyinGossypiumraimondiiandG.arboreum:ComparativeGenomicStudyandtheirExpressionunderSaltStress
YatingDong1,CongLi1,YiZhang1,QiulingHe1,MuhammadK.Daud2,JinhongChen1*andShuijinZhu1*
1DepartmentofAgronomy,ZhejiangUniversity,Hangzhou,China,2DepartmentofBiotechnologyandGeneticEngineering,KohatUniversityofScienceandTechnology,Kohat,Pakistan
GlutathioneS-transferases(GSTs)playversatilefunctionsinmultipleaspectsofplantgrowthanddevelopment.Acomprehensivegenome-widesurveyofthisgenefamilyinthegenomesofG.raimondiiandG.arboreumwascarriedoutinthisstudy.Basedonphylogeneticanalyses,theGSTgenefamilyofbothtwodiploidcottonspeciescouldbedividedintoeightclasses,andapproximatelyalltheGSTgeneswithinthesamesubfamilysharedsimilargenestructure.Additionally,thegenestructuresbetweentheorthologswerehighlyconserved.ThechromosomallocalizationanalysesrevealedthatGSTgeneswereunevenlydistributedacrossthegenomeinbothG.raimondiiandG.arboreum.TandemduplicationcouldbethemajordriverfortheexpansionofGSTgenefamilies.Meanwhile,theexpressionanalysisfortheselected40GSTgenesshowedthattheyexhibitedtissue-specificexpressionpatternsandtheirexpressionwereinducedorrepressedbysaltstress.ThosefindingsshedlightsonthefunctionandevolutionoftheGSTgenefamilyinGossypiumspecies.
Keywords:saltstress,cotton,phylogeneticanalysis,genefamily,GST
INTRODUCTIONGlutathioneS-transferases(GSTs;EC2.5.1.18)areancientandubiquitousproteinsencodedbyalargegenefamilythatfunctionversatilelyinorganism.Asakindofdetoxificationenzymes,GSTscatalyzetheconjugationofthetripeptideglutathione(GSH)toavarietyofhydrophobic,electrophilic,andusuallycytotoxicexogenouscompounds(Marrs,1996).Therearecytosolic,mitochondrialandmicrosomalGSTsderivedfromagenesuperfamilythatareinvolvedinthemetabolismofxenobiotics(Armstrong,1997).Ingeneral,microsomalandmitochondrialGSTsshowgreatdifferencesinbiosynthesisandsequenceidentitywithcytosolicGSTs(Mohsenzadehetal.,2011).Inplants,mostcytosolicGSTstypicallyfunctionaseitherheterodimerorhomodimerofsubunitsrangingfrom23to29kDainmolecularweight(Frova,2006).EachsubunitcontainsaconservedGSH-bindingsite(G-site)intheN-terminaldomainandanelectrophilicsubstratebindingsite(H-site)locatedintheC-terminaldomain(Edwardsetal.,2000).GSTscanalsobemonomeric,likeDHARandLambdaGSTinArabidopsis(Dixonetal.,2002).GSTscomprise∼2%ofsolubleproteinsinplants(Rezaeietal.,2013).BasedongeneorganizationandaminoDongetal.GSTGeneFamilyinCottonsacidsequencesimilarity,thesolubleGSTscanbedividedintoeightclasses,includingPhi(F),Tau(U),Lambda(L),dehydroascorbatereductase(DHAR),Theta(T),Zeta(Z),γ-subunitoftranslationelongationfactor1B(EF1Bγ),andtetrachlorohydroquinonedehalogenase(TCHQD;Sheehanetal.,2001;Dixonetal.,2002;Liuetal.,2013).Amongthese,thefirstfourclassesarespecifictoplant.Genome-wideanalyseshaveindicatedthattherewere55GSTgenesinArabidopsis(Sappletal.,2009),79inrice(Soranzoetal.,2004;Jainetal.,2010),84inbarley(Rezaeietal.,2013),23insweetorange(Licciardelloetal.,2014),and27inJapaneselarch(Yangetal.,2014).SincethefunctionforplantGSTsinherbicidesdetoxificationwasfirstlydetected,manyresearcheshavefocusedontheirfunctionsundervariousstimulations.IthasbeenconfirmedthatGSTscanbeinducedbyplanthormonessuchasauxins,ABA,andethylene,aswellasbioticandabioticstresses(Dixonetal.,1998).Todate,abundantGSTgeneshavebeencharacterizedfromnumerousplantspecies.AmongtheseGSTgenes,TauandPhiclassesaremostinvestigatedprobablybecauseoftheirabundantpresenceinplantkingdom.AtGSTU26inArabidopsiswasinducedbythechloroacetanilideherbicides,alachlorandmetolachlor,thesafenerbenoxacor,andlowtemperatures(Nutricatietal.,2006).TheOsGSTU5inriceshownhighactivitytowardchloro-s-triazineandacetanilideherbicides(Choetal.,2006),andoverexpressionofOsGSTU4inArabidopsisimprovedthetolerancetosalinityandoxidativestresses(Sharmaetal.,2014).TheexpressionlevelsofTaGSTU1BandTaGSTF6wereincreasedunderdroughtstressinwheat(Galleetal.,2009).Meanwhile,35of56SbGSTUsinSorghumshownsignificantresponsetoabioticstressesincludingcold,PEGandhighsalinity(Chietal.,2011).TheexpressionofGmGSTL1fromsoybeanintransgenicArabidopsiscouldalsoalleviatethesymptomsundersaltstress(ChanandLam,2014).ManyothersimilarresearchesonGSTfamilyandtheirfunctionswerereportedrecently(Uranoetal.,2000;Thometal.,2001;Maetal.,2009;Jietal.,2010).However,littleisknownaboutthisgenefamilyincotton,especiallytheirfunctionundersaltstress.Cotton,whichbelongstothegenusofGossypium,isconsideredthemainsourceofnaturalfiberandcultivatedworldwide.Thereare∼45diploid(2n=2x=26)and5tetraploid(2n=4x=52)species.Cottonisanidealmodelsystemforplantpolyploidresearch(Kadir,1976;Groveretal.,2007).Withcompletionofthegenomesequencingofthetwodiploidcottonspecies,G.raimondii(Patersonetal.,2012;Wangetal.,2012)andG.arboreum(Lietal.,2014),genome-wideanalysesofallrelatedgeneshavebeenrealized.G.raimondiiandG.arboreumweretheputativedonorspeciesfortheDandAchromosomegroupsoftetraploidcottonspecies,respectively(Kadir,1976;Groveretal.,2007).Here,weconductedasystematicstudyofGSTgenefamilyinG.raimondiiandG.arboreumtoidentifythecharacterizationandphylogeneticrelationshipsbetweenthetwospecies.FunctionaldiversificationandexpressionprofilesofGSTgenesinresponsetosaltstresswerealsoinvestigated.ItmayelucidatetheevolutionmechanismofGSTgenefamilyincotton,whichwillalsopromoteustoperformafurtherinvestigationonthestressresponsivegenesthatwillprovidevaluableinformationforbreedingstress-resistantcotton.