Wavelength dependence of linear polarization in the
- 格式:pdf
- 大小:1.03 MB
- 文档页数:7
第50卷第1期 Vol.50No.l红外与激光工程Infrared and Laser Engineering2021年1月Jan. 2021超表面透镜的宽带消色差成像(特邀)莫昊燃1’2,纪子韬\郑义栋\梁文耀\虞华康\李志远1(1.华南理工大学物理与光电学院,广东广州510641;2.广东晶启激光科技有限公司,广东东莞523808)摘要:超透镜是一种由二维亚波长阵列结构表面所设计的透镜,其对光场中振幅、相位和偏振的调控能力较灵活,同时具有低损耗、易集成、超轻薄等优点,近些年引起了科研人员广泛的研究兴趣。
然而在大多数情况下,针对特定波长设计的超透镜会遭受较大的色差,从而限制了其在多波长或宽带应 用中的成像作用。
超透镜因其二维平面结构引入了新的自由度,在对色差的消除上体现了新的潜力。
文中报道了多种不同的消色差超透镜设计及其消色差调控机理,并对现有的消色差超透镜从调制波段 类型进行了分类,如对离散波长的和对连续波长的消色差超表面透镜,后者又可从工作模式上分类为透射型和反射型,最后介绍了超透镜阵列在成像上的应用以及其在大景深宽带消色差器件上的前景。
关键词:超表面;超透镜;消色差聚焦透镜中图分类号:0436 文献标志码:A DOI:10.3788/IRLA20211005Broadband achromatic imaging with metalens {Invited)Mo Haoran1’2,Ji Zitao1,Zheng Yidong1,Liang Wenyao1,Yu Huakang1,Li Zhiyuan1(1. School of Physics and Optoelectronics, South China University of Technology, Guangzhou 510641, China;2. Guangdong Full-spectra Laser Technology Co., Ltd, Dongguan 523808, China)Abstract:Metalens,the specific type of lens designed with the surfaces mading of two dimensional array at the subwavelength scale,has shown great flexibilities to control the light field,including the arbitrary modulation abilities of amplitude,phase and polarization at the subwavelength scale.Moreover,the metalens possesses the unique advantages of low loss,integratable and conformable design and ultrathin,therefore attracts immense attentions in recent years.However,in most cases,the metalens designed for a specific wavelength may penetrate through the large chromatic aberration,which limits their usefulness in multi-wavelength or broadband applications.On the other hand,the metalens has renewed new degrees of freedom due to its two-dimensional planar structure,which has the potential in the elimination of chromatic aberration.Some different typical achromatic metalens designs and their achromatic modulation mechanism were reviewed,the existing achromatic metalens were classified from the types of modulated light bands,such as the achromatic matelens for discrete and continuous wavelength respectively,and the latter can be classified as transmissive and reflective from the working mode.Finally,the application of metalenses array in imaging and their prospect of broadband achromatic devices of large depth of field were introduced.Key words:metasurfaces;metalens;achromatic focusing lens收稿日期:2020-11 -14;修订日期:2020-12-29基金项目:国家重点研发计划(2018YFA0306200);国家自然科学基金(11974119, 12074127, 11504114);广州市科技计划项目(201904010105);中央高校基本科研业务费专项资金(2019ZZ50);华南理工大学教研教改项目(x2wl-Yl 190281)20211005-1第1期红外与激光工程第50卷0引言透镜是光学应用的基本元件,在数码相机、激 光、光学传感、安防、车载等各个领域都有着广泛的 应用。


1, in the crystal diffraction, can use the visible light? The relationship between the diffraction intensity and the diffraction intensity of the high index crystal clusters is higher than that of the low index crystal clusters.2, try to prove that the face centered cubic lattice is body centered cubic; cubic lattice is face centered cubic.3, covalent binding, two electron atom cloud overlap attraction, and close to the atomic, electronic clouds overlap will produce enormous repulsion. How to explain it.4, one-dimensional atomic chain, positive and negative ion distance is a, and the Madelung constant.5, what is the difference between a long wavelength optical wave and long wave acoustic branches in nature? From the experimental curve, a high density of lattice wave modes. Long acoustical waves can lead to macroscopic polarization of ionic crystals.6, the atomic mass of M, spacing a, restoring force constants for simple one-dimensional lattice B, the frequency of the wave, and for(1) the total energy of the wave,(2) the average total energy of each atom.7, tight binding model, the inner layer of electrons can be compared with the outer band, which is wide, why?8, the known one-dimensional lattice of electrons can beIn the formula, a is the lattice constant, and M is the mass of the electron.(1) band width,(2) the average speed of electrons,(3) effective mass of electrons at the top and bottom of the band1.1 in crystallography, the cell is selected according to what properties of crystal?[answer]In crystallography, the cell selection principle is to consider the periodic and crystal structure considering macroscopic crystal symmetry.Six what is the crystal system of the 1.2 corners of the compact and a unit cell containing a few atoms?[answer]Six angle stacking six angle system, a cell (parallelepiped) contains two atoms.1.3 in the crystal diffraction, why not use visible light?[answer]The magnitude of the distance between the atoms in crystal meters to the atomic lattice became diffractive grating, wavelength Ying Xiaoyu meters. But the wavelength of visible light was 7.6?4.0 meters, is 1000 times the distance between the atoms in crystal. Therefore, in crystal diffraction, can not use visible light.2.1 covalent binding, two electron atom cloud overlap attraction, and close to the atomic, electronic clouds overlap will produce enormous repulsion. How do you explain it?[answer]Covalent binding, the formation of covalent bond pairing of electrons, they spin in the opposite direction, the two electron electron clouds overlap makes the energy of the system is reduced, stable structure. But when atoms near, inside the atom filled shell electron electron clouds overlap, quantum states of the same electronic produced enormous repulsion, the energy of the system increases rapidly.2.2 why many metals are dense structures?[answer]Metal binding by principle of minimum energy constraints and atoms and a total of electron cloud of the Coulomb energy should as far as possible low (absolute value as much as possible). Atomic more compact, atom and a total of electron cloud on the more closely, Coulomb energy is low. So, many metal structure for stacking structure.3.1 what is the normal vibration mode? Whether the normal vibration wave number, wave number or vibration mode number is the same thing?[answer]The vibration of the vibration frequency of the vibration of the resonant vibration of neglect to discuss in order to make the problem is simplified and can seize the main contradiction in the analysis of lattice vibrations, the inter atomic interaction in a Taylor series in the non linearapproximation called harmonic approximation. In the harmonic approximation, by N atoms of crystal lattice vibration, equivalent 3N independent harmonic oscillator. Each sub model called normal vibration mode, which corresponds to all the atoms in the model, it is the lattice vibrational modes in the most simple basic vibration mode. Atoms, or said lattice vibration wave is usually a normal vibrational modes of linear superposition.Normal vibration number, lattice, or the number of lattice vibration mode number is one thing, this number is equal to all the atoms in a crystal and the number of degrees of freedom, which is equal to 3N.What is the difference between the 3.2 long branch of optical lattice waves and long wave acoustic branches in nature?[answer]Characteristics of long wavelength optical lattice is within each cell in different atoms relative vibration, vibration frequency is high, it contains all of the lattice vibrations of the highest frequency of vibration mode. Long acoustic branches of lattice is characterized in that the original cells of different atomic no relative displacement, the original cells do movement as a whole, the vibration frequency is low, it contains the lattice vibration frequency of the lowest mode of vibration, wave velocity is a constant. Any crystal there are acoustic branches of lattice, but simple lattice (non lattices) crystal optical lattice does not exist.3.3 the temperature must be, the number of phonons of an optical wave is much, or the number of phonons in the acoustic wave.[answer]The frequency of the wave (average) phonon number.Because the frequency of the optical wave is higher than the frequency of the acoustic wave, (), (), so in the temperature of a certain case, the number of phonons of an optical wave is less than the number of phonons of acoustic wave.3.4 long acoustical waves can lead to macroscopic polarization of ionic crystals?[answer]Long wavelength optical lattice so can lead to macroscopic polarization of ionic crystals, the root is long optical lattice wave makes the original cell in different atoms (positive and negative ions) produced a relative displacement. Is the characteristics of long wavelength acoustical lattice waves, primitive cell in all atom has no relative displacement. So long wavelength acousticallattice waves cannot lead to macroscopic polarization of ionic crystals.3.5 do you think there is a strong infrared absorption of the simple lattice?[answer]Experiments have shown that ionic crystals can strongly absorb the far infrared light wave. The root of this phenomenon is in ionic crystals of long optical wave with far infrared electromagnetic field strongly coupled. Simple lattice does not exist in the optical wave, so simple lattice does not absorb far infrared light wave.3.6 what is the root cause of the deviation between the Einstein model and the experiment at low temperature?[answer]According to the definition of the Einstein temperature, Einstein model of lattice wave with a frequency of about, belonging to the optical frequency. But the optical lattice in the low temperature contribution to the heat capacity is very small, low temperature of heat capacity with large is mainly long wavelength acoustical lattice waves. That is to say Einstein did not test on account of its acoustic wave contribution to the heat capacity is Einstein model at low temperature and the deviation of the roots.3.7 in very low temperatures, the Debye model agrees well with the experiment and why?[answer]At very low temperature, not only the optical wave to stimulate and phonon energies are larger for the short wavelength acoustical lattice waves have not been excited, get excited just phonon energy is small long wavelength acoustical lattice waves. Long wavelength acoustical lattice waves elastic wave. Debye model only considering the elastic wave to the heat capacity contribution. Because of this, at very low temperatures, the Debye model and fact consistent, natural and experimental match.4.2 what is the characteristic of the electron in the boundary of the Brillouin zone?[answer]Electronic energy band depends on the direction of the wave vector, in either direction, on the boundary of the Brillouin zone, nearly free electron band usually appear on the band gap. If the electronic boundary and reciprocal lattice vector orthogonal, the width of the band gap is periodic potential field of pay in the Fourier series coefficients.On the boundary of the Brillouin zone, the slope is zero in the direction perpendicular to theboundary of the Brillouin zone, that is, the energy of the electron is orthogonal to the boundary of the Brillouin zone.4.3 when the wave vector of the electron falls on the boundary of the Brillouin zone, how can the effective mass of the electron differ from the real quality?[answer]In addition to the external force of the electron in the crystal, and the lattice interaction, an external force is F, the force of the lattice on the electron is Fl, and the acceleration of the electron is.But the specific form of Fl is difficult to learn. To make the formula does not contain Fl, but also to maintain the identity of the left and right, then only.Group M and m and obviously, the lattice of electronic effect is weak, the effective mass m * real quality difference is smaller and smaller. On the contrary, the lattice of electronic effect is strong, effective mass m * real quality difference is bigger and bigger. When the electron wave vector falls in the Brillouin zone boundary, and the Brillouin zone boundary parallel to the crystal surface for electron scattering effect of the strongest. The crystal surface reflection direction, the lattice scattering wave phase same superposition formed a strong reflection wave. Because in the Brillouin zone boundary of the electronic and lattice effect is very strong, so the effective mass and the real quality have significant difference4.4 electronicWhat is the physical meaning of the effective mass?[answer]Still from the point of view of energy. The change of electron energy.It can be seen from the above formula, the effective mass of the electron can be changed to when the energy of the electron is obtained from the external field and the energy is transferred to the crystal lattice.,The average velocity of electrons is a constant, or the external force is equal to the force of the lattice, and the direction is opposite.4.5 tight binding model, the inner layer of the band and the outer band can be compared, which one is wide? Why?[answer]Taking the s state electron as an example, it is shown that the width of the electronic energy band of the tight binding model depends on the size of the integral, and the integration of the 5.9.Lies in and adjacent grid points of the overlapping degree. The tight binding model, of the inner electrons and small stack extent, of the outer electrons and the overlapping degree high. Therefore, under the tight binding model, the inner electrons of the band and the outer electrons of the band compared, outer layer of the electronic band.4.6, what is the physical meaning of the energy surface in the boundary of the Brillouin zone and the interface between the interface and the interface?[answer]The electron wave vector k into parallel to the boundary of the Brillouin zone of component and vertical to the Brillouin zone boundary K component stilbene. The average velocity of electronsobtain,.Can surface in the Brillouin zone boundary and interface vertical intersection, in the Brillouin zone boundary constant = vertical to interface component of the velocity is zero. Vertical interface component of the velocity is zero, lattice of electrons to produce a Bragg reflection results. In the perpendicular to the interface to, the incident electron sub wave and the lattice of reflection wave interference into a standing wave.5.1 a simple lattice of a simple energy level contains a few electrons?[answer]Design lattice is composed of n Lattice composition, a can with n different wave vector state, hold 2n electronics. Due to electronic energy band is the even function of the wave vector, so the energy (2n). Visible on a level contains four electrons.5.2 the energy band of the intrinsic semiconductor and the difference between the energy bandand the insulator?[answer]At low temperatures, an intrinsic semiconductor can and insulator band structure is the same. But the intrinsic band gap semiconductor with narrow, band gap width usually in 2 EV below. Due to the narrow band gap, the band gap semiconductor sign full of top electronic can, with the aid of thermal excitation, transitions to the forbidden band above with the bottom, make full of dissatisfaction with, empty belt is not empty, two are of conductive contributions.6.1 how do you understand the absolute zero degree and the average kinetic energy of the electrons in the room temperature is very close to this point?[answer]Not change is only get far away from the free electron theory considering the electron kinetic energy. In the absolute zero, metal free (price) electronics, distributed in the Fermi level and below level, that is distributed in a Fermi sphere. At room temperature, the Fermi sphere Fermi surface is occupied by electrons. These electrons from the lattice wave energy is not enough to make the transition to the Fermi surface near or outside the state to state transition of the Fermi surface in the vicinity of a few electrons, and the vast majority of electron energy state. That is to say, room temperature electron average kinetic energy and absolute zero degrees when the average kinetic energy must be very similar.6.2 why temperature, Fermi energy decreases?[answer]When, half quantum state is occupied by electrons of energy is the Fermi level. Elevated temperature, energy of electrons near the Fermi surface obtained from the lattice is bigger, more outside the transition to the Fermi surface of the electronic, the original half quantum state is occupied by electrons energy level electrons less than half, half quantum state is occupied by electrons of energy must be reduced. That is to say, elevated temperature, Fermi energy decreases.6.5 why the concentration of valence electron is higher, the electric conductivity is higher?[answer]Conductance is measure of the metal through flow capacity. Through flow capacity is determined in unit time through the cross-sectional area of the electron number (see question 18). But not all of the valence electrons of conductive contribute, conductive contribution is of electrons near the Fermi surface. The more the greater the Fermi sphere, the conductive contribute to the number of electrons. A Fermi sphere depends on Fermi radius.The electron concentration of n is higher, the greater the number of electron Fermi sphere, contribute to conducting more of the conductivity of the metal is higher.6.6 magnetic field and electric field, which field to the electron distribution function influence big? Why?[answer]Magnetic field and electric field, electric field on the electron distribution function. Because of the effect of magnetic field on the electron is the Lorentz force, Lorentz force only change direction of electron flow, and no electronic acting. That is to say, when the only magnetic field, the valence electrons in nonmagnetic metal distribution function does not change. But in electric and magnetic fields exist at the same time, due to the formation of additional Hall electric field, magnetic field of non magnetic metal electron distribution function emerged. But compared with the electric field, magnetic field on electron distribution function is much weaker.1 covalent binding, two atom electron clouds overlap to produce attractive, while the atoms are close to the electron cloud overlap will produce tremendous repulsive force, how to explain?Covalent binding, the formation of covalent bond pairing of electrons, they spin in the opposite direction, the two electron electron cloud over stack which leads to the reduction of the energy of the system, stable structure, but when atoms near, overlapping atoms within the full shell electron cloud of electrons, quantum states of the same electronic produced enormous repulsion, making the energy of the system increases rapidly.2 explain the phenomenon that a neutral atom absorbs an electron.When a neutral atom absorption an electron into the negative ion, the electronic stability into the atomic shells, the electrons and nuclei of the Coulomb attract to absolute value must be greater than it can with the exclusion of other electronic. But the Coulomb attraction between the electron and the nucleus can be a negative value. That is, when the neutral atom absorbs an electron into the negative ion, the energy of the ion is less than the energy of the neutral atom. Therefore, a neutral atom absorbs an electron.3 why many metals are dense structures?Metal collection by principle of minimum energy constraints and atoms and a total of electron cloud of the Coulomb energy should as far as possible low (absolute value as much as possible). The more compact the atom is, the more compact the atom is and the electronic cloud of electrons, and the lower the Coulomb energy, so it has a dense structure.4 do you think that the elastic strength of the solid is mainly determined by the exclusion effect or the attraction?As shown in the figure, less than R0 in the vicinity of the force curve is steeper, when applying a certain force, solid deformation is small, the slope of the curve near the force determines the elastic properties of solids, and near the force curve slope depends in the repulsive force. Therefore, the elastic strength of the solid is mainly determined by the rejection.5 Einstein model: it is assumed that all atoms vibrate at the same frequencySuccess: by selecting the appropriate Einstein temperature, in the larger temperature range, the results of theoretical calculation and the experimental results are quite good. And the heat capacity tends to zero as the temperature decreases.Deficiency: the temperature is very low, the heat capacity is reduced by the temperature of the index, and the experimental results show that: the heat capacity by the three party to reduce the temperature.The reason: Einstein ignored the difference of the wave frequency.In Debye model the elastic continuum wave wave represents, Bravais lattice is treated as a continuous isotropic medium.Success: the Debye model approximate calculation results of temperature is lower than.Reason: This is because the temperature is very low, the main only long acoustic wave lattice wave excitation, the lattice as continuum elastic wave is appropriate.6 how to explain the conductivity and non conductivity of the material?The material contains a large number of electrons, some of which are conductive, some not. The full band contains a large number of electrons, and the distribution of the electrons in the Brillouin zone is symmetrical, because the contribution of the electrons in the K state to the current is mutually offset. In the non full band, the probability that the K state and the -K state are occupied by the electrons is the same in the absence of the external field. The distribution of the electrons in the Brillouin zone is symmetrical, and does not show theThe symmetry of the distribution of the current, when there is an external field, are destroyed, and some K states have no -K states. On the conductor, there is a part of the tape, in the role of the external field that produces the macroscopic current, to the non conductor, either full of the belt, or is completely empty, so will not produce the current.7 the energy band of the intrinsic semiconductor and the difference between the energy band and the insulator?At low temperature, the band structure of the energy band of the intrinsic semiconductor is the same as that of the insulator. But the sign of the semiconductor band gap narrower, the band width is usually in two electron volts, due to the narrow band gap, the band gap semiconductor sign full of top electronic can, with the aid of thermal excitation, above the band gap transition to empty the bottom of the band, making full of dissatisfaction with empty, both of the conductive contributions.1 ion crystal characteristics: an ion of the nearest neighbor ions for the opposite sex ion; ion crystal, the coordination number of up to 8.The stability of the combination of 2 ionic crystals: poor conductivity, high melting point, high hardness and low coefficient of expansion.Two the 3 basic characteristics of the covalent bond: saturation and orientation; the strength of the covalent bond depends on the degree of the formation of the two electron orbitals of the covalent bond.4 near free electron approximation models: electrons in metals are subject to (the action of the periodic potential field) and the assumption (the fluctuation of the potential field is smaller).Two energy is close to and interacts with each other, and the result is that the energy level is higher than that of the original one (energy increase), and the lower energy state (energy decrease) of the 5 states.6 band gap and (band number) as well as (periodic potential field fluctuations).6 a simple lattice of a simple energy level contains a few electrons?The lattice is composed of N lattice points, then a can with N different wave vector state, can accommodate 2N electronics. Because the energy band of the electron is even function of the wave vector, the energy level is N/2, so the energy level is 4 electrons.7. The tight binding approximation method of thought: electronic in an atom near the (lattice), mainly by the atomic potential field effect, and other atomic potential role as a perturbation, the crystal electron wave function approximation as atomic orbital wave function of a linear combination of, to the relationship between the atoms and the crystal of the electronic band. In the tight binding approximation, the interaction between different atoms is considered.8 what is the characteristic of the electron in the boundary of the Brillouin zone?The energy band of the electron depends on the direction of Yu Bo vector. In either direction, the band gap of the energy band of the near free electrons can be generally appeared on the boundary of the Brillouin zone. If the boundary of the electron is perpendicular to the inverse lattice vector Kn, the width of the forbidden band is E=2|V (Kn), and the V (Kn) is the coefficientof the Fourier series of the periodic potential field. On the boundary of the Brillouin zone, the slope of the equal energy surface in the direction perpendicular to the boundary of the Brillouin zone is zero, that is, the equal energy surface of the electron and the boundary of the Brillouin zone are orthogonal.9 when the wave vector of the electron falls on the boundary of the Brillouin zone, why is the effective mass of the electron with the true quality?In addition to the effect of the external force, the electron in the crystal is also interacting with the lattice. The force of the lattice is F, the electron acceleration is a= (+Fl F) /m, but the specific form of Fl is hard to know. To make the formula does not contain Fl, but also to maintain the identity of the left and right, then only a=F/m*, obviously, the role of the lattice of electrons is weaker, the difference between the effective quality of m* and the real quality of M is smaller. In contrast, the stronger the effect of the lattice on the electron, the greater the difference between the effective mass m* and the real quality m. When the wave vector of the electron falls on the boundary of the Brillouin zone, the scattering of the crystal plane parallel to the boundary of the Brillouin zone is stronger than that of the electron. In the reflection direction of the crystal plane, the scattered wave phase of each lattice point is the same, and the strong reflection wave is formed. Because of the strong interaction between the electron and the lattice on the boundary of the Brillouin zone, there is a significant difference between the effective mass and the real quality.1. The thermal expansion of the reasons: if the vibration is strictly harmonic, there is no thermal expansion and the actual thermal expansion between atoms of non harmonic caused by the action of.Reasons for heat conduction: the contribution of electrons to the conduction of heat is not considered, and the heat conduction in the crystal is mainly depended on phonon. Solid in the presence of temperature gradient, the phonon gas density distribution is not uniform, relationship between mean number of phonon Sui temperature, Bose distribution. Simple harmonic approximation is the result of different lattice is completely independent of, there is no interaction between the different phonon, similar to that of an ideal gas. Actually harmonic function make different lattice wave exists between certain coupling, thereby ensuring the different lattice can exchange energy between, achieve statistical equilibrium.2 what is the normal vibration mode? Whether the normal vibration wave number, wave number or vibration mode number is the same thing?In order to make the problem both simplified and seize the main contradiction, in the analysis discussed the lattice vibration, interatomic mutual force of Taylor series in the non linear term ignored approximation known as harmonic approximation. In the harmonic approximation, the lattice vibration is composed of N atoms in the crystal, can be equivalent to the vibration of 3N independent harmonic oscillators. The vibrational mode of each harmonic oscillator is called a normal mode, which corresponds to all the atoms in the mode of vibration, which is the simplestand most basic vibration mode of the lattice vibration mode. Atomic vibration, vibration or vibration is usually linear superposition of the 3N normal vibration mode. The three is one thing, the number is equal to the sum of the degrees of freedom of all atoms in the crystal, that is equal to 3N.3 long wavelength optical acoustic wave and long wave branch Berger essentially what is the difference?The characteristics of long wavelength optical lattice is within each cell in different atoms relative vibration, vibration frequency is high, it contains all of the lattice vibrations of the highest frequency of vibration mode. Long acoustic branches of lattice is characterized in that the original cells of different atomic no relative displacement, the original cells do movement as a whole, vibration frequency is low, it contains the lattice vibration frequency of the lowest mode of vibration, wave velocity is a constant. Are there any crystal lattice wave acoustic branch, but there is no simple crystal lattice wave optical branch.4 long acoustical waves can lead to macroscopic polarization of ionic crystals?Long wavelength optical lattice so can lead to macroscopic polarization of ionic crystals, the root is long optical lattice wave makes the original cell in different atoms (positive and negative ions) produced a relative displacement. The characteristics of acoustic wave is long, in the cells of all atoms have no relative displacement. Therefore, long acoustical waves can not lead to macroscopic polarization of ionic crystals.5 do you think there is a strong infrared absorption of the simple lattice?Experiments have confirmed that the ion crystal can strongly absorb far infrared light. The root of this phenomenon is that the long optical transverse wave energy in the ion crystal is strongly coupled with the far infrared electromagnetic field. There is no optical wave in the simple lattice, so the simple lattice will not absorb the far infrared light wave.6 what is the root cause of the deviation between the Einstein model and the experiment at low temperature?According to the definition of the Einstein temperature, Einstein model of lattice wave frequency is approximately 10 13 times square Hz, which belongs to the optical branch frequency, but the optical lattice in the low temperature contribution to the heat capacity is very small, low temperature contribution to the heat capacity of is mainly long wavelength acoustical lattice waves. It is said that Einstein did not consider the contribution of acoustic wave to the heat capacity is the root of it in low temperature and experimental errors.7 Debye in very cold model experiments. Why?At very low temperature, not only the optical wave to stimulate and phonon energies are larger。
Nov.2020Vol.37No.S Transactions of Nanjing University of Aeronautics and AstronauticsFBS Effect and Temperature Dependence in Trench⁃AssistedMultimode FiberZHANG Zelin1,2,LU Yuangang1,2*,XIE Youwen1,2,HUANG Jian1,2,ZHOU Lang1,2 1.Key Laboratory of Space Photoelectric Detection and Perception of Ministry of Industry and Information Technology,College of Astronautics,Nanjing University of Aeronautics and Astronautics,Nanjing211106,P.R.China;2.College of Science,Nanjing University of Aeronautics and Astronautics,Nanjing211106,P.R.China(Received13July2020;revised10September2020;accepted12September2020)Abstract:We propose the trench-assisted multimode fiber(TA-OM4)as a novel sensing fiber in forward Brillouin scattering(FBS)-based temperature sensor,due to its higher temperature sensitivity,better bending resistance and lower propagation loss,compared with the single mode fiber(SMF)and other sensing fibers.The FBS effect and acousto-optic interaction in TA-OM4are the first time to be demonstrated and characterized at1550nm theoretically and experimentally.A2.0km long TA-OM4is put into an oven to measure its temperature sensitivity,which can reach up to80.3kHz/℃,exceeding53%of SMF(52.4kHz/℃).The simulated and experimental results verify that the TA-OM4may be a good candidate as the sensing fiber for the FBS-based temperature sensor.Key words:forward Brillouin scattering;acousto-optic interaction;optic-fiber sensor;temperature sensitivity;multimode fiberCLC number:TN29Document code:A Article ID:1005‐1120(2020)S‐0095‐070IntroductionStimulated Brillouin scattering(SBS)in opti‐cal fiber is a phenomenon caused by the interaction between a light wave and an acoustic wave,which is widely studied and employed in the field of distrib‐uted sensing[1-2].Backward Brillouin scattering in‐duces high frequency shifts around10GHz which can be utilized in Brillouin optical time-domain sen‐sors and Brillouin laser.However,the forward Brill‐ouin scattering(FBS)have much lower frequency shift of several hundreds of mega Hertz,which can be used in several applications,such as temperature sensing,opto-mechanical chemical sensors,optical frequency comb and opto-mechanical laser[3-6].Recently,the temperature sensors based on FBS have been proposed using the silica single mode fiber(SMF),high nonlinear fiber(HNLF)and photonics crystal fiber(PCF)[7-9].However,the lower temperature sensitivity of SMF may limit its measurement pared with SMF,al‐though the HNLF and PCF have slightly lager tem‐perature sensitivities,their disadvantages of bad bending resistance,high cost and large propagation loss which are5.4dB/km of PCF and0.76dB/km of HNLF,respectively,can compromise their sens‐ing performance for future FBS-based temperature sensors in complex engineering application[8-9].For‐tunately,the trench-assisted multimode fiber(TA-OM4),due to its low propagation loss(0.24dB/ km)which is similar to that of SMF(0.20dB/ km),excellent bending resistance and high back‐ward stimulated Brillouin scattering(BSBS)and modulation instability(MI)threshold,has been a good candidate as the sensing fiber in BSBS-based temperature sensors[10].However,the characteristic of FBS process in TA-OM4at1550nm and its ap‐plications in FBS-based temperature sensors have*Corresponding author,E-mail address:*************.cn.How to cite this article:ZHANG Zelin,LU Yuangang,XIE Youwen,et al.FBS effect and temperature dependence in trench‐assisted multimode fiber[J].Transactions of Nanjing University of Aeronautics and Astronautics,2020,37(S):95‐101. http:///10.16356/j.1005‐1120.2020.S.012Vol.37 Transactions of Nanjing University of Aeronautics and Astronauticsnot been reported.In this paper,we theoretically and experimen‐tally investigate the acousto-optic interaction causedby FBS and FBS spectrum in TA-OM4.Further‐more,we have found that the largest strain coeffi‐cient in TA-OM4is about4.0kHz/με,which is sosmall that the frequency shift of FBS is not sensitiveto make acceptable strain measurement.Therefore,we only focus on its temperature dependence ofFBS in this pared with the temperatureresponse of FBS in SMF,we experimentally mea‐sure the FBS temperature response of TA-OM4.The highest temperature dependence of TA-OM4islinear with a coefficient of80.3kHz/℃,which is53%larger than that of SMF(52.4kHz/℃).Thesimulated and experimental results show that theTA-OM4may be a good candidate as the sensing fi‐ber in FBS-based temperature sensors.1FBS Resonances in TA⁃OM41.1Theoretical description of FBS in optical fi⁃berThe acoustic modes responsible for FBS are ra‐dial dilatational modes(R0,m)and mixed torsional-radial modes(TR2,m).The FBS is a typical opto-acoustic interaction,which can be described as thecoupling amplitude equations between optical fieldE(r,z,t)and acoustic wave for the displacementvector U(r,z,t)[11]∂2E ∂z2-n2effc2∂2E∂t2=1ε0c2∂2P NL∂t2(1)∂2U∂z2+Γ∂U∂t+V s2∇×(∇×U)-V l2∇(∇∙U)=Fρ(2) where P NL is the total nonlinear polarization,c the light velocity in vacuum,n eff the effective refractive index,ε0the vacuum permittivity,V l the longitudi‐nal acoustic velocity of the fiber,ρ0the density of fused silica,V s shear sound velocity of the fiber,andΓthe acoustic damping parameter.F=ε0[12γ12∇()E∙E+γ44(E∙∇)E]is the elec‐trostrictive driving term,andγ12andγ44are both the elements of the electrostrictive tensor for fused sili‐ca.By employing the finite element analysis(FEA)method and solving Eq.(1),we obtain the optical field E(r).Moreover,by solving Eq.(2)with the appropriate boundary conditions,we difine the nor‐malized displacement distribution U m(r)in terms of Bessel functions J n(z),where n is the order of Bes‐sel functions.By usingρm(r)=-ρ0∇U m(r),we obtain the density vibration caused by FBS.For the radial dilatational R0,m modes,the boundary condition corresponding to the free fiber surface can be written as(1-α2)J0(y)-α2J2(y)=0(3) whereαis the ratio between shear sound velocity and longitudinal acoustic velocity,and y m the m th zero of Eq.(3).Furthermore,the central frequency of the m th acoustic mode can be expressed asf m=y m V lπd(4) where d is the cladding diameter of optical fiber.Similar to the Kerr effect in fiber,the opto-me‐chanical coefficient can be used to quantify the opto-acoustic interaction caused by FBS,which can be expressed as[6,12-13]γ(m)OM=k02πn2neff cρ0Q(m)E Q(m)pΓm f m(5) whereΓm is the linewidth of the m th resonant peak induced by FBS.The Q(m)E and Q(m)p are the elec‐trostrictive overlap and photo-elastic overlap,which determines the efficiency of stimulation of acoustic modes and describes the modification of the effec‐tive index by acoustic modes[13-14],respectively.By solving Eqs.(1)—(5),the acoustic field distribu‐tion and FBS resonances can be obtained next.1.2Simulation and FBS spectrum in TA⁃OM4For TA-OM4,the diameters of the fiber core and cladding are50and125μm,respectively.The refractive index profile is given in Fig.1.The refrac‐tive index profile shows a quasi-quadratic distribu‐tion in the central region and has a trench-index pro‐file around the fiber core[10].The three highest linear polarization(LP)modes are respectively LP01,96No.S ZHANG Zelin,et al.FBS Effect and Temperature Dependence in Trench-Assisted Multimode FiberLP11and LP21,and the corresponding intensity ratio of these three LP modes I01∶I11∶I21,is1∶0.14∶0.006. Considering the highest intensity ratio of LP01,the tiny coupling efficiency between LP01and other high-order modes and the single mode condition of most optical components[15],it is enough to investigate the FBS process of TA-OM4corresponding to the fundamental mode LP01.By solving Eqs.(1)and(2),three excited acoustic modes are found and displayed in Fig.2. As it shown in Fig.2(a),taking R0,4mode as an example,the R0,m modes are the radial dilatational modes,which have the most efficient scattering ef‐ficiency and are independent of angular coordinate φ.Especially,the R0,m modes can induce refractive index changes so that the pure phase modulation will be also induced.Other acoustic modes are TR2,m acoustic modes,which are the mixed tor‐sional-radial modes.As it shown in Figs.2(b)and (c),different from R0,m modes,the TR2,m modes are doubly degenerated,which vary sinusoidally with angular coordinate2φ.Furthermore,the scat‐tering efficiency of TR2,m modes is much lower than that of R0,m modes.For the TR2,m(90°/0°)mode,its induced birefringent axes are parallel to the birefringent axes of TA-OM4,which does not induce the depolarized scattering but the polarized scattering and also cause pure phase modulation. For the TR2,m(45°/-45°)mode,the mode pat‐tern is rotated by45°.In this case pure phase modu‐lation will not occur,and the depolarized scattering is induced[16].Fig.1Refractive index profile of TA-OM4and calculated three LP optical modes with the highestintensityFig.2Normalized transverse profile of acoustic modes excited by LP01optical mode in TA-OM497Vol.37Transactions of Nanjing University of Aeronautics and Astronautics Generally ,the overlap between optical modes and acoustic modes determines the shape of FBS resonances.Taking four acoustic modes (R 0,1to R 0,4)as examples ,the 2D mode profiles of longitu‐dinal optical fundamental mode LP 01and four acous‐tic modes are displayed in Fig.3.In order to experimentally investigate the FBS process in TA -OM4,we also measure the FBS spectrum by using a coherent detection ,which isshown in Fig.4.The light source (NKT Photonics )is a 1550nm single -wavelength semiconductor la‐ser with linewidth 5kHz.The pump light propagat‐ing through the isolator (ISO )is split into two branches by a 50/50coupler.The upper branch used as the pump light is amplified by an erbium -doped fiber amplifier (EDFA ,Amonics ).A narrow bandpass filter (BPF ,AOS Photonics )with 3.5GHz bandwidth is used to eliminate the amplified spontaneous emission (ASE )noise induced by ED‐FA.A variable attenuator (VA )is utilized to adjust the input power level to protect fiber components.The pump light is launched into 2.0km long TA -OM4(YOFC )to obtain the FBS signal which beats with the reference light.Finally ,a 1.6GHz bandwidth photodetector (PD ,Thorlabs PDB480)is utilized to detect the beat signal ,which is ana‐lyzed by an electrical spectrum analyzer (ESA ,Tektronix RSA5126B )and used to obtain the FBS spectrum.In our experiment ,the incident light power is 11.2mW.The measured FBS spectrum is shown in Fig.5.The measured FBS spectrum includes two parts.One part is from the R 0,m modes and the other is from the TR 2,m modes.However ,due to the ran‐dom change of polarization states along the TA -OM4,the FBS intensities induced by TR 2,m modes are much lower than those of R 0,m modes.As it shown in Fig.5,we can find that the fourth resonant peak with the highest intensity locates at 173.1MHz.By solving Eq.(5),we obtain the calculated opto -mechanical coefficient of R 0,4mode as 5.25(W∙km )-1,which is slightly higher than that of SMF 5(W ∙km )-1[6].In Fig.6,two adjacent resonant peaksgenerated by R 0,m modes have equivalent frequency interval of 47.5MHz ,which can be verified by solv‐ing Eq.(4).It is obvious that ,whatever resonant peaks intensity and frequency shift ,the calculated and experimental results are in good agreement.The largest difference of normalized intensity be‐tween calculated and experimental results are less than 5%,which are from the error of the estimated fiberparameters.Fig.32-D profiles of optical mode LP 01and acoustic modes R 0,1to R0,4Fig.4Experimental setup of measuring the FBS spectrum of TA -OM4Fig.5The measured FBS spectrum of TA -OM498No.S ZHANG Zelin,et al.FBS Effect and Temperature Dependence in Trench -Assisted Multimode Fiber 2TemperatureResponse inTA⁃OM4In order to evaluate whether the TA -OM4can be used as the novel sensing fiber in FBS -based tem ‐perature sensors ,we put both TA -OM4and SMF into an oven to measure their temperature sensitivi‐ties of R 0,m modes ,and results are shown in Fig.7.Seven different temperatures between -10℃to 50℃are measured with a temperatures step of 10℃.It is obvious that the temperature sensitivities increase linearly with an increase in m value of R 0,m modes ,whose trends are in accordance with that in Ref.[17].The observed temperature coefficient of R 0,12in TA -OM4can reach 80.3kHz/℃,which is 53%larger than that of SMF (52.4kHz/℃).Furthermore ,we also obtain the temperature sensitivities of spectral peaks corresponding to R 0,4(f 4=173.1MHz )mode in TA -OM4and R 0,5(f 5=222.9MHz )mode in SMF ,which exhibit the high‐est resonance intensity of all peaks.In Fig.8,the calibration temperature coefficient of TA -OM4(αTA‐OM4)can reach 31.9kHz/℃,which is much 41%larger than that of SMF (αSMF =22.6kHz/℃).3ConclusionsFBS processes in TA -OM4are theoreticallyand experimentally investigated and the acousto -op‐tic interaction of TA -OM4at 1550nm are charac‐terized and demonstrated.We experimentally mea‐sure the FBS spectrum ,which is in good agreement with simulated results.The temperature sensitivities of R 0,m modes in TA -OM4are also measured ,which exceed 40%of SMF.The calculated and ex‐perimental results demonstrate that the TA -OM4could be a good sensing fiber in FBS -based tempera‐ture sensors ,with advantages of high temperature sensitivity ,good bending resistance and low propa‐gation loss.References[1]MATSUI T ,NAKAJIMA K ,YAMAMOTO F.Guided acoustic -wave brillouin scatteringcharacteris‐Fig.6Measured (green)and calculated (red)normal‐ized FBS resonant intensity in TA -OM4in‐duced by R 0,mmodesFig.7Measured temperature sensitivities of TA -OM4and SMF versus different R 0,m modes ,re‐spectivelyFig.8Temperature sensitivities of R 0,4mode in TA -OM4and R 0,5mode in SMF99Vol.37 Transactions of Nanjing University of Aeronautics and Astronauticstics of few-mode fiber[J].Applied Optics,2015,54(19):6093-6097.[2]BAO X,CHEN L.Recent progress in Brillouin scat‐tering based fiber sensors[J].Sensors,2011,11(4):4152-4187.[3]FU Y,FAN X,WANG B,et al.Discriminative mea‐surement of temperature and strain using stimulatedBrillouin scattering and guided acoustic-wave brillouinscattering[C]//2018Asia Communications and Photo‐nics Conference(ACPC).Hangzhou:IEEE,2018:1-3.[4]CHOW D M,THEVENAZ L.Opto-acoustic chemi‐cal sensor based on forward stimulated Brillouin scat‐tering in optical fiber(Invited)[C]//Proceedings ofthe7th International Conference on Photonics(ICP).[S.l.]:IEEE,2018:1-3.[5]BUTSCH A,KOEHLER J R,NOSKOV R E,et al.CW-pumped single-pass frequency comb genera‐tion by resonant optomechanical nonlinearity in dual-nanoweb fiber[J].Optica,2014,1(3):158-164.[6]LONDON Y,DIAMANDI H H,ZADOK A.Elec‐tro-opto-mechanical radio-frequency oscillator drivenby guided acoustic waves in standard single-mode fi‐ber[J].APL Photonics,2017,2(4):041303.[7]YAIR A,LONDON Y,ZADOK A.Scanning-free characterization of temperature dependence of forwardstimulated Brillouin scattering resonances[C]//Pro‐ceedings of the24th International Conference on Opti‐cal Fiber Sensors(ICOFS).Curitlba:SPIE,2015:96345C.1-96345C.4.[8]HAYASHI N,SUZUJI K,SET S Y,et al.Temper‐ature coefficient of sideband frequency produced by po‐larized guided acoustic-wave Brillouin scattering inhighly nonlinear fibers[J].Applied Physics Express,2017,10(9):092501.1-092501.3.[9]CARRY E,BEUGNOT J C,STILLER B,et al.Temperature coefficient of the high-frequency guidedacoustic mode in a photonic crystal fiber[J].AppliedOptics,2011,50(35):6543-6547.[10]ZHANG Z L,LU Y G.Trench-assisted multimode fi‐ber used in Brillouin optical time domain sensors[J].Optics Express,2019,27(8):11396-11405.[11]KANG M S,BRENN R,RUSSELL R S J.All-opti‐cal control of gigahertz acoustic resonances by forwardstimulated inter-polarization scattering in a photoniccrystal fiber[J].Physical Review Letters,2010,105(15):153901.1-153901.4.[12]BUTSCH A,KANG M S,EUSER T G,et al.Op‐tomechanical nonlinearity in dual-nanoweb structuresuspended inside capillary fiber[J].Physical ReviewLetters,2012,109(18):183904.1-183904.5.[13]DIAMANDI H H,LONDON Y,ZADOK A.Opto-mechanical inter-core cross-talk in multi-core fi‐bers[J].Optica,2017,4(3):289.[14]BIRYUKOV A S,SUKHAREV M E,DIANOV E M.Excitation of sound waves upon propagation of la‐ser pulses in optical fibers[J].Quantum Electronics,2002,32(9):765-775.[15]XU Y,REN M,LU Y,et al.Multi-parameter sensor based on stimulated Brillouin scattering in inverse-para‐bolic graded-index fiber[J].Optics Letters,2016,41(6):1138-1141.[16]NISHIZAWA N,KUME S,MORI M,et al.Experi‐mental analysis of guided acoustic wave Brillouin scat‐tering in PANDA fibers[J].Journal of the Optical So‐ciety of America B,1995,12(9):1651-1655.[17]CHUN Y D,SHANG L H,JING L L,et al.Simul‐taneous measurement on strain and temperature viaguided acoustic-wave Brillouin scattering in singlemode fibers[J].Acta Physica Sinica,2016,65(24).240702.1-240702.7.Acknowledgements This work was supported in part by the National Natural Foundation of China(Nos.61875086,61377086),the Aerospace Science Foundation of China (No.2016ZD52042),and Nanjing University of Aeronautics and Astronautics Ph.D.short-term visiting scholar project (No.190901DF08).Authors Mr.ZHANG Zelin is currently a Ph.D.candidate of Optical Engineering at the Department of Applied Phys‐ics,Nanjing University of Aeronantics and Astronautics (NUAA).His research focuses on distributed fiber sensors and nonlinear fiber optics.Prof.LU Yuangang is currently a professor in College of As‐tronautics at NUAA.His research focuses on distributed fi‐ber sensors,image processing and technology of photoelec‐trical detection.Author contributions Mr.ZHANG Zelin contributed to simulation by doing experiment and writing the manuscript. Prof.LU Yuangang designed and guided the study,and gave key opinions on the core issues.Mr.XIE Youwen and Mr.HUANG Jian conducted some related works about the experiments.Ms.ZHOU Lang conducted some related works about the simulation.Competing interests The author declare no competing interests.(Production Editor:XIA Daojia)100No.S ZHANG Zelin,et al.FBS Effect and Temperature Dependence in Trench-Assisted Multimode Fiber101沟道型折射率多模光纤的前向布里渊散射效应及其温度响应张泽霖1,2,路元刚1,2,谢有文1,2,黄剑1,2,周朗1,2(1.空间光电探测与感知工业和信息化部重点实验室,南京航空航天大学航天学院,南京211106,中国;2.南京航空航天大学理学院,南京211106,中国)摘要:提出了沟道型折射率多模光纤(TA‐OM4)可作为一种新型传感光纤应用于基于前向布里渊散射(FBS)的温度传感器中。

Light Field Manipulation: A Revolution inOptics and Its ApplicationsIn the realm of optics, light field manipulation has emerged as a cutting-edge technology, promising unprecedented control over the propagation and interaction of light. This field, often referred to as "light field engineering" or "light field调控," involves the precise manipulation of the amplitude, phase, polarization, and wavelength of light, enabling the creation of novel optical phenomena and devices with unique functionalities.The concept of light field manipulation dates back to the early days of optics, but significant progress has been made in recent years due to advancements in nanotechnology, materials science, and computational methods. This has led to the development of a range of innovative optical devices and systems that have revolutionized various fields, including imaging, communications, and energy conversion. One of the most significant applications of light field manipulation is in the field of computational imaging. By precisely controlling the light field, researchers have been able to create novel imaging systems that offerunprecedented resolution, depth of field, and dynamic range. These systems, known as light field cameras or plenoptic cameras, capture not only the intensity of light but alsoits direction, enabling the reconstruction of the three-dimensional scene with unprecedented fidelity.Another important area where light field manipulation has found widespread application is in optical communications. By manipulating the phase and polarizationof light, researchers have been able to develop high-capacity optical fiber communication systems that can transmit information at unprecedented speeds and distances. These systems are critical for enabling the global internet and high-speed data networks.In addition to its applications in imaging and communications, light field manipulation is also finding uses in areas such as energy conversion and quantum information processing. By controlling the light field at the nanoscale, researchers have been able to developefficient solar cells and photodetectors that convert sunlight into electricity with unprecedented efficiency. Similarly, the precise control of light-matter interactionsusing light field manipulation offers the potential for novel quantum devices and algorithms that could revolutionize computing and information processing.The future of light field manipulation looks even more promising. With the continued development of advanced materials and nanotechnologies, as well as the increasing availability of powerful computational resources, we can expect to see even more innovative applications of light field manipulation in areas such as biomedicine, security, and defense.Overall, light field manipulation represents a significant leap forward in our ability to control and manipulate light. Its impact on optics and its applications is likely to be profound, enabling the creation of novel devices and systems with unprecedented capabilities and functionalities. As we continue to explore the frontiers of light field manipulation, we stand on the cusp of a new era in optics that will transform our world in ways we can only imagine.**光场调控:光学领域的革命及其应用**在光学领域,光场调控已经成为一项尖端技术,它承诺对光的传播和相互作用进行前所未有的控制。
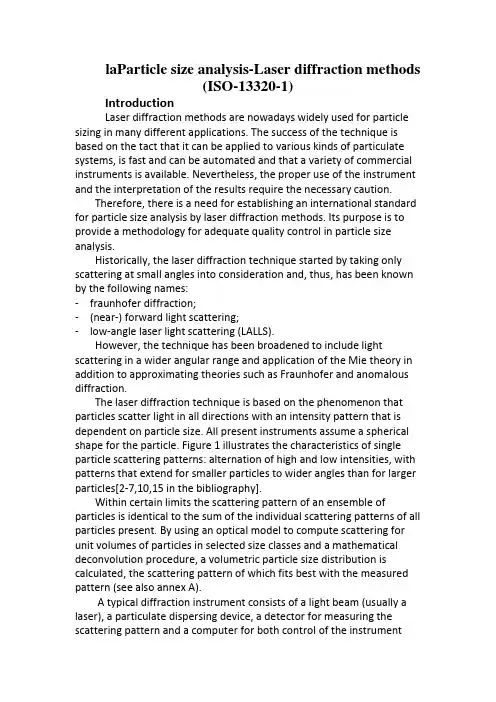
laParticle size analysis-Laser diffraction methods(ISO-13320-1)IntroductionLaser diffraction methods are nowadays widely used for particle sizing in many different applications. The success of the technique is based on the tact that it can be applied to various kinds of particulate systems, is fast and can be automated and that a variety of commercial instruments is available. Nevertheless, the proper use of the instrument and the interpretation of the results require the necessary caution.Therefore, there is a need for establishing an international standard for particle size analysis by laser diffraction methods. Its purpose is to provide a methodology for adequate quality control in particle size analysis.Historically, the laser diffraction technique started by taking only scattering at small angles into consideration and, thus, has been known by the following names:-fraunhofer diffraction;-(near-) forward light scattering;-low-angle laser light scattering (LALLS).However, the technique has been broadened to include light scattering in a wider angular range and application of the Mie theory in addition to approximating theories such as Fraunhofer and anomalous diffraction.The laser diffraction technique is based on the phenomenon that particles scatter light in all directions with an intensity pattern that is dependent on particle size. All present instruments assume a spherical shape for the particle. Figure 1 illustrates the characteristics of single particle scattering patterns: alternation of high and low intensities, with patterns that extend for smaller particles to wider angles than for larger particles[2-7,10,15 in the bibliography].Within certain limits the scattering pattern of an ensemble of particles is identical to the sum of the individual scattering patterns of all particles present. By using an optical model to compute scattering for unit volumes of particles in selected size classes and a mathematical deconvolution procedure, a volumetric particle size distribution is calculated, the scattering pattern of which fits best with the measured pattern (see also annex A).A typical diffraction instrument consists of a light beam (usually a laser), a particulate dispersing device, a detector for measuring the scattering pattern and a computer for both control of the instrumentand calculation of the particle size distribution. Note that the laser diffraction technique cannot distinguish between scattering by single particles and scattering by clusters of primary particles forming an agglomerate or an aggregate. Usually, the resulting particle size for agglomerates is related to the cluster size, but sometimes the size of the primary particles is reflected in the particle size distribution as well. As most particulate samples contain agglomerates or aggregates and one is generally interested in the size distribution of the primary particles, the clusters are usually dispersed into primary particles before measurement.Historically, instruments only used scattering angles smaller than 14°,which limited the application to a lower size of about 1μm. The reason for this limitation is that smaller particles show most of their distinctive scattering at larger angles (see also annex Z).Many recent instruments allow measurement at larger scattering angles, some up to about 150°,for example through application of a converging beam, more or larger lenses, a second laser beam or more detectors. Thus smaller particles down to about μm can be sized. Some instruments incorporate additional information from scattering intensities and intensity differences at various wavelengths and polarization planes in order to improve the characterization of particle sizes in the submicrometre range.Particle size analysis – Laser diffraction methods-Part 1:General principles1 scopeThis part of ISO 13320 provides guidance on the measurement of size distributions of particles in any two-phase system, for example powders, sprays, aerosols, suspensions, emulsions and gas bubbles in liquids, through analysis of their angular light scattering patterns. It does not address the specific requirements of particle size measurement of specific products. This part of ISO13320 is applicable to particle sizes ranging from approximately μm to 3μm.For non-spherical particles, an equivalent-sphere size distribution is obtained because the technique uses the assumption of spherical particles in its optical model. The resulting particle size distribution may be different from those obtained by methods based on other physical principles . Sedimentation, sieving).3,terms, definitions and symbolsFor the purposes of this part of ISO 13320, the following terms, definitions and symbols apply.terms, definitionsabsorptionintroduction of intensity of a light beam traversing a medium through energy conversion in the mediumcoefficient of variation (变异系数)Noative measure(%) for precision: standard deviation divided by mean value of population and multiplied by 100 or normal distributions of data the median is equal to the meanrefractive index(Np)Refractive index of a particle, consisting of a real and an imaginary (absorption) part.Np=n p-ik prelative refractive index (m)complex refractive index of a particle, relative to that the medium。
WaveplatesPrinciple of WaveplateWaveplates (retardation plates or phase shifters) are made from materials which exhibit birefringence. The velocities of the extraordinary and ordinary rays through the birefringent materials vary inversely with their refractive indices. The difference in velocities gives rise to a phase difference when the two beams recombine. In the case of an incident linearlypolarized beam this is given by α=2πd(n e-n o)/l(α-phase difference;d-thickness of waveplate; n e,n o-refractive indices of extraordinary andordinary rays respectively; λ-wavelength). At any specific wavelength the phase difference is governed by the thickness of the retarder.Half WaveplateThe thickness of a half waveplate is such that the phase differenceis 1/2-wavelength (ture-zero order) or some multiple of 1/2-wavelength (multiple order).A linearly polarized beam incident on ahalf waveplate emerges as a linearlypolarized beam but rotated such that itsangle to the optical axis is twice thatof the incident beam. Therefore,half-waveplates can be used ascontinuously adjustable polarizationrotators. Half-waveplates are used inrotating the plane of polarization, electro-optic modulation and as a variable ratio beamsplitter when used in conjunction with a polarization cube.Quarter WaveplateThe thickness of the quarter waveplate is such that the phase difference is 1/4 wavelength (ture-zero order) or some multiple of 1/4 wavelength (multiple order).If the angle θ (between the electricfield vector of the incident linearlypolarized beam and the retarderprincipal plane) of thequarter-waveplate is 45, the emergentbeam is circularly polarized. When aquarter waveplate is double passed, i.e.by mirror reflection, it acts as a half waveplate and rotates the plane of polarization to a certain angle. Quarter waveplates are used in creating circular polarization from linear or linear polarization from circular, ellipsometry, optical pumping, suppressing unwanted reflection and optical isolation.Dual-wavelength WaveplateThe THG-PR polarization rotator is an example of dual-wavelength waveplates and used to manage the polarizations of laser beams to obtain maximum conversion efficiency of third harmonic generations (THG), i.e., 1064 nm + 532 nm -> 355 nm.Generally, type I frequency-doubler(oo-> e) + type IIfrequency-tripler( oe-> e) will be the best design for THG which needs no polarization rotator. However, when a type II KTP crystal is used as frequency-doubler and type II LBO as frequency-tripler (see the Figure), the laser polarizations coming out from KTP are not optimized for THG. How to change it into its optimum? CASIX's THG-PR polarization rotator can do it!Commoν 1/2 ωαϖε πηασε ρεταρδατιον πλατε χουλδ ονλψ ροτατε τηε πολαριζατιον οφ 532 νµ το α σπεχιφιχ ανγλε. Ηοωεϖερ, τηε λινεαρ πολαριζατιον οφ 1064 νµ ωιλλ βε διστορτεδ το βε ελλιπτιχαλ. Τηε ΤΗΓ−ΠΡ ροτατορ ισ σπεχιαλλψ δεσιγνεδ το µαινταιν τηε λινεαρ πολαριζατιον οφ 1064 νµ (λ plate) and change simultaneously 532 nm (λ/2 plate) to the angle you need. The THG-PR can beapplied to:1. Type II (SHG) + Type II(THG)2. Type I (SHG) + Type I(THG)3. Type II (SHG) + Type I (THG)Waveplate DesignerIn order to assist customers ineffectively selecting waveplatesfor their application, CASIX'sengineers have complied WaveplateDesigner software to calculate themain properties of waveplate, suchas thickness, orders, spectralbandwidth, temperature bandwidthand angular bandwidth. Theinterface of the Waveplate Designeris enclosed for your reference.Dual-wavelength waveplate and archomatic waveplate can be also calculated. Ask us for more information about Waveplate Designer if needed.You can download it from here.Ture-Zero, Low, Multi, Zero order waveplatesIn practice, the thickness required to produce true-zero order waveplate is about tens of micron according to the wavelength, which is too thin to manufacture. For this reason, multiple order waveplate often provides a convenient means of producing the required retardation. CASIX provides two kinds of multiple orders waveplates- low order and multi order which are classified by the thickness. The retardation value of a multiple order waveplate is strongly dependent on temperature, wavelength, angle of incidence and degree of collimation. Zero order waveplates do not have this dependency. A zero order waveplate is constructed of two multiple order waveplates (optically contacted, cemented or airspaced) with their axes crossed. Thus, the effect of the first plate is canceled by the second, except for the residual difference between them. The following Table based on 532 nm, λ/4 waveplates with retardation tolerance <λ/100 gives you a rough idea of the comparison among all the orders waveplates.Zero Order of Waveplate Multi Low Ture-ZeroCemented Air-spaced Thickness(mm)=10.3<0.1 Spectral bandwidth(nm)0.5 1.530Temperature 1038735bandwidth(c)Angular bandwidth 2.5 4.52033 Damage>500>500>10>10>500 threshold(MW/cm2)CASIX's Waveplates, including octadic-wave (λ/8), quarter-wave (λ/4), half-wave (λ/2) and full-wave (λ) plates, are widely used in synthesis and analysis of light in various states of polarization. The standard specification of CASIX's waveplates are listed following for your reference.The standard waveplate wavelengths (nm) of CASIX's waveplates248266308325331337347251354363413441457476488510514530532543557573589594612682.86476947527808008308508709051050106411521300131015502020Other wavelengths within the ranger of 200-2300nm are also available upon requirment.The standard specification of CASIX's waveplatesMaterial Crystal QuartzDimension+0.0, -0.2mmWavefront distortion<λ/8@632.8Retardation tolerance<λ/500Parallelism<1 arc secondSurface quality20/10 scratch and digClear aperture>80%AR coating R<0.2% at central wavelengthCASIX's Waveplate series:Low-OrderMulti-OrderCemented Zero-OrderAirspaced Zero-OrderTrue Zreo-OrderDual WavelengthPolarization RotatorsFresnel RhombMounts and Holders for WaveplatesLow-Order Waveplate•Thickness: 0.2-0.4 mm•High Damage Threshold•Better TemperatureBandwidth•Low CostUncoated AR/AR coated φ(mm)Part No.Part No.10.0WPL1110WPL121012.7WPL1112WPL121215.0WPL1115WPL121520.0WPL1120WPL122025.4WPL1125WPL1225Multi-Order Waveplate•Thickness:1 mm•Single plates•High Damage Threshold•Low Costφ(mm)Uncoated AR/AR coatedPart No.Part No.10.0 WPM1110 WPM1210 12.7 WPM1112 WPM1212 15.0 WPM1115 WPM1215 20.0 WPM1120 WPM1220 25.4WPM1125WPM1225Cemented Zero-Order Waveplate•Double Retardation Plates • Broad Spectral Bandwidth • Wide Temperature Bandwidth • AR coatedφ(mm) 10.012.715.020.025.4Part No.WPZ1210 WPZ1212 WPZ1215 WPZ1220 WPZ1225Airspaced Zero-Order Waveplate• Double Retardation Plates • Broad Spectral Bandwidth • Wide Temperature bandwidth • High Damage Threshold •AR coated and MountedOutside DiameterApertureThicknessPart No.D(mm)φ (mm)t(mm)25.410.08.0WPZ131025.412.78.0WPZ131225.415.08.0WPZ131530.020.08.0WPZ132030.025.48.0WPZ1325Cemented Ture Zero-order Waveplate•Broad Spectral Bandwidth•Wide TemperatureBandwidth•Wide Angle BandwidthUncoated AR/AR coated φ(mm)Part No.Price Part No.Price10.0WPF1110$178WPF1210$19812.7WPF1112$182WPF1212$20215.0WPF1115$190WPF1215$21020.0WPF1120$225WPF1220$25525.4WPF1125$268WPF1225$308Single Plate Ture Zero-order Waveplate•Broad Spectral Bandwidth•Wide Temperature Bandwidth•Wide Angle Bandwidth•High Damage ThresholdUncoated AR/AR coated φ(mm)Part No.Price Part No.Price10.0WPS1110$178WPS1210$19812.7WPS1112$182WPS1212$20215.0WPS1115$190WPS1215$21020.0WPS1120$225WPS1220$25525.4WPS1125$268WPS1225$308Dual-wavelength Waveplate•Single retardation plate•Dual-wavelength AR coated, R<0.2% @ foundational wavelength & R<0.5% @ SHG wavelength•UnmountedAperature φ(mm)10.012.715.020.0 Wavelength & Retardation Part No.Part No.Part No.Part No.1064nm:λ & 532nm:λ/2WPT1110WPT1112WPT1115WPT1120 532nm:λ & 1064nm:λ/2WPT1210WPT1212WPT1215WPT1220 355nm:λ & 532nm:λ/2WPT1310WPT1312WPT1315WPT1320 532nm:λ & 1064nm:λ/4WPT1410WPT1412WPT1415WPT1420 Other dura-wavelength waveplates are available upone requirement.Polarization Rotators•Material: Crystal Quartz•Optical Activity of Crystals Rotates thePlane of Polarization of LinearlyPolarized Light•Rotation Angle Are Proportional toOptical Paths Through Crystals•Rotation Direction Is Counter-colckwise(Left Hand, Standard)•UncoatedAngle of rotation45°90°φ(mm)Part No.Part No.10.0PPR1410PPR191012.7PPR1412PPR191215.0PPR1415PPR191520.0PPR1420PPR1920Fresnal Rhomb Retarder•Provide 90 Phase Shifts, Due to Total Internal Reflections at Two Interfaces •Transmit over the range of 200-2000 nm for Fused Silica•Transmit over the range of 400-2000 nm for BK7•MountedPart No.A(mm)B(mm)H(mm)Retardation Material FRP010*******λ/4BK7 FRP010*******λ/2BK7 FRP1104354037λ/4 F.S. FRP1102644037λ/2 F.S.Achromatic Waveplate•Crystal Quartz Plate + MgF2 Plate•Airspaced•Spectral Bandwith > 300 nm•Wide Temperature Bandwidth•High Damage Threshold•AR Coated•Available SoonMounts and Holders for WaveplatesIn order to protect waveplates from damaging during transportation or handling, CASIX provides a special design ring mount for waveplates, which are very easy and convenient to be installed into customers's systems. In addition to ring mount, rotating holder which is special designed to modulate waveplate to specified angle is also available.Ring Mount:•Material and Finish: Black AnodizedAluminum•D:+/-0.1mm•t: +/-0.1mm• f : +0.15, -0.0mm•Easy to Be InstalledPart No.WaveplateDiameterφ(mm)WaveplateEdgethickness(mm)OutsideDiameterD(mm)ClearApertureφ0(mm)ThicknessT(mm)RMW011010.00.4-1.025.49.0 6.0 RMW021010.00.9-1.625.49.0 6.0 RMW011212.70.4-1.025.411.5 6.0 RMW021212.70.9-1.625.411.5 6.0 RMW011515.00.4-1.025.413.5 6.0RMW0215 15.00.9-1.6 25.4 13.5 6.0 RMW0120 20.0 0.4-1.0 30.0 18.0 6.0 RMW0220 20.0 0.9-1.6 30.0 18.0 6.0 RMW0125 25.0 0.4-1.0 30.0 22.8 6.0 RMW022525.00.9-1.630.022.86.0Rotating Holder•Material and Finished: Black Anodized Aluminum• Easy Operation• Rotation Accuracy: < 5°• Dimension Tolerance: +/- 0.1 mmOutside Dimension(mm) Installation Dimension(mm) Part No. Width Height Length Diameter(f) Thickness(A) Matched ScrewM(mm) RHW0125 40 60 10 25.4 6 6.35 RHW01304563103066.35Fabrication and InspectionWith the experience on orientating and fabricating high quality nonlinearoptical crystals, CASIX assures to control the orientation of the crystal optical axis precisely maintained from first cut through final assembly.X-ray diffractionmeasurement instruments are used in each process to ensure crystalline axis alignment to within 10 arc minutes for waveplates. Each waveplate deliveredZygo Interferometer from CASIX is under strictinspection by ZygoInerferometer (wavefrontdirstoration andparallelism) and specialprecision computerizedinspection equipment(retardation inspector).Retardation InspectorCapabilities & Technical SupportCASIX has set up a computerized system to producemore than 20,000 pieces of multiple order and zeroorder wavplates per month. As many as 100,000 piecesstandard waveplates are in stock for immediatedelivery. CASIX has organized a strong R&D team onthe waveplate project that it is possible to provideany technical supports as needed.Coating Workshop。
Switchable dual-wavelength Erbium-dopedfiber ring laser with cascadedfiber Bragg gratingsJae-Ho HanÃDepartment of Electrical and Computer Engineering,Johns Hopkins University,105Barton Hall,3400N.Charles St.,Baltimore,MD21218,USAa r t i c l e i n f oArticle history:Received13May2009Accepted20September2009Keywords:Fiber laserPolarizationSwitchingErbium-dopedfibera b s t r a c tWe have experimentally shown wavelength mode switching in a dual-wavelength Erbium-doped singlecavityfiber laser where the initial two wavelengths of1nm spacing are determined by the cascadedreflection type short-periodfiber Bragg gratings having two different centre wavelengths of1550.5and1551.5nm.The lasing mode depends on the polarization in the ring cavity to migrate from onewavelength to another or operates in both modes in a polarization beam splitter output.To effectivelycontrol the polarization in the ring cavity,the polarization controllers were positioned before and afterthe polarization beam splitter.This method of wavelength switching provides a simple way of modetuning in dual-wavelengthfiber lasers.&2010Elsevier GmbH.All rights reserved.1.IntroductionSwitchable multi-wavelength Erbium-dopedfiber lasers are ofinterest for various applications such as WDMfiber communi9ca-tion systems,fiber sensor systems,optical instrument testing,andoptical signal processing.Fiber lasers have earned much interestdue to inherent advantage over their capacity for deliveringhigher powers and less sensitivity of temperature than those ofsemiconductor diode lasers(LD).Furthermore,in view of thewavelength selection,fiber lasers have much more freedom thansemiconductor lasers in thatfiber lasers can externally control oradd the wavelength selecting block by fabricating an intra-cavityconfiguration in addition to the original singlefiber ring cavity[1–5].Typically,wavelength selectors are in the forms of opticalfilters(thinfilmfilters orfiber Fabry–Perotfilters)orfiber Bragggratings(FBG).However,conventional opticalfilters should beplaced in the ring cavity so that they have limited freedom ofchange of lasing wavelength even though they could be externallytuned by mechanical and/or electrical ways.Forfiber Bragggratings,due to the reflection properties at determined centerwavelength,they could be externally inserted to the laser ringcavity without any change to the initialfiber laser using an opticalcirculator[6–11].Moreover,there have been tremendous reportsto achieve wavelength tuning using FBGs as well as operating in adual-wavelength mode where dual-mode lasers have greatimportance in the sensor and various LIDAR applications[12–14].Recent results dealing with polarization effect in opticalfibersmostly deal with improving the inhomogeneity and polarizationhole-burning in the laser cavity,for example Feng et al.[15]reported wavelength switching using the polarization maintain-ing PANDAfiber with overlapping cavities;Yan et al.[16]suggested using long-periodfiber gratings(transmission typefilter)in a anisotropic transmission spectrum under polarizationstates;Zhao et al.[17]enhanced the polarization hole-burningeffect with a high birefringencefiber;Xia et al.[18]proposedswitchablefiber laser using a polarization maintainingfiber Bragggrating;Sheu et al.[19]demonstrated wavelength tuning in aSagnac interferometer loop incorporating thefiber polarizationset;and Xu et al.[20]showed a switchable multi-wavelengthfiber laser formed by dual-section Lyot–Sagnacfilter and threefiber Bragg gratings.In this article,the authors have experimentally demonstratedthe wavelength switching in a dual-wavelength Erbium-dopedfiber ring laser incorporating two short periods or reflective typefilters of cascadedfiber Bragg gratings having different centerwavelengths of1nm spacing.The wavelength selection is basedon the polarization in the single ring cavity so that lasing mode isdetermined by the mode competition between different polariza-tions in the dual mode operation in which the Erbium-dopedfiberamplifier(EDFA)is the main homogeneous gain broadeningmedium in the cavity,which functions as the source for strongmode competition.2.Experiment and resultsThe schematic of the experimental setup is shown in Fig.1.TheEr-dopedfiber amplifier(EDFA)provides the amplification inthefiber ring where980nm pump laser diode is used to turn onContents lists available at ScienceDirectjournal homepage:www.elsevier.de/ijleoOptik0030-4026/$-see front matter&2010Elsevier GmbH.All rights reserved.doi:10.1016/j.ijleo.2009.09.010ÃTel.:+14105164068;fax:+14105165566.E-mail address:jhan16@Optik](]]]])]]]–]]]the Er-fiber as a gain medium;the length of Erbium-doped fiber was approximately 2m due to the high doping level so that enough power is generated with less absorption in 1550nm range.The two FBGs are cascade connected to the ring by using an optical circulator where port 1is the input and port 3is the output to the fiber cavity and FBGs are attached to port 2–only the wavelengths that match the center wavelengths (FBG1:1550.5nm;FBG2:1551.5nm)of the two gratings will reflect back to the fiber cavity so that only those wavelengths will be lasing whereas other bands are suppressed (the end of the FBG was terminated by an FC/APC connector to remove the back reflection at the end of the fiber grating);to make an output (FC/PC connector is used),polarization beam splitter (PBS)is used.Two set of fiber type polarization controllers are inserted between the output splitter to make an effective round trip in the fiber cavity depending on the polarization states.Each polarization controller is composed of a combination of half-wave plate,quarter-wave plate,and half-wave plate [21].If linear polarized light after the half-wave plate is matched to the fast or slow axis of the quarter-wave plate,the light maintains the polarization unchanged whereas for other orientations the quarter-wave plate modifies the linear input light to the elliptical state (if the transmitted light is polarized in the exact middle of slow and fast axes of the quarter-wave plate,the equally decomposed two modes have 901phase difference resulting in a circularly polarized light output).The retardations of phases from the quarter and the half-wave plates are given as [19],G quater ¼14þm 12p l 0p l;G half¼12þm 2 2pl 0p lwhere l 0p is the nominal wavelength of the polarization controller,and m 1and m 2are integers.The output of the half-wave plate provides additional polarization control.All of the optical components and devices were fusion spliced to form an optical fiber ring cavity.By finely coordinating the rotations of the half-and quarter-wave plates for providing continuous adjustment of the birefringence within the fiber ring cavity,the transitions of wavelengths could be observed in Fig.2for the desired output polarization state.Here,the intrinsic stress-induced birefringence from the half-and quarter-wave plates splits the two different polarizations of the fundamental mode in the fiber cavity resulting in different effective indices so that Bragg wavelength of the FBG can also be modified for different polarizations.Thus,the resultant lasing modes are switched between the initial center wavelengths of FBGs (1550.5and 1551.5nm)depending on the polarization changes so that the laser can be operated either in a dual mode or a single mode where side mode suppression ratio (SMSR)is approximately 35dBwith the peak power around -10dBm and the background noise level around -45dBm.This mode change at a constant output power or constant pump injection current of 100mA is due to the polarization dependent mode competing in the fiber cavity so that a polarization state supports one or both the modes for lasing at a certain condition.In other words,polarization controllers introduce wavelength dependent cavity loss.This effect of lasing depending on the polarization is also easily observed by simply modifying the fiber turns or changing the fiber positions when no polarization controller is used in the fiber ring laser operating for dual wavelength or more.The lasing wavelength could also be affected by the orthogonal polarization between the two cascaded fiber Bragg gratings so that the initial operating mode could be single wavelength depending on the relationship between the remaining fiber cavity polarization.Thus,to reduce the effect of different polarizations between two fusion spliced fiber gratings is to keep the distance between the Bragg corrugated regions as close as possible,which characterizes the birefringence in the ring cavity.3.ConclusionsIn summary,experimental demonstration of the wavelengthswitching in the dual-mode fiber ring laser of 1nm spacing was demonstrated relying on the polarization in the single fiber cavity to select the operating lasing mode.The initial two wavelengths of FBGs in 1550.5and 1551.5nm compete with each other in the fiber ring cavity depending on their polarization states.This effect is maximized by the two polarization controllers,which were employed before and after the polarization beam splitter output to make effective round trips in the fiber cavity for lasing.References[1]J.J.Pan,Y.Shi,Tunable Er 3+-doped fiber ring laser using fiber gratingincorporated by optical circulator or fiber coupler,Electron.Lett.31(1995)1164–1165.[2]H.Kumazaki,K.Nakashima,S.Inaba,K.Hane,Tunable wavelength filterthrough bending control of asymmetric single-mode grating fiber,Opt.Express 10(2002)469–474.[3]G.Das,J.W.Lit,Wavelength switching of a fiber laser with a Sagnac loopreflector,IEEE Photon.Technol.Lett.16(2004)60–62.Fig.1.Schematic view of dual-wavelength switching Er-doped fiber ring laser:PBS,polarization beam splitter;Pol.Cont.,polarization controller;EDFA,erbium-doped fiber amplifier;and FBG,fiber Bragg grating (FBG1:1550.5nm;FBG2:1551.5nm).Fig. 2.Results of wavelength switching in dual-wavelength fiber ring laser:(a)1551.5nm;(b)increasing 1550.5nm;(c)dual-mode;and (d)1550.5nm.J.-H.Han,J.U.Kang /Optik ](]]]])]]]–]]]2[4]F.Liegeois,Y.Hernandez, D.Kinet,G.Peigne´, D.Giannone,Wavelength-switchable single-frequency erbium-dopedfiber ring laser,IEEE Photon.Technol.Lett.17(2005)2544–2546.[5]C.-H.Yeh,S.Chi,A broadbandfiber ring laser technique with stable andtunable signal-frequency operation,Opt.Express13(2005)5240–5244. [6]H.L.Liu,H.Y.Tam,W.H.Chung,P.K.A.Wai,N.Sugimoto,Low beat-noisepolarized tunablefiber ring laser,IEEE Photon.Technol.Lett.18(2006) 706–708.[7]C.-H.Yeh,M.-C.Lin,S.Chi,Stabilized and wavelength-tunable S-banderbium-dopedfiber ring laser with single-longitudinal-mode operation, Opt.Express13(2005)6828–6832.[8]M.Delgado-Pinar,J.Mora, A.Die´z,J.L.Cruz,M.V.Andre´s,Wavelength-switchablefiber laser using acoustic waves,IEEE Photon.Technol.Lett.17 (2005)552–554.[9]Y.J.Kim, D.Y.Kim,Electrically tunable dual-wavelength switching in amutually injection-locked erbium-dopedfiber ring laser and distributed-feedback laser diode,IEEE Photon.Technol.Lett.17(2005)762–764.[10]D.Chen,S.Qin,Z.Yu,S.He,Tunable and injection-switchable erbium-dopedfiber laser of line structure,Microwave Opt.Technol.Lett.49(2007)765–768.[11]Z.Medendorp,J.Valiunas,G.Das,Wavelength-switchablefiber laser,Microwave Opt.Technol.Lett.49(2007)1231–1233.[12]G.Me´jean,J.Kasparian1,J.Yu,S.Frey,E.Salmon,J.-P.Wolf,Remote detectionand identification of biological aerosols using a femtosecond terawatt lidar system,Appl.Phys.B78(2004)535–537.[13]T.Fujii,N.Goto,M.Miki,T.Nayuki,K.Nemoto,Lidar measurementof constituents of microparticles in air by laser-induced breakdownspectroscopy using femtosecond terawatt laser pulses,Opt.Lett.31(2006) 3456–3458.[14]G.G.Parker,D.J.Harding,M.L.Berger,A portable LIDAR system for rapiddetermination of forest canopy structure,J.Appl.Ecol.41(2004)755–767.[15]X.-H.Feng,Y.-G.Liu,L.Sun,S.-Z.Shu,G.-Y.Kai,X.-Y.Dong,A polarizationcontrolled switchable multiwavelength erbium-dopedfiber laser,Chin.Phys.Lett.21(2004)659–661.[16]M.Yan,S.Luo,L.Zhan,Z.Zhang,Y.Xia,Triple-wavelength switchableerbium-dopedfiber laser with cascaded asymmetric exposure long-period fiber gratings,Opt.Lett.15(2007)3685–3687.[17]C.-L.Zhao,X.Yang,C.Lu,J.H.Ng,X.Guo,P.R.Chaudhuri,X.Dong,Switchablemulti-wavelength erbium-dopedfiber lasers by using cascadedfiber Bragg gratings written in high birefringencefiber,mun.230(2004) 313–317.[18]L.Xia,P.Shum,J.Zhou,T.H.Cheng,Eight-wavelength switchablefiber ringlaser with ultranarrow wavelength spacing using a quadruple-transmission-band polarization maintainingfiber Bragg grating,Appl.Phys.B88(2007) 185–188.[19]F.-W.Sheu,C.-Y.Chiou,S.-C.Yang,Performance of a wavelength-tunableerbium-dopedfiber laser using a Sagnac interferometer,mun.281 (2008)4719–4722.[20]H.F.Xu,L.Zhan,M.H.Sang,Z.C.Gu,Y.X.Xia,Switchable multiwavelengtherbium-dopedfiber laser with cascadedfiber Bragg gratings and dual-section Lyot–Sagnacfilter,J.Mod.Opt.56(2009)127–130.[21]D.Derickson,Fiber Optic Test and Measurement,Prentice Hall,Upper SaddleRiver,NJ,1998.J.-H.Han,J.U.Kang/Optik](]]]])]]]–]]]3。
High-end Optical Spectrum AnalyzerQ8384In DWDM optical communications, exacting wavelength measurements are required of the optical source. Evaluating these specifications requires an optical spectrum analyzer with enhanced resolution bandwidth and wave-length accuracy. To meet these stringent requirements, the Q8384 achieves 10 pm wavelength resolution, the best in the world* and attains 20 pm wavelength accuracy in the 1550 nm band. This high performance makes it possible for the Q8384 to measure the oscil-lation wavelength characteristics of laser diodes accurately.DWDM optical communication systems also contain wavelength division multiplexed channels spaced at intervals as close as 50 GHz (0.4 nm). In this environment an optical spec-trum analyzer with superior dynamic range is required to separate the optical signals and measure the noise figure (NF) of the optical amplifier. The Q8384 has a dynamic range as wide as 50 dB at 0.1 nm and 60 dB at 0.2 nm and therefore fulfills these requirements ade-quately. Equipped with automatic optical amplifier NF measurement and arithmetic facilities, the instrument allows the user to make measurements in a simple fashion. The Q8384 optionally has a built-in reference wavelength light source and an EE-LED (edge emitting LED). If calibrated with this refer-ence light source, the instrument is assured to provide wavelength accuracy of 20 pm in the 1550 nm band. Using the EE-LED's broad-band light source, the Q8384 allows the user to con-veniently measure and evaluate the transmis-sion and loss characteristics of narrow-band optical filters.*: at the time of printing (June, 2001)2Q8384-8E June '01FIG. 1 Resolution band width of 10 pm FIG. 2 Sample waveform modulated at 10 Gbps FIG. 3 A measurement example of a Fabry-Perot filter Wavelength spacing can be measured with satisfactory linearity.50dB60dB67dB0.1nm0.2nm0.4nmFIG. 4 Dynamic rangeFIG. 6 Diagram of NF measurement using the interpolation methodFIG. 7 Measurement Example, DWDM (50 GHz) Noise FigureThe measured waveform and a list of the obtained measurements are dis-FIG. 5 Optical Fiber Amplifier Measurement using Frequency Sweep FunctionFIG. 8 SNR displayWavelength-specific S/N ratio measurements are displayed.FIG. 9 Relative displayDifferences from channel spacing and a reference signal are displayed.FIG. 11 WDM alternate sweeping Upper: 5 nm SPAN, Lower: 50 nm SPANFIG. 10 ITU-T grid displayThe nearest ITU-T channel and its difference are displayed FIG. 12 Sample loop test measurement with the externally synchro-nized sweep function (5000 km transmission line)FIG. 13 Upper: measuring signal, 2 nm SPAN. Lower: reference signal, 30 nm SPAN Although prior measurement systems required that reference and measuring signals be put FIG. 14 Notch filter: wavelength width at 3 dB lossFIG. 15 Notch filter: loss measurement with a wavelength width of 0.5 nm FIG. 16 Multi-trace displayMeasurement example of AWG (100 GHz, 32 Ch) provided by NTT Electronics FIG. 17 Limit line functionQ8384-8E June '017WDM monitor function The Q8384 allows monitoring of DWDM systems. It is possi-ble to continuously monitor whether the peak wavelength, the level of each channel and the SNR fluctuation are within their respective tolerances. It is also possible to simultaneously dis-play the current values relative to the initial value, 1st channel value, and reference value as well as displaying the absolutevalue.FIG. 18 WDM monitor (wavelength mode)FIG. 19 WDM monitor (level mode)Display example of level variations in each channelFIG. 20 WDM monitor (SNR mode)SNR display with channel No. on the horizontal axis (with limit line)Data storage capabilitiesThe Q8384 can store data in two formats with the built-in standard floppy disk drive.TEXT format (numeric format)Measurement conditions and data are in ASCII format. The stored data may be restored by the Q8384 or read directly with a personal computer.BITMAP formatThe BITMAP format is used to store a bitmap image of the screen display on a floppy disk with no data manipulation.Built-in printerAdditionally, the built-in high-speed thermal printer allows the user to make hardcopy images of measured data.Calibration light source with EE-LED Output (OPTION 25)Built-in wavelength calibration light source with acetylene cell to guarantee high-precision wavelength accuracy, and the 1550nm C-band EE-LED (Edge Emitting LED) light source. This LED source can also be used as a low level broadband light source for device measurement.MAX/MIN/CURRENT simultaneous display functionThe Q8384 can simultaneously display the waveforms of the maximum value, minimum value, and current value of each measurement in repeated sweep. Display of the fluctuation range enables the user to understand at a glance the changes of the device characteristics against temperature and polarizationchange.FIG. 21 MAX/MIN/CURRENT simultaneous displayDisplay example of the characteristics when the temperature of the Band Pass Filter changes.Option 25Performance ParametersWavelengthMeasurement range:600 to 1700 nmAccuracy:≤±500 pmAccuracy*1:≤±20 pm(after calibration with built-in light source,option 25, 1530 to 1570 nm)≤±40 pm(after calibration with built-in light source,option 25, 1570 to 1610 nm)≤±200 pm(using built-in or ext. single pointcalibration light source, 600 to 1700nm) Linearity*: ≤±10 pm (1530 to 1570 nm)≤±20 pm (1570 to 1610 nm)Repeatability**: ≤±3 pm (1530 to 1610 nm)Wavelength resolutionSettings: 10 pm, 20 pm, 50 pm,100 pm, 200 pm,500 pmAccuracy**:≤±3% (Res. 50 pm, 1530 to 1610 nm)≤±2%(Res. 100 pm or more, 1530 to 1610 nm)LevelMeasurement range**:-87 to +23 dBm (1250 to 1610 nm)-77 to +23 dBm(950 to 1250, 1610 to 1700 nm)-55 to +23 dBm (600 to 1000 nm)Accuracy**:≤±0.4 dB (1550 nm)Linearity*:≤±0.05 dB (-50 to -10 dBm, 1550 nm) Scale:Logarithmic 0.1, 0.2, 0.5, 1, 2, 5, 10 dB/DIVplus others user selectable, and Linear Repeatability***:≤±0.02 dB (1530 to 1610 nm)Flatness*:≤±0.2 dB (1530 to 1610 nm)Polarizationdependency**:≤±0.05 dB (1250 to 1610 nm)Dynamic range**: ≥50 dB (±0.1 nm from peak wavelength)≥60 dB (±0.2 nm from peak wavelength)≥67 dB (±0.4 nm from peak wavelength,High Dynamic Range Mode)SweepSpan:0.2 nm from full span or zero spanNumber of samples:101, 201, 501, 1001, 2001, 5001, 10001 Measurement time:≤500 ms (Span 10 nm, Normal Mode,1550 nm, average 1 time, 501 samples)Pulse Light MeasurementPeak holding mode:Waiting time is set every one measurementpoint (Gate Time 1 ms to 1 S) and the peaklevel during this waiting time is displayedMinimum optical pulse width 10 nSec(30 µSec or longer recommended)Optical pulse frequency; 1 Hz or more External synchronization:The timing can be controlled by a SYNCsignal at the external input.SYNC signal input level;TTL (High; 3.5 V, Low; 1.5 V)Pulse width; 10 ns or moreSyncLo Mode:Minimum light pulse width measurementduring SYNC high level is 10 ns(30 µs or longer recommended)SyncHi Mode:Sample timing from the rising or fallingedge of the SYNC signal is set (0 to 1000 µs) *1) At 23°C ±5°C*4) At 1 min. repetition rate*2) At 10 to 30°C *5) At 1523 nm wavelength, resolution 10 pm*3) At least 100 pm resolution*6) Correction by effective bandwidth FeaturesMemory featureInternal RAM:Measurement data;at least 15 screens(501 samples) (battery backup)Internal floppy DISK:3.5 inch 2 HD 1.44 M, MS-DOS format Display:Wavelength/Frequency display on thehorizontal axis, dual upper/lower display,superimpose display, cursor measurements,multi-trace display (up to 32 traces) Operations/Analysis:Auto peak search, Auto peak center,Auto reference level,Spectrum width analysis (Threshold,Envelope, RMS, Peak RMS, X nm level),Notch width analysis(X dB width, X nm level),Optical amplifier Noise Figure analysis function(up to 256 wavelengths),WDM signal analysis function(up to 256 wavelengths, level, SNR, ITU-T grid),Normalize with zoom function (LOSS/TRANS),WDM monitor function, limit line function,Peak power monitor function(with trend chart)Others:Wave length correction(built-in or external light source),wavelength/level offset correction,Label featureOptical inputInternal adapting fiber:9.5/125 µm SM fiber(master grade-A connector recommended) Reflective attenuation:≥35 dBConnector(user replaceable):FC (Std.), ST, SC (accessories sold separately)Data Input/OutputGPIB:IEEE488-1978Printer:Internal thermal printerPrinter interface:D-SUB 25 pin ESC/P, ESC/P-R, PCLVideo output:VGA (15 pins, female)LabView and LabWindows driver available on requestOptions OPT8384+25Light Source forwavelength calibrationwith EE-LED andacetylene cell output:Output level*;≥-45 dBm/nm (1550 nm)Environmental SpecificationsOperatingtemperature:+10 to +40°C,Relative humidity 85% or less(non-condensing)Storagetemperature:-10to +50°C,Relative humidity 90% or less (non-condensing) Power Supply:AC100-120 V/220-240 V, 50/60 Hz,200 VA or lessDimensions:Approx. 424 (W) x 221 (H) x 500 (D) mm Mass:29kg or lessQ8384-8E June '018AccessoriesFC connector adaptor (standard accessory):A08161SC connector adaptor:A08162ST connector adaptor:A08163 Optical fiber cable (SM 9.5/125 µm 2m,with FC-SPC, master grade-A connectors) :A01291Please be sure to read the product manual thoroughly before using the products. Specifications may change without notification.9 Q8384-8E June '01Bulletin No.Q8384-338E June ’01 S©2001 ADVANTEST CORPORATIONPrinted in JapanADVANTEST CORPORATION Shinjuku-NS building, 4-1Nishi-Shinjuku 2-chomeShinjuku-ku, Tokyo 163-0880,JapanTel:+81-3-3342-7500Fax:+81-3-5322-7270http://www.advantest.co.jpAdvantest (Singapore) Pte. Ltd.438A Alexandra Road,#8-03/06 Alexandra Technopark Singapore 119967Tel:+65-274-3100Fax:+65-274-4055Tektronix Inc. (North America)P. O. Box 500 Howard Vollum Industrial Park Beaverton, Oregon 97077-0001 U. S. A.Tel:+1-800-426-2200Fax:+1-503-627-4090Rohde & SchwarzEngineering and Sales GmbH (Europe)Mühldorfstraße 15D-81671 München, Germany P.O.B. 80 14 29D-81614 München, Germany Tel:+49-89-4129-13711Fax:+49-89-4129-13723。
公式d(δφ)=( + n·αSio2 ) ·dT ·δz·×(6.2)λμmfiber gyro 光纤陀螺萨格纳克(Sagnac)效应backreflection背向反射backscattering 背向散射slant interface 倾斜界面reciprocity theorem [物]互易定理;[电磁]倒易理论reciprocity相互作用transmitted waves 透射波fiber gyro research光纤陀螺的研究Fresnel backreflection 菲涅耳背向反射air-silica interface 空气氧化硅接口fiber coil ends 光纤线圈两端superimpose 添加;重叠;附加;安装parasitic 干扰parasitic Michelson interferometer j寄生迈克耳孙干涉仪path imbalance路径不平衡power-split ratio功率分流比splitting ratio分流比reflection and refraction law 反射与折射定律空间分辨率spatial resolutionsufficient slant angle足够长的倾角align对齐refraction law折射定律hroughput coupling loss 能量耦合损耗Arditty et alA multifunction integrated optic circuit(MIOC)is used, with square wave for biasing modulation and digital phase ramp for feed back.该闭环光纤陀螺采用以多功能集成光学器件为核心的结构,以方波为偏置调制,数字阶梯波为反馈。
interference contrast干涉对比extinction ratio消光比antireflection coating增透膜backreflected light背向反射光all-fiber approach全光纤的方法index mismatch指数不一致silica fiber 石英光纤intergrated optic circuit 集成光学器件optimal ['ɔptiməl] 最佳的LiNbO3铌酸锂集成光学器件backreflection背向反射slant angle倾角coupling 耦合real waveguide真正的波导virtual mirror image虚拟镜像interface plane 平面界面throughput coupling loss 能量耦合损耗angular misalignment 角度偏差pseudo-Gaussian 非高斯分布off-axis reflection离轴反射refraction折射core 核心slant angle倾角input wave输入波suppression 背向反射抑制waveguide波导fiber core 光纤核心slant angle倾角non-guided back-reflection 非制导背向反射intergrated optic waveguide 集成光波导estimation估算interface 接口image 像fiber 光纤image fiber图像光纤full divergence angle 光束发散角index matched medium 色散匹配介质in power of the mode 功率模型divergence 发散vacuum 真空medium index 介质色散numerical aperture 数值孔径backreflection loss 背向反射损耗slant angle倾角intergrated optic circuit 集成光学器件standard slant angle 标准倾角align对齐refraction law折射定律waveguide波导Single Mode Fiber 单模光纤fiber gyro 光纤陀螺numerical aperture 数值孔径Attenuation衰减rad 拉德Fresnel backreflection 菲涅耳背向反射pseudo-Gaussian 非高斯分布validity有效性approximation 近似值mode shape 振型tail 光纤尾纤small angular misalignment 小角度偏差spurious scattering虚散射intergrated optic interface集成光学接口throughput coupling 能量耦合perpendicular interface 垂直接口in pratice 实际上rayleigh backscattering瑞利散射optical frequency 光频source coherence 光源的相干性fiber coil 光纤环ouput ring interferometer 环形干涉仪输出reciprocal couterpropagating wave 反向相对传播波互易相对传播波amplitude 振幅modulus模量phase difference error相位差的误差input 输入coherent 相干的phasor diagram 向量图phrase difference error相位差的误差amplitude ratio 振幅比rad 拉德Attenuation衰减spurious reflection杂散反射optical length 光学长度source 光源superposition 叠加independent interferometer独立的干涉仪interference干扰Sagnac interferometer萨尼亚克干涉仪spurious michelson interferometer 杂散迈克耳孙干涉仪ocdp 光相干域偏振计检测phase error相位误差波分域复用WDMfiber coil 光纤线圈interface 接口primary wave 主波波程差path differencehundreds of meters to kilometers数百米到数公里path matched white-light interferometry路径匹配白光干涉circuit 线圈unbalanced 不平衡fiber coil 光纤线圈parasitic 干扰parasitic Michelson interferometer迈克耳孙干涉仪parallelogram-shaped 平行四边形线圈spurious michelson signals迈克耳孙信号optical intensity 光强sagnac萨格纳克信号amplitude 振幅Attenuation衰减parasitic Michelson interferometer 迈克耳孙干涉仪slant angle倾角杂散波杂散波spurious waveintergrated optic interface集成光学接口parallelogram-substrate-shape平行四边形基底的形状brance-waveguide分支波导Y-junction [电] 星形联接.optical path length光程长度spurious michelson interferometer 杂散迈克耳孙干涉仪length coherence相干长度typical separation 典型分布decoherence length 不相干长度broadband source宽带光源superluminescent diode超辐射发光二极管on the order of近似erbium ASE 宽带光源typical separation 典型分布branch waveguide分支波导slant angle倾角parasitic effect 寄生效应interferometric fiber gyro 光纤陀螺spurious wave杂散波reasonably相当地slant interface 倾斜界面coherent detection相干检测suppress抑制propagation 传播suffer 受到scattering process 散射过程throughput wave 能量波连续波(CW)phrase difference error杂散相位差的误差local oscillator 本机振荡器波程差path differencephrase error相位误差fluctuate 波动frequency modulation 频率调制Noise 等效噪声detection bandwidth 测量带宽pulsed source 脉波源pulsed length 脉波长primary pulse 主脉冲wave train波列spurious signals 杂散信号interference contrast 杂散干涉对比autocorrelation 自相关fourier transform傅里叶变换spectrum 光谱intensity spectrum 强度谱source spectrum 光源光谱amplitude spectrum振幅谱phrase相位frequency component频率分量random phase 无规相位phase information 相位信息spurious interferometer 杂散干涉仪coherence length相干长度pulse duration脉冲持续时间picosecond 皮秒mean power 平均功率peak power 峰值功率nonlinearity 非线性rayleigh backscattering瑞利散射噪声dipolar antenna radiation两极天线幅射material atomic binding 物质原子键联excited by 诱导incoming wave 入射波independence in wavelength 独立波长cumulative effect 累积效应fluid流体amorphous glass非晶玻璃random structure随机结构inverselyinversely相反地ordered crystal matrix 有序的水晶基体interfere destructively相消干涉reciprocal 反向input pulse 输入脉冲spurious effect 杂散效应backscattered power 背向散射功率recapture factor 恢复因素grossly approximated非常接近的acceptance solid angle接受立体角ratio比率full solid angle 完全立体角steradian球面度practical numerical value实际数值amplitude ratio 振幅比couterpropagation 反向传播振幅biasing modulation 偏置调制proper frequency 固有频率correlated with 相关phase modulator 相位调制器half-period delay 半周期延迟cancel out 抵销total modulation 完全调制total modulation 干扰波coherent detection相干检测过程local oscillator 本机振荡器spurious signal 杂散信号demodulation 解调propagation 传播low frequency低频率main primary wave 主要主波given point 给定点phase perturbation相位扰动transfer function 转移函数Coupler 耦合器MID POINT 中点PHASE MODULATOR 相位调制器phase lag 相位滞后spurious wave杂散波moduli 模beamsplitter分束器symmetrical 对称的rayleigh backscatter瑞利散射main primary amplitude主要的振幅phasor diagram相量图preferably used 最适用于interferometric fiber gyro 干涉型光纤陀螺相干长度biasing modulation偏置调制multimode laser diode 多模激光二极管reasonably demanding 合理要求spurious effect 杂散效应polarization nonreciprocity 偏振非互易性polarization maintaining 保偏光纤high-birefringence polarization maintaining 高双折射保偏光纤decoherence脱散depolarization解偏振rms deviation均方根偏差bias error偏移误差birefringence 双折射strong birefringence 强烈的双折射Single Mode Fiber 单模光纤eigen polarization state 本征偏振态principal polarization state 主偏振态input state输入状态spurious defect 杂散缺陷phase mismatch 相位失配linear birefringence 线性双折射orthogonal principal polarization正交主偏振模型random coupling point 随机耦合点independent random variable独立随机变量discrete coupling 离散式藕合mean rate平均速率stationary stochastic process平稳随机过程localized coupling局部耦合power transfer 能量输送parameter参数holding吸持crossed mode 交叉模式elementary length 基本长度polarization extinction ratio 偏阵消光比typical value 平均数polarization conservation 偏阵守恒additional stressing structure 额外的压力结构cladding 覆层linear state polarization 线性偏振态linear birefringence 线性双折射principal axis主轴polarization conservation 偏阵守恒reciprocal 互易primary reciprocal wave主要互易波signal fading 信号衰落crossed nonreciprocal wave 交叉非互易波polarization mode degeneracy 偏振模简并depolarized 消偏振的main mode主模velocity 速率broad-spectrum wave宽带光谱波wave train波列decoherence length 不相干长度bell shaped function 钟形函数coherence function 相干函数strict width boundary严格的边界宽度rms均方根half-maximum半峰source intensity spectrum 源强度谱half-width半宽度full-width全宽偏振half-width半宽度interference contrast 干涉对比decoherence length 不相干长度full width全宽crossed-polarization 交叉偏振velocity difference速度差sspropagation length 传播距离birefringence index difference双折射折光率差beat length拍长应力诱导(stress-induceddispersion 色散group index 群折射率phase index 相折射率slow mode慢变模态fast mode快变模态Erbium doped fiber掺铒光纤spectral width 谱宽polarized light polarized light偏振光propagation medium传播介质broad spectrum广谱principal axe 主轴intensity type 强度型Y-星形联接ring interferometer 环形干涉仪polarizer偏振镜cross-coupled 交叉耦合wave vacuum propagation constant of波真空传播常数intensity rejection ratio强度衰减率constantpropagation constant传播常数。
Wavelengthdependenceoflinearpolarizationinthevisibleandnearinfrareddomainforlargelevitatinggrains(PROGRA2instruments)
J.-B.Renarda,n,E.Hadamcikb,B.Coutéa,M.Jeannota,A.C.Levasseur-RegourdcaLPC2E-CNRS/Universitéd'Orléans,3Aavenuedelarecherchescientifique,F-45071Orléanscedex2,France
bUPMCLATMOS/IPSL,11boulevardd'Alembert,GuyancourtF-78280,France
cUPMC(Univ.PierreetMarieCurie),UMR8190,LATMOS,4placeJussieu,75005Paris,France
articleinfoArticlehistory:Received15October2013Receivedinrevisedform13January2014Accepted20February2014Availableonline20March2014Keywords:PolarizationDustWavelengthSolarsystemabstractRemotesensingmeasurementsoflightscatteredbydustinsolarsystemobjectscanprovidecluesontheirphysicalproperties.Databasesobtainedinthelaboratorywithnumeroussamplesarenecessarytointerpretthesemeasurements.Wepresentherefirststudiesofthewavelengthdependenceofthelinearpolarizationbetween545nmand1.5μm,usingtheimagingpolarimetersPROGRA2forlargelevitatingcompactgrains(PROGRA2-VISinthevisibledomain,andthenewinstrumentPROGRA2-IRinthenearinfrared).Themeasurementsareconductedinmicrogravityconditionsduringparabolicflightsforglassbeads,quartz,sands,siliconcarbides,anthracite,andlunarandMartiansimulants.ComparisonbetweenmeasurementsonglassbeadsandMiecalculationswithglassspheresprovidesanassessmentofthequalityoftheinstruments.Thedependenceofthepolarizationonthewavelengthisrelatedtothecomplexrefractiveindexoftheparticles,i.e.totheircompositionandtothesizeofthegrains.Morelaboratorymeasurementswillbenecessary,inparticularwithsmallergrainsinaggregates,tobetterreproducetheremotesensingobservationsofsolarsystembodies.&2014ElsevierLtd.Allrightsreserved.
1.IntroductionRemotesensingobservations(Earth-orspace-based)ofthelinearpolarizationofscatteredlightprovidecluestosomephysicalpropertiesofsolidparticlesindifferentmedia,suchastheiraveragesizeandsizedistribution,theirstruc-tureandporosity,theircomplexrefractiveindex,andtheiralbedo.Inthecaseofirregulargrains,thevariationofthedegree(inpercent)ofthelinearpolarization(hereaftercalledpolarization)withthephaseangleexhibitsabellshapedcurve,whichcanbedescribedbyaseriesofdifferentparameters:theminimuminpolarizationandthe
correspondingphaseangle,the“inversionangle”wherepolarizationchangessignandtheslopeattheinversionangle,andfinallythemaximuminpolarizationandthecorrespondingphaseangle[1].Inthevisibleandnearinfrareddomains(upto$2μm),wherethermalinfraredemissionisstillnegligible,thepolarizationphasecurvesareoftennoticedtobewavelengthdependent.Thisdependencemaybeduetosomeparticlesizeeffectbutalsoduetothevariationoftherealandcomplexpartsoftheparticlesrefractiveindexwiththewavelength.Numerouswavelengthdependencesinpolarizationobservationshavebeenreportedforsolarsystembodies;somegeneraltrendsmaythusbesuggested.Thepolariza-tiongenerallyincreaseswiththewavelengthforcometsandC-typeasteroids[2–7].TheoppositetrendisdetectedforS-typeasteroidsandsometimesforspecificcometary
ContentslistsavailableatScienceDirectjournalhomepage:www.elsevier.com/locate/jqsrtJournalofQuantitativeSpectroscopy&RadiativeTransfer
http://dx.doi.org/10.1016/j.jqsrt.2014.02.0240022-4073/&2014ElsevierLtd.Allrightsreserved.
nCorrespondingauthor.
E-mailaddress:jean-baptiste.renard@cnrs-orleans.fr(J.-B.Renard).
JournalofQuantitativeSpectroscopy&RadiativeTransfer146(2014)424–430observationsof,e.g.,theinnercoma,animpactevent,oradisruption[8–10].Thevariationofpolarizationwithwavelength,uptoapproximately0.85μm,asobservedforasteroidsofdifferenttaxonomicclasses,iswelldescribedbyalineartrend,mainlyattributedtotheregolithcompo-sition[6].Fortheinterplanetarydust,thedependenceofpolarizationwithwavelengthseemstobeneutralinthevisibledomain,butismoredifficulttoassesssinceline-of-sightobservationscorrespondtotheobservationofdustparticlesatdifferentphaseanglesandsolardistances[11,12].InEarthatmospherestudies,thewavelengthdependenceofpolarizationisusedtoconstrainthesizedistributionofliquidaerosols(withtheMietheory)ortodistinguishbetweenliquidandsolidaerosols[13,14].Laboratorymeasurementsoflightscatteringarenecessarytointerpretthesemeasurementsandtobetterunderstandtheoriginofthevariationofpolarizationwithwavelength.Forsuchstudies,theparticlescanbedepositedonsurfacesorbeinlevitation.Wewillconsiderhereonlylevitatingparticles,suchasthosefoundinplanetaryatmospheres,incometarycomaandtails,intheinterpla-netarydustcloud,andonverylow-massasteroids.Data-basespresentingalargenumberofsamplesareavailableinthespectraldomainsbelow1μm,typicallyinthegreen,redandfar-redspectralranges[15–18].Ontheotherhand,thenearinfrareddomain,between$1and$2μm,ispoorlydocumented.Thus,wepresentherethefirstlaboratorymeasurementsat1.5μmofthelightscatteredbydifferentsamplesoflevitatingirregularcom-pactgrains,obtainedwiththePROGRA2-IRinstrument.Thelevitationisprovidedbymicrogravityduringparabolicflights.Theresultsarecomparedtopreviousmeasure-mentsonthesamesamplesconductedinthevisibledomainwiththePROGRA2-VISinstrumentat544and633nm,totentativelysearchforsometendenciesinthewavelengthdependenceofthescatteredlight.