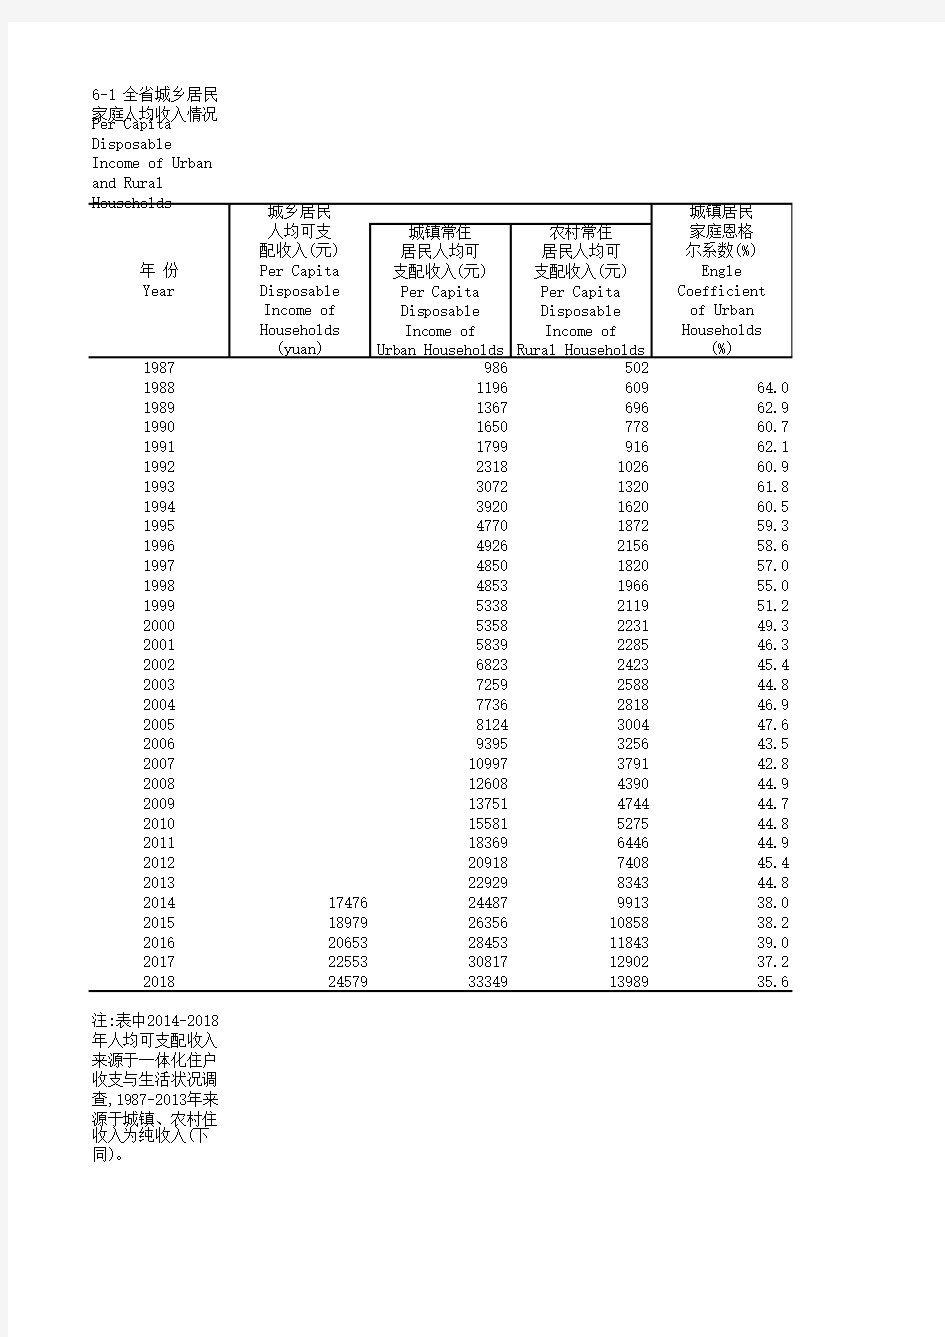
6-1 全省城乡居民
家庭人均收入情况
Per Capita
Disposable
Income of Urban
and Rural
1988119660964.0 1989136769662.9 1990165077860.7 1991179991662.1 19922318102660.9 19933072132061.8 19943920162060.5 19954770187259.3 19964926215658.6 19974850182057.0 19984853196655.0 19995338211951.2 20005358223149.3 20015839228546.3 20026823242345.4 20037259258844.8 20047736281846.9 20058124300447.6 20069395325643.5 200710997379142.8 200812608439044.9 200913751474444.7 201015581527544.8 201118369644644.9 201220918740845.4 201322929834344.8 20141747624487991338.0 201518979263561085838.2 201620653284531184339.0 201722553308171290237.2 201824579333491398935.6注:表中2014-2018
年人均可支配收入
来源于一体化住户
收支与生活状况调
查,1987-2013年来
源于城镇、农村住
收入为纯收入(下
同)。
Note:Since 2014,the National Bureau of
Statistics(NBS)c arries out the integration survey on the income,expenditu re and living
of urban and rural households.Data in 2014 cannot directly compare to those in 2013 and the year before.(the same to the following
57.8 57.6 63.5 60.6 62.9 52.6 56.6 59.7 57.1 53.8 61.6 54.1 56.9 59.0 59.1
57.6
58.9 57.6 53.4 56.0 53.4 53.1
50.0
51.8 50.9 49.5 43.2
42.7
43.2 41.9 41.8