A Comparison on Fuel Economy and Emissions for Conventional Hybrid Electric
Vehicles and the UTS Plug-in Hybrid Electric Vehicle
Salisa Abdul Rahman
1 School of Electrical, Mechanical and Mechatronic Systems, Faculty of
Engineering and Information Technology University of Technology,
Sydney, P.O. Box 123, Broadway, NSW 2007, Sydney, Australia
2 Department of Physical Science, Faculty of Science and Technology,
Universiti Malaysia Terengganu 21030 Kuala Terengganu, Malaysia
Salisa.AbdulRahman@https://www.doczj.com/doc/d518979871.html,.au
Nong Zhang
1School of Electrical, Mechanical and Mechatronic Systems, Faculty of Engineering and Information Technology
University of Technology, Sydney, P.O. Box 123, Broadway, NSW 2007, Sydney, Australia
Jianguo Zhu
1School of Electrical, Mechanical and Mechatronic Systems, Faculty of Engineering and Information Technology
University of Technology, Sydney, P.O. Box 123, Broadway, NSW 2007, Sydney, Australia
Abstract—Th is paper covers a comparative study on fuel economy and emissions of a conventional h ybrid electric veh icle (HEV) and th e UTS plug-in HEV (PHEV). Th e interaction between th e components such as energy storage system, electric mach ine, power control unit and internal combustion engine of the UTS PHEV are complex in order to optimize th e fuel economy and emissions brough t by th e veh icle. In th is work, th e model of the UTS PHEV is derived and implemented numerically in th e MATLAB/SIMULINK environment to study its operational performance in various drive cycles measured under life conditions. Th e simulation results in terms of fuel economy and emissions of the series and parallel HEV from the Advanced Vehicle Simulator and UTS PHEV are compared and the pros and cons discussed.
Keywords- hybrid electric vehicle; plug-in hybrid electric vehicle; powertrain; energy management strategy; fuel economy; emissions
I.I NTRODUCTION
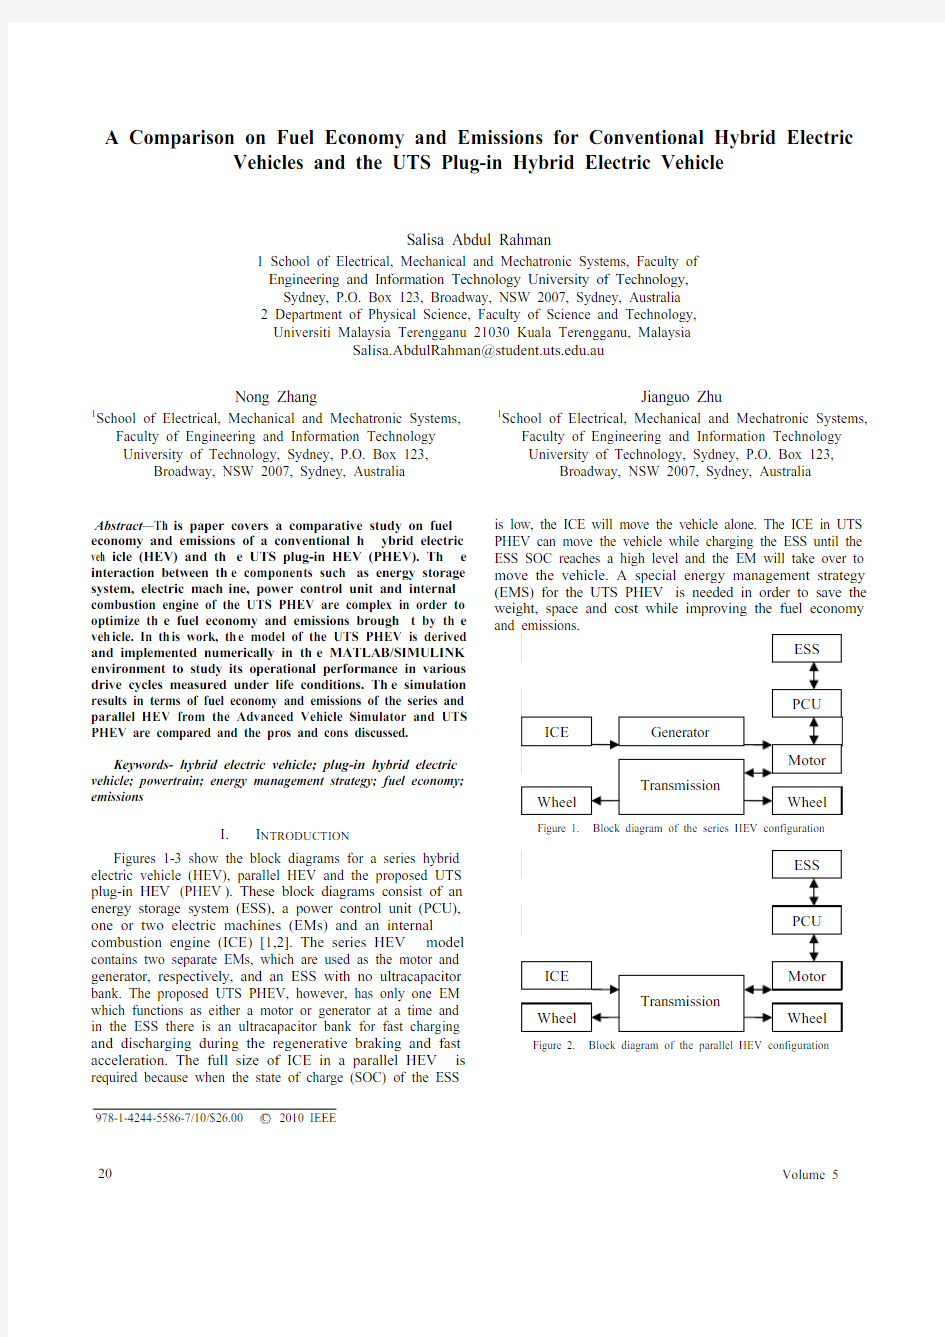
Figures 1-3 show the block diagrams for a series hybrid electric vehicle (HEV), parallel HEV and the proposed UTS plug-in HEV (PHEV). These block diagrams consist of an energy storage system (ESS), a power control unit (PCU), one or two electric machines (EMs) and an internal combustion engine (ICE) [1,2]. The series HEV model contains two separate EMs, which are used as the motor and generator, respectively, and an ESS with no ultracapacitor bank. The proposed UTS PHEV, however, has only one EM which functions as either a motor or generator at a time and in the ESS there is an ultracapacitor bank for fast charging and discharging during the regenerative braking and fast acceleration. The full size of ICE in a parallel HEV is required because when the state of charge (SOC) of the ESS
is low, the ICE will move the vehicle alone. The ICE in UTS PHEV can move the vehicle while charging the ESS until the ESS SOC reaches a high level and the EM will take over to move the vehicle. A special energy management strategy (EMS) for the UTS PHEV is needed in order to save the weight, space and cost while improving the fuel economy
Figure 1. Block diagram of the series HEV configuration
Figure 2. Block diagram of the parallel HEV configuration
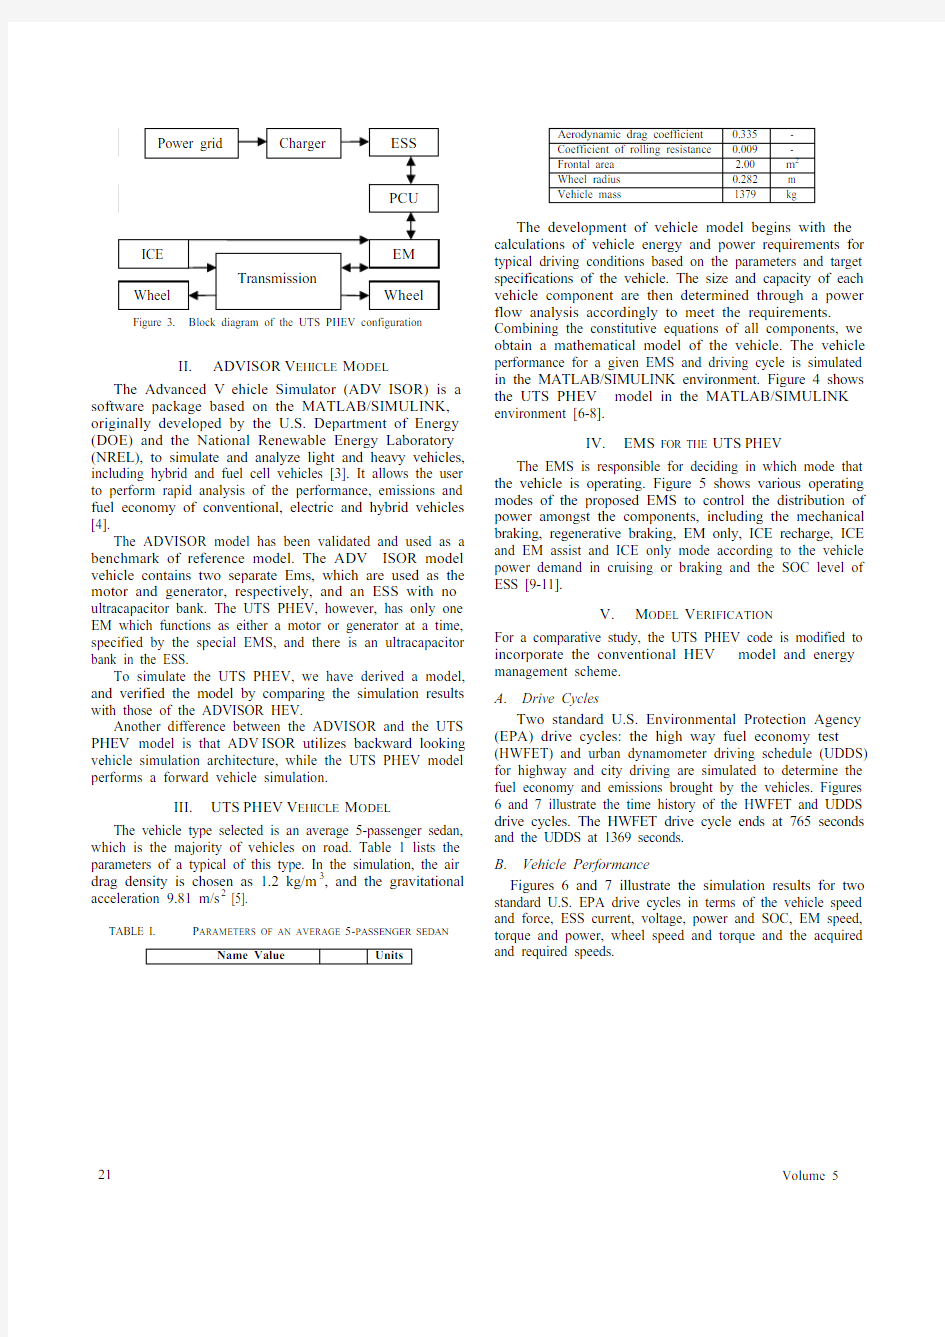
Figure 3. Block diagram of the UTS PHEV configuration
II.ADVISOR V EHICLE M ODEL
The Advanced V ehicle Simulator (ADV ISOR) is a software package based on the MATLAB/SIMULINK, originally developed by the U.S. Department of Energy (DOE) and the National Renewable Energy Laboratory (NREL), to simulate and analyze light and heavy vehicles, including hybrid and fuel cell vehicles [3]. It allows the user to perform rapid analysis of the performance, emissions and fuel economy of conventional, electric and hybrid vehicles [4].
The ADVISOR model has been validated and used as a benchmark of reference model. The ADV ISOR model vehicle contains two separate Ems, which are used as the motor and generator, respectively, and an ESS with no ultracapacitor bank. The UTS PHEV, however, has only one EM which functions as either a motor or generator at a time, specified by the special EMS, and there is an ultracapacitor bank in the ESS.
To simulate the UTS PHEV, we have derived a model, and verified the model by comparing the simulation results with those of the ADVISOR HEV.
Another difference between the ADVISOR and the UTS PHEV model is that ADV ISOR utilizes backward looking vehicle simulation architecture, while the UTS PHEV model performs a forward vehicle simulation.
III.UTS PHEV V EHICLE M ODEL
The vehicle type selected is an average 5-passenger sedan, which is the majority of vehicles on road. Table 1 lists the parameters of a typical of this type. In the simulation, the air drag density is chosen as 1.2 kg/m3, and the gravitational acceleration 9.81 m/s2 [5].
TABLE I. P ARAMETERS OF AN AVERAGE 5-PASSENGER SEDAN
Name Value
Units
Aerodynamic drag coefficient 0.335 -
Coefficient of rolling resistance 0.009 -
Frontal area 2.00 m2
Wheel radius 0.282 m
Vehicle mass 1379 kg
The development of vehicle model begins with the calculations of vehicle energy and power requirements for typical driving conditions based on the parameters and target specifications of the vehicle. The size and capacity of each vehicle component are then determined through a power flow analysis accordingly to meet the requirements. Combining the constitutive equations of all components, we obtain a mathematical model of the vehicle. The vehicle performance for a given EMS and driving cycle is simulated in the MATLAB/SIMULINK environment. Figure 4 shows the UTS PHEV model in the MATLAB/SIMULINK environment [6-8].
IV.EMS FOR THE UTS PHEV
The EMS is responsible for deciding in which mode that the vehicle is operating. Figure 5 shows various operating modes of the proposed EMS to control the distribution of power amongst the components, including the mechanical braking, regenerative braking, EM only, ICE recharge, ICE and EM assist and ICE only mode according to the vehicle power demand in cruising or braking and the SOC level of ESS [9-11].
V.M ODEL V ERIFICATION
For a comparative study, the UTS PHEV code is modified to incorporate the conventional HEV model and energy management scheme.
A.Drive Cycles
Two standard U.S. Environmental Protection Agency (EPA) drive cycles: the high way fuel economy test (HWFET) and urban dynamometer driving schedule (UDDS) for highway and city driving are simulated to determine the fuel economy and emissions brought by the vehicles. Figures 6 and 7 illustrate the time history of the HWFET and UDDS drive cycles. The HWFET drive cycle ends at 765 seconds and the UDDS at 1369 seconds.
B.Vehicle Performance
Figures 6 and 7 illustrate the simulation results for two standard U.S. EPA drive cycles in terms of the vehicle speed and force, ESS current, voltage, power and SOC, EM speed, torque and power, wheel speed and torque and the acquired and required speeds.
Figure 6.
The HWFET drive cycle
Figure 7. The UDDS drive cycle
As shown in Figures 8 and 9, the actual vehicle speed and force of the HWFET and UDDS drive cycles simulated by the ADV ISOR (red lines) and the UTS PHEV model (blue lines) agree well with each other, as expected.
C. Energy Storage System
From the ESS current, voltage and output power in Figures 8 and 9, one can deduce that the peak currents are due to the high power demand to achieve fast vehicle accelerations during the respective periods. The negative values on the graph represent the regenerative braking events during the hard braking periods in the cycle. In the ESS voltage graph, the voltage increases during recharging from regenerative braking and decreases during high current discharge when the power demand from EM is at peak.
SOC Power Demand of Vehicle
Figure 8. Simulation results of the HWFET drive cycle (Red line: ADVISOR, Blue line: UTS PHEV, Green line: acquired speed, and Black line: required speed)
Figure 9. Simulation results of the UDDS drive cycle (Red line: ADVISOR, Blue line: UTS PHEV, Green line: acquired speed, and Black line: required speed)
The SOC of the battery system of the two vehicle configurations during the HWFET and the UDDS drive cycles are shown in Figures 8 and 9. The overall trend of the energy consumption and generation of the two models matches reasonably well. However, there is some discrepancy between the battery SOC results of the UTS PHEV and conventional HEV in the HWFET drive cycle.
This is because the UTS PHEV code has a better EMS and can capture more regenerative braking energy.
D. Electric Machine
The EM speed, torque and power of the ADVISOR and UTS PHEV code for the HWFET and UDDS drive cycles are included in Figures 8 and 9. As shown in the simulation results, when the vehicle accelerates, the required EM torque increases quickly, and when the vehicle reaches the relatively stable highway velocity level, a much smaller torque is required to overcome the resistance and air drag to the vehicle. The speed, torque and power results from the two codes match reasonably well.
E. Wheels
Figure 8 depicts the wheel speed and torque requirement for the HWFET drive cycle of the two codes. The maximum
wheel torque, 600Nm, occurs when the vehicle is accelerating from standstill to the highway speed. The required torque then reduces since the HWFET drive cycle only consists of mild accelerations and decelerations. The overall results and trends match very closely. Figure 9
shows the wheel and torque required during the UDDS drive
cycle and the results from both ADVISOR and UTS PHEV
codes match very well.
F. Remarks From Figures 8 and 9, it can be seen that the acquired and required speeds agree reasonably well. The UTS PHEV code followed the desired drive cycle speed very well for both standard drive cycles. In combination with the previous discussion, it can be concluded that the results of the UTS PHEV code are correct and the components of the vehicle subsystems are correctly sized as the vehicle is capable of achieving performance to a target velocity. VI. A C OMPARISON ON F UEL E CONOMY AND E MISSIONS This study compares the fuel economy and emissions, such as hydro-carbon (HC), carbon-monoxide (CO) and nitrogen-dioxide (NO x ) for the conventional HEV and the
UTS PHEV , for the HWFET, UDDS and a cobination of
UDDS and HWFET drive cycles. The combined drive cycle is determined by weighting the city at 55% and the highway at 45% as the following highway
city combined FE FE FE 45.055.01
(1) Note that the SOC values are part of the EMS parameters. Although not related to component sizing, they have a direct impact on the fuel economy and emissions of the UTS PHEV design. The EMS for each configuration is different. The UTS PHEV is simulated using a specially developed EMS. The fuel economy and emissions for different drive
cycles are given in Tables 2-4.
TABLE II.
F UEL ECONOMY AND EMISSIONS COMPARISON FOR THE
HWFET DRIVE CYCLES
Configuration
Fuel economy (mpg) HC (g/mile) CO (g/mile)NO x
(g/mile)
Series 50 0.241 0.359 0.192 Parallel 66 0.240 0.277 0.120 UTS PHEV 68 0.212 0.314 0.114
TABLE III.
F UEL ECONOMY AND EMISSIONS COMPARISON FOR THE
UDDS DRIVE CYCLES
Configuration
Fuel economy (mpg) HC (g/mile) CO (g/mile)NO x
(g/mile)
Series 55 0.266 0.468 0.232 Parallel 54 0.330 0.372 0.130 UTS PHEV 90 0.254 0.238 0.055
TABLE IV. F UEL ECONOMY AND EMISSIONS COMPARISON FOR THE
COMPOSITE DRIVE CYCLES Configuration Fuel economy (mpg) HC (g/mile) CO (g/mile)NO x (g/mile)Series 53 0.254 0.412 0.212 Parallel 59 0.282 0.322 0.125
UTS PHEV 79 0.233 0.267 0.072 A significant improvement in the fuel economy and emissions were achieved by the UTS PHEV model. Based on the analysis results, the following observations can be
made. The fuel economy of the UTS PHEV is about 26% higher than that of the series HEV , 3% higher than the parallel HEV for the UDDS drive cycle, while for the HWFET drive cycle, it is 39% higher than that of the series HEV and 40% higher than the parallel HEV . The improvement for fuel economy for the combined drive cycle is 33% higher than the series HEV and 25% higher than the parallel HEV. The ultracapacitor bank played a helpful role in the
improvement of fuel economy and emissions. The series and
parallel HEV has only the battery in the ESS system while the UTS PHEV has both the battery and ultracapacitor bank in the ESS system. VII. C ONCLUSION The results of the vehicle subsystems in terms of ESS current, voltage, output power and SOC, EM speed and torque, vehicle speed and force and wheels speed and torque
are within reasonable and expected range of actual typical behavior of these subsystems. The components of the vehicle subsystems are correctly sized as the vehicle is
capable of achieving performance to a target velocity. In combination with previous discussion, it can be concluded
that results of the UTS PHEV code are correct. The fuel economy and emissions for the UDDS, HWFET and combined drive cycles are improved significantly. A CKNOWLEDGMENT The financial support to this work by the Australian Research Council (DP1096847) and the University of Technology, Sydney is gratefully acknowledged.
R EFERENCES
[1] B. K. Powell, K. E. Bailey and S. R. Cikanek, “Dynamic Modeling
and Control of Hybrid Electric V ehicle Powertrain Systems,” IEEE Control Systems, 0272 - 1708, 1998.
[2]L. B. Karen, E. Mehrdad and K. Preyas, “A Matlab-Based Modeling
and Simulation Package for Electric and Hybrid Electric V ehicle Design,” IEEE Transactions on Vehicular Technology., vol. 48., No.
6, 1999, pp.1770-1778.
[3] B. K. Wipke, “ADVISOR 2.1: A User-friendly Advanced Powertrain
Simulation using a Combined Backward/forward Approach,” IEEE Transactions on Vehicular Technology, vol. 48, 1999, pp 1751-1761. [4]T. Markel, “ADV ISOR: A Systems Analysis Tool for advanced
Vehicle Modeling,” Journal of Power Sources 110, 2002, pp.255-266.
[5]W. Johanna, “Modelling of Components for Conventional Car and
Hybrid Electric V ehicle in Modelica,” ME Thesis, Linkoping Universitet, 2004.
[6]L. Z. Yuliang, “Modelling and Simulation of Hybrid Electric
Vehicles”, ME Thesis, University of Victoria, 2007.
[7]J. K. Young, “Integrated Modelling and Hardware-In-The-Loop
Study for Systematic Evaluation of Hydraulic Hybrid Propulsion Options, PhD Thesis, University of Michigan, 2008.
[8]L. Jinming, “Modelling, Configuration and Control Optimization of
Power Split Hybrid V ehicles”, PhD Thesis, University of Michigan, 2007.
[9]J. Nashat, A. K. Naim and S. Mutasim, “A Rule Based Energy
Management Strategy for Series Hybrid Vehicle,” Proceedings of the American Control Conference, Albuquerque, New Mexico, 1997, pp.
689-693.
[10]T.N. Csaba, “Investigation and Simulation of the Planetary
Combination Hybrid Electric V ehicle,” ME Thesis, University of West Virginia, 2000.
[11]W. Maria, “Energy Management of Hybrid Electric V ehicles,” ME
Thesis, University of Waterloo, 2006.