COMPARATIVE ANALYSIS OF PROTEIN CLASSIFICATION METHODS
- 格式:pdf
- 大小:443.52 KB
- 文档页数:81

逐个克隆法:对连续克隆系中排定的BAC克隆逐个进行亚克隆测序并进行组装(公共领域测序计划)。
全基因组鸟枪法:在一定作图信息基础上,绕过大片段连续克隆系的构建而直接将基因组分解成小片段随机测序,利用超级计算机进行组装。
单核苷酸多态性(SNP),主要是指在基因组水平上由单个核苷酸的变异所引起的DNA序列多态性。
遗传图谱又称连锁图谱,它是以具有遗传多态性(在一个遗传位点上具有一个以上的等位基因,在群体中的出现频率皆高于1%)的遗传标记为“路标”,以遗传学距离(在减数分裂事件中两个位点之间进行交换、重组的百分率,1%的重组率称为1cM)为图距的基因组图。
遗传图谱的建立为基因识别和完成基因定位创造了条件。
物理图谱是指有关构成基因组的全部基因的排列和间距的信息,它是通过对构成基因组的DNA分子进行测定而绘制的。
绘制物理图谱的目的是把有关基因的遗传信息及其在每条染色体上的相对位置线性而系统地排列出来。
转录图谱是在识别基因组所包含的蛋白质编码序列的基础上绘制的结合有关基因序列、位置及表达模式等信息的图谱。
比较基因组学:全基因组核苷酸序列的整体比较的研究。
特点是在整个基因组的层次上比较基因组的大小及基因数目、位置、顺序、特定基因的缺失等。
环境基因组学:研究基因多态性与环境之间的关系,建立环境反应基因多态性的目录,确定引起人类疾病的环境因素的科学。
宏基因组是特定环境全部生物遗传物质总和,决定生物群体生命现象。
转录组即一个活细胞所能转录出来的所有mRNA。
研究转录组的一个重要方法就是利用DNA芯片技术检测有机体基因组中基因的表达。
而研究生物细胞中转录组的发生和变化规律的科学就称为转录组学。
蛋白质组学:研究不同时相细胞内蛋白质的变化,揭示正常和疾病状态下,蛋白质表达的规律,从而研究疾病发生机理并发现新药。
蛋白组:基因组表达的全部蛋白质,是一个动态的概念,指的是某种细胞或组织中,基因组表达的所有蛋白质。
代谢组是指是指某个时间点上一个细胞所有代谢物的集合,尤其指在不同代谢过程中充当底物和产物的小分子物质,如脂质,糖,氨基酸等,可以揭示取样时该细胞的生理状态。

蛋白质体学报告生物数据库简介蛋白质序列结构的分析与预测-Ⅱ(5/9)演讲老师:吕平江老师指导老师:李永安老师生命科学系四组长:曾瓘钧 488340444组员:林泰宏 488340030廖智凯 488340195李岳锜 488340547 前言:这本书之前的章节关于数据库得到知识的讨论,可以运用不同的数据库得到大量可用的序列讯息,当我们准备看核甘酸序列及所有的蛋白质序列时,无论是直接决定,或是经由核甘酸序列中open reading frame的转译,这些包含决定其结构及功能的内在讯息,不幸的,实验针对这些讯息不能用未加工的讯息数据来产生,一些判定的技术,像是circulardichroism spectroscopy、optical rototary dispersion、X-ray晶体绕射(X-ray crystallography)及核磁共振(NMR),对于结构的特性是非常强而有力,但这些费时的技术实行,需要高度熟练和技术性上高要求的操作,在蛋白质序列和结构数据库的大小上比较中,SWISS-PORT中有87143个蛋白质(Release 39.0),但只有12624的蛋白质结构在PDB 中出现(July, 2000),试图关掉环绕在预测结构跟功能的方法中的gap center,然后这些方式可以在生化资料缺乏时,提供一个看的见蛋白质特性的方法。
此章节焦点集中在计算的技术,可以提供学上的发现基于本身蛋白质序列或其本身蛋白质家族的比较,不像核甘酸序列,是由4个化学上相似的base所组成,蛋白质中找到20个胺基酸,提供了结构及功能非常大的变异,这些残基具有不同的化学构造,因为胺基酸是碱或是酸、是亲水性或是厌水性、还是直炼或是具有分支链、或是芳香族,所以每一个残基皆可影响蛋白质全部物理特性,因此,在蛋白质domain上,每一个残基具有某一倾向去形成不同型的结构,这些特性,基于一个生化中心的教条:序列详述构造。

抑制经验模态分解端点效应的常用方法性能比较研究的开题报告一、研究选题背景及意义经验模态分解(Empirical Mode Decomposition,EMD)是一种数据分解的方法,从信号本身出发,将信号分解成若干个内在模态函数(Intrinsic Mode Function,IMF)。
IMF是指在时间尺度和频率尺度上都能描述数据局部特征的函数,可以通过不同分量之间相互组合重构出原始信号。
但是,在实际应用中,EMD存在端点效应等问题,使得分解结果受到很大的影响,从而影响信号分析的准确性和可靠性。
因此,抑制EMD端点效应的方法研究具有重要的理论意义和实际应用价值。
目前,已经有多种方法被提出用于解决EMD端点效应的问题,例如对称延拓法、反回归公式、短时傅里叶变换等方法。
但是,这些方法之间的性能差异目前还没有被充分研究和比较,因此有必要对不同方法进行性能比较,选择性能最优的方法进行应用。
本研究的主要目的是通过对不同抑制EMD端点效应的方法进行比较,找出性能最优的方法并且探究其原因,为信号分析和处理提供参考和指导。
二、研究内容和方法本研究的研究内容是对EMD端点效应抑制方法的性能比较。
具体包括以下三个方面:1.对不同的抑制EMD端点效应的方法进行比较。
本研究将对对称延拓法、反回归公式、短时傅里叶变换等方法进行性能比较,从抑制端点效应的效果、计算时间等几个方面进行分析。
2. 探究其中最优方法的原因。
根据比较结果,进一步探究其中表现最优的方法具有哪些优势,这些优势与方法的理论基础和应用特点有何关系。
3.应用比较结果于实际信号处理分析中。
利用比较结果,将最佳方法应用于实际的信号处理分析工作中,以评估方法的实用性和可靠性。
本研究的研究方法主要是基于对已有研究成果的综合归纳,结合实际信号处理分析中的应用需求,在对比不同方法的基础上,深入探究最优方法的特点,并将之应用于实际的信号处理分析中。
三、预期成果本研究的预期成果主要包括:1. 结合不同抑制EMD端点效应的方法进行比较,找出性能最优的方法。

硕士学位论文SHANGHAI UNIVERSITYMASTER DISSERTATION题蛋白质生物功能的机器学习方法研究目摘要近些年来,随着信息技术和生物检测手段的不断发展,生命科学的数据资源急剧膨胀。
实验工作者在产生大量数据的同时,也对理论研究者提出了更多的难题。
利用机器学习这一方法来分析这些数据,我们可以从中找出隐含的规律和模式,从而进一步加深对事物的认识。
本文就是采取这一研究方法,对蛋白质的生物功能进行建模和预报。
在本文的工作中,我们使用了机器学习方法来对蛋白质和小分子的相互作用、蛋白质糖基化位点的识别进行建模和预报。
另外我们还探讨了一系蛋白质列生物功能在线预报系统的建设和优化。
本文的主体工作分为三个部分:1.用集成学习算法对蛋白质和小分子的相互作用进行研究。
我们针对代谢途径下的酶和底物之间的相关作用,建立了相互作用预报模型。
通过对数据集的变量筛选和降维的评价,我们保留了原有的变量集合。
在后续的建模过程中分别用AdaBoost,Bagging, SVM, KNN, 决策树对酶和底物进行建模。
10组交叉验证和独力测试集的结构显示,集成学习方法AdaBoost,Bagging的分类能力最好,都达到了71%以上。
而我们接着又把不同的分类器组合集成后发现,前2个性能最好的集成学习算法和KNN组合后的体系具有最好的推广能力,其独立测试集中正样本的正确率又在原先最好的结果下提高了近4%,而其总体正确率也达到了84.6%。
结果证明,多重集成学习算法可以用来研究蛋白质和小分子相互作用,所得到的模型有很好的预测性能。
此外,我们根据所建立的酶和底物相互作用的预测模型,同时开发了相应的在线预报系统。
2.用CFS-Wrapper筛选变量法结合AdaBoost集成方法对蛋白质O端糖基化位点进行研究。
在许多的生化过程中都需要有O-端糖链的参与。
然而糖基化是一个复杂的过程,迄今为止还未得出一个固定的模式。
我们对收集到的糖基化和非糖基化肽段, 并用肽段中残基的物化参数,以AAIndex库中的数据进行表征。

随机森林算法应用场景随机森林是一种集成学习算法,通过构建多个决策树模型并结合它们的预测结果来进行分类或回归。
随机森林算法具有很多优点,如具有较高的准确率、能够处理大规模数据集、能够处理高维数据、对缺失值和异常值具有较好的鲁棒性等。
因此,随机森林算法在许多领域都有广泛的应用。
以下是随机森林算法的一些应用场景及相关参考内容:1. 金融领域在金融领域,随机森林算法可以应用于风险评估、信用评分、欺诈检测等任务。
例如,在信用评分中,可以使用随机森林算法构建一个模型来预测借款人的信用风险。
相关参考内容可以是论文《A random forest approach to classifying financial distress》。
2. 医学领域随机森林算法在医学领域中有广泛的应用,如疾病预测、药物设计、基因表达分析等。
例如,在疾病预测中,可以使用随机森林算法根据患者的临床特征来预测患者是否患有某种疾病。
相关参考内容可以是论文《Random forest for the early detection of cardiovascular disease》。
3. 自然语言处理随机森林算法在自然语言处理中也有广泛的应用,如情感分析、文本分类、命名实体识别等。
例如,在情感分析中,可以使用随机森林算法对文本进行情感分类,判断文本是积极的、消极的还是中性的。
相关参考内容可以是论文《A comparative analysis of sentiment classification for tweets using random forest》。
4. 图像处理随机森林算法在图像处理中也有一定的应用,如图像分类、目标检测、人脸识别等。
例如,在目标检测中,可以使用随机森林算法对图像中的目标进行检测和定位。
相关参考内容可以是论文《Facial expression recognition using random forest and local binary patterns》。

外文文献翻译:原文+译文文献出处:Gunasekaran A. The study of purchasing process management information system[J]. European Journal of Operational Research, 2016, 1(2): 29-45.原文The study of purchasing process management information systemGunasekaran AAbstractThe definition of process management is a set of creating value for customers, interrelated, the activities of the relationship between input and output combinations. Specification of the operation of the enterprise's process is on the business can be constantly summarize and curing excellent experience in business operations. Made the enterprise work efficiency is higher, the cost is lower, create a product or service quality more good, to gain more customer satisfaction. Combining with the latest process management theory and ideas, design the procurement process architecture and process management system, the application of industry in the process of benchmarking management tool, to solidify and auxiliary process management, process management and IT tools were discussed by the process of ascension in helping the business management level, and at the same time comparative analysis of several commonly used industry process management tools, for the enterprise procurement process change management to provide reference and basis. Keywords: purchasing management; process management; the information system1 IntroductionTo customer demand as the guidance of the build process type organization; Carding the business process in a process management way, according to the hierarchical classification process management ideas, building the business process monitoring management, performance evaluation and the closed loop management system, internal control auditing protect health of the whole process running, high efficiency and low cost. In guaranteed, on the basis of organization and Process system, and then based on the integration (P2A, Process To the Application ProcessTo the Application system), the mechanism of using ARIS tools To build information integrated Process management platform, To effectively support the business Process of efficient operation and management, at the same time can adapt To the continuous improvement of business Process optimization and IT system on the synergy. In the real sense, the research significance of this article embodied in two aspects: first, the implementation of business process management for the enterprise to provide reference and guidance for the construction of process management system. From the process management system, rules, the design, the pilot, push, monitoring, evaluation and improvement of the whole life cycle process management and process management and department in the process of the organization and management of the combination of introduction and discussion, lets the enterprise process management ideas and methods to get more detailed understanding. At the same time, the analysis of the problems in the process of the whole also can make the enterprise before the implementation of process management ready to more fully. Second, in the process management system to provide the reference and guidance on building, enterprise to obtain competitive process to adapt to the market, the integration of supply chain enterprise, enterprise's process must continuous improvement. In this way, the process becomes dynamic, across the organization, and full of flexibility. Business process management system using the unified visual process modeling tool to business process of abstracting, can the enterprise complicated business flow synchronization application logic separation, improves the flow process of flexibility. Such rapid construction of system, can satisfy the continuous improvement of the enterprise, and thus gain a competitive edge for the enterprise. Thirdly, based on the research of the purchasing process management and architecture, for domestic enterprises how to establish purchasing management system and purchasing process architecture construction for reference, at the same time from the research problems in the process of discussion, help enterprise thinking and avoid problems in the process of building, better service to the development of the enterprise.2 Literature reviewIf there is a suitable leader and the appropriate business management tools, and aclear transparent industry value chain model, and the model is able to adjust for differences in some condition, the enterprise can be based on the global market competition. Enterprises in the implementation of its operating strategy, need to set up a flexible business process, at the same time also need to have a can turn process optimization and process innovation management concept in the information system. The best business solutions are the process configuration to the application system, build process-oriented, suitable organization, and reduce the interface between business processes and the external. Business process management covers the entire value chain of enterprise management, is across organizational process management and control of a concept and method. Business Process Management (BPM, Business Process Management) which is very wide, from the Process analysis and optimization, transformation, and to such as software system implementation, so that the Process of automatic determination of the execution, control and evaluation index, all belong to the category of BPM. Business flow management is, as it were, a cycle management, only to keep the loop unobstructed, can make the enterprise constantly adapt to market changes. Can be found through the analysis of BPM and make full use of enterprise and the customer (and the customer's customer) and suppliers (and suppliers) of processes across the enterprise boundaries between the potential to save cost and increase efficiency. Business process management is to improve the foundation of enterprise competitiveness and ability to innovate, it directly affects the production process, product innovation, quickly enter the market, etc.), manufacture and service process (customer orientation, marginal benefit/profit, quality, etc.), the support process (less management costs, higher employee satisfaction, etc.) as well as the management and control process (change management, strategy, etc.).From the perspective of process management concept is: there is thought that create customer value and enterprise, the enterprise process is creating value for customers, excellent business process, can achieve the success of the enterprise, excellent process operation depends on excellent process management. To sum up, the meaning of the process management of enterprise, is to simplify and improve the company's business process system, and make it more agile response to customer demand, expand theroutine management, reduce the exception management, improve efficiency, plugging loopholes, enables the enterprise to gradually into the operational excellence.Earlier with the gradually development of IT technology, EAI (enterprise application integration), process modeling, process optimization, workflow technology evolved into the business process management. Business process management technology lies in process modeling, process analysis, process simulation to the development of three aspects. Around the business process analysis technology as the center of the research, the main representative is: a person thousands of activity-based cost analysis method in the activities of business process reengineering model and analysis of the application of auxiliary activities, as well as li-hua huang from the change of management thinking, based on the process of information technology and optimization based on analysis of information flow in the process of hyper graph three aspects proposed the six rules of process optimization. Around the business process modeling technology and the development of a lot of modeling technology.Business process management system is usually refers to the technical implementation of business process management, business process management system for process management of enterprise value choice must implement the following functions: independently managing resources, information and the ability to process, and can realize the function allocation and combination; Have the ability to measure the impact of business changes and process management system can provide better than before the change of business process information; The ability to achieve business rules and business change quickly, process management system can help business managers to react more quickly to deal with the business of change; Keep the consistency of the integrity of business processes and information; So the process is not simply a technical management system, through the process management system components research, we can more clearly understand.3 Purchasing management researchProcurement refers to the way in addition to the purchase to obtain goods or services, also can make items in the following ways to use, to achieve the goal ofmeet the demand. General procurement main ways are: exchange, lending and leasing. The function of purchasing in large enterprises is not only purchasing department internal or buyer; also composition is an important part of enterprise supply chain as a whole. Procurement in accompanied by the emergence and spread of the integration of logistics management, its operation process itself is no longer a simple transaction oriented, its core concept should be extended to the supplier to build strategic alliances, sharing information system effectively, and promote global local procurement.Basic types of procurement organization consisted of a mixed type purchasing organization and cross-functional procurement team, centralized purchasing organization, dispersible purchasing organization. Hybrid purchasing organization, in some of the major manufacturing enterprises, at the company level there is a company purchasing department, however, independent business unit of strategic and tactical purchasing activities. Cross-functional team is a relatively new form of organization, purchasing a new purchasing organization USES a single point of contact with suppliers (commodity group), is provided by the team for the entire organization on the requirements of the integration of all components. Centralized procurement organization structure, the company has a central purchasing department level, including work mainly include: the company's procurement experts in strategic and tactical level of operation; Product specifications set centrally; Supplier selection strategy; to prepare and negotiate the contract with suppliers. Dispersible purchasing organization is an important characteristic of each business unit responsible persons responsible for own financial consequences.With the rapid development of information technology, IT, and changes in today's global economy, the status of purchasing management in the business management activity is more and more important. Simple is summarized and the trend of the development of procurement management, procurement will be from simple pure trading buy and sell to "reasonable purchasing" development, namely choosing the right product, at the right price, in the right time, with the right quality and through the appropriate suppliers. Enterprise organization structure also gradually to thedevelopment of functional and ability, which can accurately locate on the market value of procurement, to obtain products and services effectively. Mainly embodies in the following three trends: one, strategic sourcing, and supplier to build strategic alliance, a long-term common development with technology, diverse and complex market environment in the future for enterprises in the first stand firm foundation, can have exceptional value. Second, e-commerce, purchasing will increasingly rely on the Internet, rapid, real-time access to various global suppliers, market information such as price, quantity, at the same time also can get more purchasing data, tries to study the value of the data itself, on the purchasing management also has far-reaching significance. Three, strategic cost management: as technology, equipment and other fields gradually reduce, reduce the cost of space and procurement in the position to reduce the cost of the also more and more obvious, and the enterprise's strategic cost management, the entire supply chain of each link only together to reduce costs, to achieve a "win-win".译文采购流程管理信息系统研究Gunasekaran A摘要流程管理的定义就是一组为客户创造价值的,有相互关联的、有输入输出关系的活动组合。
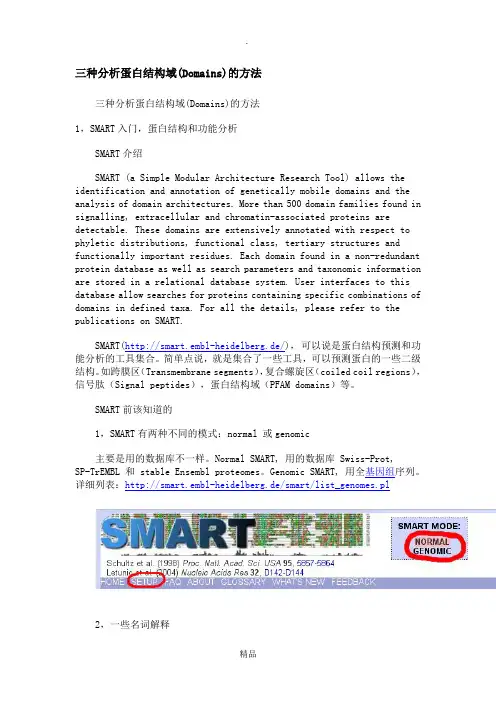
三种分析蛋白结构域(Domains)的方法三种分析蛋白结构域(Domains)的方法1,SMART入门,蛋白结构和功能分析SMART介绍SMART (a Simple Modular Architecture Research Tool) allows the identification and annotation of genetically mobile domains and the analysis of domain architectures. More than 500 domain families found in signalling, extracellular and chromatin-associated proteins are detectable. These domains are extensively annotated with respect to phyletic distributions, functional class, tertiary structures and functionally important residues. Each domain found in a non-redundant protein database as well as search parameters and taxonomic information are stored in a relational database system. User interfaces to this database allow searches for proteins containing specific combinations of domains in defined taxa. For all the details, please refer to the publications on SMART.SMART(http://smart.embl-heidelberg.de/),可以说是蛋白结构预测和功能分析的工具集合。
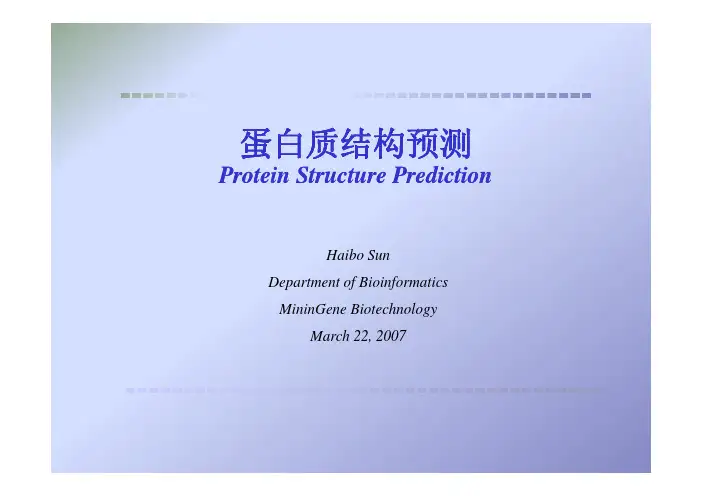
蛋白质结构预测Protein Structure PredictionHaibo SunDepartment of BioinformaticsMininGene BiotechnologyG h lMarch 22, 2007背景结构分类:z一级结构也就是组成蛋白质的氨基酸序列z二级结构即骨架原子间的相互作用形成的局部结构,比如alpha螺旋,beta片层和loop区等l h b t lz三级结构即二级结构在更大范围内的堆积形成的空间结构z四级结构主要描述不同亚基之间的相互作用。
结构测定的实验方法z核磁共振z X光晶体衍射两种。
一级结构级结构预测基础预测基础:z 实验:在体外无任何其他物质存在的条件下,使得蛋白质去折叠,然后复性,蛋白质将立刻重新折叠回原来的空间结构z 物理学的角度讲,系统的稳定状态通常是能量最小的状态二级结构反向β-折叠α-螺旋β-转角三级结构Turn or coilAlpha-helix Beta-sheetLoop and Turn蛋白质结构预测•Sequence secondary structure 3D structure Sequence →secondary structure →3D structure →functionProtein Structure PredictionProtein Structure Prediction •Prediction is possible because–Sequence information uniquely determines 3D structure–Sequence similarity (>50%) tends to imply structuralsimilarity•Prediction is necessary because–DNA sequence data »protein sequence data »structuredata199419972002.102007.3 Sequence (Swiss Port)40,00068,000114,033261,513 Sequence(Swiss-Port)4000068000114033261513 Structure (PDB)4,0457,00018,83842,474Methods预测方法Comparative (homology) modeling (同源建模法) Construct 3D model from alignment to proteinithsequences withknown structureg(g)(折识别法)Threading (fold recognition) (折叠识别法Pick best fit to sequences of known 2D / 3D structures (folds)Ab initio / de novo methods (从头预测法)Ab initio/de novo methods(Methods(1)同源性(Homology)方法:理论依据:如果两个蛋白质的序列比较相似,则其结构理论依据如果两个蛋白质的序列比较相似则其结构也有很大可能比较相似。
美国、欧盟和中国生物技术药物的比较一、本文概述Overview of this article随着全球科技的快速发展,生物技术已成为推动医疗进步的重要力量。
本文旨在探讨美国、欧盟和中国在生物技术药物领域的发展现状、优势和挑战。
通过对比分析这三个地区的生物技术药物产业,我们将揭示不同国家和地区的产业特点、发展趋势以及面临的挑战。
With the rapid development of global technology, biotechnology has become an important force driving medical progress. This article aims to explore the current development status, advantages, and challenges of the United States, the European Union, and China in the field of biotechnology drugs. By comparing and analyzing the biotechnology and pharmaceutical industries in these three regions, we will reveal the industry characteristics, development trends, and challenges faced by different countries and regions.我们将概述生物技术药物的定义、分类及其在医药领域的应用。
接着,我们将分别介绍美国、欧盟和中国在生物技术药物研发、生产和市场准入方面的政策和法规。
通过对比分析,我们将揭示这三个地区在生物技术药物领域的优势和不足。
We will provide an overview of the definition, classification, and application of biotechnology drugs in the pharmaceutical field. Next, we will introduce the policies and regulations of the United States, the European Union, and China in the research and development, production, and market access of biotechnology drugs. Through comparative analysis, we will reveal the advantages and disadvantages of these three regions in the field of biotechnology drugs.在此基础上,我们将进一步探讨各国在生物技术药物研发和生产方面的主要企业、创新药物和技术突破。
2470[作者简介]林兰,女,副研究员,研究方向:药品检验检测及分子生物学。
联系电话:(010)67095883,E-mail :linlan@nifdc.org.cn 。
[通讯作者]杨化新,女,主任药师,研究方向:药物分析。
联系电话:(010)67095866,E-mail :yanghx@nicpbp.org.cn 。
·新药研发论坛·国外仿制药一致性评价比较分析林兰,牛剑钊,许明哲,杨化新(中国食品药品检定研究院,北京100050)[摘要]国务院发布的《国家药品安全“十二五”规划》中明确提出了要全面提高仿制药质量,开展仿制药质量一致性评价。
在我国仿制药质量一致性评价即将开展之际,通过查阅国外仿制药评价的文献资料,结合有关国外调研报告,本文从仿制药一致性评价的历史沿革、评价方法两方面对国外仿制药一致性评价的情况进行介绍,并比较国外对仿制药溶出度技术的不同要求。
其中着重对日本和美国仿制药评价的背景、方法与结果进行了比较分析。
在此基础上,结合我国仿制药研究与监管现状,提出借鉴意义,以期为我国的仿制药质量一致性评价提供参考,保障一致性评价工作的顺利开展。
[关键词]仿制药;评价;美国;日本;溶出度[中图分类号]R95[文献标志码]C [文章编号]1003-3734(2013)21-2470-05Comparative analysis of consistency evaluationfor generic drugs in foreign countriesLIN Lan ,NIU Jian-zhao ,XU Ming-zhe ,YANG Hua-xin(National Institutes for Food and Drug Control ,Beijing 100050,China )[Abstract ]The national drug safety “12th Five-Year Plan ”had clearly put forward enhancing the quality of generic drugs and launching the generic drugs consistency evaluation.As the evaluation work is being launched in our country ,lots of literature abroad was reviewed.The history and methods of consistency evaluation for generic drugs in foreign countries were analyzed in this paper ,and technical requirements of dissolution tests across differ-ent countries were introduced as well.The situations in Japan and America were primarily introduced.The experi-ence of consistency evaluation for the quality of generic drugs in foreign countries would provide much assistance on current evaluation work in our country.[Key words ]generic drugs ;evaluation ;USA ;Japan ;dissolution 2012年初,国务院印发了《关于印发国家药品安全“十二五”规划的通知》[1],其中明确提出:要全面提高仿制药质量,对2007年修订的《药品注册管理办法》施行前批准的仿制药,分期分批与被仿制药进行质量一致性评价。
三种分析蛋白结构域(Domains)的方法三种分析蛋白结构域(Domains)的方法1,SMART入门,蛋白结构和功能分析SMART介绍SMART (a Simple Modular Architecture Research Tool) allows the identification and annotation of genetically mobile domains and the analysis of domain architectures. More than 500 domain families found in signalling, extracellular and chromatin-associated proteins are detectable. These domains are extensively annotated with respect to phyletic distributions, functional class, tertiary structures and functionally important residues. Each domain found in a non-redundant protein database as well as search parameters and taxonomic information are stored in a relational database system. User interfaces to this database allow searches for proteins containing specific combinations of domains in defined taxa. For all the details, please refer to the publications on SMART.SMART(http://smart.embl-heidelberg.de/),可以说是蛋白结构预测和功能分析的工具集合。
仓鼠属物种线粒体基因组特征及系统发生摘要仓鼠属是仓鼠亚科最大的属,分布范围广,环境适应能力强。
以往对仓鼠属的研究主要集中在形态学研究,存在很多分歧。
分子生物学研究方法也应用到仓鼠属的分类和系统发生研究。
然而,由于线粒体基因组数据的缺乏,未能在线粒体基因组水平上探讨仓鼠属的系统发生关系和物种分类地位。
此外,先前报道的仓鼠属物种线粒体基因组,也未能详尽地分析线粒体的进化特征。
因此,有必要全面地对仓鼠属物种线粒体基因组进行比较分析,以及在线粒体基因组水平上构建系统发生树对仓鼠属物种分类和系统发生关系进行重新分析。
本研究通过对六种仓鼠属物种线粒体基因组进行比较,发现并描述了仓鼠属物种线粒体基因组的共同特征和特化特征。
利用线粒体基因组构建系统发生树,系统地论证了仓鼠属物种之间的分类和系统发生关系。
此外,还分析了仓鼠属物种线粒体单基因在构建系统发生树中的可靠性。
研究结果如下:1、仓鼠属物种线粒体基因组包含13个蛋白编码基因、2个核糖体基因、22个转运RNA和一个非编码基因,没有任何基因缺失和重排。
在仓鼠属中,灰仓鼠线粒体基因组序列长度最短,全长16246 bp;大仓鼠序列长度最长,为16488 bp。
仓鼠属物种线粒体基因组序列碱基拥有高的AT含量;蛋白编码基因三联体密码子AT含量在三号位高于一号位和二号位,而G含量在三号位低于一号位和二号位;控制区中央保守区表现出较高的GC含量;tRNA Ser2失去二氢尿嘧啶颈环结构;蛋白编码基因包含不完全密码子;ATG为偏爱起始密码子;AUU(Ile)和CUA(Leu)为偏爱密码子;轻链复制起始序列长约45 bp,能够折叠成一个颈环发夹结构,并且颈环结构起始序列都以5′-CTTCT-3′开始;控制区包含三个模块,分别为末端延伸终止模块、中央保守区和序列保守模块(CSB)。
仓鼠属物种线粒体基因组特化特征表现为控制区保守序列模块中CSB3子模块缺失;轻链复制起始序列DNA聚合酶识别结合位点模块为5′-ACTAA-3′,而其它哺乳动物为5′-GCCGG-3′。
•临床研究-中国汉族ADRP一家系RHO基因变异基因型及临床表型分析张玉薇1娄桂予1杨科1阳琳2朱青2雷博21河南省人民医院医学遗传研究所河南省遗传性疾病功能基因重点实验室,郑州450003;2河南省人民医院河南省眼科研究所河南省立眼科医院,郑州450003通信作者:雷博,Email:bolei99@【摘要】目的分析中国汉族常染色体显性遗传视网膜色素变性(ADRP)—家系的致病基因及临床表型。
方法采用家系调查研究,收集2019年11月于河南省人民医院进行遗传咨询的中国汉族RP一家系,纳入该家系4代20名成员,包括9例患者和11名表型正常者,对部分家系成员进行视力、视野和眼底检查。
收集该家系成员外周血样本,提取DNA,采用Ion Torrent PGM测序平台,对先证者进行包含43个与RP相关基因的外显子靶向测序,采用PCR和Sanger测序对变异位点进行验证。
采用在线软件对变异位点进行蛋白功能预测。
采用ClustalW2多重比对程序对变异位点的氨基酸序列进行比较。
根据美国医学遗传学与基因组学学会(ACMG)遗传变异分类标准与指南分析变异的致病性。
结果该家系符合常染色体显性遗传。
先证者,男,26岁,自幼双眼夜盲,视力右眼0.25,左眼0.5。
双眼视网膜有骨细胞样色素沉着,视网膜血管变细,视盘颜色变淡。
全视野视网膜电图检查显示,暗适应a波和b波峰值降低,明适应a波和b波峰值重度降低。
其余家系成员患者均于7~10岁开始岀现夜盲,约50岁时周边视力完全丧失,眼科检查均呈典型RP改变。
基因检测结果显示,该家系视紫红质(RHO)基因(NM_000539.3)5号外显子中存在1个杂合错义变异c.982delC(p.L328fs)。
该变异可导致编码的RHO蛋白第328位氨基酸以后的21个氨基酸改变,使编码区由348个氨基酸增加到358个氨基酸,RHO蛋白结构发生改变;多个不同物种之间蛋白同源序列比对分析结果显示该位点高度保守。
COMPARATIVEANALYSISOFPROTEINCLASSIFICATIONMETHODSbyPoojaKhati
AMASTERSTHESISPresentedtotheFacultyofTheGraduateCollegeattheUniversityofNebraska-Lincoln
InPartialFulfillmentofRequirementsFortheDegreeofMasterofScience
Major:ComputerScienceUndertheSupervisionofProfessorsStephenScottandEtsukoMoriyamaLincoln,NebraskaDecember,2004COMPARATIVEANALYSISOFPROTEINCLASSIFICATIONMETHODSPoojaKhati,M.S.UniversityofNebraska-Lincoln,2004
Advisors:StephenScottandEtsukoMoriyamaAlargenumberofnewgenecandidatesarebeingaccumulatedingenomicdatabasesdaybyday.Ithasbecomeanimportanttaskforresearcherstoidentifythefunctionsofthesenewgenesandproteins.Fasterandmoresensitiveandaccuratemethodsarerequiredtoclassifytheseproteinsintofamiliesandpredicttheirfunctions.Manyexistingproteinclas-sificationmethodsbuildhiddenMarkovmodels(HMMs)andotherformsofprofiles/motifsbasedonmultiplealignments.Thesemethodsingeneralrequirealargeamountoftimeforbuildingmodelsandalsoforpredictingfunctionsbasedonthem.Furthermore,theycanpredictproteinfunctionsonlyifsequencesaresufficientlyconserved.Whenthereisverylittlesequencesimilarity,thesemethodsoftenfail,evenifsequencessharesomestructuralsimilarities.OneexampleofhighlydivergedproteinfamiliesisG-proteincoupledrecep-tors(GPCRs).GPCRsaretransmembraneproteinsthatplayimportantrolesinvarioussignaltransmissionprocesses,manyofwhicharedirectlyassociatedwithavarietyofhu-mandiseases.MachinelearningmethodsthathavebeenstudiedspecificallyforaproblemofGPCRfamilyclassificationincludeHMMandsupportvectormachine(SVM)methods.However,aminoacidcompositionhasnotbeenstudiedwellasapropertyforGPCRclas-sification.Inthisthesis,SVMswithaminoacidfrequencieswereusedtoclassifyGPCRsfromnon-GPCRs.ThemethodwascomparedwithseveralothermethodsasHMM-basedanddecisiontreesmethods.Varioussamplingschemeswereusedtopreparetrainingsetstoexamineifthesamplingschemeaffectstheperformanceoftheclassificationmethods.TheresultsshowedthataminoacidcompositionisasimplebutveryeffectivepropertyforidentifyingGPCRs.SVMwithaminoacidcompositionasinputvectorsappearedtobeapromisingmethodforproteinclassificationevenwhensequencesimilaritiesaretoolowtogeneratereliablemultiplealignmentsorwhenonlyshortpartialsequencesareavailable.ACKNOWLEDGEMENTS
IwanttothankDr.EtsukoMoriyamaforhercontinuousguidanceandsupportthroughoutthisthesis.IwouldalsoliketothankDr.StephenScottforadvisingmethroughoutthisthesisandtheM.S.programatCSE.ThankstoDr.JitenderDeogunforservingonmycommittee.I’dalsoliketothankYavuzF.Yavuzforallthehelphehasgivenmeinsystemsupport.ThanksalsotomyfriendsfromtheMoriyamalabforsharingideasandcreatingafunenvironmentforresearchatthelab.Ialsowanttothankmyfamilyfortheirendlessloveandsupport.Thisthesiswouldnothavebeenpossiblewithouttheencouragement,support,andpatiencefrommyhusband,CoryStrope.CoryalsoprovidedgreathelpwithLATEXandgnuplotforthisthesis.ivContents1Introduction12Background52.1Proteinfamiliesusedinthisstudy......................52.1.1G-proteincoupledreceptors(GPCRs)................52.1.2Bacteriorhodopsin..........................82.2ProteinClassificationMethods........................92.2.1ProfilehiddenMarkovmodel(HMM)................92.2.2Supportvectormachines(SVMs)..................142.2.3Discriminantfunctionanalysis....................20
3MaterialsandMethods233.1DataCollection................................233.1.1Datasources.............................233.1.2Trainingdata.............................253.1.3Testdata...............................323.2ProteinClassificationMethods........................343.2.1Profile-HMM.............................343.2.2SVMwithaminoacidfrequencies..................353.2.3SVM-pairwise............................373.2.4SVM-Fisher.............................383.2.5Decisiontrees.............................393.3PerformanceAnalysis.............................413.3.1Cross-validation...........................423.3.2Confusionmatrixandaccuracyrate.................423.3.3Minimumerrorpoint.........................433.3.4Maximumandmedianrateoffalsepositives............453.3.5Receiveroperatingcharacteristic...................45
4ResultsandDiscussion484.1IdentificationofClassAGPCRs.......................484.1.1Accuracyrates............................484.1.2Minimumerrorpointandfalsepositiverateanalysis........52