Application of Data mining Techniques in Education for Academic Prediction
- 格式:docx
- 大小:361.78 KB
- 文档页数:6
- disruption ,: Global convergence vs nationalSustainable - ,practices and dynamic capabilities in the food industry: A critical analysis of the literature5 Mesoscopic - simulation6 Firm size and sustainable performance in food -s: Insights from Greek SMEs7 An analytical method for cost analysis in multi-stage -s: A stochastic / model approach8 A Roadmap to Green - System through Enterprise Resource Planning (ERP) Implementation9 Unidirectional transshipment policies in a dual-channel -10 Decentralized and centralized model predictive control to reduce the bullwhip effect in - ,11 An agent-based distributed computational experiment framework for virtual - / development12 Biomass-to-bioenergy and biofuel - optimization: Overview, key issues and challenges13 The benefits of - visibility: A value assessment model14 An Institutional Theory perspective on sustainable practices across the dairy -15 Two-stage stochastic programming - model for biodiesel production via wastewater treatment16 Technology scale and -s in a secure, affordable and low carbon energy transition17 Multi-period design and planning of closed-loop -s with uncertain supply and demand18 Quality control in food - ,: An analytical model and case study of the adulterated milk incident in China19 - information capabilities and performance outcomes: An empirical study of Korean steel suppliers20 A game-based approach towards facilitating decision making for perishable products: An example of blood -21 - design under quality disruptions and tainted materials delivery22 A two-level replenishment frequency model for TOC - replenishment systems under capacity constraint23 - dynamics and the ―cross-border effect‖: The U.S.–Mexican border’s case24 Designing a new - for competition against an existing -25 Universal supplier selection via multi-dimensional auction mechanisms for two-way competition in oligopoly market of -26 Using TODIM to evaluate green - practices under uncertainty27 - downsizing under bankruptcy: A robust optimization approach28 Coordination mechanism for a deteriorating item in a two-level - system29 An accelerated Benders decomposition algorithm for sustainable - / design under uncertainty: A case study of medical needle and syringe -30 Bullwhip Effect Study in a Constrained -31 Two-echelon multiple-vehicle location–routing problem with time windows for optimization of sustainable - / of perishable food32 Research on pricing and coordination strategy of green - under hybrid production mode33 Agent-system co-development in - research: Propositions and demonstrative findings34 Tactical ,for coordinated -s35 Photovoltaic - coordination with strategic consumers in China36 Coordinating supplier׳s reorder point: A coordination mechanism for -s with long supplier lead time37 Assessment and optimization of forest biomass -s from economic, social and environmental perspectives – A review of literature38 The effects of a trust mechanism on a dynamic - /39 Economic and environmental assessment of reusable plastic containers: A food catering - case study40 Competitive pricing and ordering decisions in a multiple-channel -41 Pricing in a - for auction bidding under information asymmetry42 Dynamic analysis of feasibility in ethanol - for biofuel production in Mexico43 The impact of partial information sharing in a two-echelon -44 Choice of - governance: Self-managing or outsourcing?45 Joint production and delivery lot sizing for a make-to-order producer–buyer - with transportation cost46 Hybrid algorithm for a vendor managed inventory system in a two-echelon -47 Traceability in a food -: Safety and quality perspectives48 Transferring and sharing exchange-rate risk in a risk-averse - of a multinational firm49 Analyzing the impacts of carbon regulatory mechanisms on supplier and mode selection decisions: An application to a biofuel -50 Product quality and return policy in a - under risk aversion of a supplier51 Mining logistics data to assure the quality in a sustainable food -: A case in the red wine industry52 Biomass - optimisation for Organosolv-based biorefineries53 Exact solutions to the - equations for arbitrary, time-dependent demands54 Designing a sustainable closed-loop - / based on triple bottom line approach: A comparison of metaheuristics hybridization techniques55 A study of the LCA based biofuel - multi-objective optimization model with multi-conversion paths in China56 A hybrid two-stock inventory control model for a reverse -57 Dynamics of judicial service -s58 Optimizing an integrated vendor-managed inventory system for a single-vendor two-buyer - with determining weighting factor for vendor׳s ordering59 Measuring - Resilience Using a Deterministic Modeling Approach60 A LCA Based Biofuel - Analysis Framework61 A neo-institutional perspective of -s and energy security: Bioenergy in the UK62 Modified penalty function method for optimal social welfare of electric power - with transmission constraints63 Optimization of blood - with shortened shelf lives and ABO compatibility64 Diversified firms on dynamical - cope with financial crisis better65 Securitization of energy -s in China66 Optimal design of the auto parts - for JIT operations: Sequential bifurcation factor screening and multi-response surface methodology67 Achieving sustainable -s through energy justice68 - agility: Securing performance for Chinese manufacturers69 Energy price risk and the sustainability of demand side -s70 Strategic and tactical mathematical programming models within the crude oil - context - A review71 An analysis of the structural complexity of - /s72 Business process re-design methodology to support - integration73 Could - technology improve food operators’ innovativeness? A developing country’s perspective74 RFID-enabled process reengineering of closed-loop -s in the healthcare industry of Singapore75 Order-Up-To policies in Information Exchange -s76 Robust design and operations of hydrocarbon biofuel - integrating with existing petroleum refineries considering unit cost objective77 Trade-offs in - transparency: the case of Nudie Jeans78 Healthcare - operations: Why are doctors reluctant to consolidate?79 Impact on the optimal design of bioethanol -s by a new European Commission proposal80 Managerial research on the pharmaceutical - – A critical review and some insights for future directions81 - performance evaluation with data envelopment analysis and balanced scorecard approach82 Integrated - design for commodity chemicals production via woody biomass fast pyrolysis and upgrading83 Governance of sustainable -s in the fast fashion industry84 Temperature ,for the quality assurance of a perishable food -85 Modeling of biomass-to-energy - operations: Applications, challenges and research directions86 Assessing Risk Factors in Collaborative - with the Analytic Hierarchy Process (AHP)87 Random / models and sensitivity algorithms for the analysis of ordering time and inventory state in multi-stage -s88 Information sharing and collaborative behaviors in enabling - performance: A social exchange perspective89 The coordinating contracts for a fuzzy - with effort and price dependent demand90 Criticality analysis and the -: Leveraging representational assurance91 Economic model predictive control for inventory ,in -s92 - ,ontology from an ontology engineering perspective93 Surplus division and investment incentives in -s: A biform-game analysis94 Biofuels for road transport: Analysing evolving -s in Sweden from an energy security perspective95 - ,executives in corporate upper echelons Original Research Article96 Sustainable - ,in the fast fashion industry: An analysis of corporate reports97 An improved method for managing catastrophic - disruptions98 The equilibrium of closed-loop - super/ with time-dependent parameters99 A bi-objective stochastic programming model for a centralized green - with deteriorating products100 Simultaneous control of vehicle routing and inventory for dynamic inbound -101 Environmental impacts of roundwood - options in Michigan: life-cycle assessment of harvest and transport stages102 A recovery mechanism for a two echelon - system under supply disruption103 Challenges and Competitiveness Indicators for the Sustainable Development of the - in Food Industry104 Is doing more doing better? The relationship between responsible - ,and corporate reputation105 Connecting product design, process and - decisions to strengthen global - capabilities106 A computational study for common / design in multi-commodity -s107 Optimal production and procurement decisions in a - with an option contract and partial backordering under uncertainties108 Methods to optimise the design and ,of biomass-for-bioenergy -s: A review109 Reverse - coordination by revenue sharing contract: A case for the personal computers industry110 SCOlog: A logic-based approach to analysing - operation dynamics111 Removing the blinders: A literature review on the potential of nanoscale technologies for the ,of -s112 Transition inertia due to competition in -s with remanufacturing and recycling: A systems dynamics mode113 Optimal design of advanced drop-in hydrocarbon biofuel - integrating with existing petroleum refineries under uncertainty114 Revenue-sharing contracts across an extended -115 An integrated revenue sharing and quantity discounts contract for coordinating a - dealing with short life-cycle products116 Total JIT (T-JIT) and its impact on - competency and organizational performance117 Logistical - design for bioeconomy applications118 A note on ―Quality investment and inspection policy in a supplier-manufacturer -‖119 Developing a Resilient -120 Cyber - risk ,: Revolutionizing the strategic control of critical IT systems121 Defining value chain architectures: Linking strategic value creation to operational - design122 Aligning the sustainable - to green marketing needs: A case study123 Decision support and intelligent systems in the textile and apparel -: An academic review of research articles124 - ,capability of small and medium sized family businesses in India: A multiple case study approach125 - collaboration: Impact of success in long-term partnerships126 Collaboration capacity for sustainable - ,: small and medium-sized enterprises in Mexico127 Advanced traceability system in aquaculture -128 - information systems strategy: Impacts on - performance and firm performance129 Performance of - collaboration – A simulation study130 Coordinating a three-level - with delay in payments and a discounted interest rate131 An integrated framework for agent basedinventory–production–transportation modeling and distributed simulation of -s132 Optimal - design and ,over a multi-period horizon under demand uncertainty. Part I: MINLP and MILP models133 The impact of knowledge transfer and complexity on - flexibility: A knowledge-based view134 An innovative - performance measurement system incorporating Research and Development (R&D) and marketing policy135 Robust decision making for hybrid process - systems via model predictive control136 Combined pricing and - operations under price-dependent stochastic demand137 Balancing - competitiveness and robustness through ―virtual dual sourcing‖: Lessons from the Great East Japan Earthquake138 Solving a tri-objective - problem with modified NSGA-II algorithm 139 Sustaining long-term - partnerships using price-only contracts 140 On the impact of advertising initiatives in -s141 A typology of the situations of cooperation in -s142 A structured analysis of operations and - ,research in healthcare (1982–2011143 - practice and information quality: A - strategy study144 Manufacturer's pricing strategy in a two-level - with competing retailers and advertising cost dependent demand145 Closed-loop - / design under a fuzzy environment146 Timing and eco(nomic) efficiency of climate-friendly investments in -s147 Post-seismic - risk ,: A system dynamics disruption analysis approach for inventory and logistics planning148 The relationship between legitimacy, reputation, sustainability and branding for companies and their -s149 Linking - configuration to - perfrmance: A discrete event simulation model150 An integrated multi-objective model for allocating the limited sources in a multiple multi-stage lean -151 Price and leadtime competition, and coordination for make-to-order -s152 A model of resilient - / design: A two-stage programming with fuzzy shortest path153 Lead time variation control using reliable shipment equipment: An incentive scheme for - coordination154 Interpreting - dynamics: A quasi-chaos perspective155 A production-inventory model for a two-echelon - when demand is dependent on sales teams׳ initiatives156 Coordinating a dual-channel - with risk-averse under a two-way revenue sharing contract157 Energy supply planning and - optimization under uncertainty158 A hierarchical model of the impact of RFID practices on retail - performance159 An optimal solution to a three echelon - / with multi-product and multi-period160 A multi-echelon - model for municipal solid waste ,system 161 A multi-objective approach to - visibility and risk162 An integrated - model with errors in quality inspection and learning in production163 A fuzzy AHP-TOPSIS framework for ranking the solutions of Knowledge ,adoption in - to overcome its barriers164 A relational study of - agility, competitiveness and business performance in the oil and gas industry165 Cyber - security practices DNA – Filling in the puzzle using a diverse set of disciplines166 A three layer - model with multiple suppliers, manufacturers and retailers for multiple items167 Innovations in low input and organic dairy -s—What is acceptable in Europe168 Risk Variables in Wind Power -169 An analysis of - strategies in the regenerative medicine industry—Implications for future development170 A note on - coordination for joint determination of order quantity and reorder point using a credit option171 Implementation of a responsive - strategy in global complexity: The case of manufacturing firms172 - scheduling at the manufacturer to minimize inventory holding and delivery costs173 GBOM-oriented ,of production disruption risk and optimization of - construction175 Alliance or no alliance—Bargaining power in competing reverse -s174 Climate change risks and adaptation options across Australian seafood -s – A preliminary assessment176 Designing contracts for a closed-loop - under information asymmetry 177 Chemical - modeling for analysis of homeland security178 Chain liability in multitier -s? Responsibility attributions for unsustainable supplier behavior179 Quantifying the efficiency of price-only contracts in push -s over demand distributions of known supports180 Closed-loop - / design: A financial approach181 An integrated - / design problem for bidirectional flows182 Integrating multimodal transport into cellulosic biofuel - design under feedstock seasonality with a case study based on California183 - dynamic configuration as a result of new product development184 A genetic algorithm for optimizing defective goods - costs using JIT logistics and each-cycle lengths185 A - / design model for biomass co-firing in coal-fired power plants 186 Finance sourcing in a -187 Data quality for data science, predictive analytics, and big data in - ,: An introduction to the problem and suggestions for research and applications188 Consumer returns in a decentralized -189 Cost-based pricing model with value-added tax and corporate income tax for a - /190 A hard nut to crack! Implementing - sustainability in an emerging economy191 Optimal location of spelling yards for the northern Australian beef -192 Coordination of a socially responsible - using revenue sharing contract193 Multi-criteria decision making based on trust and reputation in -194 Hydrogen - architecture for bottom-up energy systems models. Part 1: Developing pathways195 Financialization across the Pacific: Manufacturing cost ratios, -s and power196 Integrating deterioration and lifetime constraints in production and - planning: A survey197 Joint economic lot sizing problem for a three—Layer - with stochastic demand198 Mean-risk analysis of radio frequency identification technology in - with inventory misplacement: Risk-sharing and coordination199 Dynamic impact on global -s performance of disruptions propagation produced by terrorist acts。

Beyond Reason CodesA Blueprint for Human-Centered,Low-Risk AutoML H2O.ai Machine Learning Interpretability TeamH2O.aiMarch21,2019ContentsBlueprintEDABenchmarkTrainingPost-Hoc AnalysisReviewDeploymentAppealIterateQuestionsBlueprintThis mid-level technical document provides a basic blueprint for combining the best of AutoML,regulation-compliant predictive modeling,and machine learning research in the sub-disciplines of fairness,interpretable models,post-hoc explanations,privacy and security to create a low-risk,human-centered machine learning framework.Look for compliance mode in Driverless AI soon.∗Guidance from leading researchers and practitioners.Blueprint†EDA and Data VisualizationKnow thy data.Automation implemented inDriverless AI as AutoViz.OSS:H2O-3AggregatorReferences:Visualizing Big DataOutliers through DistributedAggregation;The Grammar ofGraphicsEstablish BenchmarksEstablishing a benchmark from which to gauge improvements in accuracy,fairness, interpretability or privacy is crucial for good(“data”)science and for compliance.Manual,Private,Sparse or Straightforward Feature EngineeringAutomation implemented inDriverless AI as high-interpretabilitytransformers.OSS:Pandas Profiler,Feature ToolsReferences:Deep Feature Synthesis:Towards Automating Data ScienceEndeavors;Label,Segment,Featurize:A Cross Domain Framework forPrediction EngineeringPreprocessing for Fairness,Privacy or SecurityOSS:IBM AI360References:Data PreprocessingTechniques for Classification WithoutDiscrimination;Certifying andRemoving Disparate Impact;Optimized Pre-processing forDiscrimination Prevention;Privacy-Preserving Data MiningRoadmap items for H2O.ai MLI.Constrained,Fair,Interpretable,Private or Simple ModelsAutomation implemented inDriverless AI as GLM,RuleFit,Monotonic GBM.References:Locally InterpretableModels and Effects Based onSupervised Partitioning(LIME-SUP);Explainable Neural Networks Based onAdditive Index Models(XNN);Scalable Bayesian Rule Lists(SBRL)LIME-SUP,SBRL,XNN areroadmap items for H2O.ai MLI.Traditional Model Assessment and DiagnosticsResidual analysis,Q-Q plots,AUC andlift curves confirm model is accurateand meets assumption criteria.Implemented as model diagnostics inDriverless AI.Post-hoc ExplanationsLIME,Tree SHAP implemented inDriverless AI.OSS:lime,shapReferences:Why Should I Trust You?:Explaining the Predictions of AnyClassifier;A Unified Approach toInterpreting Model Predictions;PleaseStop Explaining Black Box Models forHigh Stakes Decisions(criticism)Tree SHAP is roadmap for H2O-3;Explanations for unstructured data areroadmap for H2O.ai MLI.Interlude:The Time–Tested Shapley Value1.In the beginning:A Value for N-Person Games,19532.Nobel-worthy contributions:The Shapley Value:Essays in Honor of Lloyd S.Shapley,19883.Shapley regression:Analysis of Regression in Game Theory Approach,20014.First reference in ML?Fair Attribution of Functional Contribution in Artificialand Biological Networks,20045.Into the ML research mainstream,i.e.JMLR:An Efficient Explanation ofIndividual Classifications Using Game Theory,20106.Into the real-world data mining workflow...finally:Consistent IndividualizedFeature Attribution for Tree Ensembles,20177.Unification:A Unified Approach to Interpreting Model Predictions,2017Model Debugging for Accuracy,Privacy or SecurityEliminating errors in model predictions bytesting:adversarial examples,explanation ofresiduals,random attacks and“what-if”analysis.OSS:cleverhans,pdpbox,what-if toolReferences:Modeltracker:RedesigningPerformance Analysis Tools for MachineLearning;A Marauder’s Map of Security andPrivacy in Machine Learning:An overview ofcurrent and future research directions formaking machine learning secure and privateAdversarial examples,explanation ofresiduals,measures of epistemic uncertainty,“what-if”analysis are roadmap items inH2O.ai MLI.Post-hoc Disparate Impact Assessment and RemediationDisparate impact analysis can beperformed manually using Driverless AIor H2O-3.OSS:aequitas,IBM AI360,themisReferences:Equality of Opportunity inSupervised Learning;Certifying andRemoving Disparate ImpactDisparate impact analysis andremediation are roadmap items forH2O.ai MLI.Human Review and DocumentationAutomation implemented as AutoDocin Driverless AI.Various fairness,interpretabilityand model debugging roadmapitems to be added to AutoDoc.Documentation of consideredalternative approaches typicallynecessary for compliance.Deployment,Management and MonitoringMonitor models for accuracy,disparateimpact,privacy violations or securityvulnerabilities in real-time;track modeland data lineage.OSS:mlflow,modeldb,awesome-machine-learning-opsmetalistReference:Model DB:A System forMachine Learning Model ManagementBroader roadmap item for H2O.ai.Human AppealVery important,may require custom implementation for each deployment environment?Iterate:Use Gained Knowledge to Improve Accuracy,Fairness, Interpretability,Privacy or SecurityImprovements,KPIs should not be restricted to accuracy alone.Open Conceptual QuestionsHow much automation is appropriate,100%?How to automate learning by iteration,reinforcement learning?How to implement human appeals,is it productizable?ReferencesThis presentation:https:///navdeep-G/gtc-2019/blob/master/main.pdfDriverless AI API Interpretability Technique Examples:https:///h2oai/driverlessai-tutorials/tree/master/interpretable_ml In-Depth Open Source Interpretability Technique Examples:https:///jphall663/interpretable_machine_learning_with_python https:///navdeep-G/interpretable-ml"Awesome"Machine Learning Interpretability Resource List:https:///jphall663/awesome-machine-learning-interpretabilityAgrawal,Rakesh and Ramakrishnan Srikant(2000).“Privacy-Preserving Data Mining.”In:ACM Sigmod Record.Vol.29.2.URL:/cs/projects/iis/hdb/Publications/papers/sigmod00_privacy.pdf.ACM,pp.439–450.Amershi,Saleema et al.(2015).“Modeltracker:Redesigning Performance Analysis Tools for Machine Learning.”In:Proceedings of the33rd Annual ACM Conference on Human Factors in Computing Systems.URL: https:///en-us/research/wp-content/uploads/2016/02/amershi.CHI2015.ModelTracker.pdf.ACM,pp.337–346.Calmon,Flavio et al.(2017).“Optimized Pre-processing for Discrimination Prevention.”In:Advances in Neural Information Processing Systems.URL:/paper/6988-optimized-pre-processing-for-discrimination-prevention.pdf,pp.3992–4001.Feldman,Michael et al.(2015).“Certifying and Removing Disparate Impact.”In:Proceedings of the21th ACM SIGKDD International Conference on Knowledge Discovery and Data Mining.URL:https:///pdf/1412.3756.pdf.ACM,pp.259–268.Hardt,Moritz,Eric Price,Nati Srebro,et al.(2016).“Equality of Opportunity in Supervised Learning.”In: Advances in neural information processing systems.URL:/paper/6374-equality-of-opportunity-in-supervised-learning.pdf,pp.3315–3323.Hu,Linwei et al.(2018).“Locally Interpretable Models and Effects Based on Supervised Partitioning (LIME-SUP).”In:arXiv preprint arXiv:1806.00663.URL:https:///ftp/arxiv/papers/1806/1806.00663.pdf.Kamiran,Faisal and Toon Calders(2012).“Data Preprocessing Techniques for Classification Without Discrimination.”In:Knowledge and Information Systems33.1.URL:https:///content/pdf/10.1007/s10115-011-0463-8.pdf,pp.1–33.Kanter,James Max,Owen Gillespie,and Kalyan Veeramachaneni(2016).“Label,Segment,Featurize:A Cross Domain Framework for Prediction Engineering.”In:Data Science and Advanced Analytics(DSAA),2016 IEEE International Conference on.URL:/static/papers/DSAA_LSF_2016.pdf.IEEE,pp.430–439.Kanter,James Max and Kalyan Veeramachaneni(2015).“Deep Feature Synthesis:Towards Automating Data Science Endeavors.”In:Data Science and Advanced Analytics(DSAA),2015.366782015.IEEEInternational Conference on.URL:https:///EVO-DesignOpt/groupWebSite/uploads/Site/DSAA_DSM_2015.pdf.IEEE,pp.1–10.Keinan,Alon et al.(2004).“Fair Attribution of Functional Contribution in Artificial and Biological Networks.”In:Neural Computation16.9.URL:https:///profile/Isaac_Meilijson/publication/2474580_Fair_Attribution_of_Functional_Contribution_in_Artificial_and_Biological_Networks/links/09e415146df8289373000000/Fair-Attribution-of-Functional-Contribution-in-Artificial-and-Biological-Networks.pdf,pp.1887–1915.Kononenko,Igor et al.(2010).“An Efficient Explanation of Individual Classifications Using Game Theory.”In: Journal of Machine Learning Research11.Jan.URL:/papers/volume11/strumbelj10a/strumbelj10a.pdf,pp.1–18.Lipovetsky,Stan and Michael Conklin(2001).“Analysis of Regression in Game Theory Approach.”In:Applied Stochastic Models in Business and Industry17.4,pp.319–330.Lundberg,Scott M.,Gabriel G.Erion,and Su-In Lee(2017).“Consistent Individualized Feature Attribution for Tree Ensembles.”In:Proceedings of the2017ICML Workshop on Human Interpretability in Machine Learning(WHI2017).Ed.by Been Kim et al.URL:https:///pdf?id=ByTKSo-m-.ICML WHI2017,pp.15–21.Lundberg,Scott M and Su-In Lee(2017).“A Unified Approach to Interpreting Model Predictions.”In: Advances in Neural Information Processing Systems30.Ed.by I.Guyon et al.URL:/paper/7062-a-unified-approach-to-interpreting-model-predictions.pdf.Curran Associates,Inc.,pp.4765–4774.Papernot,Nicolas(2018).“A Marauder’s Map of Security and Privacy in Machine Learning:An overview of current and future research directions for making machine learning secure and private.”In:Proceedings of the11th ACM Workshop on Artificial Intelligence and Security.URL:https:///pdf/1811.01134.pdf.ACM.Ribeiro,Marco Tulio,Sameer Singh,and Carlos Guestrin(2016).“Why Should I Trust You?:Explaining the Predictions of Any Classifier.”In:Proceedings of the22nd ACM SIGKDD International Conference on Knowledge Discovery and Data Mining.URL:/kdd2016/papers/files/rfp0573-ribeiroA.pdf.ACM,pp.1135–1144.Rudin,Cynthia(2018).“Please Stop Explaining Black Box Models for High Stakes Decisions.”In:arXiv preprint arXiv:1811.10154.URL:https:///pdf/1811.10154.pdf.Shapley,Lloyd S(1953).“A Value for N-Person Games.”In:Contributions to the Theory of Games2.28.URL: http://www.library.fa.ru/files/Roth2.pdf#page=39,pp.307–317.Shapley,Lloyd S,Alvin E Roth,et al.(1988).The Shapley Value:Essays in Honor of Lloyd S.Shapley.URL: http://www.library.fa.ru/files/Roth2.pdf.Cambridge University Press.Vartak,Manasi et al.(2016).“Model DB:A System for Machine Learning Model Management.”In: Proceedings of the Workshop on Human-In-the-Loop Data Analytics.URL:https:///~matei/papers/2016/hilda_modeldb.pdf.ACM,p.14.Vaughan,Joel et al.(2018).“Explainable Neural Networks Based on Additive Index Models.”In:arXiv preprint arXiv:1806.01933.URL:https:///pdf/1806.01933.pdf.Wilkinson,Leland(2006).The Grammar of Graphics.—(2018).“Visualizing Big Data Outliers through Distributed Aggregation.”In:IEEE Transactions on Visualization&Computer Graphics.URL:https:///~wilkinson/Publications/outliers.pdf.Yang,Hongyu,Cynthia Rudin,and Margo Seltzer(2017).“Scalable Bayesian Rule Lists.”In:Proceedings of the34th International Conference on Machine Learning(ICML).URL:https:///pdf/1602.08610.pdf.。
推荐课程英语作文范文Title: Recommended Courses at Your Institution: A Journey of Intellectual Exploration Embarking on the exciting journey of higher education is a pivotal moment in any individual's life. Choosing the right courses can significantly shape one's academic pursuits, personal interests, and future career paths. At our esteemed institution, we offer a diverse array of courses that cater to diverse interests and aspirations. In this essay, I would like to highlight three particularly captivating courses that I wholeheartedly recommend to our students and prospective learners.1. "Interdisciplinary Approaches to Sustainability"In an era where environmental concerns are paramount, "Interdisciplinary Approaches to Sustainability" stands out as a thought-provoking and timely course. This course delves into the complexities of sustainability from multiple perspectives, blending insights from disciplines such as environmental science, economics, sociology, and policy studies. Students will engage in discussions on renewable energy, climate change, eco-friendly practices, and sustainable development goals. Through lectures, case studies, and hands-on projects, participants will gain a holistic understanding of the challenges facing our planet and explore innovative solutions to promote a greener future.2. "Data Science and Big Data Analytics"With the explosion of data in the digital age, "Data Science and Big Data Analytics" has become an indispensable course for those interested in harnessing the power of information. This course provides a comprehensive introduction to the tools and techniques used in data mining, processing, and analysis. Students will learn programming languages like Python and R, along with statistical modeling, machine learning algorithms, and data visualization techniques. Through practical projects and real-world case studies, learners will develop the skills necessary to extract insights from vast amounts of data, empowering them to make informed decisions and drive business growth in various industries.3. "Creative Writing Workshop"For those passionate about expressing themselves through the written word, the "Creative Writing Workshop" offers a nurturing environment where imagination thrives. This course focuses on developing students' creative writing skills, covering genres such as fiction, poetry, and creative nonfiction. Through workshops, peer critiques, and individual consultations with experienced instructors, students will refine their storytelling abilities, experiment with different literary forms, and explore the depths of their own creativity. The emphasis is on fostering a love for writing, encouraging students to find their unique voice and share their stories with the world. ConclusionThese three courses represent just a fraction of the vast array of academic offerings at our institution. Each one offers a unique and enriching experience, challenging students to think critically, innovate, and express themselves. Whether you're interested in tackling pressing global issues, mastering the art of data analysis, or nurturing your creative spirit, our courses are designed to inspire, educate, and empower you to make a meaningful impact in the world. As you embark on your academic journey, I encourage you to explore these and other courses with an open mind and a thirst for knowledge.。

基于大数据的用户行为分析与预测研究(英文中文双语版优质文档)I. IntroductionWith the development of Internet technology, people are increasingly inseparable from the Internet, and more and more information is recorded, which is called big data. The mining and analysis of big data is crucial to the decision-making and development of enterprises, and user behavior data is a very important part of it. User behavior data refers to various data generated by users when using products or services, including user access records, click records, purchase records, etc. These data reflect users' needs, interests, and behavioral habits for products or services. Said that these data can be used for user behavior analysis and prediction.2. User Behavior AnalysisUser behavior analysis is to obtain the rules and trends of user behavior through statistics, analysis and mining of user behavior data, so as to provide a basis for enterprise decision-making. User behavior analysis mainly includes the following aspects:1. User interest analysisUser interest analysis refers to the analysis of user behavior data to understand the user's points of interest, so as to recommend personalized products or services for enterprises. Specifically, by analyzing the user's search records, purchase records, browsing records, etc., the user's points of interest and preferences can be obtained, and products or services that better meet the user's needs can be recommended for enterprises.2. User behavior path analysisUser behavior path analysis refers to the analysis of user behavior data to understand the behavior path of users when using products or services, so as to provide better products or services for enterprises. Specifically, by analyzing the user's click records, browsing records, and purchase records in products or services, we can understand the user's behavior path and provide a basis for companies to improve products or services.3. User churn analysisUser churn analysis refers to the analysis of user behavior data to understand the reasons for user churn when using products or services, so as to provide enterprises with directions for improvement. Specifically, through the analysis of users' usage records, access records, evaluation records, etc. in products or services, we can understand the reasons for user loss and provide companies with improvement plans.3. User Behavior PredictionUser behavior prediction refers to the analysis and mining of user behavior data to obtain the future behavior trend of users, so as to provide decision-making basis for enterprises. User behavior prediction mainly includes the following aspects:1. User purchase predictionUser purchase prediction refers to the analysis and mining of behavior data such as user purchase records and browsing records to obtain the user's future purchase trends, so as to formulate better marketing strategies for enterprises. Specifically, by analyzing users' browsing records, click records, purchase records, etc. in products or services, we can understand users' purchasing preferences, purchasing power, purchasing cycle, etc., and provide personalized recommendations and marketing solutions for enterprises.2. User Churn PredictionUser churn prediction refers to the analysis and mining of user behavior data to obtain the trend and reasons for possible user loss in the future, so as to provide preventive measures for enterprises. Specifically, by analyzing the user's usage records, access records, evaluation records, etc. in products or services, we can understand the user's usage habits, satisfaction, etc., and provide personalized services and improvement plans for enterprises.3. User Conversion PredictionUser conversion prediction refers to the analysis and mining of user behavior data to obtain possible conversion trends of users in the future, so as to provide better conversion strategies for enterprises. Specifically, by analyzing users' usage records, browsing records, and click records in products or services, we can understand users' points of interest, conversion intentions, etc., and provide personalized conversion recommendations and services for enterprises.4. Application of Big Data Technology in User Behavior Analysis and PredictionBig data technology is the key to user behavior analysis and prediction. Big data technology can obtain the rules and trends of user behavior through the rapid processing and analysis of massive data, and improve the accuracy and efficiency of user behavior analysis and prediction. Big data technology mainly includes the following aspects:1. Data collectionData acquisition is the first step in big data analysis. Data collection needs to collect various behavioral data generated by users when using products or services, including user access records, click records, purchase records, etc. Data collection can be achieved through various channels, including websites, apps, social media, etc.2. Data storageData storage is an important part of big data analysis. Big data analysis needs to process massive amounts of data, so it needs to store massive amounts of data. Data storage can be implemented in various ways, including relational databases, NoSQL databases, distributed file systems, etc.3. Data cleaningData cleaning is a necessary step in big data analysis. Data cleaning requires deduplication, screening, conversion and other processing of the collected data to ensure the quality and accuracy of the data. Data cleaning can be achieved using various techniques, including ETL tools, data mining tools, etc.4. Data analysisData analysis is the core of big data technology. Data analysis requires statistics, analysis, mining and other processing of the collected data, so as to obtain the rules and trends of user behavior. Data analysis can be achieved using various techniques, including data mining, machine learning, deep learning, etc.5. Visual AnalysisVisual analysis is an important means of big data analysis. Visual analysis can present the analysis results in the form of charts, graphs, etc., and intuitively display the results of data analysis. Visual analysis can be implemented using various tools, including Tableau, Power BI, etc.6. Model buildingModel building is an important part of big data analysis. Model building needs to establish a model based on the collected data and analysis results, verify and optimize it, so as to obtain the prediction results of user behavior. Model building can be achieved using various techniques, including regression analysis, decision trees, neural networks, etc.In short, big data technology has played an important role in user behavior analysis and prediction, providing enterprises with more accurate and finer data analysis and prediction capabilities, thereby helping enterprises better understand user needs, optimize services, improve user experience and Market Competitiveness.一、引言随着互联网技术的发展,人们越来越离不开网络,越来越多的信息被记录下来,这些数据被称为大数据。

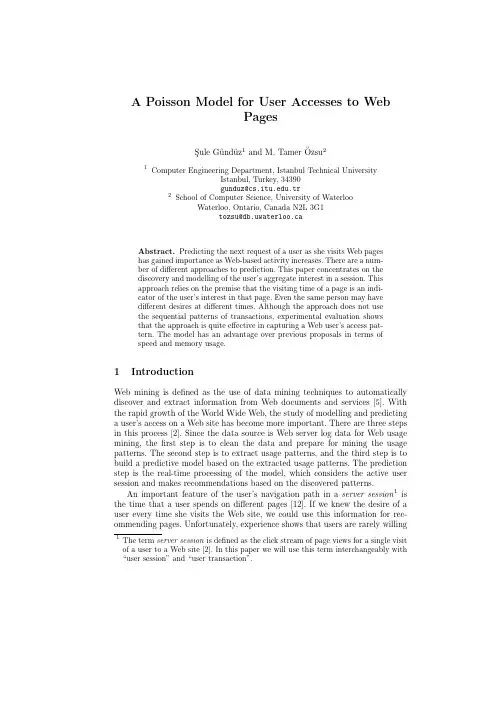
A Poisson Model for User Accesses to WebPagesS¸ule G¨u nd¨u z1and M.Tamer¨Ozsu21Computer Engineering Department,Istanbul Technical UniversityIstanbul,Turkey,34390gunduz@.tr2School of Computer Science,University of WaterlooWaterloo,Ontario,Canada N2L3G1tozsu@db.uwaterloo.caAbstract.Predicting the next request of a user as she visits Web pageshas gained importance as Web-based activity increases.There are a num-ber of different approaches to prediction.This paper concentrates on thediscovery and modelling of the user’s aggregate interest in a session.Thisapproach relies on the premise that the visiting time of a page is an indi-cator of the user’s interest in that page.Even the same person may havedifferent desires at different times.Although the approach does not usethe sequential patterns of transactions,experimental evaluation showsthat the approach is quite effective in capturing a Web user’s access pat-tern.The model has an advantage over previous proposals in terms ofspeed and memory usage.1IntroductionWeb mining is defined as the use of data mining techniques to automatically discover and extract information from Web documents and services[5].With the rapid growth of the World Wide Web,the study of modelling and predicting a user’s access on a Web site has become more important.There are three steps in this process[2].Since the data source is Web server log data for Web usage mining,thefirst step is to clean the data and prepare for mining the usage patterns.The second step is to extract usage patterns,and the third step is to build a predictive model based on the extracted usage patterns.The prediction step is the real-time processing of the model,which considers the active user session and makes recommendations based on the discovered patterns.An important feature of the user’s navigation path in a server session1is the time that a user spends on different pages[12].If we knew the desire of a user every time she visits the Web site,we could use this information for rec-ommending pages.Unfortunately,experience shows that users are rarely willing 1The term server session is defined as the click stream of page views for a single visit of a user to a Web site[2].In this paper we will use this term interchangeably with “user session”and“user transaction”.to give explicit feedback.Thus,the time spent on a page is a good measure of the user’s interest in that page,providing an implicit rating for that page.If a user is interested in the content of a page,she will likely spend more time there compared to the other pages in her session.However,the representation of page visit time is important.If the representation is not appropriate for the model, the prediction accuracy will decrease.In[3]we proposed a new model that uses only the visiting time and visiting frequencies of pages without considering the access order of page requests in user sessions.Our experiments showed that Poisson distribution can be used to model user behavior during a single visit to a Web site.In that paper we examine the effect of several representation methods of time that a user spent on each page during her visit.In our previous work we employed a model-based clustering approach and partitioned user sessions according to the similar amount of time spent on similar pages.In this paper,we present a key extension to the represen-tation of user transactions that improves the resulting accuracy for predicting the next request of a Web user.To confirm ourfindings,the results are compared to the results of two other well known recommendation techniques.The rest of the paper is organized as follows.Section2briefly reviews the work related to model based clustering.Section3presents the proposed model. Section4provides detailed experimental results.In Section5,we examine related work.Finally,in Section6we conclude our work.2Model-Based Cluster AnalysisIn this section,wefirst describe the mixture model for clustering objects and then describe how the parameters of the clusters are derived in the context of the mixture model.Model-based clustering methods optimize thefit between the given data and some mathematical model.Such methods are often based on the assumption that the data are generated by a mixture of underlying probability distributions, defined by a set of parameters,denotedΘ[6].An observation x i in a data set of K observations,D={x1,...,x K},is generated by a mixture of G components as follows:p(x i|Θ)=Gg=1p(c g|Θ)p(x i|c g,Θg)=G g=1τg p(x i|c g,Θg)(1)whereΘg(g∈[1...G])is a vector specifying the probability distribution function (pdf)of the g th component,c g,and G g=1p(c g|Θ)= G g=1τg=1.Statisticians refer to such a model as mixture model with G components.The maximum likelihood(ML estimation)approach maximizes the log likelihood of the training data in order to learn the model parameters:L(Θ1,...,ΘG;τ1,...,τG|D)=Ki=1ln G g=1τg p(x i|c g,Θg) (2)3Web Page Recommendation ModelIn this research,we use three sets of server logs.Thefirst one is from the NASA Kennedy Space Center server over the months of July and August1995[8].The second log is from ClarkNet()Web server which is a full Internet access provider for the Metro Baltimore-Washington DC area[7].This server log was collected over the months of August and September,1995.The last server log is from the Web server at the University of Saskatchewan(UOS)from June to December,1995[11].For each log data set we apply the same pre-processing steps.Since the cleaning procedure is beyond the scope of this paper,the details of this procedure are not given here.In this work,visiting page times2,which are extracted during pre-processing step,are represented by four different normalization values in order to evaluate the effect of time to the prediction accuracy.The visiting times are normalized across the visiting times of the pages in the same session,such that the minimum value of normalized time is1.We try4different maximum values:2,3,5and10. If a page is not in the user session,then the value of corresponding normalized time is set to0.This normalization captures the relative importance of a page to a user in a transaction.The aggregate interest of a user in a transaction is then defined by a vector which consists of the normalized visiting times of that transaction.The details of this step is given in[3].Our previous work has presented a new model that uses only the visiting time and visiting frequencies of pages.The resulting model has lower run-time computation and memory requirements,while providing predictions that are at least as precise as previous proposals[3].The key idea behind this work is that user sessions can be clustered according to the similar amount of time that is spent on similar pages within a session without considering the access order of page requests.In particular,we model user sessions in log data as being generated in the following manner:(i)When a user arrives to the Web site, his or her current session is assigned to one of the clusters,(ii)the behavior of that user in this session,in terms of visiting time,is then generated from a Poisson model of visiting times of that cluster.Since we do not have the actual cluster assignments,we use a standard learning algorithm,the Expectation-Maximization(EM)[4],to learn the cluster assignments of transactions as well as the parameters of each Poisson distribution.The resulting clusters consist of transactions in which users have similar interests and each cluster has its own parameters representing these interests.Our objective in this paper is to assess the effectiveness of non-sequentially ordered pages and the representation methods of normalized time values in predicting navigation patterns.In order to obtain a set of pages for recommending and rank these pages in this set,recommendation scores are calculated for every page in each cluster using the Poisson parameters of that cluster.The cluster parameters of a cluster c g are then in the form:pc g={τg;(rs g1,...,rs gn)}2It is defined as the time difference between consecutive page requests.whereτg is the probability of selecting the cluster c g and rs gj,j=[1...n]is the recommendation score of cluster c g at dimension3j.Those are the only parame-ters that the system needs in order to produce a set of pages for recommendation. We define the number of parameters stored in the memory as model size.It is clear that the smaller the model size the faster the online prediction.We usefive different methods for calculating recommendation scores for every page.The recommendation scores are then normalized such that the maximum score has a value of1.These methods can be briefly summarized as follows: For thefirst method,we only use the Poisson parameters of the active cluster as recommendation scores.In the second method we use only the popularity of each page,which we define as the ratio of the number of the requests of a page in a cluster to the total number of page requests in that cluster.The intuition behind this is to recommend pages that are most likely visited in a cluster.For the third method,we calculate recommendation scores by multiplying the popularity by the Poisson parameter.For the last two methods we take advantage of a technique used in decision theory called the entropy.We calculate the entropy for each page using the relative frequency of each of the ten possible values of normalized times.A low entropy value means that the visiting time of that page mostly has one of the normalized values.High entropy value,on the other hand,indicates wide divergence in page visiting times among transactions.We calculate the recommendation scores of the fourth method by multiplying the inverse of entropy by popularity and Poisson parameters.For the last calculation, the log of the popularity is taken in order to decrease the effect of the popularity in recommendation score and is multiplied by the inverse of entropy and Poisson parameters.The real-time component of the model calculates cluster posterior probability P(c g|w)for every cluster c g∈C={c1,...,c G}where w is the portion of a transaction in test set that is used tofind the most similar cluster.The active transaction is assigned to the cluster that has the highest probability.We define this cluster as the active cluster.A recommendation set,which is the set of predicted pages by the model,is then produced ranking the recommendation scores of active cluster in descending order.4Experimental ResultsIn this research we use three different transaction sets prepared for experiments as mentioned in Section3.We measure the performance of our technique using the proposed methods for calculating recommendation scores.Approximately 30%of these cleaned transactions are randomly selected as the test set,and the remaining part as the training set.The experiments are repeated with different number of clusters and with different initial parameters for EM algorithm.We define the following metrics to evaluate our method:Hit-Ratio Given the visiting time of a page in the current transaction,the model recommends three pages that have the highest recommendation score 3Each page in the Web site corresponds a dimension in the modelin the active cluster.A hit is declared if any one of the three recommended pages is the next request of the user.The hit-ratio is the number of hits divided by the total number of recommendations made by the system. Precision For each transaction t in the test set we select thefirst w requests in t.These w requests are used to calculate the active cluster and produce the recommendation set.The recommendation set contains all the pages that have a recommendation score greater than the thresholdξand that are not in thefirst w requests.We denote this set as P S(w,ξ)and the number of pages in this set that match with the remaining part of active transaction as m.Then the precision for a transaction is defined as:precision(t)=m|P S(w,ξ)|(3)In our experiments,we try different values for the threshold,ξ,of recommenda-tion scores ranging from0.1to0.9.If the threshold is high then fewer recom-mendation are produced.If it is small then irrelevant pages are recommended with a low recommendation score.Our experiments show that settingξto0.5 and w to2produces few but highly relevant recommendations.We perform the experiments with different number of clusters changing from4to30.These ex-periments show that normalizing time between1and2improves the prediction accuracy.Due to lack of space,we just present the results of the experiments in which the normalized time has a value between1and2.We identify that the values for the number of clusters in Table1are best among the other values we consider if page time is normalized between1and2.For these numbers we have a higher log likelihood for the training sets as well as a better prediction accu-racy for the test sets.The increase of the log likelihood means that the modelfit better to the data.Figure1(a)presents the prediction accuracy of the model for different number of clusters where time is normalized between1and2.Figure 1(b)presents the prediction accuracy for different normalization values of time. As can be seen from Figure1(a),the model is insensitive to the number of clus-ters in a reasonable range around the best numbers of clusters.The remarkable changes in the number of clusters results in a decrease of the performance of the model.Data Set No.Of Method1Method2Method3Method4Method5Clusters H-R Pre.H-R Pre.H-R Pre.H-R Pre.H-R Pre.NASA3051.534.451.334.7523551.133.847.533.81048.737.949.237.649.638.248.235.446.632.9UOS3050.840.650.640.750.840.750.539.350.138.7Table1.Results(in%)of the model.Visiting time is normalized between1and2.As mentioned in the previous section,we use5different methods for cal-culating recommendation scores.The application of methods that calculate the(a)Number of Clusters-Accuracy(b)Normalization values-AccuracyFig.1.Impacts of number of clusters and normalization values on prediction accuracy recommendation scores using popularity term results in marked improvement of the prediction accuracy.This is not surprising,because the popularity represents the common interest among transactions in each cluster.The results show that using entropy during calculation of recommendation score does not improve the accuracy.This is not surprising for the experiments where page time is normal-ized in a narrow range.However,even for a wide change in normalized time the entropy does not improve the prediction accuracy.This may be due to the fact that the popularity of some pages in most of the clusters are zero due to the sparse and scattered nature of the data.Thus,we can not calculate entropy values for most of the pages in a cluster.All of our experiments show that in general we can use method3for calculating recommendation scores discarding the metric we use for evaluation.Data Set Poisson Model Model1Model2NASA52447.8449.61549.3UOS50.8544.59parison of recommendation models.For evaluating the effect of the Poisson model,we repeated the experiments with the same training and test sets using two other recommendation methods[9, 10].The recommendation model proposed in[10](Model1in Table2)is com-parable to our model in terms of speed and memory usage.Since the hit-ratio metric has not performed well for the model in[10],we use the precision metric for evaluation.The data set has a precision of15%,whereas the NASA data set has4%and the UOS has5%.Since the model in[9]is based on asso-ciation rule discovery,it has obviously a greater model size than our model.We select this model in order to compare our results to the results of a model that uses a different approach.For the method in[9](Model2in Table2)we usea sliding window with a window size2.The sliding window is the last portion of the active user session to produce the recommendation set.Thus,the model is able to produce the recommendation set only after thefirst two pages of the active user session.We set the support for association rule generation to a low value such as1%discarding the model size in order to have a good prediction accuracy.The hit ratio for the NASA, and UOS data sets are47.8%, 49.3%,44.50%respectively.These results prove that modelling the user trans-action with a mixture of Poisson distributions produces satisfactory prediction rates with an acceptable computational complexity in real-time and memory usage when page time is normalized between1and2.5Related WorkThe major classes of recommendation services are based on collaborativefiltering techniques and the discovery of navigational patterns of users.The main tech-niques for pattern discovery are sequential patterns,association rules,Markov models,and clustering.Collaborativefiltering techniques predict the utility of items of an active user by matching,in real-time,the active user’s preferences against similar records (nearest neighbors)obtained by the system over time from other users[1].One shortcomings of these approaches is that it becomes hard to maintain the pre-diction accuracy in a reasonable range while handling the large number of items (dimensions)in order to decrease the on-line prediction cost.Some authors have used association rules,sequential patterns and Markov models in recommender systems.These techniques work well for Web sites that do not have a complex structure,but experiments on complex,highly inter-connected sites show that the storage space and runtime requirements of these techniques increase due to the large number of patterns for sequential pattern and association rules,and the large number of states for Markov models.It may be possible to prune the rule space,enabling faster on-line prediction.Page recommendations in[10]are based on clusters of pages found from the server log for a site.The system recommends pages from clusters that most closely match the current session.Two crucial differences between our approach and the previous one are that we consider the user interest as a statistical model and we partition user sessions using a model-based approach.As the experiments demonstrate,our model’s precision and robustness is superior.Furthermore,our model has theflexibility to represent the user interest with a mixture of bino-mial distributions(or with different distributions)if one wishes to ignore the visiting time in determining the navigational pattern.We provide some intuitive arguments for why our model has an advantage in terms of speed and memory usage.The online prediction time correlates strongly with the model size.The smaller the model size the faster the online recommendation.Since we only store the cluster parameters for the prediction of the next page request,our model size is very small.The model size only increases with the number of clusters or the number of pages in the Web site when the Web site has a complex structure.However,it is clear that in that case the application of methods such as sequen-tial pattern mining,association rules or Markov models generate more complex models due to the increasing size of rules or states.Thus,all of these models require some pruning steps in order that they be effective.However,our model provides a high prediction accuracy with a simple model structure.6ConclusionWe have considered the problem of representing page time in a user session.In this article,the mixture of Poisson model is used for modelling the interest of a user in one transaction.The experiments show that the model can be used on Web sites with different structures.To confirm ourfinding,we compare our model to two previously proposed recommendation models.Results show that our model improves the efficiency significantly.References1.J.S.Breese,D.Heckerman,and C.Kadie.Empirical analysis of predictive al-gorithms for collaborativefiltering.Proceedings of the Fourteenth Conference on Uncertainty in Artificial Intelligence,pages43–52,1998.2.R.Cooley,B.Mobasher,and J.Srivastava.Data preparation for mining world wideweb browsing patterns.Journal of Knowledge and Information Systems,1(1),1999.3.S¸.G¨u nd¨u z and M.T.¨Ozsu.A user interest model for web page navigation.InProc.of Int.Workshop on Data Mining for Actionable Knowledge,Seoul,Korea, April2003.to appear.4. A.P.Dempster,ird,and D.B.Rubin.Maximum likelihood from incom-plete data via the em algorithm.Journal of Royal Statistical Society,39(1):1–38, 1977.5.O.Etzioni.The world wide web:Quagmire or gold munications of theACM,39(11):65–68,1996.6. D.Hand,H.Mannila,and P.Smyth.Principles of Data Mining.The MIT Press,2001.7.ClarkNet WWW Server Log./html/contrib/ClarkNet-HTTP.html.8.NASA Kennedy Space Center Log./html/contrib/NASA-HTTP.html.9. B.Mobasher,H.Dai,T.Luo,and M.Nakagawa.Effective personalization basedon association rule discovery from web usage data.In Proceedings of the3rd ACM Workhop on Web Information and Data Management,pages9–15,November2001.Atlanta,USA.10. B.Mobasher,H.Dai,T.Luo,and M.Nakagawa.Improving the effectivenessof collaborativefiltering on anonymous web usage data.Proceedings of the IJ-CAI2001Workshop on Intelligent Techniques for Web Personalization(ITWP01), Aug.2001.Seattle.11.The University of Saskatchewan Log./html/contrib/Sask-HTTP.html.12. C.Shahabi,A.Zarkesh,J.Adibi,and V.Shah.Knowledge discovery from usersweb-page navigation.Proceeding of the IEEE RIDE97Workshop,pages20-29, Birmingham,England,April1997.。

摘要在经济快速发展的情况下,航运业迎来了巨大的变化,船舶数量不断地增长,由此产生了很多航运密切的区域。
船舶数量的激增虽然带来了海上贸易的繁荣,但容易产生水上交通安全问题:航线负担过重,航道更加拥挤,由于船舶自身问题和人为因素产生的事故时有发生,对船员和乘客的生命财产安全造成巨大的威胁。
因此,对船舶必须进行有效的监控,及时发现船舶的异常行为,降低水上交通事故的风险。
另一方面,海运是国际贸易最主要的形式,在经济发展中占有重要的地位。
贸易的类型与航线息息相关,通过对航线轨迹变化的分析能够了解航运物流的变化,有利于对国际贸易的未来格局和发展变化进行更深入的理解。
预知船舶航行的动态是船舶异常行为分析和轨迹变化分析的基础性工作,对船舶轨迹进行精准的预测不仅能够及时发现异常轨迹,有利于海上交通监管,还能从船舶航行的角度了解国际贸易的发展变化,是航运交通智能服务的关键技术之一。
研究船舶航行轨迹预测最好能够获取船舶的历史轨迹数据,通过对历史数据的挖掘提取船舶重要的航行特征,发现船舶航行的规律,能够有效提高预测的准确性。
随着AIS系统的应用和推广,船舶轨迹数据的可获得性提高,与船舶轨迹数据挖掘的研究层出不穷,为船舶轨迹预测的研究提供了基础性的条件。
本文的主要工作如下:以大量船舶的历史AIS数据为基础,首先进行数据恢复和数据异常处理工作,最大程度上还原原始轨迹数据;在此基础上,使用轨迹分段和区域划分的两种轨迹聚类算法,从离散的原始AIS数据中得到船舶航线轨迹数据集;接着以航线轨迹数据为基础,使用多种算法对轨迹预测进行建模,并以珠江三角洲的航线数据为基础对预测算法进行验证,结果表明基于朴素贝叶斯的预测算法在船舶轨迹预测问题上具有高达90%以上的预测准确率。
关键词:船舶轨迹数据;数据预处理;轨迹聚类;航行轨迹预测;AbstractWith the rapid development of economy, the shipping industry has been developing rapidly, and the number of ships has been increasing. The surge in the number of vessels at sea has brought prosperity of trade, but it is easy to cause the problem of water traffic safety: route burden, channel congestion caused by the ship's own problems and human factors in the accident, the crew and passengers of the life and property safety threat. Therefore, it is necessary to carry out effective monitoring on the ship, find out the abnormal behavior of the ship in time, and reduce the risk of water traffic accidents. On the other hand, shipping is the most important form of international trade, which plays an important role in economic development. The type of trade is closely related to the route. Through the analysis of the change of the route, we can understand the change of shipping logistics, which is beneficial to the further understanding of the future pattern and development of international trade.To predict the dynamic navigation is the basis of the analysis of ship monitoring and track changes in the work, the accurate prediction of the ship trajectory can not only detect the abnormal trajectory for marine traffic, but also from the ship's point of view to understand the development and change of international trade, shipping and transportation is one of the key technologies of intelligent service.With the application and popularization of the AIS system, the availability of ship trajectory data is improved, which provides the basic conditions for ship trajectory data mining. The main work of this thesis is as follows: in the history of a large number of ships based on the AIS data, the first data recovery and data processing work, to restore the original data on the maximum extent, clean the available data; on this basis, two kinds of trajectory clustering algorithm using trajectory segmentation and region division, get the ship route trajectory data set from the original AIS data in a discrete;Then take the route trajectory data is based on the combination of various methods of trajectory prediction modeling, and to route data in the Pearl River Delta for verification based on the prediction algorithm, the results show that the prediction algorithm based on Naive Bayesian with up to 90% accuracy in the prediction of ship trajectory.Keywords: Ship trajectory data; data pretreatment; trajectory clustering; navigation trajectory prediction;目录第一章绪论 (1)1.1 研究背景 (1)1.2 研究现状 (1)1.2.1 数据恢复 (2)1.2.2轨迹聚类 (2)1.2.3船舶航行轨迹预测 (4)1.3 研究内容 (6)1.4 技术路线 (7)1.5 论文结构安排 (8)第二章相关理论基础 (10)2.1船舶航行轨迹预测 (10)2.2轨迹相似性度量 (10)2.3 总结 (12)第三章 AIS数据采集及预处理 (13)3.1 数据采集 (13)3.2 船舶航线轨迹数据提取 (14)3.2.1 基于船舶航行状态的航线轨迹数据提取 (14)3.2.2 基于船舶航速和采集时间间隔的轨迹数据提取 (15)3.2.3 航线轨迹数据样例 (16)3.3 缺失值处理 (17)3.3.1 问题描述 (17)3.3.2缺失值识别 (17)3.3.3 缺失值插补方法 (18)3.3.4 缺失数据插补 (20)3.3.5 数据实验 (21)3.4 异常数据处理 (24)3.5 总结 (25)第四章基于AIS数据的船舶航线聚类 (27)4.1 航线聚类定义与描述 (27)4.2 航线聚类算法 (27)4.2.1 基于轨迹分段的航线聚类算法 (28)4.2.2 基于航行区域相似度的航线聚类算法 (40)4.3 轨迹聚类结果评价指标 (45)4.4 数据实验 (46)4.4.1 实验数据 (46)4.4.2 模型参数设置 (46)4.4.3实验结果 (48)4.5总结 (50)第五章基于AIS数据的船舶航行轨迹预测 (51)5.1 船舶轨迹预测的定义与描述 (51)5.2 轨迹统计分析 (51)5.3 基于AIS数据的船舶航行轨迹预测算法 (53)5.3.1 基于概率统计的船舶航行轨迹预测算法 (53)5.3.2 基于船舶轨迹相似度的船舶航行轨迹预测算法 (57)5.3.3 基于加权KNN的船舶航行轨迹预测算法 (58)5.3.4 基于朴素贝叶斯的船舶航行轨迹预测算法 (60)5.4 实验分析 (63)5.4.1 基础数据 (63)5.4.2 实验设置 (64)5.4.3 实验结果 (66)5.5总结 (69)第六章总结和展望 (70)6.1 工作总结 (70)6.2未来展望 (70)参考文献 (71)攻读硕士学位期间取得的成果 (78)致谢 (79)第一章绪论第一章绪论1.1 研究背景航运是国际贸易最主要的形式,在经济全球化的环境下,航运业得到飞速的发展,船舶越造越大,种类愈来愈多,由此在国内和国际上产生很多航运密切的热点区域,如珠江三角洲。

国际学术会议英文主持词篇一:英文学术会议主持人发言稿模拟国际会议主持词一、开题语Good morning, ladies and gentleman. Welcome to Chicago, a beautiful city of America. I ' m ,from*********** University of avery very great pleasure to participate in the 110TH Association of American Geographers Conference as the chairman,its my first time to do I really enjoy being stay here with you this morning.The International Geography Conference has been held 110th times by the Association of American Geographers (AAG) institute since 1904. The purpose of the conferences have contributed to share our experiences and knowledge of the advancement of geography, frontier developments and reaserches, as well as possible applications of them in solving practical problems. A lot of current issues have been discussed, and some of them have been effectively soluted.Welcome to the Association of AmericanGeographers Annual Meeting in Los Angeles, California! You will be joined by fellow geographers, GIS specialists, environmental scientists, and other leaders for the latest in research and applications in geography, sustainability, and GIS science. The meeting will be held from December14 to December18, XX, and will feature over 6,000 presentations, posters, workshops, and field trips by leading scholars, experts, and researchers.Today, as the first time of the conference debut in this city, we’ ll have a unique session. The topic of prepared presentations is the application of quantitative methods in Geography , Today s speakers will share their thoughts on how to effectively run models in different issues and give a reasonable answer. Then, we' ll have a Question and Answer session, which allows the everyone to ask some questions you may be interested. I am sure that you will find some topics to be presented both interesting and informative.二、介绍第一个演讲者Now, Let me introduce the first speaker, who is very very rich, not in dollars, but in knowledge andexperiences, She got her in the natural geography ***********University, followed by a series of teaching and research positions at Sun Yat-sen University. Please don ’ t hesitate to join me in welcoming our first speaker, Prof.********, whose topic is***************. Welcome.三、对第一个演讲者做总结an innovative the impact of climate change and human activities on runoff changes is a problem that has puzzled researchers for a long time. This study has developed a framework to separate the impacts of climate change and human activities to surface runoff. The information from this study will assist with better use and management of water resources for residents and economicdevelopment in southern China. Thank you for the excellent presentations and ideas.四、介绍第二个演讲者Now, I’ ll be very pleased and excited to introduce the next speaker, Prof.************, who is the Prof. of .......... U niversity.To represent the sponsor host unit ,it' s the fifth time for him to be the final presenter. He breadth anddepth of knowledge, profound discoveries and distinctive ideas always cause shock at the conference. Today, Mr He entitl is*****************五、对第二个演讲者做总结Thank you for the impressive speech . Prof. He. Weare delighted to be able to share your new specificstrategies and techniques. Prof. He’ s speech isabout frontier science, which is profound andpredictive, greatly widen our horizon, as least myhorizon. Prof SYC has given an eye opener as well as avery meaningful lesson. Thank you again, Prof六、进入提问环节Ladies and gentleman, our distinguished speakershave finished their presentations, we now enter intothe question and answer session. During this session,Prof. HYQ. and I will be very happy to answer yourquestions.Are there any questions 七、对提问做总结Ok, Well,I' m sorry to say that this session willhave to stop here. Thank you for your questions. Ihopethis was as good a session for you as it was for us.八、会议结束语Ladies and Gentlemen,I shall end here by thanking you for coming to the The 110th International geography Conference. I hope that you have benefited much from the conference and from discussions with colleagues.I would like to thank AAG institute for offering me the opportunity to be the Chairman. Thanks to everybody who has contributed to the conference and all other participants. Thank you for your time and attendance.Ladies and gentlemen, you have my best wishes for your still greater achievements in your career. Now, I declare the conference closed. Let s meet again in New York XX.篇二:英文国际学术会议开幕词演讲稿Distinguished guests, distinguished delegates, ladies and gentlemen, and all the friends:At this special time of wonderful August, With a pleasant subtropical climate in Xiamen, Our respectable guests are here getting together undertaken by XMU , the XX 10th International Conference on Natural Computation and the XX 11th International Conference onFuzzy Systems and Knowledge Discovery , will be open. Now, First of all, please allow me to give our hearty welcome to all of you present, and thank you , for your friendly coming. We feel so proud, and appreciated as well to be the host of the event.It is a great honor for us to have all you here to attend this conference, of which the theme is the academic exchange about the advanced technologies on Computer Science. Here I’ d be delighted to introduce our conventioneers in brief. Apart from our faculty and students, Most of the delegates and guests are prestigious experts and scientists, who are related in these fields from all over the world. With many significant achievements, they are the most dynamic leaders in the movements of the science and technology.ICNC-FSKD is a premier international forum for scientists and researchers to present the state of the art of data mining and intelligent methods inspired from nature, particularly biological, linguistic, and physical systems, with applications to computers, circuits, systems, control, communications, and more. This is an exciting and emerging interdisciplinaryarea in which a wide range of theory and methodologies are being investigated and developed to tackle complex and challenging problems. As the host, I would like to take this opportunity to give you a general introduction about our school..Xiamen University(XMU), founded in 1921 ,is the first university in China founded by overseas Chinese. Before 1949, it was named University of Amoy. The school motto: "Pursue Excellence, Strive for Perfection (自强不息,止于至善),Now this university ranked the 13th in China, which is in the front rank in China and maintain the top 20 ranking in china. This university is one of the comprehensive universities directly affiliated with the Education Ministry, is located in the city of Xiamen in Fujian Province. In 1995 it was included in the list of the “211 Project” for the state key construction; in XX it became one of China ' s higher-level universities designated for the state key construction of the “985 ProjectFor this conference, we are following the agenda here. The meeting is supposed to last for three days and to be separated into two parts. To begin with , we’ll invite some representatives from our guests to give lectures about their latest researches and reports on the issue, and then we will have some symposiums. During the conference we are pleased to be your guide to this city. If anything needed, don' t hesitate to contact us. We believe by our collaboration we are sure to make this gathering a consummation.And finally I wish you an unforgettable and prefect experience here.Thanks!篇三:英文学术会议主持人发言稿Good morning,ladies and to Harbin,a beautiful northland ice city of ' m ABC,from school of economics and management of a very very great pleasure to participate in the 5TH International Finance Conference as the chairman,its my first time to do I really really enjoy being stay here with you this International Finance Conference has been held 4th times by CFA institute since 1998. The purpose of the conference is to share our experiences and knowledgein regard to the theory, frontier developments and reaserches, as well as possible applications of themin solving practical problems A lot of current issueshave been discussed,and some of them have been effectively soluted..Today,as the first time of the conference debut in this city,we ? ll have a unique topic of prepared presentations is the application of quantitative methods in Finance ,Today’ s speakers will share their thoughts on how to effectively run models in different issues and give a reasonable ,we ’ ll have a Q&A session,which allows the everyone to ask some questions you may be interested. I am sure that you will find some topics to be presented both interesting and informative. Now,Let me introduce the first speaker,who is very very rich,not in dollars,but in knowledges and experiences,He got his in financial economics at the UCB,followed by a series of teaching and research positions at MIT and Harvard. Please dont hesitate to join me in welcoming our first speaker, , whose topicis entitled threshold effect between the scale of shadow banking and the stability of the banking system.Welcome.Thank you for the impressive speech .As far as we konw,shadow banking system played an important role in the last Financial crisis mainly derived from its high leverage and asymmetric information produced a supervision lack of information, regulators were unable to measure the actual risk of the financial is crucial for to take a further knowledge of approaches to gauge the risk exposure more entirely and more SYC has given an eye opener as well as a very meaningful you again,Prof SYC.Plz alow me to introduce the next speaker, wusiqin,who is the corporate department manager of China construction bank in Harbin. She holds a Bachelor degree of Science in engineering of HIT,she also holds a master of business administration of Renmin university of topic today is Coordinated development trend of china ’ s Science-technology finance and economic growth welcome miss wu.Thank you for your speech,Miss wu. We are delighted to be able to share your new specific strategies and techniques. Miss wu ’s speech is about frontier science,which is profound and predictive,greatly widenour horizon,as least my horizon. Anyway, I would like to express to her the most sincere appreciation The next speaker,, has hosted a daily TV program with respect to economic issues on the and has appeared on CCTV,who is also the author of an upcoming book named . So to speak to you on iNNovationCapability of High tech Enterprises by Gray theory, please weclome Mr JXS with the warmest applause.Wow What an innovative idea,to quantify the Inonovation ability and classify into different categories. Try to think about it and you’ ll find its very enlightening. Thank you for the excellent presentations and ideas.Now,I ll be very pleased and excited to introduce the next speaker,Mrs Hujianjie,who is the vice president of CFA represent the sponsor host unit ,it' s the fifth time for her to be the final breadth and depth of knowledge,profound discoveries and distinctive ideas always cause shock at the ,Mrs Hu will address you on Relationship between stock liquidity and asset liquidity of listed companies,I cant wait to her inspiring ideas. WelcomeThank you very much for the extremely enlightening presentation. Generally,we wanna investigate the correlation of asset liquidity and stock liquidity, thereby linking stock liquidity to corporate finance the relationship between asset liquidity and stock liquidity is her speech, Mrs hu introduce a useful model to explore the ambiguous relationship,which may shed new light on the importance of firm' s investment and financing decisions.Ladies and gentleman,our distinguished speakers hv finished their presentations,we now enter into the question and answer this session,,,, and I will be very happy to answer as many of your questions as we could.Are there any questionsOk,Well,I m sorry to say that this session will have to stop you for your hope this was as good a session for you as it was for us.Ladies and Gentlemen,I shall end here by thanking you for coming to the The 5th International finance Conference. I hope that you have benefited much from the conference and from discussions with colleagues.I would like to thank and the CFA institute for offering me the opportunity to be the Chairman.Thanks to everybody who has contributed to the conference and all other you for your time and attendance.Ladies and gentlemen, you have my best wishes for your still greater achievements in your career. Now, I declare the conference meet again in Beijing in 2018.篇四:英文国际学术会议开幕词演讲稿International Conference on Space TechnologyDistinguished guests, distinguished delegates, ladies and gentlemen, and all the friends:At this special time of wonderful September, in this grand hall of the beautiful city, our respectable guests are here getting together. Jointly sponsored by the International Astronautical Federation (IAF), International Academy of Astronautics (IAA) and the International Institute of Space Law (IISL), undertaken by China National Convention Center atBeijing, the sixty-fourth session of the International Astronautical Congress will be open. Now, first of all, please allow me to give our hearty welcome to all ofyou present, and thank you, for your friendly coming. We feel so proud, and appreciated as well to be the host of the event.For this conference, we are following the agenda here. The meeting is supposed to last for five days it is the first congress which covers the true sense of space science and exploration, space applications and operations, space infrastructure, space and society multidimensional fields. And it to be separated into two parts, to begin with, we ’ ll invite some representatives from our guests to give lectures about their latest researches and reports on the issue, and then we will have some finally I wish you an unforgettable and prefect experience here.Thank you!篇五:国际会议chairman主持词The First China Unconventional Gas SummitDistinguished guests, ladies and gentlemen, Goodmorning!I am the chairwoman of the China Unconventional Gas Summit. It is a great pleasure for me to welcome you to Beijing to discuss various aspects of unconventionalgas. I hope that this summit will provide opportunityfor academic exchange and contribute to the development of unconventional gas in China.Now I declare the China Unconventional Gas Summit is open!Please allow me to introduce today' s speakers. They are Yuan Dandan and Hu Ying, who both are professors of China University of Petroleum. They will jointly deliver a speech titled “ Prospect and Development of Shale Gas in China” . Let ’ s welcome them.Thanks professor Yuan and Professor Hu for their excellent presentation. Do you have any questions about itAny other questionThank you again for your excellent explanation.Okay, as time is limited, I am sorry to say that this session has to stop here.Now we come to the end of this summit. On behalf of all the members of the organizing committee, I wish toexpress our sincere gratitude to all of you who have so actively participated in this congress to make it such a success.And now, I declare the China Unconventional GasSummit closed. Thank you!篇六:国际学术会议主持用稿Ladies and gentlemen:Good Morning !On behalf of the organizing committee and the program committee, I am happy to welcome your participation in China National Computer Conference,held in Harbin. Let me introduce myself . I am zhang yong hui,from computer science & technolegy college of Harbin Engineering University .It is a greate pleasure for me to be the chairman of the session today. Now I declare the twelfth China National Computer Conference,which is jointly sponsored by China Computer Federation, undertaken by Harbin Engineering University, open. Thank you very much for coming to Harbin Engineering University to attend the meeting today, despite the long distance and the cold weather ! We feel so proud, and appreciated as well to be the host of the event.The history of this conference goes back to XX,It has successfully held eleven times,and has become a very important session in the field of computer science. The conference aims to create a forum for scientistsand educators to exchange their newest computer technologies and engineering expertise .Developing Infrastructures for the Future is the theme of the session this year. According to the usual practice, we will invite a leading scholar to make a report about the hot topic at present .And this time we are so lucky that we have invited professor zhang xin here today,who is one of the most popular scholars in this field, adynamic,high-energy man with a passion for computer science. He did his research about speech recognition at Bell Labs after receiving his PHD from Stanford University. It is amazing that he has published several papers in the journal Nature, which has been the fondest wish of many scientists。

Part II Data MiningOutlineThe Concept of Data Mining(数据挖掘概念) Architecture of a Typical Data Mining System (数据挖掘系统结构)What can be Mined? (能挖掘什么?)Major Issues(主要问题)in Data MiningData Cleaning(数据清理)3What Is Data Mining?Data mining is the process of discovering interesting knowledge from large amounts of data. (数据挖掘是从大量数据中发现有趣知识的过程) The main difference that separates information retrieval apart from data mining is their goals. (数据挖掘和信息检索的主要差别在于他们的目标) Information retrieval is to help users search for documents or data that satisfy their information needs(信息检索帮用户寻找他们需要的文档/数据)e.g. Find customers who have purchased more than $10,000 in the last month .(查找上个月购物量超过1万美元的客户)Data mining discovers useful knowledge by analyzing data correlations using sophisticated data mining techniques(数据挖掘用复杂技术分析…)e.g. Find all items which are frequently purchased with milk .(查找经常和牛奶被购买的商品)A KDD Process (1) Some people view data mining as synonymous5A KDD Process (2)Learning the application domain (学习应用领域相关知识):Relevant knowledge & goals of application (相关知识和目标) Creating a target data set (建立目标数据集) Data selection, Data cleaning and preprocessing (预处理)Choosing functions of data mining (选择数据挖掘功能)Summarization, classification, association, clustering , etc.Choosing the mining algorithm(s) (选择挖掘算法)Data mining (进行数据挖掘): search for patterns of interest Pattern evaluation and knowledge presentation (模式评估和知识表示)Removing redundant patterns, visualization, transformation, etc.Present results to user in meaningful manner.Use of discovered knowledge (使用所发现的知识)7Concept/class description (概念/类描述)Characterization(特征): provide a summarization of the given data set Comparison(区分): mine distinguishing characteristics(挖掘区别特征)that differentiate a target class from comparable contrasting classes. Association rules (correlation and causality)(关联规则)Association rules are of the form(这种形式的规则): X ⇒Y,Examples: contains(T, “computer”) ⇒contains(T, “software”)[support = 1%, confidence = 50%]age(X, “20..29”) ∧income(X, “20..29K ”) ⇒buys(X, “PC ”)[support = 2%, confidence = 60%]Classification and Prediction (分类和预测)Find models that describe and distinguish classes for future prediction.What kinds of patterns can be mined?(1)What kinds of patterns can be mined?(2)Cluster(聚类)Group data to form some classes(将数据聚合成一些类)Principle: maximizing the intra-class similarity and minimizing the interclass similarity (原则: 最大化类内相似度,最小化类间相似度) Outlier analysis: objects that do not comply with the general behavior / data model. (局外者分析: 发现与一般行为或数据模型不一致的对象) Trend and evolution analysis (趋势和演变分析)Sequential pattern mining(序列模式挖掘)Regression analysis(回归分析)Periodicity analysis(周期分析)Similarity-based analysis(基于相似度分析)What kinds of patterns can be mined?(3)In the context of text and Web mining, the knowledge also includes: (在文本挖掘或web挖掘中还可以发现)Word association (术语关联)Web resource discovery (WEB资源发现)News Event (新闻事件)Browsing behavior (浏览行为)Online communities (网上社团)Mining Web link structures to identify authoritative Web pages finding spam sites (发现垃圾网站)Opinion Mining (观点挖掘)…10Major Issues in Data Mining (1)Mining methodology(挖掘方法)and user interactionMining different kinds of knowledge in DBs (从DB 挖掘不同类型知识) Interactive mining of knowledge at multiple levels of abstraction (在多个抽象层上交互挖掘知识)Incorporation of background knowledge (结合背景知识)Data mining query languages (数据挖掘查询语言)Presentation and visualization of data mining results(结果可视化表示) Handling noise and incomplete data (处理噪音和不完全数据) Pattern evaluation (模式评估)Performance and scalability (性能和可伸缩性) Efficiency(有效性)and scalability(可伸缩性)of data mining algorithmsParallel(并行), distributed(分布) & incremental(增量)mining methods©Wu Yangyang 11Major Issues in Data Mining (2)Issues relating to the diversity of data types (数据多样性相关问题)Handling relational and complex types of data (关系和复杂类型数据) Mining information from heterogeneous databases and www(异质异构) Issues related to applications (应用相关的问题) Application of discovered knowledge (所发现知识的应用)Domain-specific data mining tools (面向特定领域的挖掘工具)Intelligent query answering (智能问答) Process control(过程控制)and decision making(决策制定)Integration of the discovered knowledge with existing knowledge:A knowledge fusion problem (知识融合)Protection of data security(数据安全), integrity(完整性), and privacy12CulturesDatabases: concentrate on large-scale (non-main-memory) data.(数据库:关注大规模数据)To a database person, data-mining is an extreme form of analytic processing. Result is the data that answers the query.(对数据库工作者而言数据挖掘是一种分析处理, 其结果就是问题答案) AI (machine-learning): concentrate on complex methods, small data.(人工智能(机器学习):关注复杂方法,小数据)Statistics: concentrate on models. (统计:关注模型.)To a statistician, data-mining is the inference of models. Result is the parameters of the model (数据挖掘是模型推论, 其结果是一些模型参数)e.g. Given a billion numbers, a statistician might fit the billion points to the best Gaussian distribution and report the mean and standard deviation.©Wu Yangyang 13Data Cleaning (1)Data Preprocessing (数据预处理):Cleaning, integration, transformation, reduction, discretization (离散化) Why data cleaning? (为什么要清理数据?)--No quality data, no quality mining results! Garbage in, Garbage out! Measure of data quality (数据质量的度量标准)Accuracy (正确性)Completeness (完整性)Consistency(一致)Timeliness(适时)Believability(可信)Interpretability(可解释性) Accessibility(可存取性)14Data Cleaning (2)Data in the real world is dirtyIncomplete (不完全):Lacking some attribute values (缺少一些属性值)Lacking certain interest attributes /containing only aggregate data(缺少某些有用属性或只包含聚集数据)Noisy(有噪音): containing errors or outliers(包含错误或异常) Inconsistent: containing discrepancies in codes or names(不一致: 编码或名称存在差异)Major tasks in data cleaning (数据清理的主要任务)Fill in missing values (补上缺少的值)Identify outliers(识别出异常值)and smooth out noisy data(消除噪音)Correct inconsistent data(校正不一致数据) Resolve redundancy caused by data integration (消除集成产生的冗余)15Data Cleaning (3)Handle missing values (处理缺值问题) Ignore the tuple (忽略该元组) Fill in the missing value manually (人工填补) Use a global constant to fill in the missing value (用全局常量填补) Use the attribute mean to fill in the missing value (该属性平均值填补) Use the attribute mean for all samples belonging to the same class to fill in the missing value (用同类的属性平均值填补) Use the most probable value(最大可能的值)to fill in the missing value Identify outliers and smooth out noisy data(识别异常值和消除噪音)Binning method (分箱方法):First sort data and partition into bins (先排序、分箱)Then one can smooth by bin means, smooth by bin median, smooth by bin boundaries, etc.(然后用平均值、中值、边界值平滑)©Wu Yangyang 16Data Cleaning (4)Example: Sorted data: 4, 8, 9, 15, 21, 21, 24, 25, 26, 28, 29, 34 Partition into (equi-depth) bins (分成等深的箱):-Bin 1: 4, 8, 9, 15-Bin 2: 21, 21, 24, 25-Bin 3: 26, 28, 29, 34Smoothing by bin means (用平均值平滑):-Bin 1: 9, 9, 9, 9-Bin 2: 23, 23, 23, 23-Bin 3: 29, 29, 29, 29Smoothing by bin boundaries (用边界值平滑):-Bin 1: 4, 4, 4, 15-Bin 2: 21, 21, 25, 25-Bin 3: 26, 26, 26, 34Clustering (。
Exploring the Role of Technology inEducationTechnology has become an integral part of our daily lives, and its impact on education is undeniable. From online learning platforms to interactive whiteboards, technology has transformed the way students learn and teachers teach. While some argue that technology is a distraction in the classroom, others believe that it enhances the learning experience. In this response, we will explore the role of technology in education from multiple perspectives. One of the main arguments in favor of technology in education is its ability to enhance the learning experience. With the rise of online learning platforms and educational apps, students now have access to a wealth of resources at their fingertips. These resources can help students reinforce their understanding of concepts, practice problem-solvingskills, and engage with interactive content. For example, platforms like Khan Academy and Coursera offer a wide range of courses and tutorials that cater to different learning styles and abilities. Additionally, tools like virtual reality and augmented reality can provide immersive learning experiences that make complex concepts easier to understand. Furthermore, technology has the potential to level the playing field for students from diverse backgrounds. In traditional classrooms, students with learning disabilities or language barriers may struggle to keep up with their peers. However, technology can provide personalized learning experiences that cater to individual needs. For example, students with dyslexiacan use text-to-speech software to help them read and comprehend text, while English language learners can use translation tools to access content in their native language. By providing these accommodations, technology can help all students succeed academically and reach their full potential. On the other hand, some critics argue that technology is a distraction in the classroom and hinders student learning. With the prevalence of smartphones and social media, students may be tempted to multitask during lectures or assignments, leading to decreased focus and retention of information. Additionally, the overreliance on technology can limit students' critical thinking and problem-solving skills. Instead of grappling with complex problems and developing analytical skills, students maysimply rely on technology to provide quick answers and solutions. This can hinder their ability to think creatively and independently. Moreover, the integration of technology in education raises concerns about data privacy and security. As schools collect more data on students' academic performance and behavior, there is a risk that this information could be misused or compromised. For example, personal information stored on school servers could be vulnerable to hacking or unauthorized access. Additionally, the use of online platforms and apps in the classroom may expose students to targeted advertising and data mining practices. This raises ethical questions about how student data is collected, stored, and shared, and calls for greater transparency and accountability from educational technology providers. Despite these challenges, it is clear that technology is here to stay in education. As the world becomes increasingly digital, students need to develop digital literacy skills to navigate the modern workforce. By integrating technology into the curriculum, schools can prepare students for the demands of the 21st century and equip them with the tools they need to succeed in a digital age. However, it is important to strike a balance between technology and traditional teaching methods, ensuring that students receive a well-rounded education that fosters critical thinking, creativity, and collaboration. By leveraging the benefits of technology while addressing its limitations, educators can create a learning environment that is engaging, inclusive, and effective for all students.。
大数据辅助教学英语作文Big data has revolutionized the way we teach and learn English. With the help of big data analysis, teachers can better understand the learning patterns and needs of each individual student, allowing for more personalized and effective instruction.In the classroom, big data can be used to track students' progress and identify areas where they may need extra support. This allows teachers to tailor their lesson plans to address specific learning gaps and ensure that every student is able to reach their full potential.Furthermore, big data can also be used to create more engaging and interactive learning materials. By analyzing the preferences and interests of students, educators can develop content that is more relevant and interesting, making the learning process more enjoyable and effective.In addition, big data can help educators identifytrends and patterns in language learning, allowing them to adapt their teaching methods to better meet the needs of today's students. This can lead to more innovative and effective teaching strategies that are better suited to the modern learning environment.Overall, big data has the potential to greatly improve the quality of English language education by providing teachers with valuable insights and tools to better support their students' learning journey. With the help of big data, educators can create a more personalized, engaging, and effective learning experience for all students.。
Critical questions for big data, Provocations for a cultural, technological, and scholarly phenomenon. Danah boyd&Kate CrawfordBig Data for Education: Data Mining, Data Analytics, and Web Dashboards. Darrell M.WestCritical questions for big data, Provocations for a cultural, technological, and scholarly phenomenon. Danah boyd&Kate CrawfordOverview:This literature is a critical article. It mainly illustrates as the era of Big Data is underway, Big data is more and more popular research tool in many academic fields. Nevertheless, some problems occur as the raise of popularity of Big Data. This literature focuses on the six main critical questions for Big Data.Introduction:The first part is the introduction. In this part, 随着大数据的普及,越来越多学术领域将大数据作为一种新的工具。
简单阐述了大数据在一些领域的用途后,将重心放在大数据被运用的同时,很多相关的问题滋生了。
Application of Data mining Techniques in Education for AcademicPredictionAbstract Data mining is a process aimed to find hidden information with potential value in huge amount of data. This paper discusses the data mining application in education system to evaluate and predict students’academic performance and group the students based on exam scores, coursework grades, attendance and practical exams. The method we use is Apriori Algorithm and K-means Clustering. By analyzing the evaluation result, we can give students suggestions about their course choosing and career pursuing.Keywords Data mining, education evaluation, cluster, Apriori Algorithm1.IntroductionWith the rapid growth of data amount, data mining technique has become a significant tool in discovering patterns in large data set The overall goal of the data mining process is to extract information from a data set and transform it into an understandable structure for further use.[1] It can be used in many fields such as finding potential customers in marketing, DNA sequence analysis and web log analysis. Educational data mining is the area of science where various methods are being developed for making discoveries within data. This data is obtained from an educational background.[2]In this paper, we apply the frequent itemset mining method of Apriori in a set of academic performance of college students to get the association rules. Then we use K-means Clustering to group the students. Our goal is to predict the students’ performance. In this way we can construct coursework, plan and schedule classes, model students and provide recommendations to them.[3] 2.Algorithm2.1Apriori AlgorithmApriori Algorithm is a candidate generation and test approach. The main idea is to find the frequent pattern in a large set of data. In this case we want to predict a student’s academic performance with the data we collect using the association rules we are going to find. For example, if a student has a mark 80-100 and if his coursework grade is A, attendance is high then his performance is most likely to be good. The Apriori Algorithm is shown in Figure 1[4]:Figure 1 Apriori Algorithm2.2 K-means ClusterGiven a database of n objects and k is the number of clusters to form a partitioning algorithm that organizes the objects into k partitions where k ≤n and each partition represents a cluster. The main reason for forming clusters is, so that all the objects in a cluster are similar to each other, whereas objects of other clusters are dissimilar in terms of database attributes. The K-means does exactly this function. It separates clusters into a set of n objects where the inter cluster similarity is low and the intra cluster similarity is high. Cluster similarity is measured based on the mean value of the objects in the cluster. The algorithm proceeds as follows. First, it randomly selects k of the objects where each represents a cluster mean or center. For each of the remaining objects, an object is assigned to the cluster to which it is the most similar, based on the distance between the object and the clusters mean. It then computes a new mean for each cluster. This process iterates until the criterion function converges [5]. Typically thesquared-error criterion is used, defined as follows:The k-means procedure is summarized in Figure 2[6].Figure 2 K-means Cluster3.Method and ResultThe input data we used is a file containing the academic record of students in a university. The various parameters and range are shown in Figure 3. We have made use of Weka to mine best association rules which will help us extract information based on which we can profile the student’s performance as Good, Satisfactory or Poor. Weka proves to be an efficient tool for analyzing and predicting the students’ behavior.Figure 3 data attributes and rangeWe use Apriori algorithm on this set of data to obtain best association rules based on confidence with minimum support 20%. Since the data used to demonstrate this is not very large, we have made use of a low minimum support value. The higher the minimum support we provide, the stronger the association rules we obtain. Based on our input file, the best obtained rule states that if the exam marks are 80-100 and if the attendance is High, then the student can conveniently be profiled as Good. The output of this is shown in figure 4. We can use the association rules we have got to evaluate the students’ academic performance and predict students’ study pattern.Figure 4Clustering aims to partition n observations into k clusters in which each observation belongs to the cluster with the nearest mean. Figure 5 shows the implementation of K-means clustering using WekaFigure 5In our observations we can see that there are totally 101 instances. These 101 instances have been partitioned into two clusters with 57 and 44 instances respectively. Clustering ismainly done to find the centers of the natural clusters in the data.We can see that the overall result of our student academic data is Satisfactory with exam-marks as 80-100, termwork-grades as A, attendance as High, and practical-marks as 0-10. The first cluster i.e. cluster 0 has overall result as Good with exam-marks as 80-100, termwork grades as A, attendance as High, and practical-marks as 11-20. However, the second cluster i.e. cluster1 shows overall result as Poor with exam-marks as 0-40, termwork-grades as C, attendance as Low, and practical-marks as 0-10. Thus, based on the results we can easily group the students especially in cases where large academic records are present.4.ConclusionIt would be extremely hard for us to manually go through huge set of data to identify students’ trends and behavior and the pattern in which they learn. Therefore we can see the significance andconvenience the Apriori and K-means clustering algorithms. What’s more, we can also discover more useful information about our students, for example by studying more detailed information likehobbies and certain major score of a student, we can provide recommendations for his major choosingin the future education. By identifying their strength we can also provide career consultation for them.5.Reference[1]Data Mining Curriculum"ACM SIGKDD. 2006-04-30.[2] Suhem Parack, Zain Zahid, Fatima Merchant, Application of Data Mining in Educational Databases for Predicting Academic Trends and Patterns.[3]2. Cristobal Romero, Sebasti an Ventura. “Educational Data Mining: A Review of the State of the Art,” IEEE TRANSACTIONS ON SYSTEMS, MAN, AND CYBERNETICS—PART C: APPLICATIONS AND REVIEWS, VOL. 40, NO. 6, NOVEMBER 2010.[4-6]Jiawei Han, Micheline Kamber, Data Mining: Concepts and Techniques, 1st edition, Morgan Kaufmann Publishers, 2000.。