tunnelsupportdesign_cgs_2003
- 格式:pdf
- 大小:560.08 KB
- 文档页数:6
(QJLQHHULQJ WKH EULGJH RYHU WKH +ROODQGVFK 'LHS:LP µW +$57 Engineering Director Drechtse Steden, Netherlands -DFR 5(86,1.Project Manager, IRO b.v.(Rotterdam Public Works)Rotterdam, Netherlands'LPLWUL 78,1675$Civil EngineerIv-Infra b.v.Papendrecht, Netherlands+DQ 926General ManagerIv-Infra b.v.Papendrecht, Netherlands6XPPDU\The structural design of the composite high speed railway bridge, with a 1190 m continuous multiple river span over the Hollandsch Diep, was the first of this type in the Netherlands and proved to be a real challenge. To fulfil the Design and Construct contract, severe demands related to aesthetics, tolerance requirements, ship collision forces and comfort criteria had to be satisfied in order to allow high speed trains to pass the bridge smoothly at 330 km/hour maximum speed. In the tender-phase various design solutions and erection methods were proposed in order to meet these criteria.In this presentation the alternatives that were evaluated in the design phase to obtain acceptable dynamic properties of the bridge structure will be shown and discussed, followed by final choices that have been made for structural design and erection..H\ZRUGV:Hollandsch Diep; bridge; high-speed; railway; structural design; composite; piers.,QWURGXFWLRQThe bridge is part of the ± 16 km long HSR-cluster from Rotterdam to Moerdijk which on his turn is part of the ± 100 km long HSR-link that is being constructed between Amsterdam and the Belgian border. The Client is the Dutch Ministry of Transport, Public Works and Watermanagement, represented by Rijkswaterstaat. The main contractor for the infrastructure is Bouwcombinatie HSL Drechtse Steden v.o.f., a joint venture of Ballast Nedam, Van Hattum en Blankevoort, Strukton, HBG, CFE, TBI, Vinci, and Van Oord ACZ.The engineering of the bridge was done by IHD, a joint venture between IV Infra and Ingenieursbureau Rotterdam: hereby IHD was integrated in the design-organisation of the main contractor. The construction, transport and assembling of the steel superstructure of the bridge was done by the subcontractor Staal Trio Moerdijk, a joint venture of HSM, Hollandia and Mercon. The main contractor has been responsible for the structural development of the largest high speed railway (HSR) bridge between Amsterdam and Paris. Since the bridge is considered to be a landmark for entering the Netherlands an explicit design was requested. Benthem & Crouwel was the winning architect of the design competition and showed a slender design with a multiple span composite girder having high V-shaped members at the supports and a reduced member height in the fields, see fig. 1 on next page.The new piers had to be positioned in the shadow of the old 1868 multiple span railway bridge piers on the east side, the 105 m spans were synchronized. Apart from this, the new bridge is different in every aspect. The continuous composite structure proved advantageous in stiffness requirements, erection speed, maintenance and noise reduction.The river part consists of 11 piers, about 105 meters apart, and 2 side spans of 70 meters, adding up to a total length of 1190 meters. In cross-section the structure consists of a 6 m wide an 4.5 m high open steel box girder, supporting a 14.2 m wide concrete deck slab with a maximum thickness of 0.5 m at the webs. In the support-region above the piers the height of the composite deck girder is increased to 10.5 m. The outer webs of the steel girder are 1 to 20 skew upwards, reducing thegirder width by 1 meter at the lower bearing position. The bridge is supported by four rubber bearings at every pier and two bearings at the abutments. The bridge is longitudinally supported by its three middle piers and laterally at each pier by dowels made of welded heavy steel plates. To enable the large temperature deformations, sliding bearings at the outer piers and on the abutments support the bridge.The piers consist of a cast in situ concrete shaft standing on prefabricated concrete casings. The casings are placed over large diameter steel piles and the rigid connection is made by in situ concrete.The approach bridges have a length of 400 m each. The approach bridges are constructed of concrete P shaped members with a length of 32 meters each. The concrete members are designed in such a way that the side shape of the river span continues and slowly seems to descend into the ground.The contract-based technical criteria related to comfort, stiffness and tolerances could hardly be met. This resulted in three different design approaches for the bridge during tender phase. The contractor had to optimize and integrate different views on construction methods and the structural designs for the bridge-deck and the piers. Therefore in final design phase a re-evaluation was done resulting in optimal choices out of the available solutions. The three different tender designs will be presented and the choices will be explained and discussed. The design of the bridge piers and approach bridges will be presented. 7HQGHU SKDVH SUHOLPLQDU\ GHVLJQV7HQGHUThe first design consisted of prefabricated 105 m sections, cantilevering 52.5 m symmetric from the piers. The 2400 ton composite parts are fabricated at the steel yard and transported to the building site on two barges. The height of the pier-section is 11.5 m which is too high to pass under the existing road bridge, the headroom being only 10.9 m. Lowering the bridge-section into the water while passing the bridge solved this problem. The section is installed on the pier and stability is achieved by temporary supporting frames and a rectangular 4-point bearing. This is a major structural change of the original design by Benthem & Crouwel, which had bearings, placed in one line.)LJ +65 EULGJH RYHU WKH +ROODQGVFK 'LHSThe concrete deck was longitudinally pre-stressed over the pier-section, and transversely over the entire length, see fig. 2, to reduce the tensile stresses in the concrete and to allow full composite action for train loads. In order to direct the pre-stressing force in the concrete deck in stead of the steel girder, the dimension of the steel upper flange and web had to be minimized. The concrete was cast in multiple stages, starting in the middle and going outward symmetrical in both ways from that position. After each stage pre-stressing force was applied with post-tensioning cables. In this way two goals were achieved: composite action in the negative bending moment region over the piers and a reduction in steel weight.7HQGHUThis design consisted of 105 m long composite and prefabricated parts, cantilevering 52.5 m symmetric from the piers, as did the first design. The concrete was cast in different stages, this time starting on the outside and working to the middle from both sides. The advantage of this method was that in this way there was no pre-stressing needed. . The concrete was pre-stressed by the construction method itself. This method consisted of a progressive construction order in which each installed part was used to introduce a constant positive bending moment in the next part of the composite beam. The extra steel needed in the girder for this action was preferred over the use of post-tensioning cables.7HQGHUThe third design divided each span into two different sections, the 59 m long field-section en 46 m long symmetric cantilevering pier-section, also referred to as hammer-section, see fig. 3. The reasons for this partition were the transportation of the sections from the yard to the building site and the restricted accessibility of heavy lifting equipment at the site.The hammer-sections are transported to the site without concrete deck. In order to pass under the neighboring road-bridge, the steel sections are fabricated and transported while lying on one side. In one action the 500-ton sections are rotated to the vertical position and placed on the piers with a floating crane. Temporary support frames are used to provide stability during construction. The field-sections are prefabricated with concrete deck on the yard. On site, the 1200-ton field-sections are lifted from the barge with strand-lifts that are placed on the hammer-sections. After installing and welding the concrete deck of the hammer-section is cast. This reduces tensile stress in the concrete deck in the pier region. To reduce the amount of secondary steel the bridge structure was installed in three building phases. Between these phases the temporary support frames were dismantled and re-used in the next phase.7KH ILQDO GHVLJQThough the third tender design proved to be the most efficient, dynamic behavior needed to be improved. During the final design the bridge superstructure has been optimized and details have been simplified. The bridge substructure has been re-evaluated and finalized.&RPIRUW FULWHULDThe comfort criteria demands were difficult to meet since the combination of slender shape and severe equivalent maximum acceleration levels of 0.7 m/s2 were nearly impossible to combine. Therefore the quest for activating additional structural stiffness dominated detailed design. The 105 m spans appeared to be unfavorable given the high speed of the train of 90 m/s, which means that the train passes a pier every 1.2 seconds, the characteristic frequency of the railway carriages being between 0.8 and 1.2 seconds. Together with the eigen-frequency of the structure in thecorresponding range. These stroking frequencies result in an increased acceleration of the train.Improvement of the bridge characteristics in this aspect can be done by increasing the stiffness, by changing the mass of the composite girder, by changing the distance between the piers or by adding more stiffness to the supports. The distance between the piers was no real choice. Changing the mass of the bridge is difficult, since the dynamics showed better behavior with a lighter bridge deck Apart from that, the unknown rail system had a great influence on the mass of the bridge and could not be influenced.An option for adding stiffness to the structure was activating the stiffness of the piers. Pre-stressing the concrete deck on the hammer-section proved not economic due to the chosen construction method. In spite of the reduced stress in the concrete deck in the negative bending moment region,the concrete on the hammer-sections was cast only after the field-sections were installed, use of tension stiffening (according to Eurocode NVN-ENV 1994-2, annex L) did not result in additional stiffness. Because of the triangular shape of the hammer-section, the deck girder acted as tension member as well as a bending member, causing tensile forces in the concrete deck.Incorporating the stiffness of the pier into the superstructure could influence support stiffness. The four-point bearing support at every pier added longitudinal stiffness to the bridge girder by introducing a semi-rigid connection to the pier. This improved the dynamic behavior considerably. )LHOG VHFWLRQ VWUXFWXUDO DVSHFWVThe structural steel has been optimized. Therefore the use of buckling stiffeners is limited to 1through-shaped stiffener at the 50 mm bottom plate and one at the 22 mm web plate, see fig. 4. The upper flange is 700 mm wide in order to have the same (500 mm) visual outside flange as the cross section over the piers. Every 5 m the cross section of the girder is braced with transverse T-shaped stiffeners 0,5 m high. The B55 concrete deck slab is poured upon formwork made from permanent hd-galvanized Comflor-70 steel sheet plates. The deck slab varies in thickness from 400 mm in the middle to 500 mm at the web-location and 200 mm at the outer edge .+DPPHU VHFWLRQ VWUXFWXUDO DVSHFWVThe hammer-sections are divided into 4 different structural parts: a deck girder, 2 Y-shaped connection pieces, 2 V-sections and the support section, see fig. 5. The open box composite deck girder has a reduced height of 3 m for architectural reasons. Because of the triangular shape of the hammer-section the deck girder acts as a tension member as well as a bending member. Despite the construction method to reduce the tensile forces in the deck, composite action cannot be guaranteed in ultimate limit state. Therefore it’s steel plate dimensions are larger than the field-section. The bottom flange thickness was increased to 60 mm because of large holes for the lights that areintegrated in the bottom of the girder.)LJ 6LGH YLHZ RI ILHOGVHFWLRQ )LJ 6LGH YLHZ RI KDPPHU VHFWLRQ GLYLGHG LQ SURGXFWLRQ SDUWVThe Y-shaped connection pieces transfer the forces from both the field-section and the deck girder of the pier-section with the box girder of the V-section. The inner fold of the Y-section required special attention. Forces from the bottom flange are led into the web by a horizontal stiffener that was reduced from the middle to the webs. The complex junction between the 5 connecting plates was realised with a sliced piece of steel which is 5.5 m long and 800 mm wide.The largest concentration of forces acts on the web plates. Extensive studies have been carried out to reduce the fatigue stresses in the inner fold of the web plate. A high quality steel was used, S460,with a thickness of 100 mm. After discussion with the architect the inner fold of the web plate was rounded in order to reduce the stresses. The connection between the 100 mm web plate and the 25mm thick neighboring web plates was carried out with a 1:4 slope near the inner fold and 1:2 at a larger distance from the fold. As the outer surface of the web had to be smooth, the increased thickness on the inside of the web required all stiffeners to be adapted locally.The steel V-box girders have high torsional stiffness to provide sufficient lateral support for the deck girder. The faceted upper flange of the box girder is made out of three steel plates. Every 5 m a brace frame was used to retain its form. The bottom flange is 50 mm thick, the webs 25 mm and the upper flange plates 30 mm.The support region of the hammer-section is subject to large bending moments and compressive forces due to the triangular shape of the hammer-section. Three transverse plates are used to stiffen the 5 sided cross-section and one longitudinal plate is used to strengthen the upper flange. At the bottom flange, the bearings introduce a large concentration of forces into the support section.Limited space on the top of the piers required a fixed position of the bearings on the piers.Temperature differences of the 1190 m long bridge cause a longitudinal shift of 0.25 m over the bearings in both directions. In all possible positions the support forces have to be led into the steel.Heavy steel plates have been used to reduce the complexity of the detail resulting in a 150 mm thick bottom plate and three, max 80 mm thickness, vertical plates to transfer the forces to the webs. All welds are full pen.6XSSRUW V\VWHPThe bridge bearing system changed as design proceeded. Starting with two vertical pot-bearings in line these were changed into rubber-steel plate bearings and finally changed to four bearings in rectangular system. Latter was done to improve comfort-related stiffness of the superstructure since this position allowed moment transfer to the pier. By applying four bearings vertical flexibility had to be increased in order keep positive reaction in all supports in case of a-symmetric mobile loading. Bearing dimensions are typical 1200*900*280 mm. Except for the 5 central piers all bearings have stainless steel-Teflon sliding plates.After welding of the bridge-sections, the four permanent bearings on the piers are installed at their final level to obtain the requested equal load distribution.All horizontal restraints are executed by means of a heavy steel dowel bolted to the top of each pier, see fig. 6. The dowel penetrates though a rectangular opening in the bottom plate of the support section. The opening allows for temperature. At the position of the bottom plate the horizontal supports are designed as flexible rubber steel plate elements in order to be able to cope with minor deformations. Due to reduced stiffness of the piers in longitudinal direction, a single pier was not able to take all longitudinal forces within deformation limits.Therefore the bridge superstructure is )LJ 3RVLWLRQ RI YHUWLFDO EHDULQJV DQG KRUL]RQWDO IL[DWLRQ RQ WRS RI SLHUsupported at the middle three sections in the direction of the span. To allow for temperature deformation both supports adjacent to the central pier have been provided with 10 mm free space. In lateral direction the bridge superstructure is supported at all piers. This support transfers part of the ship collision impact force to other piers thanks to the high torsional rigidity of the bridge. In this way deformation during collision could be kept within limits of the contract requirements. %ULGJH VXEVWUXFWXUH GHVLJQThe foundation of the piers consists of 5 hollow steel, open ended piles for the middle spans and 4 piles for the spans near the banks. With a length of 40 m and 3 m diameter these are driven into the bottom from above the water level deep into sand. This system proved to be effective over concrete piling as steel piles have large lateral stiffness and strength. Research was executed to improve axial stiffness by means of pressured grout injection at the pile bottom. However since this method was not applied before in similar situations and the operational risks were considered severe the method was skipped in favor of an increased depth of piles.)LJ %XLOGLQJ RI WKH EULGJH SLHUV LQ VWDJHVOn top of the piles 25*10 m prefab concrete caisson were installed, see fig. 7. The rigid connection between the piles and caisson is made by means of casting under water concrete inner top of the pile and the caisson. The design of piles and bending connection were governed by the design criterion of a ship impact of 3000 ton acting 3 meters above waterline and allowing a maximum lateral displacement of 8 cm at the track level. After installation and sealing of the pile heads, the caisson was pumped dry. Since the top of the casing is 0.5 meter under water level temporary water retaining skirts were applied on top. Next the hollow casing is cast with concrete.On top of the casing a hollow rectangular vertical shaft with varying cross section is cast in situ. The shafts have a varying height with a difference of 7 meters between the middle and the side piers. The shaft-heads include anchors for the bridge supports and therefore severe tolerances within mm range were applied for the shaft positioning.. The mere 5*6 m top plane of the shaft included space for vertical supports at the edges, jacks for bridge lifting, horizontal supports and a central lower level inspection space accessible from the bridge.%XLOGLQJ WROHUDQFHVThe rail system will be built by the infra-provider, a party that was unknown during the design of the bridge. The acceptable vertical tolerance of the deck was set at +/- 15 mm, 1/7000 of the span. Considering the large spans, the continuous multiple span girder and the composite structure, these standards were hard to meet. In discussion with the HSL-ZHZ authorities this tolerance was set at +/- 40 mm.3URGXFWLRQThe field-sections are built on the yard out of three 20 m long subsections. Though all spans are notexactly 105 m and the alignment didn’t have a constant curve over the complete length of the main span, all field-sections were produced identically. The length of the middle subsection could be adapted in order to achieve the right length of the field-section. The subsections are set on hydraulic jacks in the right shape according to the alignment and camber. In this way the alignment curve was adaptable for every field-section. After welding and conserving the steel, the formwork for the concrete deck is installed and the concrete is cast. Because of the settlements of the soil the bearing positions are provided with an electronic measuring device. After casting the concrete the soil starts to settle. The deformation of the section is monitored continuously during the first days and after this period with larger intervals. If necessary the hydraulic jacks are used to correct the level. In this way the deformation is restrained to +/- 5 mm. After a minimum of 14 days the sections are loaded onto a barge and shipped to the site.The hammer-sections, all of them equal except for small details, are built on the yard out of 6 subsections. These parts are measured in the yard and the production tolerance has been set to +/- 5 mm. At three positions, mirrors are on one side of the hammer-sections, two at the upper corners and one at the lower support region. The shape of the steel section, as measured in the yard, is related to these three mirrors which will be used to set the section on site. Since the site of the bridge is situated between two existing bridges the height of the transported parts is limited. Being 10,5 m high in upright position the hammer-sections have to be transported while laying on one side to reduce the height. This makes it impossible to apply the concrete deck in advance. Not earlier than on site the steel sections are erected.(UHFWLRQIn three building phases the hammer-sections are placed, four in the first two phases and three in the last. In order to be able to adjust the position of the section on the piers a temporary supporting frame is used. The hammer-section is set on hydraulic jacks, that is two on top of the pier and two on the supporting frame. During this operation, see fig. 8, the exact position of the hammer-sections is measured from the side of the existing railway bridge.In between the hammer-sections, thefield-sections are installed by strandlifts. For every hammer-section bothadjacent field-sections are lifted andequilibrium is achieved. In this way thefour bearings at each pier are equallyloaded and divergence is minimized to+/- 10 mm.The first building phase takes place inthe fall, the second in spring and thethird in the summer. In this relativeshort period of time the total length of1190 m is achieved. Between thephases, there will be a temperaturedifference. In order to minimisehandling of the large and heavy field-sections, the position of the hammer-sections is corrected in advance.After each building phase the formworkof the concrete deck is installed on thehammer-sections and the concrete deckis cast. In order to reduce the tensilestresses in the deck an initial gap of 2 m )LJ (UHFWLRQ RI KDPPHU VHFWLRQis left open between the prefab deck ofthe field-section and the in situ deck of the hammer-sections. Additional reinforcement is needed in the gap to account for the tensile stresses in the concrete of this intermediate part of the deck.The settlement of the piers is monitored during building progression. Based upon these intermediatemeasurements the height of the hammer-section can be adjusted. In this way the strict allowance of the height of the deck can be met.$SSURDFK EULGJHVAs the train may reach a speed of more than 300 km/h, the approaches must provide a smooth track to come from 20 m – NAP in the tunnel north from the bridge to 20 m + NAP on the summit of the bridge, in the middle of the river Hollandsch Diep.The alignment shows a maximum slope of 2,5 % and is curved with a horizontal radius of 15 km. At the south end of the bridge the approach connects the bridge with the track that runs through the polder at a level of 3 m – NAP.The height of the approaches varies continuously and all cross sections are different. The lower part of theMoreover the vertical settlements would make the piles bend thus reducing the bearing capacity furthermore.The possibility it was investigated if the structure could be corrected for horizontal movements by means of horizontal jacking. By making pile caps on vertical piles, a certain displacement cannot be avoided in that case, and by placing the approaches on Teflon sheet, it appeared to be feasible to move the last by means of hydraulic jacks in the opposite direction. The system would requirereaction points to support the jacks and anchor points to correct and fix the position of the parts in WKH SHULRG EHWZHHQ MDFNLQJ 6LQFH WKH。
负摩阻力数值模拟中,模量折减法比力水等效法更为合理,更能反映湿陷性黄土地基中的桩-土相互作用性状。
4 结论模量折减法概念清楚,操作简便,计算结果合理,较好地实现了对湿陷性黄土地基中桩基负摩阻力的数值模拟。
力水等效法对黄土湿陷变形的模拟是通过土体表面加均布荷载来实现的,这与天然黄土的湿陷变形在发生机理和实际效果上截然不同。
计算结果表明,在湿陷性黄土地基引发的负摩阻力数值模拟中,模量折减法比力水等效法更为合理,更能反映湿陷性黄土地基中的桩-土相互作用性状。
参考文献:[1]钱鸿缙,王继唐,罗宇生等.湿陷性黄土地基[M ].北京:中国建筑工业出版社,19851[2]A.A 穆斯塔伐耶夫著,张中兴译.湿陷性黄土上地基与基础的计算[M ].北京:水利电力出版社,19841[3]魏成国.湿陷性黄土地基桩基湿陷负摩阻力计算与研究[D ].西安:西安理工大学,20061[4]张厚先.湿陷性黄土地基大直径单桩的负摩阻力计算的试验研究[J ].施工技术,1994(9):36-381[5]黄雪峰,孙树勋等.大厚度自重湿陷性黄土场地人工成孔灌注桩负摩阻力沿桩身传递特征[C ].甘肃省土木建筑学会建会五十周年论文集,2002:144-1501[6]陈健,郑俊杰,陈保国等.考虑负摩阻力的刚性桩复合地基工作性状分析[J ].岩土力学,2008,29(7):1955-1959,19641收稿日期:2009-01-073国家自然科学基金项目(10572121),霍英东基金项目(94024)。
王广地,男,博士研究生。
波浪作用下悬浮隧道结构非线性动力分析3王广地 高 波 周晓军(西南交通大学土木工程学院 四川成都 610031)摘 要 考虑流体-结构耦联效应,利用非线性波浪力计算方法,建立了悬浮隧道结构非线性动力分析模型,并用ANSYS 有限元软件实现了求解。
通过两种计算模型的悬浮隧道结构动力响应分析对比表明:小位移情况下,两种模型计算得到悬浮隧道结构动力响应值差别较小;大位移情况下应采用非线性模型,采用线性计算模型得到悬浮隧道结构动力响应值出现较大偏差;悬浮隧道单跨长度以小于200m 为宜。
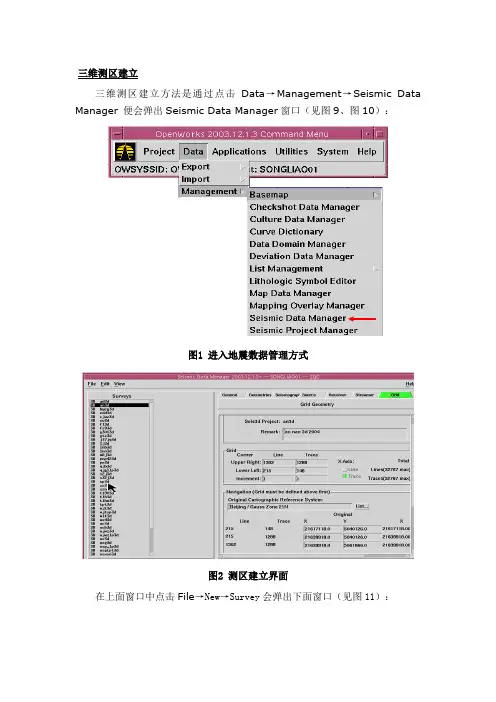
三维测区建立三维测区建立方法是通过点击Data→Management→Seismic Data Manager 便会弹出Seismic Data Manager窗口(见图9、图10):图1 进入地震数据管理方式图2 测区建立界面在上面窗口中点击File→New→Survey会弹出下面窗口(见图11):图3 建立三维测区方式在New Survey中选定工区类型为3D,工区名项输入an3d(敖南三维)后点击OK。
然后在下面窗口中填入工区备注:ao nan 3D 2004,按下面窗口(图12)中提示输入相应内容(右上角输入线号1302、道号1288,左下角输入线号215、道号148,线道号增量为1),X轴方向是线号还是道号的选项根据该方法进行选定,沿X轴方向看线号和道号哪个变化的快,那么X轴方向就选定谁。
当选定X轴方向为道号后,下面需要输入坐标的位置变亮,按照线道号提示输入相应的X、Y坐标后按Enter,系统便会自动计算出线道号间隔,如果线道号间隔正确,File→Save完成三维测区建立。
如果线道号间隔不正确,那么需要检查输入的X、Y坐标是否有误,修改后保存即可。
图4 测区信息输入界面二维测区建立在Seismic Data Manager 窗口(图13)点击File→New→Survey后,在New Survey窗口中选定工区类型为2D,工区名项输入ad2d(安达二维)后点击OK。
然后在备注栏填入an da er wei 1985,二维测区名建立完成,需要将安达二维工区的二维测线输入到该测区名下,便完成了安达二维测区的建立工作。
二维测线导航数据的输入通过点击Data→Import→Seismic Data load:图6 进入二维导航数据加载方式弹出下面二维导航数据加载窗口(见图15):图7 二维导航数据加载主界面在File项选择安达二维工区的导航数据文件ad.xy,文件格式要求是列排ACSII数据,在Format项选择格式文件2dimport,在Survey项选择前面建立的安达二维测区名ad2d,在CRS项选择Beijing / Gauss Zone 21N,由于格式文件不一定与输入文件相符,所以需要对格式文件进行编辑,点击窗口上方的Edit→Format进入格式文件编辑,见图16:图8 二维导航数据加载格式文件编辑界面然后编辑格式文件如上面窗口所示,然后Format→Save,退出该窗口后在2D Seismic Navigation Data Loader窗口点击File→Load便可完成二维导航数据的加载,二维导航数据加载完成后,便可进行二维测线列表和二维工区的建立。
特别策划·雅万高铁建设成就雅万高铁2号隧道洞口护拱及桩基结构参数设计朱双燕,席博阳,韩华轩,苗壮(中国铁路设计集团有限公司土建工程设计研究院,天津300308)摘要:雅万高铁2号隧道洞口为火山灰地层,进洞施工困难,采用桩基护拱结构辅助施工可以保证隧道进洞安全。
通过数值模拟计算,对桩基护拱结构的护拱长度以及桩基间距进行优化分析,并对桩基间距的影响规律建立了线性回归方程。
结论表明:随着护拱长度的增加,地层位移逐渐减少,当护拱长度大于20 m时,位移变化趋势减弱;随着桩基间距的增加,地层位移逐渐增大,且呈现正相关趋势增长;随着桩基长度增加,地层位移逐渐减少,当桩基嵌入较好岩层后,长度增加对地层位移减少作用不再明显。
针对雅万高铁2号隧道出口工程,选用护拱长度为20 m、桩基间距为2 m、桩基长度为20 m的支护结构时,现场地表监测沉降最大位移为23.7 mm,满足施工安全要求。
关键词:雅万高铁;隧道洞口支护;桩基护拱;数值模拟;参数优化中图分类号:U452 文献标识码:A 文章编号:1001-683X(2023)12-0061-08 DOI:10.19549/j.issn.1001-683x.2023.04.26.0021 概述印度尼西亚雅加达—万隆高速铁路(简称雅万高铁)是中国高铁“走出去”的第1个海外项目,也是东南亚第1条时速350 km高速铁路[1-5]。
其中雅万高铁2号隧道洞口为泥岩地层,隧道洞口偏压严重[6-8]。
现场采用桩基护拱结构对洞口施工进行加固,由于隧道洞口地质条件的特殊性和复杂性,在隧道施工过程中如不对支护措施参数进行研究,势必影响坡体应力平衡状态,形成滑坡、崩塌等地质灾害。
目前,有学者对隧道进洞施工桩基护拱支护措施进行了研究。
陶志平等[9]在调研30座施工和运营期基金项目:中国铁路设计集团有限公司科研应用研究项目(7218104)第一作者:朱双燕(1996—),男,助理工程师。
桥梁建设 2013年第43卷第6期(总第223期)Bridge Construction,Vol.43,No.6,2013(Totally No.223)文章编号:1003-4722(2013)06-0019-08基于OpenSees的FRP约束混凝土本构开发及墩柱性能分析何铭华1,栾雨琪1,刘 晖1,汪正兴2(1.清华大学土木工程系,土木工程安全与耐久教育部重点实验室,北京100084;2.中铁大桥局集团桥科院有限公司,湖北武汉430034)摘 要:OpenSees的纤维单元技术成熟,非线性分析能力强,可应用于桥梁和结构工程的精细化分析,由于OpenSees的材料本构库缺乏完备的纤维增强塑料(FRP)约束混凝土本构,为了用于FRP约束混凝土墩柱分析,需要进行FRP约束混凝土本构开发。
通过对部分FRP约束混凝土本构模型进行总结和分析,提出改进的Lam-Teng模型,编制程序将其嵌入OpenSees的材料本构库,成功实现对OpenSees的材料库扩充。
对3组FRP约束混凝土墩柱的轴压破坏试验、1组圆形截面FRP约束混凝土墩柱的水平往复加载试验以及1组FRP加固既有损伤桥墩的加固后滞回性能试验进行了数值模拟,计算预测结果与试验结果吻合程度较好。
研究工作表明,基于OpenSees进行本构模型开发的技术路线可行;改进的Lam-Teng模型能准确刻画FRP约束混凝土墩柱的受力性能,预测结果准确可靠。
关键词:OpenSees;纤维增强塑料;约束混凝土;桥墩;纤维单元中图分类号:TU391;TU279.72文献标志码:A收稿日期:2013-05-25基金项目:国家自然科学基金面上项目(51378292);中国博士后科学基金面上项目(2013M530048);国家自然科学基金重点项目(51038006);高速铁路基础研究联合项目(U1134110)General Project of National Natural Science Foundation of China(51378292);General Project of China Postdoctoral ScienceFoundation of China(2013M530048);Key Project of National Natural Science Foundation of China(51038006);High SpeedRailway Fundamental Research Joint Project(U1134110)作者简介:何铭华,助理研究员,E-mail:heminghua@tsinghua.edu.cn。
第 54 卷第 3 期2023 年 3 月中南大学学报(自然科学版)Journal of Central South University (Science and Technology)V ol.54 No.3Mar. 2023基于数值仿真的复杂岩体TBM 掘进性能评估模型赵高峰1,姜宝元1,芮福鑫1,马洪素2,李洁勇3,赵晓豹4,龚秋明5(1. 天津大学 建筑工程学院 水利工程仿真与安全国家重点实验室,天津,300354;2. 核工业北京地质研究院 中国原子能机构高放废物地质处置创新中心,北京,100029;3. 中国铁建股份有限公司华东区域总部,浙江 杭州,310000;4. 南京大学 地球科学与工程学院,江苏 南京,210023;5. 北京工业大学 城市防灾与减灾教育部重点实验室,北京,100124)摘要:为了评估全断面隧道掘进机(TBM)在复杂岩体环境中的掘进性能,本文提出了基于数值仿真的全断面TBM 掘进预测模型。
首先,采用4D-LSM 和DDA 耦合模型数值重现工程尺度完整岩体和节理岩体的TBM 掘进测试过程,分析全断面TBM 掘进过程中刀盘的力学响应和岩体的破坏特征;其次,研究节理间距、节理方向、岩体单轴抗压强度以及脆性指数对可钻性指数的影响;最后,引入单神经元对数值仿真预测模型进行修正,并与岩体特征模型进行对比分析,验证基于数值仿真的全断面TBM 掘进性能预测模型的适用性。
研究结果表明:TBM 在低强度、高脆性以及节理发育的岩体中掘进效率更高,当节理面与TBM 掘进方向之间的夹角为60°~75°时,最有利于TBM 的运行。
基于数值仿真的TBM 掘进性能预测模型提供了一种经济、灵活的可用于评估复杂环境中TBM 施工性能的方法。
关键词:全断面隧道掘进机;全尺寸TBM 破岩模拟;掘进性能预测;耦合数值模型;离散弹簧模型;非连续变形分析方法中图分类号:U455 文献标志码:A 开放科学(资源服务)标识码(OSID)文章编号:1672-7207(2023)03-0984-14TBM tunneling performance evaluation model in complex rockmasses based on numerical simulationZHAO Gaofeng 1, JIANG Baoyuan 1, RUI Fuxin 1, MA Hongsu 2, LI Jieyong 3,ZHAO Xiaobao 4, GONG Qiuming 5(1. State Key Laboratory of Hydraulic Engineering Simulation and Safety, School of Civil Engineering, TianjinUniversity, Tianjin 300354, China;收稿日期: 2022 −09 −20; 修回日期: 2022 −11 −18基金项目(Foundation item):国家自然科学基金资助项目(51979187) (Project(51979187) supported by the National Natural ScienceDOI: 10.11817/j.issn.1672-7207.2023.03.016引用格式: 赵高峰, 姜宝元, 芮福鑫, 等. 基于数值仿真的复杂岩体TBM 掘进性能评估模型[J]. 中南大学学报(自然科学版), 2023, 54(3): 984−997.Citation: ZHAO Gaofeng, JIANG Baoyuan, RUI Fuxin, et al. TBM tunneling performance evaluation model in complex rock masses based on numerical simulation[J]. Journal of Central South University(Science and Technology), 2023, 54(3): 984−997.第 3 期赵高峰,等:基于数值仿真的复杂岩体TBM掘进性能评估模型2. CAEA Innovation Center on Geological Disposal of High-level Radioactive Waste, Beijing Research Institute ofUranium Geology, Beijing 100029, China;3. East China Regional Headquarters of China Railway Construction Corporation Limited,Hangzhou 310000, China;4. School of Earth Sciences and Engineering, Nanjing University, Nanjing 210023, China;5. Key Laboratory of Urban Security and Disaster Engineering of Ministry of Education, Beijing University ofTechnology, Beijing 100124, China)Abstract:In order to evaluate the tunneling performance of full-face tunnel boring machine(TBM) in complex rock environments, a full-face TBM tunneling prediction model based on numerical simulation was proposed.Firstly, the 4D-LSM and DDA coupled model was used to numerically reproduce the TBM tunneling tests of engineering-scale intact rock mass and jointed rock mass. The mechanical response of the cutterhead and the failure characteristics of the rock mass during the tunneling process of the full-face TBM were analyzed. Secondly, the effects of joint spacing, joint orientation, uniaxial compressive strength and brittleness index on the boreability index were investigated. Finally, a single neuron was introduced to revise the numerical simulation prediction model. The comparative analysis was conducted with rock mass characteristic model, which verified the applicability of the full-face TBM tunneling prediction model based on numerical simulation. The results show that the tunneling efficiency of TBM is higher in rock mass with low strength, high brittleness and developed joints. The angle between joints and the tunneling direction of TBM is 60° to 75°, which is most conducive to the operation of TBM. TBM tunneling performance prediction model based on numerical simulation provides an economical and flexible method for evaluating TBM construction performance in complex environments.Key words: full-face tunnel boring machine; full-scale TBM rock breaking simulation; tunneling performance prediction; coupled numerical model; distinct lattice spring model(DLSM); discontinuous deformation analysis method(DDA)岩石高效破碎一直是岩石工程领域的热点,涉及矿产资源开发、地下空间建设等。

www.midas-diana.com/gts 1 midasGTS Applications Selected case studies 2 www.midas-diana.com/gts www.midas-diana.com/gts 3
Table of content Underground PC Culvert water line connection to shoreline dock................................................4 Underground path construction at a new building.........................................................................6 Sosa ~ Nogsan new roadway.......................................................................................................8 Train car depot construction for Busan subway line 3................................................................10 Sosa ~ Nogsan tunnels...............................................................................................................12 New expressway route 60...........................................................................................................14 Busan subway line 3 tunnel – zone 321......................................................................................16 South coast highway expansion (Sachun – SaIn).......................................................................18 New building construction...........................................................................................................20 Sosa – Nogsan roadway construction.........................................................................................22 Excavated tunnel construction....................................................................................................24 Analysis for effects on subway tunnels due to construction of a new building...........................26 Overflow weir construction..........................................................................................................28 Mining shaft/tunnel construction..................................................................................................30 Tunnel stability analysis through a weak zone............................................................................32 High speed train track construction.............................................................................................34 Kosack – Soowon new roadway..................................................................................................36 High speed train track construction.............................................................................................38 Sewage discharge network construction.....................................................................................40 Sewage pipe network construction.............................................................................................42 Sewage pipe network construction.............................................................................................44 Temporary railway bridge 1.........................................................................................................46 Temporary railway bridge 2.........................................................................................................48 A new roadway construction.......................................................................................................50 Seismic design through dynamic analysis..................................................................................52 Bridge – Foundation design.........................................................................................................54 A new subway line construction..................................................................................................56 Analysis check for a weak fault zone..........................................................................................58 Bridge and underpath design......................................................................................................60 A new roadway construction.......................................................................................................62 Kosack – Soowon new roadway..................................................................................................64 Y22 new development project.....................................................................................................66 Seoul new City Hall.....................................................................................................................68 Dubai Tower, Doha, Qatar..........................................................................................................70
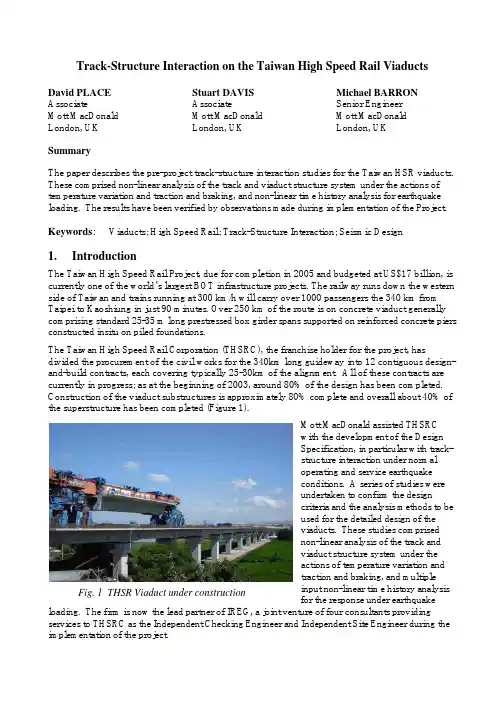
Track-Structure Interaction on the Taiwan High Speed Rail ViaductsDavid PLACEAssociateMott MacDonaldLondon, UKStuart DAVIS Associate Mott MacDonald London, UK Michael BARRON Senior Engineer Mott MacDonald London, UKSummaryThe paper describes the pre-project track-structure interaction studies for the Taiwan HSR viaducts. These comprised non-linear analysis of the track and viaduct structure system under the actions of temperature variation and traction and braking, and non-linear time history analysis for earthquake loading. The results have been verified by observations made during implementation of the Project.Keywords : Viaducts; High Speed Rail; Track-Structure Interaction; Seismic Design1. IntroductionThe Taiwan High Speed Rail Project, due for completion in 2005 and budgeted at US$17 billion, is currently one of the world’s largest BOT infrastructure projects. The railway runs down the western side of Taiwan and trains running at 300 km/h will carry over 1000 passengers the 340 km from Taipei to Kaoshiung in just 90 minutes. Over 250 km of the route is on concrete viaduct generally comprising standard 25-35 m long prestressed box girder spans supported on reinforced concrete piers constructed insitu on piled foundations.The Taiwan High Speed Rail Corporation (THSRC), the franchise holder for the project, hasdivided the procurement of the civil works for the 340km long guideway into 12 contiguous design-and-build contracts, each covering typically 25-30km of the alignment. All of these contracts are currently in progress; as at the beginning of 2003, around 80% of the design has been completed. Construction of the viaduct substructures is approximately 80% complete and overall about 40% of the superstructure has been completed (Figure 1). Mott MacDonald assisted THSRCwith the development of the DesignSpecification, in particular with track-structure interaction under normaloperating and service earthquakeconditions. A series of studies wereundertaken to confirm the designcriteria and the analysis methods to beused for the detailed design of theviaducts. These studies comprisednon-linear analysis of the track andviaduct structure system under theactions of temperature variation andtraction and braking, and multipleinput non-linear time history analysis for the response under earthquakeloading. The firm is now the lead partner of IREG, a joint venture of four consultants providing services to THSRC as the Independent Checking Engineer and Independent Site Engineer during the implementation of the project.Fig. 1 THSR Viaduct under construction2. Track-Structure Interaction in Normal OperationTrack-structure interaction is the transfer of the traction and braking longitudinal loads between the track and the viaduct deck through the ballast. Ballast behaviour under these actions is non-linear and load and temperature dependent. The viaducts are a succession of simply supported spans such that no rail movement joints are needed, however it is essential that the viaduct is designed to limit the relative displacements between decks to 5mm so that the rails are not overstressed or the ballast destabilised under the traction and braking loads. The fundamental principles of the analysismethod to calculate the relative displacements are given in the Eurocode, but use of these requires a finite element analysis modelling the elasto-plastic friction behaviour between the track and the bridge deck. The studies were aimed at providing simplified methodology for use at the detailed design stage. Existing in-house software was adapted to analyse models comprising elastic deck and track members connected by non-linear ballast members as shown in Figure 1. The method and results were validated, and the process was automated to analyse as many structures as possible in the time available. A parametric study was then conducted to determine the key factors affecting track-structure performance, and to develop the simplified method of analysis.Fig. 2 Track-Structure Interaction Analysis Model Nearly 800 non-linear models, each with 25 viaduct spans, were created and analysed. Analysis was carried out in two stages. In the first stage, seasonal temperature expansion or contraction was applied to the viaduct with the train absent. Loads in the ballast members were extracted from this model and used to provide the starting position for the second stage analysis with the vertical load of the train and traction/braking loading. The ballast stiffnesses used, and examples of the viaduct models analysed are shown in Figure 3. Models with pier heights from 8m to 25m were analysed. All the piers had the same cross section and the same foundation stiffness, and by converting pier heights to equivalent substructure stiffnesses, it was possible to express the geometric relationship between the taller piers and the standard piers in a dimensionless form. By determining the stiffness ratio of the taller piers to the standard piers at which the 5mm limit on relative displacement between decks was reached, a series of design charts were produced as shown in Figure 4.B a l l a s t S t i f f n e s s DisplacementFig. 3 Ballast Stiffness and Viaduct ModelsFig. 4 Example of Design Chart3. Track-Structure Interaction under the Service EarthquakeTaiwan is one of the most seismically active areas in the world and the viaducts are designed to resist without collapse seismic forces arising from design peak ground accelerations up to 0.4g, and to remain fully serviceable under a PGA of one third of this. To ensure that trains on the viaduct can brake safely to a stop from full design speed during service event earthquakes, track displacements must remain within the allowable values with the structure subjected to dead load, temperature variation, train braking load, and seismic excitation. For long structures, spatial variations inseismic ground motions can be significant even for uniform site conditions due to complex mechanisms such as wave passage, scattering, and attenuation effects. Hence non-linear timehistory analysis was adopted, and three orthogonal displacement time histories were generated at each support location to match the seismic design spectra and statistical spatial coherency functions. Since the track displacement is a function of both vertical load and loading history, a series of three-dimensional non-linear finite element analyses were performed simulating the loading sequence. Dead load was applied to the structure first without the presence of rail or ballast elements. Railand ballast elements were then “birthed” and temperature variation was applied to the girders. Following ballast property modifications to account for train vertical loading, train braking loads were imposed on the structure and the structure was subjected to earthquake ground displacements. Relative movements at the track centrelines and the forces in the rails were recovered for assessment of track/structure performance, the key parameter being a limit on relative displacement between decks of 25mm.The computer program ADINA was used. Figure 5 shows the finite element modelling to represent the viaduct. Beam elements represent the bridge deck, columns and rails; contact surfaces with friction simulate ptfe sliding bearings at the free ends of the box girders at the connection to the column; non-linear plastic truss elements simulate the ballast in the longitudinal direction; and rigid links and stiff springs the interconnection of these components. The pile cap is modelled as a rigid system between the base of each column and the soil, with the mass lumped at the pile cap’s centre. The soil-structure interaction matrix forms the interface between the underside of the pile cap andthe ground such that the supporting soil nodes are the boundaries of the model and represent thefree-field ground in the vicinity of each foundation. The free-field ground motions are applied to theboundaries of the model, across the soil structure interaction matrices, and these displacements subject the structure to the seismic excitation. The free-field ground is assumed to move with a displacement history that is unaffected by the presence of the structure.Figure 6. The uniform model represents a typical viaduct crossing flat terrain with uniform pier heights of 10m and a pier cross section 2.7m square, and the valley model a crossing over a gentle valley with pier heights varying from 10m to 18m. For each configuration, the 25 spans represent part of a viaduct that could be many kilometres in length. The 750m length of the viaduct model is able to accommodate the 300m long train with the train located sufficiently far from the boundaries of the model, such that boundary effects are negligible.Uniform ModelFig. 6 Viaduct Models for Seismic AnalysisThe static and dynamic loads were imposed on the structure in the following sequence. First, a non-linear static analysis was performed for dead load and temperature through an incremental load step solution procedure using the full Newton method for equilibrium iterations. The temperature rise was applied to the deck concrete box girders only. Next, longitudinal and vertical loads were applied statically to one of the two tracks to simulate the train braking at the onset of the seismicevent. The vertical load is the weight of the train and the braking force is a uniformly distributed longitudinal load over a 300m long segment of the viaduct between Piers 7 and 17. Finally, a multiple support input non-linear dynamic analysis was performed for 28 seconds of seismic load using a step-by-step direct time integration method. The Newmark method, an implicit finite difference solution scheme, was employed to solve the problem in the time domain with time increments of 0.01 second. For each time step, the full Newton method was used for the equilibrium iterations.The initial studies showed that with the proposed viaduct configuration and structural geometries, except for sections of viaduct with tall relatively slender piers, track structure performance would be within the 25mm limit for relative displacement between decks. This relative displacement is the aggregated effect at the track centreline of longitudinal movement due to braking and seismic motions, beam end rotation under vertical load, and angular bending in plan due to transverse seismic motions. However the information obtained was insufficient to develop usable criteria for simplifying the design process. In subsequent studies, a series of simplified analyses were conducted to examine the sensitivity of the structural response to various simplifying assumptions. Simpler modelling of the coupling between decks through the track ballast system was seen as particularly desirable, and hence a number of linear response spectrum and time history analyses were undertaken. Results from single versus multiple support excitations, linear versus non-linear ballast and bearing behaviour, and use of response spectrum versus time history analyses on the response of both models were studied in detail. Comparisons of the responses of the valley model using response spectrum, linear and non-linear time history analysis are presented in Figure 7.Fig. 7 Comparison of Relative Displacements4. Observations during Implementation of the ProjectThe majority of the designers for the THSR Project have carried out the track-structure interaction analysis solely on the basis of the non-linear time history method, including the coupling effects of the track. However, several of the designers have also presented results of analyses using linear response spectrum methods without track. In addition, the authors’firm, as Independent CheckingEngineer, has carried out a number of check analyses using a variety of methods. It has therefore been possible to make some comparisons between the results.Using the linear response spectrum method, disregarding the track, the relative longitudinal displacements at joints under earthquake are generally in the range 15 to 40 mm, but in some cases as high as 60 mm. Using the non-linear time history method, including the track, the relative displacements under earthquake were always found to reduce to values comfortably within the specification limit. Indeed, the maximum displacement calculated by any of the designers or by the Independent Checking Engineer for the standard viaducts is around 12 mm (worst case with highly non-uniform stiffnesses with adjacent piers). Typical values with reasonably consistent pier top stiffnesses are around 5 mm. These results are in good agreement with the pre-project work described in Sections 2 and 3 of this paper.The THSR Design Specification limits rail stresses to 167 MPa in tension and 147 MPa in compression, values that are considered to provide an acceptable margin of safety against either fracture or buckling. The rail stress can only be reliably checked by means of a non-linear time history analysis, with the non-linear connections between the rails and the structure properly modelled. The designers were provided with bilinear (elastic/plastic) stiffness relationships for the trackwork for use in their models, as shown in Figure 3. The designers have generally reported rail stresses from their analyses that are comfortably within the specification limits – commonly up to a maximum of 100 MPa. The checks carried out by the Independent Checking Engineer have revealed similar results.5. ConclusionsFrom pre-project studies, confirmed by reviews and checks of the actual designs for the THSR Project, it is clear that unless the appropriate track-structure interaction analysis methods are adopted the displacements at structure joints can be over-estimated, and that this could lead to uneconomic design.It is essential to perform a track-structure interaction analysis based on non-linear modelling incorporating the coupling between the track and the viaduct decks, and using appropriate acceleration time histories as ground motion input. The stiffness of the foundation must be included in the model, although the response of the structure itself often dominates the displacements at deck level, particularly for high piers. A key requirement is to model as accurately as possible the non-linear interface between the track and the structure, in order to derive peak rail stresses in addition to the relative displacements between viaduct spans at structure movement joints.On the Taiwan High Speed Rail Project, using the above approach, it has been found that that the relative longitudinal displacements between viaduct spans remain comfortably within the limit specified. Similarly, peak rail stresses are generally well below the limits required to provide a margin of safety against either fracture or buckling. Typically, for ‘service’level PGAs of up to 0.13g, peak relative displacements are of the order of 12 mm and peak rail stresses in the range 80 – 100 MPa. Nevertheless, a minimum level of structure stiffness is necessary to achieve compliance with the requirements and large variations in stiffness between adjacent piers are to be avoided. AcknowledgementsThe permission of the Taiwan High Speed Rail Corporation (THSRC) to publish this paper is gratefully acknowledged.The Independent Checking Engineer for the THSR Project is IREG (International Railway Engineering Group), a Joint Venture of DE-Consult, Electrowatt Engineering, Mott MacDonald and SYSTRA.。
DIVISION 4 - DRAINAGE WORKS Culverts and Concrete Drains - Section 04300 SECTION 04300 - CULVERTS AND CONCRETE DRAINSTABLE OF CONTENTS1.DESCRIPTION (1)2.MATERIAL REQUIREMENTS (1)2.1R EFERENCE S TANDARDS (1)2.2B EDDING (1)2.3C ONCRETE (2)2.4R EINFORCING S TEEL FOR C ONCRETE (2)2.5R EINFORCED C ONCRETE C ULVERT P IPES (3)2.6M ORTAR (3)2.7P OROUS B ACKFILL OR F ILTER M ATERIAL (3)2.8B ACKFILL (3)2.9R IP-R AP (3)3.CONSTRUCTION REQUIREMENTS (4)3.1S HOP D RAWINGS AND S CHEDULE (4)3.1.1S HOP D RAWINGS (4)3.1.2W ORK S CHEDULING (4)3.2R ECTIFYING AND M AINTENANCE (4)3.2.1R ECTIFYING U NSATISFACTORY W ORK (4)3.2.2M AINTAINING A CCEPTED W ORK (4)3.3S ITE P REPARATION (4)3.4P LACING R EINFORCED C ONCRETE C ULVERT P IPES (5)3.5C LEANING C ULVERTS (6)3.6C ULVERT H EADWALLS,I NLETS, AND O UTLETS (6)4.MEASUREMENT AND PAYMENT (6)4.1M ETHOD OF M EASUREMENT (6)4.2B ASIS OF P AYMENT (7)TECHNICAL SPECIFICATIONS - DIVISION 412/10/09 04300 - iDIVISION 4 - DRAINAGE WORKS Culverts and Concrete Drains - Section 04300 SECTION 04300 - CULVERTS AND CONCRETE DRAINS1.DESCRIPTIONThis work shall consist of constructing new reinforced concrete pipe culverts andstorm drains. This work shall include headwalls, inlet and outlet structures,cradles, as well as associated erosion and scour protection works. All of this workshall be in accordance with the Drawings and this Specification Section and at thelocations indicated by the Engineer.2.MATERIAL REQUIREMENTS2.1R EFERENCE S TANDARDSThe following Standards in their latest edition shall be particularly applied toWorks covered by this Specification.♦22 TCN 159-86 Standard for Pre-cast Reinforced Concrete RoundCulvert Design♦22 TCN 18-79 Standard for Bridge and Culvert Design Under LimitState♦22 TCN 272-05 Standard for Bridge Design♦AASHTO T11 Materials Finer Than 75-µm (No. 200) Sieve in MineralAggregates by Washing♦AASHTO T27 Sieve Analysis of Fine and Coarse Aggregates♦AASHTO T87 Dry Preparation of Disturbed Soil and Soil AggregateSamples for Test♦AASHTO T88 Particle Size Analysis of Soils♦AASHTO T89 Determining Limit Liquid of Soils♦AASHTO T90 Determining Plastic Limit and Plasticity Index of Soils♦AASHTO M170 Reinforced Concrete Culvert, Storm Drain and SewerPipe2.2B EDDING2.2.1B EDDING MATERIALS(a)Sand bedding shall be a porous, free-draining granular material, free ofexcess moisture, muck, roots, sod, or other deleterious material anduniformly graded from coarse to fine meeting the gradation as shownbelow. The material should also conform to the following requirements: TECHNICAL SPECIFICATIONS - DIVISION 412/10/09 04300 - 1 of 7DIVISION 4 - DRAINAGE WORKS Culverts and Concrete Drains - Section 04300TECHNICAL SPECIFICATIONS - DIVISION 4 12/10/09 04300 - 2 of 7Sand Bedding Gradation Sieve Size Percent by Weight Passing Designated Sieve(AASHTO T27 and T11)12.5mm 100 No. 200 0 - 75 ♦Plasticity Index, AASHTO T90 6 max. ♦Liquid Limit, AASTTO T89 30 max. (b) Lean concrete bedding shall be bedding or blinding in accordance with therequirements of Specification Section 06100 “Concrete and ConcreteStructures”.2.2.2 G RANULAR BEDDING MATERIALGranular bedding material may be sand, sandy gravel, or crushed stone. It shallconform to the requirements contained in Table No. 1.TABLE NO. 1Granular Bedding Material Requirements Maximum Particle Size (AASHTO T88) 20 mm or less, but at least twice the maximum clear gap in any un-mortared pipe jointPassing No. 200 Sieve (AASHTO T88) 15% maximumPlasticity Index (AASHTO T90) 6 maximumLiquid Limit (AASHTO T89)25 maximum2.3 C ONCRETEConcrete used for all structural work described in this Specification Section shallconform to the requirements specified in Specification Section 06100 “Concreteand Concrete Structures”.2.4 R EINFORCING S TEEL FOR C ONCRETEAll reinforcing steel used in the works shall conform to the requirements specifiedin Specification Section 06400 “Reinforcing Steel”.DIVISION 4 - DRAINAGE WORKS Culverts and Concrete Drains - Section 043002.5R EINFORCED C ONCRETE C ULVERT P IPES(a)Reinforced concrete pipes shall be of precast reinforced concrete and shallconform to the specification of 22 TCN 159-86. Unless otherwise approvedby the Engineer or indicated in the Drawings, the Contractor shall use pipeswith tongue and groove joints. Reinforcement in all pipes shall consist ofcircular bars as shown on the Drawings.(b)The Engineer will periodically inspect the pipe manufacturing plants toensure compliance with approved manufacturing methods. The Contractorwill supply material samples for laboratory testing to ensure qualitycompliance, and will do all the necessary arrangements to facilitate theinspection by the Engineer; the inspection will also cover all the reinforcedconcrete pipes. Depending upon the results obtained by the inspection, theEngineer will issue the approval for permitting the Contractor to lay anypipe.(c)Unless otherwise indicated on the drawings or required by the Engineer, alljoints for reinforced concrete culvert pipes shall be flexible joints inaccordance with 22 TCN 159-86.2.6M ORTARMortared joints shall only be used if required by the Engineer, or so indicated onthe Drawings. If/when required mortar for pipe joints and collars shall becomposed of 1 part Portland cement and 3 parts fine aggregate by volume, towhich hydrated lime may be added in an amount equal to 10 percent of thecement by weight. The mortar shall have a compressive strength of at least50 kg/cm2 at 28 days.2.7P OROUS B ACKFILL OR F ILTER M ATERIALPorous Backfill or Filter Material shall be in accordance with the provisions ofSpecification Section 03700 “Granular Backfill” or as directed by the Engineer.2.8B ACKFILLFill material used in the works shall conform to the requirements specified inSpecification Section 03400, “Embankment Construction”.2.9R IP-R APStone used in the works for riprap shall conform to the requirements specified inSpecification Section 04200, “Mortared Stonework and Rip-Rap”.TECHNICAL SPECIFICATIONS - DIVISION 412/10/09 04300 - 3 of 7DIVISION 4 - DRAINAGE WORKS Culverts and Concrete Drains - Section 04300 3.CONSTRUCTION REQUIREMENTS3.1S HOP D RAWINGS AND S CHEDULE3.1.1S HOP D RAWINGSThe Contractor shall furnish Shop Drawings containing the construction detailsfor culverts and concrete drains indicated on the Drawings and as directed by theEngineer. Shop drawings shall be submitted to the Engineer, within the periodestablished in the General Specifications for submittals of the Contractor, forrespective approval prior to the start of the construction of culverts and concretedrains. Construction of the culverts and drains shall begin only after the issuanceof the Engineer’s approval to the shop drawings submitted by the Contractor.3.1.2W ORK S CHEDULING(a)The Contractor shall not begin culvert or concrete drain work without theEngineer’s approval on the schedule and construction method proposed bythe Contractor. Temporary drainage work shall be in place and operatingbefore beginning embankment works, or as directed by the Engineer.(b)All culvert, head-walls and other minor structures below the subgradelevel must be complet before constructure subgrade layer.3.2R ECTIFYING AND M AINTENANCE3.2.1R ECTIFYING U NSATISFACTORY W ORKAll the work and materials for construction of culverts and drains shall beinspected by the Engineer before its approval on quality and dimensions. Basedon the results obtained by the inspection, the Engineer will issue its approval onthe inspected work, or will instruct to the Contractor for the necessary provisionsfor rectifying unsatisfactory work.3.2.2M AINTAINING A CCEPTED W ORKNotwithstanding the Contractor’s obligation to rectify unsatisfactory or failedwork, the Contractor shall also be responsible for routine maintenance of allcompleted and accepted culverts and drains throughout the Contract Period andthe Defect Liability Period. No separate measurement or payment shall be madefor such routine maintenance3.3S ITE P REPARATIONThe Contractor shall excavate and prepare trenches and foundations for concreteand mortared stone-lined drains, as well as, culverts in accordance with theprovisions of Specification Section 03200 “Structural Excavation” and TECHNICAL SPECIFICATIONS - DIVISION 412/10/09 04300 - 4 of 7DIVISION 4 - DRAINAGE WORKS Culverts and Concrete Drains - Section 04300 Section 03400 “Embankment Construction”. The Contractor shall be responsiblefor all dewatering of the trenches during construction. The Contractor shall placesupports and/or bedding material in accordance Drawing requirements or asrequired by the Engineer in conformance with applicable Specification Sections.3.4P LACING R EINFORCED C ONCRETE C ULVERT P IPES(a)The Contractor shall excavate culvert trenches to the required depth. Thebed shall provide a uniform and continuous support under the entire lengthof the pipe.(b)The trench width shall be a plane 500 mm measured from the outer walls ofthe pipe. The Engineer, at his discretion, may allow extra trench widths, butthe Contractor shall receive no additional payment for the wider trenchexcavation.(c)The side slopes of the trenches shall be adopted to suit the soil stability. Ifthe Contractor over-excavates the culvert trench, he shall fill the void to theproper level with material approved by the Engineer at the Contractor’sown expense.(d)The Contractor shall lay reinforced concrete pipes carefully. The hubs orgrooved ends shall be up grade. The spigots or tongued ends shall be fullyentered into the adjacent hub or groove and be true to the required lines andgrades.(e)Before laying succeeding sections of reinforced concrete pipe which do notrequire cambering, the Contractor shall plaster the lower half of the hub ofthe preceding sections on the inside with Portland cement mortar. Themortar shall be sufficiently thick to bring the inner surface of the abuttingpipes flush and even. The Contractor shall plaster the upper half of thespigot of the succeeding pipe with mortar at the same time.(f)After laying the reinforced concrete pipe, the Contractor shall fill theremainder of the joint with sufficient mortar to form a bead around the joint.The Contractor shall wipe the inside of the joint and finish it to a smoothand even surface. The mortar on the outside shall be cured and remaindamp for two days or until the Engineer allows backfilling to proceed.(g)The Contractor shall not backfill any pipe until the Engineer inspects andapproves the site conditions. The Contractor shall backfill and compact thesoil around and over the reinforced concrete culvert pipes as specifiedherein using material conforming to the requirements given for SelectedGranular Embankment. The material shall consist of soil or gravel free ofclay lumps and organic matter. The backfill material shall contain no stones TECHNICAL SPECIFICATIONS - DIVISION 412/10/09 04300 - 5 of 7DIVISION 4 - DRAINAGE WORKS Culverts and Concrete Drains - Section 04300 that would be retained on a 25 mm sieve. Oversized material shall beremoved at the source of the material.(h)The Contractor shall take the fill to a minimum height of 50 cm above thetop of the pipe. Unless in a trench, the fill shall extend for a minimumdistance of one and a half diameters from the centerline of the pipe on eachside of the pipe. The Contractor shall take special care to compact thebackfill under the haunches of the pipe properly. The backfill shall bebrought up evenly on both sides of the haunches for the entire pipe length.(i)Heavy earth moving and compacting equipment shall not operate closerthan 1.5 meters from the outer of culvert until the cover above the pipe is atleast 50 cm. Light weight equipment may operate within the limitationmentioned above provided the backfill is placed and compacted at least30 cm above the top of the pipe. Notwithstanding these conditions, theContractor shall be responsible for and shall rectify any damage resultingfrom such operations.3.5C LEANING C ULVERTSThe Contractor shall clean all culverts until they are free of loose debris, soil, andall foreign material. The Contractor shall keep the culverts clean and maintainthem in an operating condition throughout the Contract Period. The Contractorshall only permit water to flow through the cleaned culvert after the Engineerinspects and approves the culvert.3.6C ULVERT H EADWALLS,I NLETS, AND O UTLETSUnless otherwise shown on the Drawings, the Contractor shall construct allculvert aprons, wingwalls, and headwalls using reinforced concrete of the classindicated in the Drawings and in accordance with requirements and provisions ofSpecification Section 06100 “Concrete and Concrete Structures. Scour protectionworks will normally be mortared rip-rap unless indicated in the drawings.4.MEASUREMENT AND PAYMENT4.1M ETHOD OF M EASUREMENT(a)The reinforced concrete pipe culvert quantities will be measured forpayment by the number of linear meters (measurment at the center line) ofthe placed new structure. This quantity shall be measured as the actualplaced length of reinforced concrete pipe of a specified diameter, includingall cradles, cement mortar, two layers of bituminous coating, and joints.(b)No separate measurement for payment will be made for excavation, backfill,concrete, reinforced steel and bedding for the culvert pipes.TECHNICAL SPECIFICATIONS - DIVISION 412/10/09 04300 - 6 of 7DIVISION 4 - DRAINAGE WORKS Culverts and Concrete Drains - Section 04300(c)The cost of other work is deemed incidental to constructing the culvert ordrain work. The cost is included in the prices tendered for the culvert pipesand for the various construction materials used.4.2B ASIS OF P AYMENTThe accepted quantities, measured as provided above, shall be paid at the contractprice per unit of measurement for the pay items listed below that are shown in theBill of Quantities. Payment will be full compensation for the work prescribed inthis Section including furnishing and placing all the material, all necessary jointmaterials for concrete pipes and for furnishing all labor, materials, tests, tools,equipment and any incidentals to complete the work as shown on the Drawingsand as required in accordance with these Specifications and/or as directed by theEngineer.Pay Item Description Unit04300-04 Reinforced Concrete Pipe Culvert, Type CP-750 lm04300-07 Reinforced Concrete Pipe Culvert, Type CP-1250 lm04300-08 Reinforced Concrete Pipe Culvert, Type CP-1500 lm04300-09 Reinforced Concrete Pipe Culvert, Type CP-2000 lm TECHNICAL SPECIFICATIONS - DIVISION 412/10/09 04300 - 7 of 7。
2006年4月第2期(总92) 铁 道 工 程 学 报JOURNAL OF RAILWAY ENGINEERING SOCIETY Apr 2006NO.2(Ser.92)*收稿日期:2005-09-26 赵万强 高级工程师 男 1970年出生文章编号:1006-2106(2006)02-0052-07遂渝铁路荆竹岭隧道复杂地质段设计赵万强*(铁道第二勘察设计院, 四川成都610031)摘要:研究目的:消除荆竹岭隧道发生岩溶突水引起施工灾害事故发生可能,避免过可溶岩段地下水大量漏失破坏水环境引起地表塌陷,解决隧道过巨大溶洞群、地下暗河、岩溶突泥段及石膏层膨胀腐蚀性对隧道结构强度、稳定、耐久性的影响问题。
研究方法:本着治水、环保、安全、运营救援相结合的理念,系统设置辅助坑道、特殊地质段加强超前地质预报、富水地段帷幕注浆堵水与岩溶暗河疏导排水相结合,并运用ANASYS 程序数值仿真计算。
研究结果:完成隧道跨越“溶洞、暗河、突泥段”设计、石膏地层段支护结构设计、抗水压衬砌设计。
研究结论:本隧富水段、岩溶暗河段的防排水设计理念及复杂地质段设计措施,确保了隧道结构的施工、运营安全,可很好地指导今后类似复杂地质段工程设计。
关键词:岩溶;暗河;抗水压衬砌;石膏;双向受力板中图分类号:U45 文献标识码:ADESIGN MADE FOR COMPLEX GEOLOGICAL SECTION OF JING-ZHULING TUNNEL ON SUINING -CHONGQING RAILWAY LINEZHAO Wan -qiangThe Second Survey and Design Institute of China RailwayAbstract :Research purposes :The design is made for eliminating the possibility of happening construction accident arisen by karst burst water in Jingzhuling Tunnel ,avoiding subsidence arisen by damaged water environment due to large leak and loss of ground water while the tunnel crossing the karst section and solving the problems of influences on the strength ,stability and durability of tunnel structure by the tunnel crossing huge karst caves group ,underground river and karst burst mud section as well as expansion corrosivity of gypsic horizon.Research methods :Based on the integrated concept of water conservancy ,environment protection ,safety and running relief ,the system is equipped with auxiliary pit ,the advanced geological prediction is done further to the special sec-tion ,blocking water by grout curtain is done in combination with dredging underground river of karst cave to the rich wa-ter section and the similar calculation is made by adopting numerical values of ANASYS program.Research results :The design of the tunnel crossing karst cave ,underground river and burst mud section ,design of sup-porting structure to gypsic horizon and design of lining against water pressure are completed.Research conclusions :The construction of the tunnel structure and running safety are ensured by the design concept of water conservancy and drainage to the rich water and underground river of karst cave sections ,and design measures for the complex geological section ,for reference to the design of similar project in complex geological section.Key words :karst ;underground river ;lining against water pressure ;gyp ;bi -directional pressured plate遂渝铁路荆竹岭隧道位于重庆合川盐井镇及北碚澄江镇管辖区,左靠212国道及嘉陵江。
A TWO-DIMENSIONAL APPROACH FOR DESIGNING TUNNEL SUPPORT IN WEAK ROCKJohn H. Curran, University of TorontoReginald E. Hammah, Rocscience Inc.Thamer E. Yacoub, Rocscience Inc.ABSTRACTThe design of support for tunnels in weak rock is an iterative process. A good starting point is essential to the process and facilitates safe and economic design. Support design for tunnels in weak rock is a clearly three-dimensional problem. However, currently there are very few practical three-dimensional software tools for carrying out the task. This paper provides an overview of a methodology being used by tunnelling experts, which captures the three-dimensional essentials of tunnel behaviour with two-dimensional analysis tools. The methodology allows support designers to start off with reasonable estimates of support requirements that can be quickly refined to meet requirements.RÉSUMÉ1. INTRODUCTIONThe distribution of stresses around the advancing face of a tunnel is three-dimensional. At a section in a rock mass, which is at distance of two and a half tunnel diameters ahead of the face, the stress state is undisturbed and equal to the in-situ stress conditions. At the tunnel face, the rock mass provides a support pressure that is approximately 25% of the in-situ stress. The apparent support pressure provided by the face allows excavated sections to stand up long enough for support to be installed. Support pressure gradually reduces to zero at a distance of about four and one half tunnel diameters behind the advancing face.Due to the three-dimensional stress distribution at tunnel faces, straightforward application of two-dimensional numerical analysis to the design of tunnel support systems is inaccurate. Most two-dimensional numerical formulations for excavation analysis assume plane strain conditions. However these conditions are only applicable to tunnel sections far from the advancing face.In the numerical simulation of a tunnel, if the tunnel is first excavated and a passive support system installed thereafter, the support system will carry no loads. This is because all deformations would have taken place before the support is installed. On the other hand, if the supported is installed in the model before the tunnel is excavated, the support system will be exposed to the entire induced loading, a scenario that would arise only if the support were to be installed before any displacements whatsoever of the excavation boundary occurred. This would lead to conservative design since in reality some degree of stress relief always occurs by the time support is installed.In order to use two-dimensional numerical tools to realistically design tunnel support therefore, one needs to estimate displacements of the excavation boundary that occur before support is installed. Using the two-dimensional finite element method, this paper outlines a practical approach for estimating these deformations, and designing realistic support. It provides an example of such design for a non-circular tunnel in non-hydrostatic stress conditions.2. TWO-DIMENSIONAL METHODOLOGY FORPRACTICAL TUNNEL SUPPORT DESIGNThe paper proposes a simple, yet practical, 5-stage methodology for designing realistic tunnel support using any two-dimensional numerical method such as the finite element or finite difference methods. The approach assumes that the axis of the tunnel is aligned with a principal stress direction. The paper uses Phase2, a finite element program developed by Rocscience. However any other two-dimensional numerical programs such as Flac can be employed.The proposed methodology is based on the softening behaviour of material with excavation. The three-dimensional stress distribution at the face of a tunnel can be interpreted in terms of material softening. To do so we shall examine the behaviour of a rockmass section before and after it is excavated. When the section is at such a distance from the advancing tunnel face that its stress state is undisturbed, the unexcavated material within the section is un-deformed and can be thought of as having in-situ deformation modulus.As the face approaches the section this material begins to soften. At the time support is installed at the excavated section, it would have experienced deformations that can be modelled in two dimensions by reducing the deformation modulus of the excavated material by a ratio α. The section eventually attains plane strain conditions as the tunnel face advances further. If it were to be left unsupported, then its deformations under plane strain conditions could be modelled by assuming α = 0.The five steps of the methodology are as follow:a) If the tunnel being designed is non-circular,determine an equivalent circleb) Estimate the tunnel deformation that occurs priorto support installationc) Determine the type of support (support system)required for the prevailing rockmass conditions d) Estimate the ratio by which the modulus ofelasticity of the rockmass must be reduced, and e) Conduct two-stage modelling of the tunnel andsupport.For the charts and example that will be provided in the paper, we model rock mass strength with the updated Generalized Hoek-Brown failure criterion (Hoek et al , 2002). 2.1 Step 1: Determine the Equivalent Circular Tunnel Noncircular tunnel cross-sections are common in practice, but methods for generating ground reaction curves, including axisymmetric finite element analysis [Hoek 2002], assume circular tunnel shapes. To estimate the ground reaction curve for a noncircular tunnel, we propose approximation of the noncircular cross-section with an equivalent circular tunnel of the same cross-sectional area. If the noncircular tunnel shape differs greatly from a circle then this approximation may not be valid.The area of an arbitrarily shaped cross-section can be calculated either using analytical equations for its different sub-areas, or using a numerical algorithm. One such simple algorithm is based on a discrete version of Green’s theorem that relates the double integral over a closed region to a line integral over its boundary. If n vertices on the boundary of a tunnel cross-section labelled 01111(,),(,),...,(,)o n n x y x y x y −− are known, the area of the cross-section is given by:()11112n i i i ii A x yx y −++==−∑. (1)The last vertex (,)n n x y in the formula must be set equal to the first vertex 00(,)x y . The formula gives a positive area if the vertices are arranged counterclockwise, and a negative area if the vertices are arranged clockwise.The diameter of the equivalent tunnel is easily calculatedusing the relationship:D = 2.2Step 2: Estimate Tunnel Displacements Prior to Support InstallationA plot of tunnel wall displacement versus distance from the advancing face, both normalized by tunnel diameter D, for the equivalent circular tunnel can be used to estimate the amount of displacement that will take place by the time support is installed. This curve can be generated using axisymmetric finite element analysis or empirical equations. Knowing the distance from the tunnel face at which support will be installed, amount of wall displacement that occurs prior to support installation can be determined from the curve.Unlike the deformations around a circular tunnel in hydrostatic conditions, the deformations around a non-circular tunnel or around a circular tunnel in non-hydrostatic conditions are not evenly distributed. In this paper we suggest the maximum displacement of the tunnel boundary be used in generating the wall displacement – distance from face curve.When creating the plot it is recommended to calculate displacements over a distance from the face that is at least five times the equivalent diameter. This allows the total convergence of the unsupported tunnel to be calculated, and used in the next step to estimate strain levels. 2.3 Step 3: Determine the Type of Support SystemRequiredTunnel support design is an iterative process that includes assumptions on support type installed and the support pressure it provides. There exists a very wide range of tunnel support systems. To obtain a good choice of support type, especially at the initial stages of design, one can use the guidelines provided in Hoek, 1998 and 2000. The guidelines allow tunnel designers to anticipate the expected extents of squeezing problems and then estimate the type and amount of support required. The guidelines assume a circular tunnel in hydrostatic stress conditions with a closed ring of support (evenly distributed around the tunnel circumference).The procedure starts off with the determination of the level of strain that will be experienced by a tunnel (Hoek, 2000 and Hoek and Marinos, 2000). This strain level is defined as the ratio of tunnel wall displacement to tunnel radius, expressed in percentage. It is dependent on the ratio of rockmass strength (for the Generalized Hoek-Brown criterion it is the uniaxial compressive strength of the rock mass cm σ), to in situ stress, o p (a hydrostatic stress state is assumed). Figure 1 is a chart from (Hoek, 2000 and Hoek and Marinos, 2000) that relates tunnel strain to the ratio /cm o p σ.For non-hydrostatic stress conditions, we propose that o p be set equal to the maximum principal perpendicular to the tunnel cross-section (remember it is assumed that the tunnel axis is parallel to a principal stress direction). From a known /cm o p σ ratio the level of strain, and thus extents of squeezing problems expected, can be estimated from the curve on Figure 1.Having established the anticipated degree of squeezing problems, the next step is to determine the support pressure required to limit the strain around the tunnel to a specified amount. This is accomplished through the use of Figure 2, a chart from Hoek, 1998. For a rock mass strength to in situ stress ratio and percent strain, the support pressure to in situ stress ratio, required to maintain the percent strain, can be estimated. Since the in situ stress is known the support pressure can then be readily calculated.Using the diameter of the equivalent tunnel and the required support pressure in conjunction with the chart on Figure A1 (Hoek, 1998) the type and amount of support needed for the tunnel can be obtained.Figure 1. Approximate relationship between strain and the degree of difficulty associated with tunnelling through squeezing rock (Hoek, 2000, and Hoek and Marinos, 2000).Figure 2. Approximate support pressure required for different strain values for a circular tunnel under hydrostatic in situ stresses (Hoek, 1998).2.4 Step 4: Determine the Appropriate ModulusSoftening RatioThe last quantity to establish before embarking on the two-dimensional numerical modelling of the actual tunnel is the ratio by which the material modulus of elasticity in must be reduced the model. This step allows us to design realistic support by permitting the required tunnel displacement to occur in the model before support is installed.The appropriate softening ratio can be determined by generating a plot of relative tunnel convergence to material softening ratio. This plot is created through running several tunnel models that have different reduced material moduli. Knowing the amount of displacement that occurs by the time support is installed (from Step 2), we can determine, from the plot, the ratio by which we must reduce the tunnel material modulus of elasticity. 2.5 Step 5: Model Tunnel and Support in Two Stages The actual tunnel and support under design can now be analysed in two stages. In Stage I of modelling, the modulus of elasticity of the material to be excavated from the tunnel is reduced by the ratio established above. All other model parameters including in situ stresses, material strength and deformation properties, remain the same. Any suitable numerical analysis code can be used for this modelling.This stage allows the expected level of deformation to occur around the tunnel before support is installed, realistically simulating true behaviour. Although the computed deformations are expected to be similar to those calculated for the equivalent tunnel, it is important to compare the two deformations to ensure that the assumption of equivalency is indeed true. If the two deformations differ significantly, then we suggest changing the material-softening ratio till the deformations match.In the next stage of modelling, the selected type of support is installed and the tunnel material completely removed. The tunnel deformations and support loads calculated from this modelling stage are then checked to ensure that they meet design criteria.3. EXAMPLETo illustrate the use of the suggested approach, support will be designed for the tunnel geometry shown on Figure A. The tunnel under a field stress regime where the horizontal stress is half the vertical stress (k=0.5). The material properties and in-situ stresses are given in Table 1. It will be assumed for this example that support is installed 2m from the tunnel face.Using RocLab, a free program developed by Rocscience Inc., the global strength of the rock mass (Hoek et al, 2002), cmσ was determined to be 2.49 MPa. The Young’s modulus of the rock mass required for the numerical modelling of the tunnel can be estimated from the GSI, intact rock strength and disturbance factor (Hoek et al, 2002). Using Young’s modulus calculator built into RocLab, we obtained a Young’s modulus of 1732 MPa. Next we calculated the area of the tunnel cross-section, using the coordinates of 54 vertices on the tunnel boundary using equation (1). We obtained an area of 37.17 m2. From this area we computed the diameter of the equivalent circular tunnel to be 6.88 m.Table 1. Material properties and in-situ stressesHoek-Brown ClassificationParametersUniaxial compressivestrength of intact rock30 MPaGeological Strength Index(GSI)35Material constant i m10Disturbance factor D 0.5In situ StressesVertical stress 6 MPaHorizontal stress 3 MPaFigure 3. Tunnel cross-section0.20.30.40.50.60.7Figure 4. Plot of tunnel wall displacement as a function of distance from face developed from axisymmetric analysisin Phase 2.Next, for the determined equivalent tunnel geometry and material and rock mass properties, we used the axisymmetric modelling option in the finite elementprogram, Phase 2, to generate a curve of tunnel wall displacement as a function of distance, x, from the face (Figure 1). From the curve a tunnel strain (ratio of maximum displacement to tunnel diameter expressed as a percentage) of 0.48% (or a maximum displacement of 0.033 m) is expected when support is installed 2 m away from the face. The curve also indicates a 0.7% strain (maximum displacement of 0.048 m) for unsupported tunnel sections far from the face.Now we look at selecting a suitable support system for the tunnel, given the stress and material strength conditions. Our rock mass compressive strength of 2.49 MPa and maximum in-situ principal stress of 6 MPa give a strength-to-stress ratio of 0.41. Examination of Figure 1 provides a corresponding percent strain that lies between 1 and 2.5%, signifying minor squeezing problems.Next we use the guidelines described in Step 3 to select a support system for the tunnel. Since these guidelines have been implemented in RocSupport, a program by Rocscience, we used it to establish a support system comprising a 100 mm thick shotcrete layer.We proceeded to generate the plot of convergence ratio against reduction ratios of Young’s modulus for our rock mass. This plot is shown on Figure 5. Since we already established a percent strain of 0.48% in Step 3, we determine from Figure 5 that we need to soften the Young’s modulus of the material to be excavated by a ratio of 0.005 to model the displacements that occur prior to installation of support.We then developed a two-stage Phase2 model of the actual tunnel (Figure 6) under design. The maximum displacements (strain value of 0.47%) around the tunnel computed in Stage 1 were very similar to the displacements determined for the equivalent circular tunnel at a 2 m distance behind the face. This demonstrates the ability of the proposed approach in obtaining a good starting point for design. If the displacements were very different, we would have had to appropriately increase or decrease the modulus-softening ratio.The stresses computed in the liner were all below the tensile and compressive strengths of the liner concrete. We are therefore able to accept this 100 mm shotcrete layer support system for the tunnel.0.030.040.050.060.07αFigure 5. Plot of convergence ratio against Young’s modulus reduction ratio.4. CONCLUDING REMARKSIn reality, tunnel support systems are often installed in areas that are under three-dimensional stress regimes. However, tunnel designers often limited to the use of two-dimensional analysis tools. This is because the two-dimensional tools offer speed and ease-of-use advantages, especially in studying alternative support solutions and trade-offs.The approach advocated in this paper is designed to help engineers to use available two-dimensional analysis tools to design realistic tunnel support, which takes into account the three-dimensional stress environment in the region of support installation. The approach suggested, although simple, allows tunnel designers to at least obtain a good start off point for designing support.(13.81, 0.13)(16.8, -0.65)(20.1, 0.13)(16.8, 5.99)Softened material Shotcrete layerStage 1 Stage 2Figure 6. Two-stage Phase2 model of actual tunnel.ReferencesHoek, E., Carranza-Torres, C., and Corkum, B. Hoek-Brown Failure Criterion – 2002 Edition. Proceedings ofthe 5th North American Rock Mechanics Symposiumand 17th Tunnel Association of Canada, NARMS-TAC2002, Toronto, Canada, Vol. 1, pp. 267-273Hoek, E. 2000. Big tunnels in bad rock. 2000 Terzaghi Lecture, ASCE National Convention in Seattle, WA. Hoek, E. 1998. Tunnel support in weak rock. Keynote address, Symposium of Sedimentary Rock Engineering, Taipei, Taiwan.Hoek, E. and Marinos, P. 2000. Predicting tunnel squeezing problems in weak heterogeneous rock masses. Tunnels and Tunnelling.Phase2 v5.0. 2002. Two-dimensional finite element program. Rocscience Inc.RocLab. 2002. Program for analyzing rock mass strength using the Generalized Hoek-Brown failure criterion. RocSupport v2.0. 2002. Program for estimating tunnel support using ground reaction curves.APPENDIXFigure A1: Approximate maximum capacities for different support systems installed in circular tunnels (Hoek, 1998).。