4.2.11 AOAC Official Method 2001.11 Protein(Crude)in Animal Feed-美国公职分析化学师协会标准-AOAC
- 格式:pdf
- 大小:31.76 KB
- 文档页数:3
AOAC饲料中药物官方分析法(2000)第5章40页2000AOAC国际版5.3.02杆菌肽预混剂AOAC官方分析方法杯碟法(本法应用于含≥10g杆菌肽/454g的预混剂)A原理:杆菌肽从已酸化有机溶剂系统中的饲料提取。
提取物离心,上清液用磷酸盐缓冲液稀释,然后用杯碟法用藤黄微球菌检定菌分析。
B试剂与装置(a)微生物—藤黄微球菌A TCC号10240 培养基(见5.3.01)(b)提取溶剂—混合溶剂,27%乙腈(H3CN),27%甲醇,3%pH6.0的磷酸盐缓冲剂(见5.3.01),41%水和2%磷酸(85%),加入0.5gEDTA/L(提取溶剂用EDTA饱和的)(c)磷酸盐缓冲剂—5%,pH6.5,见957.23B(d)C(见5.3.01)(d)稀释剂—甲醇—5%pH6.5磷酸盐缓冲剂(12+88)(e)稀盐酸—小心加89ml盐酸至适量水中,并稀释到1L(1M)。
进一步稀释溶液1﹕100(0.01M)。
(f)钢管见957.23 C (a) (见5.3.01)(g)钢管分布器:随机的见957.23(d) (见5.3.01)C标准液见957.24*(a)和(b)(见5.3.03)。
也即制备0.3和0.16u/ml溶液以平皿作成供试样品,用于监测定量用。
D杯碟准备采用1个约15ml的琼脂抗生素培养基1,957.23A(a)(见5.3.01)。
通过实验皿最适的浓度(通常为0.02—0.05%)的藤黄微球菌ATCC No 1024,加到琼脂培养基上,使获得抑菌圈为15-17mm,用于0.2u/ml杆菌肽。
注入4个钢管内,标准曲线上的每点(即16个杯点),另外,4个杯为供试液。
标准曲线与杯碟两次(即32个钢圈),将作为检查样品0.3、0.16u/ml。
因此,总的将需要48个杯、两个曲线,对于每个预混剂样品加4个附加杯。
使琼脂培养基铺平,保持水平和一定硬度。
使用前转移到冰箱中,冷却≥1小时,所用碟当天配制。
17.2.09AOAC Official Method997.02Yeast and Mold Counts in FoodsDry Rehydratable Film Method(Petrifilm™Method)First Action1997Final Action2000(Applicable to enumeration of total yeasts and molds in foods.) See Tables997.02A and B for the results of the interlaboratory study supporting the acceptance of the method.A.PrincipleMethod uses culture plates of dry medium supplemented with an-tibiotics,dye to enhance visualization of growth,and cold H2O-soluble gelling agent.Undiluted or diluted suspensions are added to plates at a rate of1mL/plate.Suspension is spread over ca 30cm2growth area.Gelling agent is allowed to solidify,plates are incubated,and yeasts and molds are counted.B.Apparatus and Reagent(a)Yeast and mold count plates.—Contain nutrients supple-mented with chlortetracycline,chloramphenicol,cold H2O-soluble gelling agent,and dye sensitive to presence of phosphatase (5-bromo-4-chloro-3-indolyl phosphate)that enhances visualiza-tion of yeast and mold growth.Circular growth area of single plate contains thirty1×1cm squares outlined on film base.(Available as 3M™Petrifilm™Yeast and Mold Count plates from3M Microbiol-ogy Products,3M Center,Bldg.275-5W-05,St.Paul, MN55144-1000,USA.)(b)Plastic spreader.—Provided with Petrifilm plates,designed to spread suspension evenly over plate growth area.(c)Pipets.—Serological pipet or pipetting syringe accurately de-livering1.0mL.(d)Colony counter.—Standard apparatus,Quebec model preferred, or one providing equivalent magnification(1.5×)and visibility. (e)Blender.—High speed mechanical blender rotating at 10000–12000rpm,or stomacher.(f)Dilution water.—Butterfield’s phosphate-buffered dilution water.Place34g KH2PO4into1L volumetric flask and dissolve in 500mL H2O.Adjust pH to7.2with1M NaOH(40g/L)and dilute to volume with H2O.Autoclave15min at121°C.Store stock solution in refrigerator.Prepare dilution blanks by pipetting1.25mL stock solution into1L volumetric flask and dilute to volume with H2O. Dispense90or99±1mL into bottles.Autoclave15min at121°C. C.General InstructionsStore unopened yeast and mold count plate foil pouches at≤8°C. After opening,return unused plates to foil pouch.Seal pouch by folding and taping the open end.Store resealed foil pouch at≤8°C in a dry e plates within1month after opening.Exposure of yeast and mold count plates to temperatures>25°C and/or humidities>50%RH can affect performance of plates.After use,plates contain viable yeast and/or mold cultures.Auto-clave used plates15min at121°C prior to discarding.D.Preparation of Test SuspensionAseptically prepare1:10or greater dilution of food product with dilution H2O.Blend or stomach2min and plate.Prepare additional dilutions as required.E.AnalysisPlace yeast and mold count plate on flat surface.Lift top film,hold pipet perpendicular to plate,and carefully inoculate1mL test sus-pension onto center of film base.Place top film down onto inoculum. Lift plastic spreader using circular handle.Align center of spreader with approximate center of plate.Distribute suspension evenly using gentle downward pressure on center of spreader.Do not slide spreader across film.Remove spreader and leave plate un-disturbed1min to let gel solidify.Place plates in incubator in horizontal position,clear side up,in stacks not exceeding20units.Incubate plates5days at20–25°C. Count plates promptly after incubation period.Yeasts appear as blue-green or off-white in color and form small defined colonies. Mold colonies are usually blue but may also assume their natural pigmentation(e.g.,black,yellow,green).They tend to be larger and more diffuse than yeast colonies.To calculate yeast and mold count,multiply total number of yeast and mold colonies/plate(or average number of colonies/plate,if counting duplicate plates of same dilution)by appropriate dilution factor.When counting colonies on duplicate plates of consecutive dilutions,calculate mean number of colonies for each dilution be-fore determining average yeast and mold count.Estimated counts can be made on plates with>150colonies and should be reported as estimated counts.In making such counts,de-termine average count/1cm2and multiply by30(circular growth area is ca30cm2).High numbers of yeast colonies may cause the entire growth area to turn blue.High numbers of mold colonies may cause growth area to turn blue,black,yellow,etc.When this occurs,do not make estimated counts, but further dilute and plate test suspension to obtain more accurate count. Reference:J.AOAC Int.80,806(1997).Revised:March2002©2002AOAC INTERNATIONAL。
aafco标准AAFCO标准是美国动物食品治理委员会(AAFCO)制定的动物食品的一组质量标准。
AAFCO标准旨在确保动物食品营养满足宠物的营养需求,并保护消费者的权利。
它的根源可以追溯到1893年,当时美国农业部颁布的《给宠物的营养标准》。
宠物食品是一种独特的食品,AAFCO标准旨在确保它们符合食品安全标准、科学标准和营养标准。
它们被分为两大类:完整和平衡,以及其他。
完整和平衡食品是宠物主人最重视的,它们可以满足宠物的所有营养需求,并可以独立提供满足宠物的优质营养。
另一方面,其他食品只能为宠物提供某些营养,但无法满足宠物的营养需求。
它们可以作为饲料补充,以满足成年宠物不同生理状况或活动水平所需的营养。
AAFCO标准旨在确保宠物食品可以为宠物提供营养而不会对宠物造成伤害。
AAFCO开发了严格的测试方法,以确保宠物食品不含有任何有害成分,满足行业标准,以及提高安全质量。
AAFCO标准允许试验进行,以确保它们的食品营养状况和安全质量满足标准。
这些测试包括化学和微生物测试,以确保食品中不含有有毒成分;化学和微生物测试,以确保食品的营养成分是否满足行业要求;以及有关宠物满意度的测试,以确保宠物拥有优质的营养饮食。
通过实施AAFCO标准,可以确保宠物食品满足宠物营养和安全要求,在宠物健康方面发挥重要作用。
它们还可以帮助保护消费者的权利,确保宠物食品安全可靠。
根据AAFCO标准,宠物食品必须经过严格的检查,以确保它们满足营养和安全要求,以保证宠物的健康和安全。
总而言之,AAFCO标准是一组严格的质量标准,旨在确保宠物食品满足宠物的营养需求,保护消费者的权利,并保证宠物食品的安全和可靠性。
它们是动物食品控制和宠物行业发展的关键组成部分,因此应继续实施和完善这一有价值的质量标准。
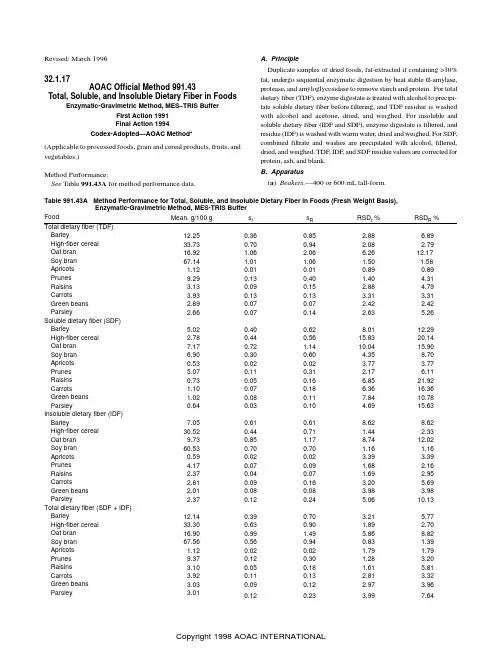
Revised: March 1996 32.1.17AOAC Official Method 991.43Total, Soluble, and Insoluble Dietary Fiber in FoodsEnzymatic-Gravimetric Method, MES–TRIS BufferFirst Action 1991Final Action 1994Codex-Adopted—AOAC Method*(Applicable to processed foods, grain and cereal products, fruits, and vegetables.)Method Performance:See Table 991.43A for method performance data.A. PrincipleDuplicate samples of dried foods, fat-extracted if containing >10%fat, undergo sequential enzymatic digestion by heat stable α-amylase,protease, and amyloglycosidase to remove starch and protein. For total dietary fiber (TDF), enzyme digestate is treated with alcohol to precipi-tate soluble dietary fiber before filtering, and TDF residue is washed with alcohol and acetone, dried, and weighed. For insoluble and soluble dietary fiber (IDF and SDF), enzyme digestate is filtered, and residue (IDF) is washed with warm water, dried and weighed. For SDF,combined filtrate and washes are precipitated with alcohol, filtered,dried, and weighed. TDF, IDF, and SDF residue values are corrected for protein, ash, and blank.B. Apparatus(a ) Beakers.—400 or 600 mL tall-form.Table 991.43A Method Performance for Total, Soluble, and Insoluble Dietary Fiber in Foods (Fresh Weight Basis),Enzymatic-Gravimetric Method, MES-TRIS BufferFood Mean, g/100 g s r s R RSD r%RSD R % Barley 12.250.360.85 2.88 6.89High-fiber cereal 33.730.700.94 2.08 2.79 Oat bran 16.92 1.06 2.06 6.2612.17 Soy bran 67.14 1.01 1.06 1.50 1.58 Apricots 1.120.010.010.890.89 Prunes 9.290.130.40 1.404.31 Raisins 3.130.090.15 2.88 4.79 Carrots 3.930.130.13 3.31 3.31 Green beans 2.890.070.07 2.42 2.42 Parsley 2.660.070.14 2.635.26Soluble dietary fiber (SDF) Barley 5.020.400.628.0112.29 High-fiber cereal 2.780.440.5615.83 20.14 Oat bran 7.170.72 1.1410.04 15.90 Soy bran6.900.300.60 4.358.70 Apricots 0.530.020.02 3.77 3.77 Prunes 5.070.110.31 2.17 6.11 Raisins 0.730.050.16 6.8521.92 Carrots 1.100.070.18 6.3616.36 Green beans 1.020.080.117.8410.78 Parsley 0.640.030.10 4.6915.63 Insoluble dietary fiber (IDF) Barley 7.050.610.618.628.62 High-fiber cereal 30.520.440.71 1.44 2.33 Oat bran9.730.85 1.178.7412.02 Soy bran 60.530.700.70 1.16 1.16 Apricots 0.590.020.02 3.39 3.39 Prunes 4.170.070.09 1.68 2.16 Raisins 2.370.040.07 1.69 2.95 Carrots 2.810.090.16 3.20 5.69 Green beans 2.010.080.08 3.98 3.98 Parsley 2.370.120.24 5.0610.13 Total dietary fiber (SDF + IDF) Barley 12.140.390.70 3.21 5.77 High-fiber cereal 33.300.630.90 1.89 2.70 Oat bran 16.900.99 1.49 5.868.82 Soy bran 67.560.560.940.83 1.39 Apricots 1.120.020.02 1.79 1.79 Prunes 9.370.120.30 1.28 3.20 Raisins 3.100.050.18 1.61 5.81 Carrots 3.920.110.13 2.81 3.32 Green beans 3.030.090.12 2.97 3.96 Parsley 3.010.120.23 3.997.64(b ) Filtering crucible.—With fritted disk, coarse, ASTM 40–60µm pore size, Pyrex 60 mL (Corning No. 36060 Bchner, Corning,Inc., Science Products, Corning, NY 14831, USA, or equivalent).Prepare as follows. Ash overnight at 525° in muffle furnace. Let furnace temperature fall below 130° before removing crucibles.Soak crucibles 1 h in 2% cleaning solution at room temperature.Rinse crucibles with H 2O and then deionized H 2O; for final rinse,use 15 mL acetone and then air-dry. Add ca 1.0 g Celite to dry crucibles, and dry at 130° to constant weight. Cool crucible ca 1h in desiccator, and record weight, to nearest 0.1 mg, of crucible plus Celite.(c ) V acuum system.—V acuum pump or aspirator with regulating device. Heavy walled filtering flask, 1 L, with side arm. Rubber ring adaptors, for use with filtering flasks.(d ) Shaking water baths.—(1) Capable of maintaining 98 2°,with automatic on-and-off timer. (2) Constant temperature, adjust-able to 60°.(e ) Balance.—Analytical, sensitivity 0.1 mg.(f ) Muffle furnace.—Capable of maintaining 525 5°.(g ) Oven.—Capable of maintaining 105 and 130 3°.(h ) Desiccator .—With SiO 2 or equivalent desiccant. Biweekly,dry desiccant overnight at 130°.(i ) pH meter .—Temperature compensated, standardized with pH 4.0, 7.0, and 10.0 buffer solutions.(j ) Pipetters .—With disposable tips, 100–300 µL and 5 mL capacity.(k ) Dispensers.—Capable of dispensing 15 0.5 mL for 78%ethanol, 95% ethanol, and acetone; 40 0.5 mL for buffer.(l ) Magnetic stirrers and stir bars.C. ReagentsUse deionized water throughout.(a ) Ethanol solutions.—(1) 85%. Place 895 mL 95% ethanol into 1 L volumetric flask, dilute to volume with H 2O. (2) 78%. Place 821 mL 95% ethanol into 1 L volumetric flask, dilute to volume with H 2O.(b ) Heat-stable α-amylase solution.—Catalog Number A 3306,Sigma Chemical Co., St. Louis, MO 63178, USA, or Termamyl 300L, Catalog Number 361-6282, Novo-Nordisk, Bagsvaerd, Den-mark, or equivalent.(c ) Protease.—Catalog Number P 3910, Sigma Chemical Co, or equivalent. Prepare 50 mg/mL enzyme solution in MES/TRIS buff-er fresh daily.(d ) Amyloglucosidase solution .—Catalog Number AMG A9913,Sigma Chemical Co, or equivalent. Store at 0–5°.(e ) Diatomaceous earth.—Acid washed (Celite 545 AW, No.C8656, Sigma Chemical Co. or equivalent).(f ) Cleaning solution .—Liquid surfactant-type laboratory cleaner, designed for critical cleaning (Micro ®, International Prod-ucts Corp., Burlington, NJ 08601, USA, or equivalent). Prepare 2%solution in H 2O.(g ) MES .—2-(N -Morpholino)ethanesulfonic acid (No. M-8250,Sigma Chemical Co., or equivalent.)(h ) TRIS.—Tris(hydroxymethyl)aminomethane (No. T-1503,Sigma Chemical Co., or equivalent).(i ) MES–TRIS buffer solution.—0.05M MES, 0.05M TRIS, pH 8.2 at 24°. Dissolve 19.52 g MES and 12.2 g TRIS in 1.7 L H 2O.Adjust pH to 8.2 with 6N NaOH, and dilute to 2 L with H 2O.(Note: It is important to adjust pH to 8.2 at 24°. However, if buffer temperature is 20°, adjust pH to 8.3; if temperature is 28°,adjust pH to 8.1. For deviations between 20 and 28°, adjust by interpolation.)(j ) Hydrochloric acid solution.—0.561N . Add 93.5 mL 6N HCl to ca 700 mL H 2O in 1 L volumetric flask. Dilute to 1 L with H 2O.D. Enzyme PurityTo ensure absence of undesirable enzymatic activities and pres-ence of desirable enzymatic activities, run standards listed in Table 991.43B each time enzyme lot changes or at maximum interval of 6months.E. Sample Preparation and DigestionPrepare samples as in 985.29E (see 45.4.07) (if fat content of sample is unknown, defat before determining dietary fiber). For high sugar samples, desugar before determining dietary fiber by extract-ing 2–3 times with 85% ethanol, 10 mL/g, decanting, and then drying overnight at 40°.Run 2 blanks/assay with samples to measure any contribution from reagents to residue.Weigh duplicate 1.000 0.005 g samples (M 1 and M 2), accurate to 0.1 mg, into 400 mL (or 600 mL) tall-form beakers. Add 40 mL MES–TRIS buffer solution, pH 8.2, to each. Stir on magnetic stirrer until sample is completely dispersed (to prevent lump formation,which would make test material inaccessible to enzymes).Add 50 µL heat-stable α-amylase solution, stirring at low speed.Cover beakers with Al foil, and incubate in 95–100° H 2O bath 15min with continuous agitation. Start timing once bath temperature reaches 95° (total of 35 min is normally sufficient).Remove all beakers from bath, and cool to 60°. Remove foil.Scrape any ring from inside of beaker and disperse any gels in bottom of beaker with spatula. Rinse beaker walls and spatula with 10 mL H 2O.Add 100 µL protease solution to each beaker. Cover with Al foil,and incubate 30 min at 60 1° with continuous agitation. Start timing when bath temperature reaches 60°.Remove foil. Dispense 5 mL 0.561N HCl into beakers while stirring. Adjust pH to 4.0–4.7 at 60°, by adding 1N NaOH solution or 1N HCl solution. (Note: It is important to check and adjust pH while solutions are 60° because pH will increase at lower tempera-tures.) (Most cereal, grain, and vegetable products do not require pH adjustment. Once verified for each laboratory, pH checking procedure can be omitted. As a precaution, check pH of blank routinely; if outside desirable range, check samples also.)Add 300 µL amyloglucosidase solution while stirring. Cover with Al foil, and incubate 30 min at 60 1° with constant agitation. StartTable 991.43B Standards for Testing Enzyme Activity Standard Activity Tested Weight of Standard, gExpected Recovery, (%)Citrus pectin Pectinase 0.1–0.295–100 Arabinogalactan Hemicellulase 0.1–0.295–100β-Glucan β-Glucanase 0.1–0.295–100Wheat starch α-Amylase + AMG 1.0 0–1 Corn starch α-Amylase + AMG 1.00–1Casein Protease0.30–1timing once bath reaches 60°.F. Determination of Total Dietary FiberTo each digested sample, add 225 mL (measured after heating) 95% ethanol at 60°. Ratio of ethanol to sample volume should be 4:1. Remove from bath, and cover beakers with large sheets of Al foil. Let precipitate form 1 h at room temperature.Wet and redistribute Celite bed in previously tared crucible B(b), using 15 mL 78% ethanol from wash bottle. Apply suction to crucible to draw Celite onto fritted glass as even mat.Filter alcohol-treated enzyme digestate through crucible. Using wash bottle with 78% ethanol and rubber spatula, quantitatively transfer all remaining particles to crucible. (Note: If some samples form a gum, trapping the liquid, break film with spatula.)Using vacuum, wash residue 2 times each with 15 mL portions of 78% ethanol, 95% ethanol, and acetone. Dry crucible containing residue overnight in 105° oven. Cool crucible in desiccator ca 1 h. Weigh crucible, containing dietary fiber residue and Celite, to near-est 0.1 mg, and calculate residue weight by subtracting weight of dry crucible with Celite, B(b).Use one duplicate from each sample to determine protein, by method 960.52 (see 12.1.07), using N× 6.25 as conversion factor. For ash analysis, incinerate second duplicate 5 h at 525°. Cool in desiccator, and weigh to nearest 0.1 mg. Subtract weight of crucible and Celite, B(b), to determine ash weight.G. Determination of Insoluble Dietary FiberWet and redistribute Celite bed in previously tared crucible, B(b), using ca 3 mL H2O. Apply suction to crucible to draw Celite into even mat. Filter enzyme digestate, from E, through crucible into filtration flask. Rinse beaker, and then wash residue 2 times with 10 mL 70° H2O. Combine filtrate and water washings, transfer to pretared 600 mL tall-form beaker, and reserve for determination of soluble dietary fiber, H. Using vacuum, wash residue 2 times each with 15 mL portions of 78% ethanol, 95% ethanol, and acetone. (Note: Delay in washing IDF residues with 78% ethanol, 95% ethanol, and acetone may cause inflated IDF values.)Use duplicates to determine protein and ash as in F.H. Determination of Soluble Dietary FiberProceed as for insoluble dietary fiber determination through in-struction to combine the filtrate and water washings in pretared 600 mL tall-form beakers. Weigh beakers with combined solution of filtrate and water washings, and estimate volumes.Add 4 volumes of 95% ethanol preheated to 60°. Use portion of 60° ethanol to rinse filtering flask from IDF determination. Alterna-tively, adjust weight of combined solution of filtrate and water washings to 80 g by addition of H2O, and add 320 mL 60° 95% ethanol. Let precipitate form at room temperature 1 h.Follow TDF determination, F, from “Wet and redistribute Celite bed . . . .”I. CalculationsBlank (B, mg) determination:B = [(BR1 + BR2)/2] – P B – A Bwhere BR1 and BR2 = residue weights (mg) for duplicate blank determinations; and P B and A B = weights (mg) of protein and ash, respectively, determined on first and second blank residues. Dietary fiber (DF, g/100 g) determination:DF = {[(R1 + R2)/2] – P – A – B}/[(M1 + M2)/2] × 100 where R1 and R2 = residue weights (mg) for duplicate samples; P and A = weights (mg) of protein and ash, respectively, determined on first and second residues; B = blank weight (mg); and M1 and M2 = weights (mg) for samples.Total dietary fiber determination: Determine either by independent analysis, as in F, or by summing IDF and SDF, as in G and H. Reference: J. AOAC Int. 75, 395(1992).*Adopted as a Codex Defining Method for gravimetry/enzymatic di-gestion of total dietary fiber in infant formula and follow-up for-mula.。

动物饲料国家质量标准实验动物配合饲料通用质量标准GB 14924.1-2001(本标准的全部技术内容为强制性)1 范围本标准规定了实验动物配合饲料的质量要求总原则、饲料原料质量要求、检验规则、包装、标签、贮存及运输等。
本标准适用和于实验动物小鼠、大鼠、免、豚鼠、地鼠、犬和猴的配合饲料。
2 引用标准下列标准所包含的条文,通过在本标准中引用而构成为本标准的条文。
本标准出版时,所示版本均为有效。
所有标准都会被修订,使用本标准的各方应探讨使用下列标准最新版本的可能性。
GB/T 5918-1997 配合饲料混合均匀度的测定GB 9687-1988 食品包装用聚乙烯成型品卫生标准GB 9688-1988 食品包装用聚丙烯成型品卫生标准GB 9689-1988 食品包装用聚苯乙烯成型品卫生标准GB/T 10647-1989 饲料工业通用术语GB/T 10648-1999 饲料标签GB 13078-2001 饲料卫生标准GB/T 14699.1-1993 饲料采样方法GB 14924.2-2001 实验动物配合饲料卫生标准GB 14924.3-2001 实验动物小鼠、大鼠配合饲料GB 14924.4-2001 实验动物兔配合饲料GB 14924.5-2001 实验动物豚鼠配合饲料GB 14924.6-2001 实验动物地鼠配合饲料GB/T 14924.9-2001 实验动物配合饲料常规营养成分的测定GB/T 14924.12-2001 实验动物配合饲料矿物质和微量元素的测定GB/T 17890-1999 饲料用玉米NY/T 117-1989 饲料用小麦NY/T 122-1989 饲料用米糠NY/T 135-1989 饲料用大豆NY/T 136-1989 饲料用豌豆NY/T 140-1989 饲料用苜蓿草粉SC/T 3501-1996 鱼粉3 定义本标准采用下列定义。
3.1 生长、繁殖饲料growth and reproduction diets适用于生长、妊娠和哺乳期动物的饲料。
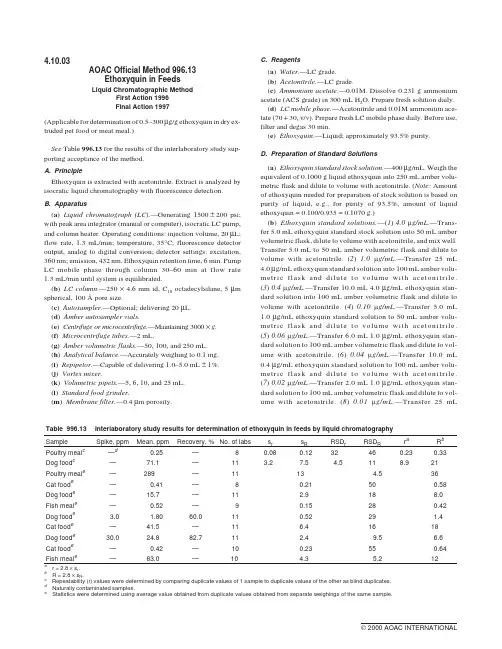
4.10.03AOAC Official Method996.13Ethoxyquin in FeedsLiquid Chromatographic MethodFirst Action1996Final Action1997(Applicable for determination of0.5–300µg/g ethoxyquin in dry ex-truded pet food or meat meal.)See Table996.13for the results of the interlaboratory study sup-porting acceptance of the method.A.PrincipleEthoxyquin is extracted with acetonitrile.Extract is analyzed by isocratic liquid chromatography with fluorescence detection.B.Apparatus(a)Liquid chromatograph(LC).—Generating1500±200psi; with peak area integrator(manual or computer),isocratic LC pump, and column heater.Operating conditions:injection volume,20µL; flow rate,1.3mL/min;temperature,35°C;fluorescence detector output,analog to digital conversion;detector settings:excitation, 360nm;emission,432nm.Ethoxyquin retention time,6min.Pump LC mobile phase through column30–60min at flow rate1.3mL/min until system is equilibrated.(b)LC column.—250×4.6mm id,C18octadecylsilane,5µm spherical,100Åpore size.(c)Autosampler.—Optional;delivering20µL.(d)Amber autosampler vials.(e)Centrifuge or microcentrifuge.—Maintaining3000×g.(f)Microcentrifuge tubes.—2mL.(g)Amber volumetric flasks.—50,100,and250mL.(h)Analytical balance.—Accurately weighing to0.1mg.(i)Repipetor.—Capable of delivering1.0–5.0mL±1%.(j)Vortex mixer.(k)Volumetric pipets.—5,6,10,and25mL.(l)Standard food grinder.(m)Membrane filter.—0.4µm porosity.C.Reagents(a)Water.—LC grade.(b)Acetonitrile.—LC grade.(c)Ammonium acetate.—0.01M.Dissolve0.231g ammonium acetate(ACS grade)in300mL H2O.Prepare fresh solution daily.(d)LC mobile phase.—Acetonitrile and0.01M ammonium ace-tate(70+30,v/v).Prepare fresh LC mobile phase daily.Before use, filter and degas30min.(e)Ethoxyquin.—Liquid;approximately93.5%purity.D.Preparation of Standard Solutions(a)Ethoxyquin standard stock solution.—400µg/mL.Weigh the equivalent of0.1000g liquid ethoxyquin into250mL amber volu-metric flask and dilute to volume with acetonitrile.(Note:Amount of ethoxyquin needed for preparation of stock solution is based on purity of liquid,e.g.,for purity of93.5%,amount of liquid ethoxyquin=0.100/0.935=0.1070g.)(b)Ethoxyquin standard solutions.—(1)4.0m g/mL.—Trans-fer5.0mL ethoxyquin standard stock solution into50mL amber volumetric flask,dilute to volume with acetonitrile,and mix well. Transfer5.0mL to50mL amber volumetric flask and dilute to volume with acetonitrile.(2)1.0m g/mL.—Transfer25mL 4.0µg/mL ethoxyquin standard solution into100mL amber volu-metric flask and dilute to volume with acetonitrile.(3)0.4m g/mL.—Transfer10.0mL4.0µg/mL ethoxyquin stan-dard solution into100mL amber volumetric flask and dilute to volume with acetonitrile.(4)0.10m g/mL.—Transfer5.0mL 1.0µg/mL ethoxyquin standard solution to50mL amber volu-metric flask and dilute to volume with acetonitrile.(5)0.06m g/mL.—Transfer6.0mL1.0µg/mL ethoxyquin stan-dard solution to100mL amber volumetric flask and dilute to vol-ume with acetonitrile.(6)0.04m g/mL.—Transfer10.0mL 0.4µg/mL ethoxyquin standard solution to100mL amber volu-metric flask and dilute to volume with acetonitrile.(7)0.02m g/mL.—Transfer2.0mL1.0µg/mL ethoxyquin stan-dard solution to100mL amber volumetric flask and dilute to vol-ume with acetonitrile.(8)0.01m g/mL.—Transfer25mLTable996.13Interlaboratory study results for determination of ethoxyquin in feeds by liquid chromatographySample Spike,ppm Mean,ppm Recovery,%No.of labs s r s R RSD r RSD R r a R b Poultry meal c—d0.25—80.080.1232460.230.33 Dog food c—71.1—11 3.27.5 4.5118.921 Poultry meal e—289—1113 4.536 Cat food e—0.41—80.21500.58 Dog food e—15.7—11 2.9188.0 Fish meal e—0.52—90.15280.42 Dog food e 3.0 1.8060.0110.5229 1.4 Cat food e—41.5—11 6.41618 Dog food e30.024.882.711 2.49.5 6.6 Cat food e—0.42—100.23550.64 Fish meal e—83.0—10 4.3 5.212a r=2.8×sr .b R=2.8×sR .c Repeatability(r)values were determined by comparing duplicate values of1sample to duplicate values of the other as blind duplicates.d Naturally contaminated samples.e Statistics were determined using average value obtained from duplicate values obtained from separate weighings of the same sample.0.04µg/mL ethoxyquin standard solution to100mL amber volu-metric flask and dilute to volume with acetonitrile. Ethoxyquin standard solutions are stable1day.It is critical that exposure to light is minimized.Depending on analyte concentrations,certain concentrations of ethoxyquin calibrating standard solutions may be eliminated.Use separate calibration curves for matrixes with concentrations above and below0.1µg ethoxyquin/mL.E.ExtractionGrind laboratory sample to particle size of0.85mm or smaller. Store test samples sealed with minimized exposure to light and heat. Analyze test samples within30days of receipt.Weigh(in duplicate)0.06–0.1g test portion into2mL microcen-trifuge ing calibrated repipetor or volumetric pipet,add 1.5mL acetonitrile to each tube and cap securely.If larger test por-tion is analyzed,proportionately increase volume of acetonitrile to maintain the ratio of0.5g test portion to7.5mL solvent. Thoroughly mix1min on Vortex mixer and let stand20min. Remix1min on Vortex mixer and then centrifuge1min at3000×g. Transfer acetonitrile supernatant layer to amber autosampler vial and proceed with LC analysis.F.System SuitabilityCalibrate LC system with ethoxyquin calibrating standard solu-tions.LC system must meet the following criteria:Ethoxyquin should elute at ca6min.Total run time should not exceed8–9min.Slight chromatographic adjustments may be needed to ensure proper reten-tion time.Signal-to-noise ratio of0.01µg/mL ethoxyquin standard solution should be≥3.Five replicate injections of0.1µg/mL ethoxyquin standard solution should give relative standard deviation(RSD)≤2.0%.Otherwise,repeat calibration steps and check precision with 0.1µg/mL ethoxyquin standard solution.If RSD is still>2.0%, check equipment for potential problems.Calculate ethoxyquin concentration using manual or computer in-tegration.G.LC DeterminationBefore analyzing test solutions,run ethoxyquin standard solu-tions to establish e autosampler or manual injection. Run standard solution every10tests and at the end of batch to ensure minimum drift of calibration.Use separate calibration curves for matrixes with concentrations above and below0.1µg ethoxyquin/mL.Dilute solutions containing>4.0µg/mL with acetonitrile(i.e.,add 200µL supernatant to1.8mL acetonitrile and use10as dilution fac-tor,F,in calculations.)H.CalculationCalculate concentration of ethoxyquin,µg/g or ppm,in test sam-ple from calibration curve(using linear regression with line forced through zero intercept)as follows:Ethoxyquin,µg/g or ppm=C FW××15.where C=ethoxyquin concentration from LC calibration curve, m g/mL;1.5=volume of acetonitrile added to test solution,mL;F= dilution factor;W=weight of test portion,g.Average duplicate values and report the result.Reference:J.AOAC Int.80,725(1997).CAS-91-53-2(ethoxyquin)6-ethoxy-1,2-dihydro-2,2,4-trimethylquinoline Revised:March1998。
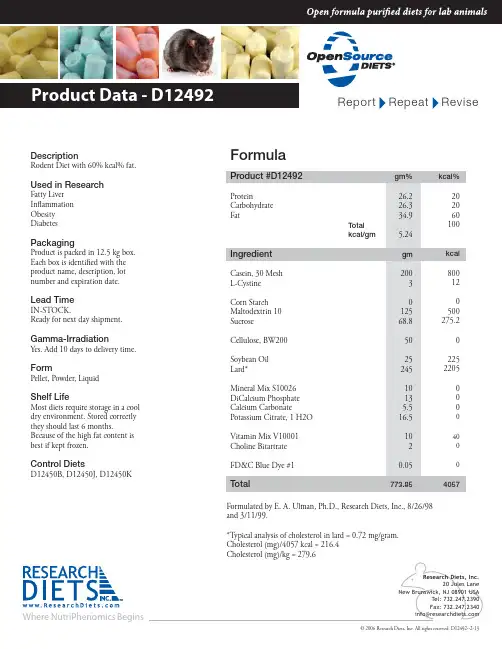
Where NutriPhenomics Begins© 2006 Research Diets, Inc. All rights reserved. D12492--2-13DescriptionRodent Diet with 60% kcal% fat.Used in ResearchFatty Liver In ammation Obesity DiabetesPackagingProduct is packed in 12.5 kg box.Each box is identi ed with the product name, description, lot number and expiration date.Lead TimeIN-STOCK.Ready for next day shipment.Gamma-IrradiationYes. Add 10 days to delivery time.FormPellet, Powder, LiquidShelf LifeMost diets require storage in a cool dry environment. Stored correctly they should last 6 months.Because of the high fat content is best if kept frozen.Control DietsD12450B, D12450J, D12450KFormulaProduct #D12492gm%Protein 26.2Carbohydrate 26.3Fat 34.9 Total kcal/gm5.24IngredientgmCasein, 30 Mesh200L-Cystine3Corn Starch 0Maltodextrin 10 125Sucrose 68.8Cellulose, BW200 50Soybean Oil 25Lard*245Mineral Mix S10026 10DiCalcium Phosphate 13Calcium Carbonate5.5Potassium Citrate, 1 H2O 16.5Vitamin Mix V1000110Choline Bitartrate2FD&C Blue Dye #10.05Total773.85kcal%202060100kcal800120500275.2022********40004057Formulated by E. A. Ulman, Ph.D., Research Diets, Inc., 8/26/98and 3/11/99.*Typical analysis of cholesterol in lard = 0.72 mg/gram.Cholesterol (mg)/4057 kcal = 216.4Cholesterol (mg)/kg = 279.6D12450B, D12451, D12492 The "Original High Fat Diets"1. Van Heek M, et al. Diet-induced Obese Mice Develop Peripheral, but not CentralResistance to Leptin. J. Clin. Invest. 1997; 99:385-390.2. Taheri S, et al. Distribution and quantification of immunoreactive orexin A in rat tissues.FEBS Lett. 1999 Aug 20; 457(1):157-61.3. Nonogaki K, et al. Leptin-independent hyperphagia and type 2 diabetes in mice witha mutated serotonin 5-HT2C receptor gene. Nature Medicine 1998; 4:1152-1156.4. El-Haschimi K, et al. T wo defects contribute to hypothalamic leptin resistance in micewith diet-induced obesity. J.Clin.Invest. 2000; 105:1827-1832.5. Bush EN, et al.(Metabolic Disease Research, Abbott Laboratories) Adiposity, LeptinResistance, Hyperrphagia, Hyperglycemia, Glucose Intolerance and Insulin Resistance in C57BL/6J Mice Fed High Fat Diets.Endocrine SocietyAnnual Meeting 2001,Poster Session.6. Shapiro ME, et al. (Metabolic Disease Research, Abbott Laboratories) Effects ofT reatment of C57BL/6j Mice Fed High vs. Low Fat Diets with Metformin orRosiglitazone on Adiposity, Food Intake, Hyperglycemia and Insulin Resistance.Endocrine Society Annual Meeting 2001, Poster Session.7. Masuzaki H, Paterson J, Shinyama H, Morton NM, Mullins JJ, Seckl JR, Flier JS. AT ransgenic Model of Visceral Obesity and the Metabolic Syndrome. Science. 2001;294:2166-2170.8. Razani B, Combs TP, Wang XB, Frank PG, Park DS, Russell RG, Li M, Tang B, JelicksLA, Scherer PE, Lisanti MP. Caveolin-1 deficient mice are lean, resistant to diet-induced obesity, and show hyper-triglyceridemia with adipocyte abnormalities. J. Biol. Chem.2001; (in press).9. Valet P, Grujic D, Wade J, Ito M, Zingaretti MC, Soloveva V, Ross SR, Graves RA,Cinti S, Lafontan M, and Lowell BB. Expression of human alpha 2-adrenergic receptors in adipose tissue of beta 3-adrenergic receptor-deficient mice promotes diet-induced obesity. J.Biol.Chem. 275: 34797-34802, 2000.10. Vidal-Puig AJ, Grujic D, Zhang CY, Hagen T, Boss O, Ido Y, Szczepanik A, Wade J,Mootha V, Cortright R, Muoio DM, and Lowell BB. Energy metabolism in uncoupling protein 3 gene knockout mice. J.Biol.Chem. 275: 16258-16266, 2000.11. Ziotopoulou M, Mantzoros CS, Hileman SM, & Flier JS. Differential expression ofhypothalamic neuropeptides in the early phase of diet-induced obesity in mice.Am. J. Physiol. Endocrinol. Metab. 279:E383-E845, 2000.12. Scrocchi LA & Drucker DJ. Effects of Aging and a High Fat Diet on Body Weight andGlucose T olerance in Glucagon-Like Peptide-1 Receptor -/- Mice.Endocrinology 139:3127- 3132, 1998.13. Ghibaudi L, Cook J, Farley C, Van Heek M, & Hwa J.Fat Intake Affects Adiposity,Comorbidity Factors, and Energy Metabolism of Sprague-Dawley Rats.Obes. Res. 10:956-963. 200214. Dube MG, Beretta E, Dhillon H, Ueno N, Kalra PS & Kalra SP. Central Leptin Geneerapy Blocks High-Fat Diet-Induced Weight Gain, Hyperleptinemeia, andHyperinsulinemia. Diabetes 51:1729-1736, 2001.15. Tang H, Vasselli JR, Wu EX, Boozer CN, & Gallagher D. High-Resolution MagneticResonance Imaging T racks Changes in Organ and Tissue Mass in Obese and Aging Rats.Am J Physiol (Regulatory Integrative Comp Physiol) 282:R890-R899, 2002.16. Bowen H, Mitchell TD, & Harris RBS (Dept. of Foods and Nutr, U of Georgia).Method of Leptin Dosing, Strain, and Group Housing Influence Leptin Sensitivity in High-Fet-Fed Weanling Mice. AJP-Regul Integr Comp Physiol 284:R87-R100, 2003. 17. Harris RBS, Mitchell TD, & Hebert S (Pennington Biomedical Research Center, BatonRouge, LA). Leptin-Induced Changes in Body Composition in High Fat-Fed Mice.AJPRegul Integr Comp Physiol 284:R87-R100, 2003.18. Anini, Y. and Brubaker, P. L. Role of Leptin in the Regulation of Glucagon-LikePeptide-1 Secretion. Diabetes 52:252-259, 2003.19. Bluher, S., Responsiveness to Peripherally Administered Melanocortins in Lean andObese Mice. Diabetes 53:82-90, 2004.20. Brunengraber, D. Z., et al. Influence of diet on the modeling of adipose tissuetriglycerides during growth. Am J Physiol Endocrinol Metab 285: E917-E925, 2003. 21. Challis, B. G., et al. Mice lacking pro-opiomelanocortin are sensitive to high-fat feedingbut respond normally to the acute anorectic effects of peptide-YY3-36.PNAS 101: 13: 4695- 4700, 2004.22. Cohen, A. W., B. Razani, X. B. Wang, T. P. Combs, T. M. Williams, P. E. Scherer, andM. P. Lisanti. Caveolin-1-deficient mice show insulin resistance and defectiveinsulin receptor protein expression in adipose tissue. Am J Physiol Cell Physiol 285: C222-C235, 2003.23. Combs, T. P., et al. A T ransgenic Mouse with a Deletion in the Collagenous Domain ofAdiponectin Displays Elevated Circulating Adiponectin and Improved InsulinSensitivity. Endocrinology 145:367-383, 2004.24. Conarello, S. L., et al. Mice lacking dipeptidyl peptidase IV are protected against obesityand insulin resistance. PNAS, 100:11: 6825-6830, 2003.25. Dhar, M. S., et al. Mice Heterozygous for Atp10c, a Putative Amphipath, Represent aNovel Model of Obesity and Type 2 Diabetes. J. Nutr. 134: 799-805, 2004.26. El-Haschimi, K., S. D. Dufresne, M. F. Hirshman, J. S. Flier, L. J. Goodyear, and C.Bjørbæk. Insulin Resistance and Lipodystrophy in Mice Lacking Ribosomal S6 Kinase 2.Diabetes 52:1340-1346, 2003.27. Felipe, F., M. L. Bonet, J. Ribot, and A. Palou. Modulation of Resistin Expression byRetinoic Acid and Vitamin A Status. Diabetes 53:882-889, 2004.28. Felipe, F., M.L. Bonet, J. Ribot and A. Palou. Up-regulation of muscle uncouplingprotein 3 gene expression in mice following high fat diet, dietary vitamin Asupplementation and acute retinoic acid-treatment. International Journal of Obesity27: 60-69, 2003.29. Fu, J., et al. Oleylethanolamide regulates feeding and body weight through activationof the nuclear receptor PPAR. Nature 425:90-93, 2003.30. Gavrilova, O., et al. Liver Peroxisome Proliferator-activated Receptor Contributes toHepatic Steatosis, T riglyceride Clearance, and Regulation of Body Fat Mass.e Journal of Biological Chemistry 278:36:34268-34276, 2003.31. Haluzík, M., O. Gavrilova and D. LeRoith. Peroxisome Proliferator-ActivatedReceptor- Deficiency Does Not Alter Insulin Sensitivity in Mice Maintained onRegular or High-Fat Diet: Hyperinsulinemic-Euglycemic Clamp Studies.Endocrinology 145:1662-1667, 2004.32. Hancock, A.A. et al. Antiobesity effects of A-331440, a novel non-imidazole histamineH3 receptor antagonist. European Journal of Pharmacology 487:183-197, 2004.33. Hennige, A. M., et al. Upregulation of insulin receptor substrate-2 in pancreatic b cellsprevents diabetes. J. Clin. Invest. 112:1521-1532, 2003.34.34. Hildebrandt, A. L., D. M. Kelly-Sullivan, S. C. Black. Validation of a high-resolutionX-ray computed tomography system to measure murine adipose tissue depot mass in situ and longitudinally. Journal of Pharmacological and T oxicological Methods47: 99- 106, 2002.35. Hileman, S. M., D.D. Pierroz, H. Masuzaki, C. Bjørbæk, K. El-Haschimi, W. A. Banks,and J. S. Flier. Characterizaton of Short Isoforms of the Leptin Receptor in Rat Cerebral Microvessels and of Brain Uptake of Leptin in Mouse Models of Obesity.Endocrinology 143:775-783, 2002.36. Ishii, M., H. Fei, and J. M. Friedman. Targeted disruption of GPR7, the endogenousreceptor for neuropeptides B and W, leads to metabolic defects and adult-onset obesity.PNAS 100:18:10540-10545, 2003.37. Joseph, J. W., V. Koshkin, C-Y Zhang, J. Wang, B. B. Lowell, C. B. Chan, and M.B.Wheeler. Uncoupling Protein 2 Knockout Mice Have Enhanced Insulin SecretoryCapacity After a High-Fat Diet. Diabetes 51:3211-3219, 2002.38. Kim, S., et al. Effects of High-Fat, Angiotensinogen (agt) Gene Inactivation, andTargeted Expression to Adipose Tissue on Lipid Metabolism and Renal Gene Expression.Horm Metab Res 34:721-725, 2002.39. Kumar, M. V., T. Shimokawa, T. R. Nagy, and M. D. Lane. Differential effects of acentrally acting fatty acid synthase inhibitor in lean and obese mice.PNAS 99:4: 1921-1925, 2002.40. Lambert, P. D., et al. Ciliary neurotrophic factor activates leptin-like pathways andreduces body fat, without cachexia or rebound weight gain, even in leptin-resistantobesity. PNAS 98:8: 4652-4657, 2001.41. Le Laya, S., et al. Decreased Resistin Expression in Mice with Different Sensitivities to aHigh-Fat Diet. Biochemical and Biophysical Research Communications289:2:564-567, 2001.42. Li, J., K. Takaishi, W. Cook, S. K. McCorkle, and R. H. Unger. Insig-1 ''brakes''lipogenesis in adipocytes and inhibits differentiation of preadipocytes.PNAS 100:16:9476-9481, 2003.43. Ludwig, D. S., et al. Melanin-concentrating hormone overexpression in transgenic miceleads to obesity and insulin resistance. J. Clin. Invest. 107:379-386, 2001.44. Moon, Y. S., et al. Mice Lacking Paternally Expressed Pref-1/Dlk1 Display GrowthRetardation and Accelerated Adiposity. Molecular And Cellular Biology22:15: 5585-5592, 2002.45. Murray, I., A. D. Sniderman, P. J. Havel, and K. Cianflonei. Acylation StimulatingProtein (ASP) Deficiency Alters Postprandial and Adipose Tissue Metabolism inMale Mice. e Journal Of Biological Chemistry 274:51:36219-36225, 1999.46. Phan,L. K., F. Lin, C. A. LeDuc, W. K. Chung, and R. L. Leibel. e mousemahoganoid coat color mutation disrupts a novel C3HC4 RING domain protein.J. Clin. Invest. 110:1449-1459, 2002.47. Pierroz, D. D., M. Ziotopoulou, L. Ungsunan, S. Moschos, J. S. Flier, and C. S.Mantzoros. Effects of Acute and Chronic Administration of the Melanocortin Agonist MTII in Mice With Diet-Induced Obesity. Diabetes 51:1337-1345, 2002.48. Rosenfeld, C. S., K. M. Grimm, K. A. Livingston, A. M. Brokman, W. E. Lamberson,and R. M. Roberts. Striking variation in the sex ratio of pups born to mice according to whether maternal diet is high in fat or carbohydrate. PNAS 100:8:4628-4632, 2003. 49. Chirala, S. S., et al. Fatty acid synthesis is essential in embryonic development: Fatty acidsynthase null mutants and most of the heterozygotes die in utero.PNAS 100:11:6358-6363, 2003.50. Takahashi, N., et al. Divergent Effects of Leptin in Mice Susceptible or Resistant toObesity. Horm Metab Res 34:691-697, 2002.51. upari, J. N., L. E. Landree, G. V. Ronnett, and F. P. Kuhajda. C75 increases peripheralenergy utilization and fatty acid oxidation in diet-induced obesity.PNAS 99:14:9498-9502, 2002.52. T ortoriello, D. V., J. Mcminn, and S. C. Chua. Dietary-Induced Obesity andHypothalamic Infertility in Female DBA/2J Mice.Endocrinology 145: 1238-1247, 2004.53. Weisberg, S. P., et al. Obesity is associated with macrophage accumulation in adiposetissue. J. Clin. Invest. 112:1796-1808, 2003.54. Xu, H. et al. Chronic inflammation in fat plays a crucial role in the development ofobesity related insulin resistance. J. Clin. Invest. 112:1821-1830, 2003.55. Yamashita, T., et al. Enhanced insulin sensitivity in mice lacking ganglioside GM3.PNAS 100:6:3445-3449, 2003.56. Bagnasco, M., M. G. Dube, A. Katz, P. S. Kalra, and S. P. Kalra. Leptin Expression InHypothalamic Pvn Reverses Dietary Obesity And Hyperinsulinemia But StimulatesGhrelin. Obes Res. 11:1463-1470, 2003.57. Borowsky, B., et al. Antidepressant, anxiolytic and anorectic effects of amelaninconcentrating hormone-1 receptor antagonist.Nature Medicine 8:8:825-830, 2002.58. Chan, C. B., et al. Increased Uncoupling Protein-2 Levels in b-cells Are AssociatedWith Impaired Glucose-Stimulated Insulin Secretion. Diabetes 50:1302-1310, 2001. 59. Chen, L. and B. L. G. Nyomba. Glucose Intolerance and Resistin Expression in RatOffspring Exposed to Ethanol in Utero: Modulation by Postnatal High-Fat Diet.Endocrinology 144:500-508, 2003.60. Farley, C., J. A. Cook, B. D. Spar, T. M. Austin, and T. J. Kowalski. Meal PatternAnalysis Of Diet-Induced Obesity In Susceptible And Resistant Rats.Obes Res. 11:845-851, 2003.61. Gao, J., L. Ghibaudi, M. Van Heek, J. J. Hwa. Characterization of diet-induced obeserats that develop persistent obesity after 6 months of high-fat followed by 1 month of low-fat diet. Brain Research 936:87-90, 2002.62. Ogilvie, K. M., R. Saladin, T. R. Nagy, M. S. Urcan, R. A. Heyman, and M. D.Leibowitz. Activation of the Retinoid X Receptor Suppresses Appetite in the Rat.Endocrinology 145:565-573, 2004.63. Shklyaev, S., et al. Sustained peripheral expression of transgene adiponectin offsets thedevelopment of diet-induced obesity in rats. PNAS 100:24:14217-14222, 2003.64. Hildebrandt, A. L., D. M. Kelly-Sullivan, S. C. Black. Antiobesity effects of chroniccannabinoid CB1 receptor antagonist treatment in diet-induced obese mice.European Journal of Pharmacology 462:125-132, 2003.。
饲料蛋白质质量的评定方法蛋白质质量的评定已经历了一百多年的历史,方法较多。
现首先简要介绍几种有代表性的或目前还有一定意义的评定方法,然后重点对目前较流行的可消化(可利用)氨基酸及瘤胃降解与非降解蛋白进行介绍。
( 一 ) 粗蛋白质 (Crude Protein ,缩写 CP) 粗蛋白是使用较早的蛋白质质量评定指标,仅能反应饲料或饲粮总含氮物的多少。
( 二 ) 可消化粗蛋白质 (Digestible Crude Protein ,缩写DCP) 饲料可消化粗蛋白质可由其粗蛋白质含量乘以粗蛋白消化率而得。
同一种动物对不同饲料蛋白质的消化率不同,不同的动物对同一饲料蛋白质的消化率也不完全相同。
饲料可消化蛋白质可粗略地反映饲料蛋白质的质量。
( 三 ) 蛋白质的生物学价值 (Biological Value ,缩写 BV) 生物学价值指动物利用的氮占吸收氮的百分比,即:食入氮 -( 粪氮 + 尿氮 )BV =──────────────× 100%食入氮 - 粪氮以上公式所得的 BV 值称表观生物学价值。
从粪氮中扣除来自内源的代谢粪氮 (MFN) ,从尿氮中扣除非饲料来源的内源尿氮 (EUN) ,则可计算出真生物学价值 (TBV) :食入氮 -(粪氮 -MFN)-(尿氮 -EUN)TBV =─────────────────× 100%食入氮 -( 粪氮 -MFN)蛋白质的 BV 值愈高,说明其质量愈好。
饲料蛋白质的 BV 值一般在 50-80 范围内。
( 四 ) 净蛋白利用率 (Net Protein Utilization ,缩写 NPU) 净蛋白利用率是指动物体内沉积的蛋白质或氮占食入的蛋白质或氮的百分比,即:沉积氮 (CP)NPU =──────× 100 或 NPU = BV ×氮 (CP) 的消化率食入氮 (CP)最初, NPU 是用食入含氮饲粮 ( 或饲料 ) 时机体的含氮量减去食入无氮饲粮 ( 或饲料 ) 时机体含氮量的差,再除以食入氮而得。
饲料中维吉尼亚霉素的测定1范围本文件描述了饲料中维吉尼亚霉素的液相色谱-串联质谱和高效液相色谱测定方法。
本文件适用于配合饲料、浓缩饲料、精料补充料、添加剂预混合饲料和混合型饲料添加剂中维吉尼亚霉素(以维吉尼亚霉素M1和维吉尼亚霉素S1质量分数之和计)的测定。
本文件液相色谱-串联质谱法维吉尼亚霉素M1和维吉尼亚霉素S1的检出限均为0.02mg/kg,定量限均为0.05mg/kg;高效液相色谱法维吉尼亚霉素M1和维吉尼亚霉素S1的检出限均为0.5mg/kg,定量限均为1mg/kg。
2规范性引用文件下列文件中的内容通过文中的规范性引用而构成本文件必不可少的条款。
其中,注日期的引用文件,仅该日期对应的版本适用于本文件;不注日期的引用文件,其最新版本(包括所有的修改单)适用于本文件。
GB/T6682分析实验室用水规格和试验方法GB/T20195动物饲料试样的制备3术语和定义本文件没有需要界定的术语和定义。
4液相色谱-串联质谱法4.1原理试样中的维吉尼亚霉素用乙酸乙酯提取,经净化盐包和固相萃取柱净化,液相色谱-串联质谱仪测定,外标法定量。
4.2试剂或材料除非另有规定,仅使用分析纯试剂。
4.2.1水:GB/T 6682,一级。
4.2.2乙酸乙酯。
4.2.3正己烷。
4.2.4甲醇:色谱纯。
4.2.5乙腈:色谱纯。
4.2.6甲酸:色谱纯。
14.2.7乙酸铵溶液(0.05mmol/L,pH4.0):称取3.85g无水乙酸铵,用水溶解稀释定容至1000mL,用冰乙酸调节pH至4.0。
4.2.8甲醇乙酸铵溶液:将甲醇(4.2.4)和乙酸铵溶液(4.2.7)按体积比1:3的比例混合,摇匀。
4.2.940%甲醇溶液:量取40mL甲醇(4.2.4),用水稀释至100mL,混匀。
4.2.1040%乙腈溶液:量取40mL乙腈(4.2.5),用水稀释至100mL,混匀。
4.2.110.1%甲酸溶液:移取1mL甲酸(4.2.6),用水稀释至1000mL,混匀。
Revised: March 1996 32.1.17AOAC Official Method 991.43Total, Soluble, and Insoluble Dietary Fiber in FoodsEnzymatic-Gravimetric Method, MES–TRIS BufferFirst Action 1991Final Action 1994Codex-Adopted—AOAC Method*(Applicable to processed foods, grain and cereal products, fruits, and vegetables.)Method Performance:See Table 991.43A for method performance data.A. PrincipleDuplicate samples of dried foods, fat-extracted if containing >10%fat, undergo sequential enzymatic digestion by heat stable α-amylase,protease, and amyloglycosidase to remove starch and protein. For total dietary fiber (TDF), enzyme digestate is treated with alcohol to precipi-tate soluble dietary fiber before filtering, and TDF residue is washed with alcohol and acetone, dried, and weighed. For insoluble and soluble dietary fiber (IDF and SDF), enzyme digestate is filtered, and residue (IDF) is washed with warm water, dried and weighed. For SDF,combined filtrate and washes are precipitated with alcohol, filtered,dried, and weighed. TDF, IDF, and SDF residue values are corrected for protein, ash, and blank.B. Apparatus(a ) Beakers.—400 or 600 mL tall-form.Table 991.43A Method Performance for Total, Soluble, and Insoluble Dietary Fiber in Foods (Fresh Weight Basis),Enzymatic-Gravimetric Method, MES-TRIS BufferFood Mean, g/100 g s r s R RSD r%RSD R % Barley 12.250.360.85 2.88 6.89High-fiber cereal 33.730.700.94 2.08 2.79 Oat bran 16.92 1.06 2.06 6.2612.17 Soy bran 67.14 1.01 1.06 1.50 1.58 Apricots 1.120.010.010.890.89 Prunes 9.290.130.40 1.404.31 Raisins 3.130.090.15 2.88 4.79 Carrots 3.930.130.13 3.31 3.31 Green beans 2.890.070.07 2.42 2.42 Parsley 2.660.070.14 2.635.26Soluble dietary fiber (SDF) Barley 5.020.400.628.0112.29 High-fiber cereal 2.780.440.5615.83 20.14 Oat bran 7.170.72 1.1410.04 15.90 Soy bran6.900.300.60 4.358.70 Apricots 0.530.020.02 3.77 3.77 Prunes 5.070.110.31 2.17 6.11 Raisins 0.730.050.16 6.8521.92 Carrots 1.100.070.18 6.3616.36 Green beans 1.020.080.117.8410.78 Parsley 0.640.030.10 4.6915.63 Insoluble dietary fiber (IDF) Barley 7.050.610.618.628.62 High-fiber cereal 30.520.440.71 1.44 2.33 Oat bran9.730.85 1.178.7412.02 Soy bran 60.530.700.70 1.16 1.16 Apricots 0.590.020.02 3.39 3.39 Prunes 4.170.070.09 1.68 2.16 Raisins 2.370.040.07 1.69 2.95 Carrots 2.810.090.16 3.20 5.69 Green beans 2.010.080.08 3.98 3.98 Parsley 2.370.120.24 5.0610.13 Total dietary fiber (SDF + IDF) Barley 12.140.390.70 3.21 5.77 High-fiber cereal 33.300.630.90 1.89 2.70 Oat bran 16.900.99 1.49 5.868.82 Soy bran 67.560.560.940.83 1.39 Apricots 1.120.020.02 1.79 1.79 Prunes 9.370.120.30 1.28 3.20 Raisins 3.100.050.18 1.61 5.81 Carrots 3.920.110.13 2.81 3.32 Green beans 3.030.090.12 2.97 3.96 Parsley 3.010.120.23 3.997.64(b ) Filtering crucible.—With fritted disk, coarse, ASTM 40–60µm pore size, Pyrex 60 mL (Corning No. 36060 Bchner, Corning,Inc., Science Products, Corning, NY 14831, USA, or equivalent).Prepare as follows. Ash overnight at 525° in muffle furnace. Let furnace temperature fall below 130° before removing crucibles.Soak crucibles 1 h in 2% cleaning solution at room temperature.Rinse crucibles with H 2O and then deionized H 2O; for final rinse,use 15 mL acetone and then air-dry. Add ca 1.0 g Celite to dry crucibles, and dry at 130° to constant weight. Cool crucible ca 1h in desiccator, and record weight, to nearest 0.1 mg, of crucible plus Celite.(c ) V acuum system.—V acuum pump or aspirator with regulating device. Heavy walled filtering flask, 1 L, with side arm. Rubber ring adaptors, for use with filtering flasks.(d ) Shaking water baths.—(1) Capable of maintaining 98 2°,with automatic on-and-off timer. (2) Constant temperature, adjust-able to 60°.(e ) Balance.—Analytical, sensitivity 0.1 mg.(f ) Muffle furnace.—Capable of maintaining 525 5°.(g ) Oven.—Capable of maintaining 105 and 130 3°.(h ) Desiccator .—With SiO 2 or equivalent desiccant. Biweekly,dry desiccant overnight at 130°.(i ) pH meter .—Temperature compensated, standardized with pH 4.0, 7.0, and 10.0 buffer solutions.(j ) Pipetters .—With disposable tips, 100–300 µL and 5 mL capacity.(k ) Dispensers.—Capable of dispensing 15 0.5 mL for 78%ethanol, 95% ethanol, and acetone; 40 0.5 mL for buffer.(l ) Magnetic stirrers and stir bars.C. ReagentsUse deionized water throughout.(a ) Ethanol solutions.—(1) 85%. Place 895 mL 95% ethanol into 1 L volumetric flask, dilute to volume with H 2O. (2) 78%. Place 821 mL 95% ethanol into 1 L volumetric flask, dilute to volume with H 2O.(b ) Heat-stable α-amylase solution.—Catalog Number A 3306,Sigma Chemical Co., St. Louis, MO 63178, USA, or Termamyl 300L, Catalog Number 361-6282, Novo-Nordisk, Bagsvaerd, Den-mark, or equivalent.(c ) Protease.—Catalog Number P 3910, Sigma Chemical Co, or equivalent. Prepare 50 mg/mL enzyme solution in MES/TRIS buff-er fresh daily.(d ) Amyloglucosidase solution .—Catalog Number AMG A9913,Sigma Chemical Co, or equivalent. Store at 0–5°.(e ) Diatomaceous earth.—Acid washed (Celite 545 AW, No.C8656, Sigma Chemical Co. or equivalent).(f ) Cleaning solution .—Liquid surfactant-type laboratory cleaner, designed for critical cleaning (Micro ®, International Prod-ucts Corp., Burlington, NJ 08601, USA, or equivalent). Prepare 2%solution in H 2O.(g ) MES .—2-(N -Morpholino)ethanesulfonic acid (No. M-8250,Sigma Chemical Co., or equivalent.)(h ) TRIS.—Tris(hydroxymethyl)aminomethane (No. T-1503,Sigma Chemical Co., or equivalent).(i ) MES–TRIS buffer solution.—0.05M MES, 0.05M TRIS, pH 8.2 at 24°. Dissolve 19.52 g MES and 12.2 g TRIS in 1.7 L H 2O.Adjust pH to 8.2 with 6N NaOH, and dilute to 2 L with H 2O.(Note: It is important to adjust pH to 8.2 at 24°. However, if buffer temperature is 20°, adjust pH to 8.3; if temperature is 28°,adjust pH to 8.1. For deviations between 20 and 28°, adjust by interpolation.)(j ) Hydrochloric acid solution.—0.561N . Add 93.5 mL 6N HCl to ca 700 mL H 2O in 1 L volumetric flask. Dilute to 1 L with H 2O.D. Enzyme PurityTo ensure absence of undesirable enzymatic activities and pres-ence of desirable enzymatic activities, run standards listed in Table 991.43B each time enzyme lot changes or at maximum interval of 6months.E. Sample Preparation and DigestionPrepare samples as in 985.29E (see 45.4.07) (if fat content of sample is unknown, defat before determining dietary fiber). For high sugar samples, desugar before determining dietary fiber by extract-ing 2–3 times with 85% ethanol, 10 mL/g, decanting, and then drying overnight at 40°.Run 2 blanks/assay with samples to measure any contribution from reagents to residue.Weigh duplicate 1.000 0.005 g samples (M 1 and M 2), accurate to 0.1 mg, into 400 mL (or 600 mL) tall-form beakers. Add 40 mL MES–TRIS buffer solution, pH 8.2, to each. Stir on magnetic stirrer until sample is completely dispersed (to prevent lump formation,which would make test material inaccessible to enzymes).Add 50 µL heat-stable α-amylase solution, stirring at low speed.Cover beakers with Al foil, and incubate in 95–100° H 2O bath 15min with continuous agitation. Start timing once bath temperature reaches 95° (total of 35 min is normally sufficient).Remove all beakers from bath, and cool to 60°. Remove foil.Scrape any ring from inside of beaker and disperse any gels in bottom of beaker with spatula. Rinse beaker walls and spatula with 10 mL H 2O.Add 100 µL protease solution to each beaker. Cover with Al foil,and incubate 30 min at 60 1° with continuous agitation. Start timing when bath temperature reaches 60°.Remove foil. Dispense 5 mL 0.561N HCl into beakers while stirring. Adjust pH to 4.0–4.7 at 60°, by adding 1N NaOH solution or 1N HCl solution. (Note: It is important to check and adjust pH while solutions are 60° because pH will increase at lower tempera-tures.) (Most cereal, grain, and vegetable products do not require pH adjustment. Once verified for each laboratory, pH checking procedure can be omitted. As a precaution, check pH of blank routinely; if outside desirable range, check samples also.)Add 300 µL amyloglucosidase solution while stirring. Cover with Al foil, and incubate 30 min at 60 1° with constant agitation. StartTable 991.43B Standards for Testing Enzyme Activity Standard Activity Tested Weight of Standard, gExpected Recovery, (%)Citrus pectin Pectinase 0.1–0.295–100 Arabinogalactan Hemicellulase 0.1–0.295–100β-Glucan β-Glucanase 0.1–0.295–100Wheat starch α-Amylase + AMG 1.0 0–1 Corn starch α-Amylase + AMG 1.00–1Casein Protease0.30–1timing once bath reaches 60°.F. Determination of Total Dietary FiberTo each digested sample, add 225 mL (measured after heating) 95% ethanol at 60°. Ratio of ethanol to sample volume should be 4:1. Remove from bath, and cover beakers with large sheets of Al foil. Let precipitate form 1 h at room temperature.Wet and redistribute Celite bed in previously tared crucible B(b), using 15 mL 78% ethanol from wash bottle. Apply suction to crucible to draw Celite onto fritted glass as even mat.Filter alcohol-treated enzyme digestate through crucible. Using wash bottle with 78% ethanol and rubber spatula, quantitatively transfer all remaining particles to crucible. (Note: If some samples form a gum, trapping the liquid, break film with spatula.)Using vacuum, wash residue 2 times each with 15 mL portions of 78% ethanol, 95% ethanol, and acetone. Dry crucible containing residue overnight in 105° oven. Cool crucible in desiccator ca 1 h. Weigh crucible, containing dietary fiber residue and Celite, to near-est 0.1 mg, and calculate residue weight by subtracting weight of dry crucible with Celite, B(b).Use one duplicate from each sample to determine protein, by method 960.52 (see 12.1.07), using N× 6.25 as conversion factor. For ash analysis, incinerate second duplicate 5 h at 525°. Cool in desiccator, and weigh to nearest 0.1 mg. Subtract weight of crucible and Celite, B(b), to determine ash weight.G. Determination of Insoluble Dietary FiberWet and redistribute Celite bed in previously tared crucible, B(b), using ca 3 mL H2O. Apply suction to crucible to draw Celite into even mat. Filter enzyme digestate, from E, through crucible into filtration flask. Rinse beaker, and then wash residue 2 times with 10 mL 70° H2O. Combine filtrate and water washings, transfer to pretared 600 mL tall-form beaker, and reserve for determination of soluble dietary fiber, H. Using vacuum, wash residue 2 times each with 15 mL portions of 78% ethanol, 95% ethanol, and acetone. (Note: Delay in washing IDF residues with 78% ethanol, 95% ethanol, and acetone may cause inflated IDF values.)Use duplicates to determine protein and ash as in F.H. Determination of Soluble Dietary FiberProceed as for insoluble dietary fiber determination through in-struction to combine the filtrate and water washings in pretared 600 mL tall-form beakers. Weigh beakers with combined solution of filtrate and water washings, and estimate volumes.Add 4 volumes of 95% ethanol preheated to 60°. Use portion of 60° ethanol to rinse filtering flask from IDF determination. Alterna-tively, adjust weight of combined solution of filtrate and water washings to 80 g by addition of H2O, and add 320 mL 60° 95% ethanol. Let precipitate form at room temperature 1 h.Follow TDF determination, F, from “Wet and redistribute Celite bed . . . .”I. CalculationsBlank (B, mg) determination:B = [(BR1 + BR2)/2] – P B – A Bwhere BR1 and BR2 = residue weights (mg) for duplicate blank determinations; and P B and A B = weights (mg) of protein and ash, respectively, determined on first and second blank residues. Dietary fiber (DF, g/100 g) determination:DF = {[(R1 + R2)/2] – P – A – B}/[(M1 + M2)/2] × 100 where R1 and R2 = residue weights (mg) for duplicate samples; P and A = weights (mg) of protein and ash, respectively, determined on first and second residues; B = blank weight (mg); and M1 and M2 = weights (mg) for samples.Total dietary fiber determination: Determine either by independent analysis, as in F, or by summing IDF and SDF, as in G and H. Reference: J. AOAC Int. 75, 395(1992).*Adopted as a Codex Defining Method for gravimetry/enzymatic di-gestion of total dietary fiber in infant formula and follow-up for-mula.。
新版NRC 奶牛饲养标准简介奶牛,像其他反刍动物一样,对营养有两个基本需求:一是动物个体或机体的营养需要,另一个是反刍动物体内微生物的营养需求。
反刍动物与寄生于体内的微生物是共生关系,反刍动物为微生物提供食物来源和适宜的生存环境,微生物又为反刍动物提供营养来源。
就我们所知的奶牛对营养的需求,应该包括对营养物质的需求量,以及该种营养物质和其他营养物质的反应来共同作用于机体健康正常的生理生化反应和动物生产,以及体内微生物的需要,这是奶牛最基本的营养需要。
奶牛营养需要(NRC —2001)是一套关于奶牛各个生长阶段的营养需求和管理的详细饲养标准。
NRC-2001 对于经产母牛、初产母牛和犊牛的营养需求是一份很详尽的参考。
NRC-2001还包括根据动物营养需要用计算机模型设计的饲料配方系统。
配方设计可分为三步:(1)确定动物所需营养物质,以及根据动物所处环境和饲养条件选择原料;(2)确定饲料营养价值以及对牧草和其他饲料的消化率;(3)按照动物营养需要以及饲料营养价值进行设计配方,尽量减少浪费和对环境的污染。
本文对NRC-2001中关于奶牛营养的三个主要的部分进行了介绍和摘要 干物质摄入量(DMI):泌乳奶牛NRC —2001总结出泌乳奶牛对干物质进食量的预测公式。
这个公式通过对17,200多头奶牛数周的对DMI 进食量分析后总结得来。
数据包括大约1/3的第一个泌乳期和2/3的第二及以上泌乳期奶牛,代表了大部分的饲养管理体系。
泌乳奶牛的DMI 的预测公式可广泛应用于奶牛产奶的所有阶段包括第一泌乳期和以后的泌乳期:DMI (千克/天)=(0.372*4%FCM+0.0968*BW 0.75)*)1))62.3(*192.0(+--WOL e 式中 4%FCM ——为4%乳脂率矫正奶量(千克/天) BW ——为体重(千克) WOL ——为泌乳周 e=2.71828用于调节泌乳早期干物质进食量的降低,WOL 变化很大,尤其是在前十周(图1),WOL对DMI的影响是非常敏感的。
4.2.11AOAC Official Method2001.11Protein(Crude)in Animal Feed,Forage(Plant Tissue),Grain,and OilseedsBlock Digestion Method Using Copper Catalystand Steam Distillation into Boric AcidFirst Action2001[Applicable to the determination of0.5–50%Kjeldahl N (3–300%equivalent crude protein)in forage,animal feed and pet food,grain,and oilseeds,and applicable to the same matrixes as 976.05(4.2.05),976.06(4.2.06),984.13(4.2.09),988.05(4.2.03), and990.02(4.2.07);the method does not measure oxidized forms of N or heterocyclic N compounds.]See Tables2001.11A and B for the results of the interlaboratory study,expressed on a protein basis(N×6.25),supporting accep-tance of the method.A.PrincipleThe material is digested in H2SO4to convert the protein N to (NH4)2SO4at a boiling point elevated by the addition of K2SO4with a Cu catalyst to enhance the reaction rate.Ammonia is liberated by alkaline steam distillation and quantified titrimetrically with stan-dardized acid.Aluminum block heaters increase the efficiency of the digestion.The digest must contain residual H2SO4to retain the NH3.Water is added manually or automatically to the digest to avoid mixing concentrated alkali with concentrated acid and to prevent the digest from solidifying.Concentrated NaOH is added to neutralize the acid and make the digest basic,and the liberated NH3is distilled into a bo-ric acid solution and titrated with a stronger standardized acid,HCl, to a colorimetric endpoint.The same endpoint detection system (e.g.,indicator,wavelength)must be used for the standardization of the HCl and for the analyte.The analyte is referred to as“crude”protein because the method determines N,a component of all proteins.In addition,N from sources other than true protein is also determined.(Additional diges-tion procedures must be used in order to include N from nitrate.)The amount of protein in most materials is calculated by multiplying%N by6.25,because most proteins contain16%N.The H2SO4and NaOH used are in concentrated form and are highly corrosive.Wear gloves and eye protection while handling the chemicals.Do not mix concentrated acid and NaOH directly.If chemicals are splashed on the skin or in the eyes,flush with copious amounts of water.Seek medical attention.Do not breathe the sulfur oxide fumes produced during digestion.B.Apparatus(a)Digestion block.—Aluminum alloy block with adjustable temperature device for measuring and controlling block temperature (Tecator Digestion System20,1015Digestor,Foss North America, 7682Executive Dr,Eden Prairie,MN55344,USA; +1-952-974-9892,F a x:+1-952-974-9823, info@;or equivalent).(b)Digestion tubes.—250mL.(c)Distillation units.—(1)For steam distillation.—Foss Tecator2200,or equivalent,to accept250mL digestion tubes and 500mL titration flasks.(2)For steam distillation and autotitration.—Foss Tecator2300,or equivalent.(d)Titration flask.—500mL graduated Erlenmeyer flask(for collection and titration of distillate).(e)Fume exhaust manifold.—With Teflon ring seals,connected to a water aspirator in a hooded sink.(f)Weighing paper.—Low N,Alfie Packers No.201(Alfie Packers,Inc.,8901J St,Ste10,Omaha,NE68127,USA),or Fisher 09-898-12A,3×3in.(76×76mm),or equivalent.(g)Pipetting dispenser.—25mL,adjustable volume,attached to a5pint(2.4L)acid bottle.C.Reagents(a)Sulfuric acid.—Concentrated,95–98%H2SO4,reagent grade.Table2001.11A Interlaboratory study results for the determination of crude protein by block digestion with a copper catalyst and distillation into4%boric acidID No.of labs a Mean,%RSD r,%RSD R,%HORRAT Protein block10(1)40.190.450.760.333 Swine pellets10(1)37.040.470.600.256Corn silage117.10 1.64 2.160.726 Grass hay117.11 1.94 1.940.650Fish meal1164.670.730.980.460Dog food1124.500.870.910.369 Chinchilla food1118.010.890.990.383 Albumin10(1)79.140.400.440.212 Birdseed1113.480.88 1.290.475Meat and bone meal1150.06 1.90 1.900.857Milk replacer1120.78 1.39 1.390.550 Soybeans9(2)38.760.490.540.236 Sunflower seeds1117.43 2.38 2.380.916 Legume hay1118.81 1.45 1.450.565a Each value is the number of laboratories retained after elimination of outliers;each value in parentheses is the number of laboratories removed as outliers.(b)Catalyst.—7.0g K2SO4+0.8g CuSO4.(Commercially avail-able in tablet form as3.5g K2SO4and0.4g CuSO4per tablet.) (c)Sodium hydroxide solution.—40%(w/w)NaOH,low N (≤5µg N/g).(d)Methyl red indicator solution.—Dissolve100mg methyl red in100mL methanol.(e)Bromocresol green indicator solution.—Dissolve100mg bromocresol green in100mL methanol.(f)Boric acid solution.—4%(w/v).Dissolve400g H3BO3in 5–6L hot deionized water.Mix and add more hot deionized water to a volume of about9L.Cool to room temperature,add100mL bromocresol green solution and70mL methyl red solution,and dilute to a final volume of10L.Adjust to obtain a positive blank of0.05–0.15 mL with30mL H3BO3solution,using0.1M NaOH(to increase blank) or0.1M HCl(to decrease blank).Commercially available.(g)Boric acid solution.—1%(w/v).(Optional trapping solution for titrators that automatically begin titration when distillation be-gins.)Dissolve100g H3BO3in5–6L hot deionized water,mix,and add more hot deionized water to a volume of about9L.Cool to room temperature,add100mL bromocresol green solution and70mL methyl red solution,and dilute to a final volume mer-cially available.(h)Hydrochloric acid standard solution.—0.1000M.Prepare as in936.15(see A.1.06)or use premade solution of certified specifica-tion range0.0995–0.1005M,and use0.1000M for -mercially available.(i)Reference standards.—Ammonium sulfate,tryptophan, lysine·HCl,or glycine p-toluenesulfonic acid,for use as standard;99.9%.(j)Sucrose.—N-free.D.Preparation of Analytical SampleGrind dry laboratory sample to fineness of grind(ca0.7–1mm), which gives a relative standard deviation(RSD)of≤2.0%for10suc-cessive determinations of N in ground mixture of corn grain and soy-beans(2+1).Fineness required to achieve this precision must be used for all dry mixed feeds and other nonuniform materials.Mix liquids to uniformity.E.Determination(a)Digestion.—Turn on block digestor and heat to420°C. Weigh materials,as indicated below,recording each test portion weight(W)to the nearest mg for weights of≥1g,and to the nearest 0.1mg for weights of<1.0g.Do not exceed1.2g.For materials with 3–25%protein,weigh approximately1.0g test portion;with 25–50%protein,approximately0.5g test portion;and>50%pro-tein,approximately0.3g test portion.(1)Dry feed,forage,cereal,grain,oilseeds.—Weigh1g test por-tion of ground,well-mixed test portion onto a tared,low N weighing paper.Fold paper around material and drop into a numbered Kjeldahl tube.(2)Liquid feed.—Weigh slightly>1g test portion of well-mixed analytical sample into a small tared beaker.Quantitatively transfer to a numbered Kjeldahl tube with<20mL deionized water.Alterna-tively,weigh slightly>1g well-mixed test portion into a small tared beaker.Transfer to a numbered Kjeldahl tube and reweigh beaker. The differential weight loss corresponds to the amount of test por-tion actually transferred to the tube.(b)Standards.—Perform quality control analysis and analyses of standards with each batch.The standards available from Hach Co. (PO Box389,Loveland,CO80539,USA;+1-800-227-4224or+1-970-669-3050),Sigma(St.Louis,MO),J.T.Baker(Phillipsburg, NJ),the National Institute of Standards and Technology(NIST; Gaithersburg,MD)are listed in Table2001.11C.The various ammonium salts and glycine p-toluenesulfonate serve primarily as a check on distillation efficiency and accuracy in titration steps because they are digested very readily.Lysine and nic-otinic acid p-toluenesulfonate serve as a check on digestion effi-ciency because they are difficult to digest.Include a reagent blank tube containing a folded low N weighing paper with each batch.(c)Digestion.—Add2catalyst tablets to each tube.Add12mL H2SO4to each tube,using pipetting dispenser;add15mL for high fat materials(>10%fat).Mixtures may be held overnight at this point.If mixture foams,slowly add3mL30–35%H2O2.Let reaction subside in perchloric acid fume hood or in exhaust system.Attach heat side shields to tube rack.Place fume manifold tightly on tubes,and turn water aspirator on completely.Place rack of tubes in preheated block.After10min,turn water aspirator down until acid fumes are just contained within exhaust hood.A condensation zone should be maintained within the tubes.After bulk of sulfur ox-ide fumes are produced during initial stages of digestion,reduce vac-uum source to prevent loss of H2SO4.Digest additional50min.Total digestion time is approximately60min.Turn digestor off.Remove rack of tubes with exhaust still in place, and put in the stand to cool for10–20min.Cooling can be increased by using commercial air blower or by placing in hood with hood sash pulled down to increase airflow across tubes.When fuming has stopped,remove manifold,and shut off aspirator.Remove side shields.Let tubes cool.Wearing gloves and eye protection,predilute digests manually before distilling.Carefully add a few milliliters of deionized water to each tube.If spattering occurs,the tubes are too hot.Let cool for a few more minutes.Add water to each tube to a to-tal volume of approximately80mL(liquid level should be about half way between the2shelves of the tube rack).This is a convenient stopping point.If digest solidifies,place tube containing diluted digest in block digester,and carefully warm with occasional swirling until salts dis-Table2001.11B Interlaboratory study results for the recovery of nitrogen from standard compounds by block digestion with a cop-per catalyst and distillation into boric acidCompound No.of labs a Theoretical yield,%N Avg.found,%N Avg.rec.,%RSD R,%HORRAT Acetanilid10(0)10.3610.37100.1 1.500.53 Lysine⋅HCl10(0)15.3413.3286.8 4.16 1.53 Tryptophan10(0)13.7213.5598.8 1.040.39a Each value is the number of laboratories retained after elimination of outliers;each value in parentheses is the number of laboratories removed as outliers.solve.If distilling unit equipped with steam addition for equilibration is used,the manual dilution steps can be omitted.About70mL deionized water is then automatically added during the distillation cycle. (e)Distillation.—Place40%NaOH in alkali tank of distillation unit.Adjust volume dispensed to50mL.Attach digestion tube con-taining diluted digest to distillation unit,or use automatic dilution feature,if available.Place graduated500mL Erlenmeyer titration flask containing30mL H3BO3solution with indicator on receiving platform,and immerse tube from condenser below surface of H3BO3 solution.(When an automatic titration system is used that begins ti-tration immediately after distillation starts,1%H3BO3may be sub-stituted.)Steam distill until≥150mL distillate is collected(≥180mL total volume).Remove receiving flask.Titrate H3BO3receiving so-lution with standard0.1000M HCl to violet endpoint(just before the solution goes back to pink).Lighted stir plate may aid visualization of endpoint.Record milliliters of HCl to at least the nearest0.05mL. This is done automatically by using a steam distiller with auto-matic titration.Follow the manufacturer’s instructions for operation of the specific distiller or distiller/titrator.F.Verification of Nitrogen RecoveryRun N recoveries to check accuracy of procedure and equipment.(a)Nitrogen loss.—Use0.12g(NH4)2SO4and0.67g sucrose per flask.Add all other reagents as in E,and distill under same condi-tions as in E.Recoveries must be≥99%.(b)Distillation and titration efficiency.—Distill0.12g (NH4)2SO4,omitting digestion.Recoveries must be≥99.5%. (c)Digestion efficiency.—Use0.3g acetanilide or0.18g tryptophan,with0.67g sucrose per flask.Add all other reagents as stated in E.Digest and distill under same conditions as used for a de-termination.Recoveries must be≥98%.G.CalculationsKjeldahl nitrogen,%=(V V)M14.01W10S B×××Crude protein,%=%Kjeldahl N×Fwhere V S=volume(mL)of standardized acid used to titrate a test; V B=volume(mL)of standardized acid used to titrate reagent blank; M=molarity of standard HCl;14.01=atomic weight of N;W= weight(g)of test portion or standard;10=factor to convert mg/g to percent;and F=factor to convert N to protein.F factors are5.70for wheat,6.38for dairy products,and6.25for other feed materials.Reference:J.AOAC Int.(future issue).Table2001.11C StandardsStandard Approximateweight,gTheoreticalyield,%NAmmonium p-toluenesulfonate(Hach22779-24)0.57.402Glycine p-toluenesulfonate(Hach22780-24)0.6 5.665Nicotinic acid p-toluenesulfonate(Hach22781-24)0.2 4.743Lysine monohydrochloride(Sigma L-5626)0.115.34 Acetanilide(Baker A068-05)0.310.36 Tryptophan(Sigma T8659)0.213.72 Ammonium saltsDiammonium hydrogen phosphate(100%assay)0.221.21 Ammonium chloride(100%assay)0.226.18 Ammonium sulfate(100%assay)0.221.2 Ammonium dihydrogen phosphate(NIST200)0.312.18 Citrus leaves(NIST1572) 1.0 2.86 Urea(NIST2141)0.146.63。