2011-Real Time Hand Pose Estimation using Depth Sensors
- 格式:pdf
- 大小:702.62 KB
- 文档页数:7
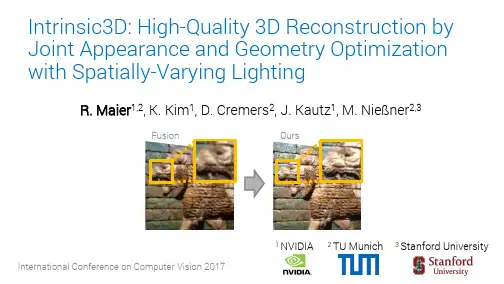
Intrinsic3D: High-Quality 3D Reconstruction by Joint Appearance and Geometry Optimization with Spatially-Varying LightingR. Maier1,2, K. Kim1, D. Cremers2, J. Kautz1, M. Nießner2,3OursFusion2 TU Munich1 NVIDIA 3 Stanford University•Motivation & State-of-the-art •Approach•Results•Conclusion•Motivation & State-of-the-art •Approach•Results•Conclusion•Recent progress in Augmented Reality (AR) /Virtual Reality (VR)Microsoft HoloLensHTC Vive•Recent progress in Augmented Reality (AR) /Virtual Reality (VR)HTC ViveMicrosoft HoloLens •Requirement of high-quality 3D content for AR,VR, Gaming …NVIDIA VR Funhouse•Recent progress in Augmented Reality (AR) /Virtual Reality (VR)Microsoft HoloLensHTC Vive •Requirement of high-quality 3D content for AR,VR, Gaming …•Usually: manual modelling (e.g. Maya)NVIDIA VR Funhouse•Recent progress in Augmented Reality (AR) /Virtual Reality (VR)Microsoft HoloLensHTC Vive •Requirement of high-quality 3D content for AR,VR, Gaming …•Usually: manual modelling (e.g. Maya)•Wide availability of commodity RGB-D sensors:efficient methods for 3D reconstructionNVIDIA VR Funhouse•Recent progress in Augmented Reality (AR) / Virtual Reality (VR)•Requirement of high-quality 3D content for AR, VR, Gaming …•Usually: manual modelling (e.g. Maya)•Wide availability of commodity RGB-D sensors:efficient methods for 3D reconstruction•Challenge: how to reconstruct high-quality 3D models with best-possible geometry and color from low-cost depth sensors?HTC ViveNVIDIA VR Funhouse Microsoft HoloLensRGB-D based 3D Reconstruction•Goal: stream of RGB-D frames of a scene →3D shape that maximizes the geometric consistencyRGB-D based 3D Reconstruction•Goal: stream of RGB-D frames of a scene →3D shape that maximizes the geometric consistency•Real-time, robust, fairly accurate geometric reconstructionsKinectFusion, 2011“KinectFusion: Real-time DenseRGB-D based 3D Reconstruction•Goal: stream of RGB-D frames of a scene →3D shape that maximizes the geometric consistency•Real-time, robust, fairly accurate geometric reconstructionsKinectFusion, 2011DynamicFusion, 2015“KinectFusion: Real-time Dense “DynamicFusion: Reconstruction and Tracking ofNon-rigid Scenes in Real-time”, Newcombe et al.,•Goal: stream of RGB-D frames of a scene →3D shape that maximizes the geometric consistency•Real-time, robust, fairly accurate geometric reconstructionsRGB-D based 3D ReconstructionBundleFusion, 2017DynamicFusion, 2015KinectFusion, 2011“KinectFusion: Real-time Dense “DynamicFusion: Reconstruction and Tracking ofNon-rigid Scenes in Real-time”, Newcombe et al., “BundleFusion: Real-time Globally Consistent 3D Reconstruction using On-the-fly SurfaceVoxel Hashing•Baseline RGB-D based 3D reconstruction framework•initial camera poses•sparse SDF reconstructionVoxel Hashing•Baseline RGB-D based 3D reconstruction framework•initial camera poses•sparse SDF reconstruction •Challenges:•(Slightly) inaccurate and over-smoothed geometryVoxel Hashing•Baseline RGB-D based 3D reconstruction framework•initial camera poses•sparse SDF reconstruction •Challenges:•(Slightly) inaccurate and over-smoothed geometry •Bad colorsVoxel Hashing•Baseline RGB-D based 3D reconstruction framework•initial camera poses•sparse SDF reconstruction •Challenges:•(Slightly) inaccurate and over-smoothed geometry •Bad colors•Inaccurate camera pose estimationVoxel Hashing•Baseline RGB-D based 3D reconstruction framework•initial camera poses•sparse SDF reconstruction •Challenges:•(Slightly) inaccurate and over-smoothed geometry •Bad colors•Inaccurate camera pose estimation•Input data quality (e.g. motion blur, sensor noise)Voxel Hashing•Baseline RGB-D based 3D reconstruction framework•initial camera poses•sparse SDF reconstruction •Challenges:•(Slightly) inaccurate and over-smoothed geometry •Bad colors•Inaccurate camera pose estimation•Input data quality (e.g. motion blur, sensor noise)Voxel Hashing•Baseline RGB-D based 3D reconstruction framework•initial camera poses•sparse SDF reconstruction •Challenges:•(Slightly) inaccurate and over-smoothed geometry •Bad colors•Inaccurate camera pose estimation•Input data quality (e.g. motion blur, sensor noise)•Goal: High-Quality Reconstruction of Geometry and ColorHigh-Quality Colors [Zhou2014]“Color Map Optimization for 3D Reconstruction with Consumer DepthCameras”, Zhou and Koltun, ToG 2014Optimize camera poses and image deformationsto optimally fit initial (maybe wrong) reconstructionBut: HQ images required, no geometry refinement involvedHigh-Quality Colors [Zhou2014]“Color Map Optimization for 3D Reconstruction with Consumer Depth Cameras”, Zhou and Koltun, ToG 2014Optimize camera poses and image deformationsto optimally fit initial (maybe wrong) reconstructionBut: HQ images required, no geometry refinement involvedHigh-Quality Geometry [Zollhöfer2015]“Shading -based Refinement on Volumetric Signed Distance Functions”, Zollhöfer et al., ToG 2015Adjust camera poses in advance (bundle adjustment) to improve color Use shading cues (RGB) to refine geometry (shading based refinement of surface & albedo)But: RGB is fixed (no color refinement based on refined geometry)High-Quality Colors [Zhou2014]“Color Map Optimization for 3D Reconstruction with Consumer Depth Cameras”, Zhou and Koltun, ToG 2014Optimize camera poses and image deformations to optimally fit initial (maybe wrong) reconstruction But: HQ images required, no geometry refinement involved High-Quality Geometry [Zollhöfer2015]“Shading -based Refinement on Volumetric Signed Distance Functions”, Zollhöfer et al., ToG 2015Adjustcamera poses in advance (bundle adjustment) to improve color Use shading cues (RGB) to refine geometry (shading based refinement of surface & albedo)But: RGB is fixed (no color refinement based on refined geometry)Idea:jointly optimize for geometry, albedo and image formation model to•Temporal view sampling & filtering techniques (input frames)•Temporal view sampling & filtering techniques (input frames)•Joint optimization of•surface & albedo (Signed DistanceField)•image formation model•Temporal view sampling & filtering techniques (input frames)•Joint optimization of•surface & albedo (Signed DistanceField)•image formation model•Temporal view sampling & filtering techniques (input frames)•Joint optimization of•surface & albedo (Signed DistanceField)•image formation model•Lighting estimation using Spatially-Varying Spherical Harmonics (SVSH)•Temporal view sampling & filtering techniques (input frames)•Joint optimization of•surface & albedo (Signed DistanceField)•image formation model•Lighting estimation using Spatially-Varying Spherical Harmonics (SVSH)•Optimized colors (by-product)Overview•Motivation & State-of-the-art •Approach•Results•ConclusionOverviewRGB-DOverviewRGB-D SDF FusionOverviewRGB-D SDF Fusion Shading-based Refinement(Shape-from-Shading)Overview RGB-D SDF Fusion Temporal view sampling / filteringShading-based Refinement (Shape-from-Shading)Overview RGB-D SDF Fusion Temporal view sampling / filteringShading-based Refinement (Shape-from-Shading)Spatially-VaryingLighting EstimationOverview RGB-D SDF Fusion Temporal view sampling / filteringShading-based Refinement (Shape-from-Shading)Spatially-VaryingLighting Estimation Joint Appearance andGeometry Optimization •surface•albedo•image formation modelOverview High-Quality 3DReconstruction RGB-D SDF Fusion Temporal view sampling / filteringShading-based Refinement (Shape-from-Shading)Spatially-VaryingLighting Estimation Joint Appearance andGeometry Optimization •surface•albedo•image formation modelOverviewRGB-DRGB-D DataExample: Fountain dataset•1086 RGB-D frames•Sensor:•Depth 640x480px•Color 1280x1024px•~10 Hz•Primesense•Poses estimated using Voxel HashingApproach OverviewSDF FusionVolumetric 3D model representation•Voxel grid: dense(e.g. KinectFusion) or sparse(e.g. Voxel Hashing)Volumetric 3D model representation•Voxel grid: dense(e.g. KinectFusion) or sparse(e.g. Voxel Hashing)•Each voxel stores:•Signed Distance Function (SDF): signed distance to closest surface •Color values•WeightsFusion of depth maps•Integrate depth maps into SDF with their estimated camera posesFusion of depth maps•Integrate depth maps into SDF with their estimated camera poses•Voxel updates using weighted averageFusion of depth maps•Integrate depth maps into SDF with their estimated camera poses•Voxel updates using weighted averageFusion of depth maps•Integrate depth maps into SDF with their estimated camera poses•Voxel updates using weighted averageFusion of depth maps•Integrate depth maps into SDF with their estimated camera poses•Voxel updates using weighted averageFusion of depth maps•Integrate depth maps into SDF with their estimated camera poses•Voxel updates using weighted average•Extract ISO-surface with Marching Cubes (triangle mesh)ApproachOverviewTemporal view sampling / filteringKeyframe Selection•Compute per-frame blur score (for color image)Frame 81Frame 84•Select frame with best score within a fixed size window as keyframe。
一种用于白天星敏感器的星点质心提取方法胡晓东;胡强;雷兴;魏青;刘元正;王继良【摘要】从星空图像中提取星点质心是星敏感器工作的重要基础,针对白天星敏感器所获取的星空图像噪声情况复杂的特点,应用高斯点分布函数为数学模型,提出了一种能够获取高精度星点质心位置的基于帧累加的星点质心提取方法。
首先通过多帧迭代优化目标星像灰度,消除随机噪声的影响,提高信噪比,再利用平方加权质心法计算星点质心的位置,从星空图像中提取星点质心。
仿真实验结果表明:该方法具有较强的抗干扰能力和稳定性,且质心提取精度随迭代帧数的增加而提高,当迭代次数达到100次时平均定位精度可达0.1像素,适用于低信噪比条件下的质心定位计算。
该算法简单易行,运算量小,能够实现对视频图像信息的实时处理,且有效地提高质心的定位精度,可以满足白天星敏感器的应用需求。
%Star centroid extraction from object image in center of mass is the important basis of star sensor. For the star image obtained by daytime star sensors under complicated circumstances, a method of star centroid based on multiframe incremental is proposed by using the mathematical model of Gaussian point distribution function. By optimizing the multi-frame iterative image gray scale, the influence of random noise is eliminated and the signal-to-noise ratio is improved. Then, by utilizing weighted squared centroid algorithm, the star centroid is calculated to extract the star centroid from the star image. The simulation experimental results showthat the method has excellent anti-interference ability and stability, andthe centroid extraction precision is increased with the iteration frames. When the number of iterations reaches 100 times the extraction precisionis increased with the increasing of iteration number and could approach 0.1 pixel, which is suitable for low signal-to-noise ratio. This algorithm is simple, less computations, and can achieve real-time processing of video image information. It can effectively improve the positioning precision, and satisfy the application requirements of daytime star sensors.【期刊名称】《中国惯性技术学报》【年(卷),期】2014(000)004【总页数】5页(P481-485)【关键词】图像处理;质心提取;亚像素定位;帧累加;信噪比【作者】胡晓东;胡强;雷兴;魏青;刘元正;王继良【作者单位】中国航空工业集团西安飞行自动控制研究所,西安 710065;中国航空工业集团西安飞行自动控制研究所,西安 710065;中国航空工业集团西安飞行自动控制研究所,西安 710065;中国航空工业集团西安飞行自动控制研究所,西安 710065;中国航空工业集团西安飞行自动控制研究所,西安 710065;中国航空工业集团西安飞行自动控制研究所,西安 710065【正文语种】中文【中图分类】O436现今主要的三种导航模式分别是GPS导航,天文导航和惯性导航,其中GPS的导航精度最高,但易受干扰、且保密性差,因此具有高隐蔽性、高可靠性要求的导航任务不能依赖GPS导航模式。

Pump family settingsA unique feature uses pre-programmed data for different Grundfos pump families. During installation, the correct values are set for specific pumps for optimum performance and protection of the pump.Control modeGrundfos CUE provides a series of pre-defined application control modes:• Constant pressure with or without stop function• Proportional Differential pressure • Constant level with or without stop function• Constant temperature• Proportional pressureThese pre-defined control modes make it simple to program the drive for the application. When controlled from an exter-nal source, the open loop control mode is used, supplying Grundfos CUE with information about the required speed.Maximum convenience and advanced user interfaceThe Grundfos CUE is a variable frequency drive for the effective speed control of any Grundfos pump without integrated drives, irrespective of size or area of application. Grundfos CUE is an integral partof Grundfos iSOLUTIONS.Offering simple installation and operation coupled with extensive control and monitoring possibili-ties, Grundfos CUE is perfectly suited for pump applications in the water or wastewater network, building services, or industrial pumping solutions.PROPORTIONAL PRESSURE GRUNDFOS iSOLUTIONSSERVICESCLOUD PUMPCONTROL MODETEMPERATURE CONTROL HQCUEHQCUELQLCUECONSTANT LEVEL HQCUEpCONSTANT PRESSURE DUTY/STANDBY OR DUTY/ASSISTCUE 1CUE 2Modbus RTUDuty StandbyIntuitive start-up guideFor easy set-up, Grundfos CUE has a comprehensive start-up guide that allows commissioning simply by asking for your pump type, motor type, control mode, sensor type, setpoint and multi-pump mode. Grundfos CUE will then automatically set all necessary parameters.Furthermore, the advanced HMI panel features:• Favourites menu for one stop adjustment of setpoint, operating mode and control mode• Main menu with password protection for advanced commis-sioning and troubleshooting without the need for additional tools• Info key with comprehensive descriptions for easy settings and status – no manual required• Logging for tuning the performance of the pump system Lowest operating costGrundfos CUE runs with the most energy efficient motor con-struction types for higher flexibility, and not least high pump system efficiency:• Asynchronous induction motors,• Permanent magnet motors,• Synchronous reluctance motors, • PM assisted SynRM.Highest efficiency motors reduce energy consumptionAt Grundfos, our long-term 2030 water and climate ambitions are to do whatever we can to help achieve the United Nations Sustainable Development Goals, in particular 6 and 13. Speed-controlled pumps contribute strongly to water-use effi-ciency across all sectors (SDG 6), and our focus on high-efficiency motors reduces energy consumption, in support of SDG 13.For example, IE5 motor losses are over 30 % lower thanIE3-rated motors, this alone reduces the energy consumption by 10 % with a typical pump load profile.Grundfos iSOLUTIONS brings a new era of intelligence to pump systems and water technology with solutions that look beyond individual components and optimise the entire system.Powered by our deep understanding of water, Grundfos iSOLUTIONS utilises intelligent pumps, cloud connectivity and digital services. Together they enable real-time monitoring, remote control, fault prediction and system optimisation to help you reach a new level of performance.Learn more on /isolutionsConnect to the future of intelligent pump systems• Multi-pump function including alternating, back-up or cascade functionThe Multi-pump function makes it possible to control more parallel-coupled pumps without the need for an external controller. Four different multi-pump functions are available: Alternating time, Back-up, and Cascade control with either fixed or variable speed assist pumps.• Differential pressure control using two sensorsUse two sensors instead of one differential sensor for running in differential pressure.• Proportional pressure and flow estimationProportional pressure control on pumps with user adjustable control curve for pressure loss compensation.• Low flow stop functionImproved energy optimisation, easy configuration and high comfort. • Dry running protectionProtects the pump against failure due to dry running.• Limit Exceed functionThe pump reacts to a measured or an internal value exceed-ing a user-defined limit. The pump can either give an alarm/ warning or change the operating mode, reducing the need for external controllers.• Setpoint influenceThe setpoint influence function makes it possible to influ-ence the controller setpoint using measured values.• Standstill heating (anti-condensation heating)Standstill heating ensures that even during standstill periods, the motor windings are kept at a minimum temperature – heating both motor and terminal box.Superior performance through unique functionality Grundfos CUE offers greater functionality, making it easy to use in a wide rangeof complex applications. The features listed below are pump type dependent.Dedicated functionality for Water Utilities• Pipe fill modeImprove system reliability and prevent water hammering. Designed for both vertical and horizontal pipe systems to increase system performance and prevent water hammer in the application.• Low flow stop functionImproved energy optimisation, easy configuration and high comfort. • Built-in cascade control of two fixed-speed pumpsIncreased flow by simple cascade option of up to two fixed speed pumps, easy set-up from the start-up guide.• High overload and Constant torqueThe torque characteristic is normally set to variable torque for centrifugal pumps. However, Grundfos CUE offers a constant torque characteristic optimised for:- higher starting torque,- axial pumps and positive displacement pumps, or - load shocks in wastewater pumps. • Stop at minimum speed functionEnsures that the pump will stop after a selected time when the controller is in saturation, forcing the pump to run at minimum speed.• DeraggingBy preventing clogged impellers and getting rid of debris, less ragging prolongs pump lifetime and reduces service costs.With dedicated functionality for water and wastewater networks, Grundfos CUE ensures fully optimised operation in these applications.WATER NETWORKSWASTEWATER NETWORKSEMC filter for conducted emission according to IEC61800-3 Ed. 2.• CUE rated 500 V or lower up to 90 kW: Build-in filter for household application (class C1)• CUE rated 500 V or lower above 110 kW: Build-in filter for industrial application (class C2)• CUE rated 525 V or more independent of power size: Build-in filter for industrial application (class C3)Product Range3 x 525-690 V3 x 525-600 V3 x 380-500 V3 x 200-240 V 1 x 200-240 VPower supply0.3131030100250kW7.5-250 kW / 10-350 HP0.75-90 kW / 1-125 HP0.55-250 kW / 0.75-350 HP0.75-45 kW / 1-60 HP1.1-7.5 kW / 1.5-10 HPMCB114 sensor input moduleRequired for using differential pressure control using two sen-sors, or two Pt100/1000 inputs to be used in connection with motor bearings temperature measurement, or temperature measurement such as the media temperature.MCO101 cascade option moduleRequired for cascade of more than one additional variable speed pump.VariantsIP20/IP21/Nema 1 for cabinet installationIP55/Nema 12 with mains disconnect for wall installation.With or without one wire safe stop, safe torque off (STO).Search for CUE on Grundfos Product CenterTechnical specificationsBuilt-in I/O Yes Digital inputs: 4Digital inputs/outputs: 2Relay outputs: 2Analog inputs: 1 dedicated for sensor, 1 dedicated for external setpoint Analog output: 1RS-485:GENIbus, Modbus RTU, and multi-pumpAccessoriesThe Grundfos Product Center online tool lets you size pumps, browse the Grund-fos product catalogue, find appropriate replacement pumps and find pumps forhandling specific liquids.• Search in the way that meets your needs by application,pump design or pump family• Experience faster sizing thanks to a new intelligent “Quick Size” function• Documentation includes pump curves, technical specs, CAD drawings,available spare parts, installation videos, and much more• Optimised for your PC, tablet or smartphoneAs a registered user you will have access to saved preferences, productsand projects and recent browsing history.Visit Global reach and local supportGrundfos is a truly global company and is never far away.Our unique global set-up provides you with benefits, including:• Technical assistance to size your pumping system• Expert know-how and support in your local language• Web-based tools• Fast spare parts delivery on every continentContact your Grundfos sales representative for further information or help matching a GrundfosCUE variable frequency drive to your Grundfos pump and application.T h e n a m e G r u n d f o s , t h e G r u n d f o s l o g o , a n d b e t h i n k i n n o v a t e a r e r e g i s t e r e d t r a d e m a r k s o w n e d b y G r u n d f o s H o l d i n g A /S o r G r u n d f o s A /S , D e n m a r k . A l l r i g h t s r e s e r v e d w o r l d w i d e .98848178 0919/I N D U S T R Y /4011224-B r a n d B o x。

移相相关法计算相位差的研究刘玉周;赵斌【摘要】为了提高相位式测距仪的测量精度,采用移相相关方法来估计两同频正弦信号的相位差。
首先将每路信号移相2π后和原信号做相关来计算自相关,以减少噪声的影响;其次用少许数据初步估算相位差,并将一路信号移相,使两路信号的相位差移到π/2(或3π/2)附近;然后用较多的采样数据计算两路信号的相位差,将结果再减去移相量得到最终的相位差。
同时分析了频率误差对相位差计算精度的影响,进行了理论分析和仿真实验验证。
结果表明,该方法计算的误差大大减小。
这对提高测距仪的测量精度是有帮助的。
%In order to improve the accuracy of a phase-shift range finder , a phase-difference algorithm based on phase-shift correlation analysis was proposed to estimate the phase-difference between two sinusoidal signals with same frequency .For reducing the influence of noise , the autocorrelation between the original and 2πshifted signal was calculated firstly.Secondly, the phase difference was estimated approximately with a few sampled data and the initial phase of one signal was shifted by Δθto make the phase difference between two signals to be near π/2(or 3π/2).Then, the phase-difference was calculated with whole set of data by correlation method and the final phase difference was obtained by subtracting Δθ.The influence of frequency error was analyzed .Theoretical analysis and simulation shows that the error of this method is greatly reduced .The proposed method can improve the accuracy of a range finder .【期刊名称】《激光技术》【年(卷),期】2014(000)005【总页数】5页(P638-642)【关键词】测量与计量;移相相关法;相位差;频率误差【作者】刘玉周;赵斌【作者单位】华中科技大学机械科学与工程学院仪器系,武汉430074;华中科技大学机械科学与工程学院仪器系,武汉430074【正文语种】中文【中图分类】TH741相位式激光测距在3-D成像[1]、机器人导航[2]、表面检测[3]等领域有着广泛的应用,它通过测量光波往返的相位差来计算时间延迟从而计算待测距离[4-5]。

Rev. 0.3 7/13Copyright © 2013 by Silicon LaboratoriesSi1142 Infrared Slider Demo KitLIDER EMO IT SER S UIDE1. Kit ContentsThe Si1142 Slider Demo Kit contains the following items:⏹ Si1142 Slider Demo Board⏹ Si1142 Slider Demo Board Quick Start Guide ⏹ USB Cable2. IntroductionThe Si1142 Slider Demo Board implements an infrared touchless slider function based around the Si1142 infrared proximity and ambient light sensor. As shown in Figure 1, the main components of the board are the Si1142 sensor (U2), the C8051F800 microcontroller (U1), and two infrared emitters (DS1 and DS2). Hardware is also provided on-board to facilitate code development for the C8051F800 and communications with software support packages over a USB interface.The firmware running on the C8051F800 measures the infrared light energy detected by the Si1142, while each of the two infrared emitters are independently activated. The infrared light from these emitters will be reflected back to the Si1142 by any object that is placed in proximity to the board. The left-right position is then calculated from these two measurements and used to illuminate the appropriate signal LED. If no object is close enough to the board, the measured signal levels will fall below pre-determined thresholds, and no signal LEDs will be illuminated. In addition to indicating the current position, the firmware is also able to detect different gestures from the infrared sensor, as described in Table 2 on page 6. The Si1142’s ambient light sensor (ALS) is also monitored by the firmware, which can determine the amount of ambient light present.Note:The touchless infrared position and gesture detection implemented in the example is patent pending.Figure 1.Si1142 Slider Demo BoardD S 13D S 11D S 12D S 8DS1DS2D S 9D S 14D S 5D S 6D S 7D S 4D S 3+5V_INNo tR e co me edf or N e wDe si g n sSi1142 Infrared Slider Demo Kit3. Running the Pre-Loaded Slider Demo1. The board receives its power over the USB interface. Connect one end of a USB cable to the USB connector (P1) on the Si1142 Slider Demo Board and the other end to a USB Port on the PC.2. The red LED DS10 should light on the board, indicating that it is receiving power from the USB.3. Position a hand about 5 to 10cm above and perpendicular to the board. The visible blue LEDs will light according to the position of the hand above the board.4. To initiate a “pause” gesture, hold steady for about 3/4 seconds. The current LED position indicator will blink a few times to indicate that a pause gesture has been detected.5. To perform a “swipe” gesture, move the hand from left to right (swipe right) or right to left (swipe left) above the entire length of the board. The LEDs will briefly light in a sweeping pattern to indicate that a swipe gesture was detected.On this board, the infrared emitters used are OSRAM part number SFH 4056. These emitters have a power rating of 40mW and a half-angle of 22 degrees. Other emitters with different characteristics may also be used,depending on the specific application requirements.4. Software OverviewThere are several optional software packages available to support the Si1142 Slider Demo Board. The Si114x Performance Analysis Tool can be used for initial evaluation to collect data from the board over the USB interface and display it graphically on screen. For users ready to develop their own software, the Si114x Programmer’s Toolkit API enables rapid development of Si114x software in a PC environment using the Si1142 Slider Demo Board. The Si114x Programmer’s Toolkit contains example source code that allows developers to get started quickly and then tailor the code to their needs. In addition, the Silicon Labs Integrated Development Environment (IDE) provides a means of developing code for the C8051F800 and uses the USB connection on the board to program the MCU and perform in-system debugging. All of the supporting software can be downloaded from the web at: /products/sensors/pages/optical-sensor-software.aspx .4.1. Using the Si1142 Slider Demo Board with the Performance Analysis ToolThe Si1142 Slider Demo Board is supported by the Si114x Performance Analysis Tool. The Performance Analysis Tool allows users to see real-time infrared proximity and ambient light measurements from the Si1142 in a graphical form. The communications interface to the Si1142 Slider Demo Board is provided over the USB connection.To use the Performance Analysis Tool with the Si1142 Slider Demo Board, perform the following steps:1. Connect the Si1142 Slider Demo Board to the PC using a USB cable.2. Launch the Performance Analysis Tool from the Start menu.3. Select the board from the “Devices” menu (it should show up as “TS” followed by a serial number).4. Select the channels you wish to display on the picture of the slider board that appears. The individual channels available are described in “4.1.1. Channel Selection” .5. Click the green “Acquisition” arrow to begin collecting data.Note:The Performance Analysis Tool, the Si114x Programmer’s Toolkit, and the IDE cannot connect to the Si1142 SliderDemo Board at the same time. Be certain to disconnect from the board in one software package before trying to connect in the other.Figure 2 shows an example of the Performance Analysis Tool output when connected to the Si1142 Slider Demo Board. To generate the graph, a hand was moved above the slider board. The selected traces shown are the raw data measurements for the amount of Infrared light being reflected onto the part. The pink trace represents the readings using infrared emitter DS1, and the green trace represents the readings using infrared emitter DS2.No tR e co mme nd edf or N e wDe si g n sSi1142 Infrared Slider Demo KitFigure 2.Performance Analysis Tool Main Window4.1.1. Channel SelectionSelecting which channels to display is done by checking the appropriate boxes on the Board Representation window, shown in Figure 3, and the Generic Data window, shown in Figure 4. There are two different groups of measurements available from the example firmware: raw data channels and generic data channels.4.1.1.1. Raw Data ChannelsThe raw data measurements can be seen by selecting the channels from the Board Representation window, shown in Figure 3. The two types of raw data measurements are ambient light and infrared proximity.1. Raw ambient light measurements. The ambient light channels are Channel 0 (red) and Channel 1(blue). Channel 0 displays measurements of the ambient visible light while Channel 1 displays measurements of the ambient infrared light.2. Raw infrared proximity measurements. The infrared proximity channels are Channel 2 (pink) readings using DS1 and Channel 3 (green) readings using DS9. Each output is proportional to the amount ofinfrared light being reflected onto the part by an object above the board. These outputs are 16-bit unsigned values.Figure 3.Raw Data Channel SelectionNo tR e co mme nd edf or N e wDe si g n sSi1142 Infrared Slider Demo Kit4.1.1.2. Generic Data ChannelsThe generic data channels contain any data generated by the host MCU. These 16-bit channels can be anything from simple debug channels to calculated position values. See Table 1 for an explanation of all the channels shown in Figure 4.Figure 4.Generic Data Channel SelectionNo tR e co mme nd edf or N e wDe si g n sSi1142 Infrared Slider Demo KitTable 1. Generic Data ChannelsName Label TypeDescriptionG0Rad1Linearized Distance MeasurementsUsing characterization of the PS measurements with objects at certain distances, it is possible to estimate the distance of an object based on the PS measurement value. These three channels represent the distance estimations for each LED’s measurement.G1Rad2G2X(mm)Estimated Location CoordinatesWith the appropriate distance measurements above, an estimation of X and Y position can be made. These estimations are given in units of mm.G3Y(mm)G4iLED1LED Drive Current LevelsEach LED driver has a specific LED drive current setting for it. These values are given in units of mA.G5iLED2G6VIS AutoRanging Ambient OutputsAutoRanging will automatically change the modes of the photodiodes to avoid saturation. Whenchanging modes, the raw data output changes lev-els so that all measurements are on the same scale. The output from this channel is the pro-cessed value which can be used without knowl-edge of the photodiode modes.G7IRG8PS1AutoRanging PS OutputsThese channels are the AutoRanging PS output from the device. Raw data measurements are pro-cessed by the AutoRanging firmware to make all the readings across different modes have the same magnitude. Since the device switches modes to compensate for ambient light, the raw data will show jumps when changing modes.These outputs will not display the jumps because the firmware is stitching the raw outputs together.G9PS2G10VIS s State of Ambient Visible System These channels help indicate what mode the sen-sor is in during each of their respective measure-ments. The four possible modes are as follows: Low Light, High Sensitivity, High Signal, and Sun-light. These modes are numbered from zero to three. For more information about each mode, please consult the data sheet.G11IR stState of Ambient IR SystemG12PS stState of PS SystemG13PS1blPB Baseline LevelsAutoRanging uses baselining to determine the no-detect threshold for readings. Any readings below the values shown on these channels will be con-sidered no-detect readings. Any values higher than this baseline will be shown in the AutoRang-ing PS Outputs above.G14PS2blG15N/A UnusedThe unused channels are not in use by software, but they are available in firmware to use as needed.G16N/aNo tR e co mme nd edf or N e wDe si g n sSi1142 Infrared Slider Demo Kit4.1.2. Gesture SensingIn addition to infrared and ambient light measurements and distance calculations, the example firmware contains algorithms for gesture recognition. When connected to the board with the Performance Analysis Tool, a group window will appear, as shown in Figure 5. When a gesture is recognized by firmware, the gesture name and parameter information will be added to the top of the 2D Gesture group. Three gestures are supported by the example code. The parameters for each gesture are listed in Table 2.Figure 5.Performance Analysis Tool Group WindowTable 2. Recognized GesturesGesture NameParameter Parameter RangeDescription of Action and LED IndicationPause Position 1–8 (LED position)Hold hand steady in a single position above the board for 3/4 second. Current position LED will blink briefly.Swipe LeftSpeed1–18 (Slow to Fast)Move hand rapidly from the right side to the left sideof the board. LEDs will briefly indicate a leftward sweep pattern.Swipe Right Speed1–18 (Slow to Fast)Move hand rapidly from the left side to the right sideof the board. LEDs will briefly indicate a rightward sweep pattern.No tR e co mme nd edf or N e wDe si g n sSi1142 Infrared Slider Demo Kit4.2. Si114x Programmer’s Toolkit4.2.1. Software APIThe Si114x Programmer’s Toolkit API enables rapid development of Si114x software in a PC environment using the Si1142 Slider Demo Board. By emulating an I 2C interface over USB, the Si114x Programmer’s Toolkit API allows source code to be developed on a PC and then migrated quickly and easily to an MCU environment once target hardware is available. Either commercially-available or free PC-based C compilers can be used for software development with the Si114x Programmer’s Toolkit API.The Si114x Programmer’s Toolkit API also includes the Si114x Waveform Viewer Application. This tool runs in conjunction with user applications to display and debug the measurements taken from the Si1142 Slider Demo Board.Note:The Performance Analysis Tool, Si114x Programmer’s Toolkit and IDE cannot connect to the Si1142 Slider Demo Boardat the same time. Be certain to disconnect from the board in one software package before trying to connect in the other.4.2.2. Command Line UtilitiesFor evaluation of the Si1142 Slider Demo Board without the need to develop and compile source code, a flexible set of command line utilities is also provided with the Si114x Programmer’s Toolkit. These utilities can be used to configure and read samples from the Si1142 Slider Demo Board. For automated configuration and scripting, the command line utilities can be embedded into .bat files.4.2.3. Sample Source CodeFor faster application development, the Si114x Programmer’s Toolkit contains example source code for the Si1142Slider Demo Board and for each of the command line utilities. Developers can get started quickly by using the Si114x example source code and then tailoring it to their needs.4.2.4. Downloading the Si114xe Programmer’s ToolkitThe Si114x Programmer’s Toolkit and associated documentation is available from the web at the following URL:/products/sensors/pages/optical-sensor-software.aspx .No tR e co mme nd edf or N e wDe si g n sSi1142 Infrared Slider Demo Kit4.3. Silicon Laboratories IDEThe Silicon Laboratories IDE integrates a source-code editor, a source-level debugger, and an in-system Flash programmer. This tool can be used to develop and debug code for the C8051F800 MCU, which is included on the Si1142 Slider Demo Board. The use of several third-party compilers and assemblers is supported by the IDE.4.3.1. IDE System RequirementsThe Silicon Laboratories IDE requirements are:⏹ Pentium-class host PC running Microsoft Windows 2000 or newer ⏹ One available USB port4.3.2. Third Party ToolsetsThe Silicon Laboratories IDE has native support for many 8051 compilers. The full list of natively-supported tools is as follows:⏹ Keil⏹ IAR ⏹ Raisonance ⏹ Tasking ⏹ SDCC4.3.3. Downloading the Example Firmware ImageSource code that has been developed and compiled for the C8051F800 MCU on the Si1142 Slider Demo Board may be downloaded to the board using the Silicon Laboratories IDE. Follow the instructions below to update or refresh the .HEX image in the Si1142 Slider Demo Board.1. Connect the Si1142 Slider Demo Board to the PC using a USB cable.2. Launch the Silicon Labs IDE, and click on Options->Connection Options .3. Select “USB Debug Adapter”, and then select the board from the list (it should show up as “TS” followed by a serial number).4. Select “C2” as the debug interface, and press “OK”.5. Connect to the board by pressing the “Connect” icon, or using the keyboard shortcut Alt+C.6. Click on the “Download” icon, or use the keyboard shortcut Alt+D.7. In the download dialog window, click “Browse”.8. Change to Files of Type “Intel Hex (*.hex)” and then browse to select the file.9. Click “Open” then “Download”.10. To run the new image, either press “Run” or “Disconnect” in the IDE.Note:The Performance Analysis Tool, Si114x Programmer’s Toolkit, and the IDE cannot connect to the Si1142 Slider DemoBoard at the same time. Be certain to disconnect from the board in one software package before trying to connect in the other.No tR e co mme nd edf or N e wDe si g n sSi1142 Infrared Slider Demo Kit5. SchematicF i g u r e 6.S i 1142 S l i d e r D e m o B o a r d S c h e m a t i cg n sSi1142 Infrared Slider Demo KitD OCUMENT C HANGE L ISTRevision 0.2 to Revision 0.3Replaced QuickSense Studio references andinstructions with Si114x Programmer’s Toolkit.No tR e co mme nd edf or N e wDe si g n s Silicon Laboratories Inc.400 West Cesar ChavezAustin, TX 78701USASmart. Connected. Energy-Friendly .Products /productsQuality /quality Support and Community Disclaimer Silicon Laboratories intends to provide customers with the latest, accurate, and in-depth documentation of all peripherals and modules available for system and software implementers using or intending to use the Silicon Laboratories products. Characterization data, available modules and peripherals, memory sizes and memory addresses refer to each specific device, and "Typical" parameters provided can and do vary in different applications. Application examples described herein are for illustrative purposes only. Silicon Laboratories reserves the right to make changes without further notice and limitation to product information, specifications, and descriptions herein, and does not give warranties as to the accuracy or completeness of the included information. Silicon Laboratories shall have no liability for the consequences of use of the information supplied herein. This document does not imply or express copyright licenses granted hereunder to design or fabricate any integrated circuits. The products are not designed or authorized to be used within any Life Support System without the specific written consent of Silicon Laboratories. A "Life Support System" is any product or system intended to support or sustain life and/or health, which, if it fails, can be reasonably expected to result in significant personal injury or death. Silicon Laboratories products are not designed or authorized for military applications. Silicon Laboratories products shall under no circumstances be used in weapons of mass destruction including (but not limited to) nuclear, biological or chemical weapons, or missiles capable of delivering such weapons.Trademark InformationSilicon Laboratories Inc.® , Silicon Laboratories®, Silicon Labs®, SiLabs® and the Silicon Labs logo®, Bluegiga®, Bluegiga Logo®, Clockbuilder®, CMEMS®, DSPLL®, EFM®, EFM32®, EFR, Ember®, Energy Micro, Energy Micro logo and combinations thereof, "the world’s most energy friendly microcontrollers", Ember®, EZLink®, EZRadio®, EZRadioPRO®, Gecko®, ISOmodem®, Precision32®, ProSLIC®, Simplicity Studio®, SiPHY®, Telegesis, the Telegesis Logo®, USBXpress® and others are trademarks or registered trademarks of Silicon Laborato-ries Inc. ARM, CORTEX, Cortex-M3 and THUMB are trademarks or registered trademarks of ARM Holdings. Keil is a registered trademark of ARM Limited. All other products or brand names mentioned herein are trademarks of their respective holders. N o t R e co m m e n d e d f o r N e w D e s i g n s。

基于计算机视觉的室外停车场车位检测实验设计张乾;肖永菲;杨玉成;余江浩;王林【摘要】为便于汽车驾驶员在室外停车场中寻找可用空车位,基于以数据采集、图像处理和目标检测等过程的计算机视觉,开发了室外停车场车位检测实验.该实验将Haar-like特征描述和车位中颜色能量变化作为判别模型的数据输入,选取随机森林作为车位可用状态的判别模型.通过在国际公开数据集PKLot上进行实验,对可用车位的检测准确率的均在91%以上;在自建的GZMU-LOT上进行实验,可用空车位的检测准确率达92.21%.【期刊名称】《实验技术与管理》【年(卷),期】2019(036)007【总页数】4页(P138-140,146)【关键词】车位检测;计算机视觉;实验设计;室外停车场【作者】张乾;肖永菲;杨玉成;余江浩;王林【作者单位】贵州民族大学数据科学与信息工程学院,贵州贵阳 550025;贵州民族大学教务处,贵州贵阳 550025;贵州民族大学数据科学与信息工程学院,贵州贵阳550025;贵州省模式识别与智能系统重点实验室,贵州贵阳 550025;贵州民族大学数据科学与信息工程学院,贵州贵阳 550025;贵州省模式识别与智能系统重点实验室,贵州贵阳 550025;贵州民族大学教务处,贵州贵阳 550025;贵州省模式识别与智能系统重点实验室,贵州贵阳 550025;贵州省模式识别与智能系统重点实验室,贵州贵阳 550025【正文语种】中文【中图分类】TP391.41城市停车难是令汽车驾驶员苦恼的问题,在停车场中寻找可用车位也是比较困难的。
采用现代信息技术快速、准确、醒目地告知驾驶员可用车位的具体位置是一个重要的课题[1]。
目前停车场可用车位的检测方法可归纳为基于传感器的方法和基于计算机视觉的方法。
基于传感器的可用车位检测方法是通过在车位安装传感器设备和装置,采集数据后传送到后台服务器,经服务器处理数据后显示车位的可用状态信息。
Improved Biomass Estimation Using the Texture Parameters of Two High-Resolution Optical SensorsJanet E.Nichol and tifur Rahman SarkerAbstract—Accurate forest biomass estimation is essential for greenhouse gas inventories,terrestrial carbon accounting,and climate change modeling studies.Unfortunately,no universal and transferable technique has been developed so far to quantify biomass carbon sources and sinks over large areas because of the environmental,topographic,and biophysical complexity of forest ecosystems.Among the remote sensing techniques tested, the use of multisensors and the spatial as well as the spectral characteristics of the data have demonstrated a strong potential for forest biomass estimation.However,the use of multisensor data accompanied by spatial data processing has not been fully investigated because of the unavailability of appropriate data sets and the complexity of image processing techniques in combining multisensor data with the analysis of the spatial characteris-tics.This paper investigates the texture parameters of two high-resolution(10m)optical sensors(Advanced Visible and Near Infrared Radiometer type2(A VNIR-2)and SPOT-5)in different processing combinations for biomass estimation.Multiple regres-sion models are developed between image parameters extracted from the different stages of image processing and the biomass of 50field plots,which was estimated using a newly developed “allometric model”for the study region.The results demonstrate a clear improvement in biomass estimation using the texture parameters of a single sensor(r2=0.854and rmse=38.54) compared to the best result obtained from simple spectral reflectance(r2=0.494)and simple spectral band ratios (r2=0.59).This was further improved to obtain a very promis-ing result using the texture parameter of both sensors together (r2=0.897and rmse=32.38),the texture parameters from the principal component analysis of both sensors(r2=0.851 and rmse=38.80),and the texture parameters from the av-eraging of both sensors(r2=0.911and rmse=30.10).Im-provement was also observed using the simple ratio of the texture parameters of A VNIR-2(r2=0.899and rmse=32.04)and SPOT-5(r2=0.916),andfinally,the most promising result (r2=0.939and rmse=24.77)was achieved using the ratios of the texture parameters of both sensors together.This high level of agreement between thefield and image data derived from the two novel techniques(i.e.,combination/fusion of the multisensor data and the ratio of the texture parameters)is a very significant improvement over previous work where agreement not exceeding r2=0.65has been achieved using optical sensors.Furthermore, Manuscript received January22,2010;revised June1,2010;accepted July5,2010.Date of publication October14,2010;date of current version February25,2011.This work was supported by GRF Grant PolyU5281/09E. J.E.Nichol is with the Department of Land Surveying and Geo-Informatics, The Hong Kong Polytechnic University,Kowloon,Hong Kong(e-mail: lsjanet@.hk).M.L.R.Sarker is with the Department of Land Surveying and Geo-Informatics,The Hong Kong Polytechnic University,Kowloon,Hong Kong, and also with the Rajshahi University,Rajshahi6205,Bangladesh(e-mail: lrsarker@).Color versions of one or more of thefigures in this paper are available online at .Digital Object Identifier10.1109/TGRS.2010.2068574biomass estimates of up to500t/ha in our study area far exceed the saturation levels observed in other studies using optical sensors.Index Terms—Biomass estimation,multisensors,texture measurement.I.I NTRODUCTIONT HE RECENT United Nations Climate Conference in Copenhagen,Denmark,in December2009once again reminded us that climate change is one of the most severe problems on Earth and that the atmospheric content of green-house gas(particularly CO2),which has risen precipitously in the last250years,particularly in the last50years[1], is the main culprit.Forests can remove this CO2from the atmosphere in the process of photosynthesis and can store it in their biomass,thereby lessening the greenhouse effect[2]. Thus,forest biomass is considered as an important part of the global carbon cycle[3]–[5].As a result,accurate forest biomass estimation is required for many purposes including greenhouse gas inventories,terrestrial carbon accounting,cli-mate change modeling[6]–[11],and implementation of the Kyoto Protocol of the United Nations Framework Conven-tion on Climate Change.Unfortunately,this estimation is not straightforward,and no universal and transferable technique for quantifying carbon sources and sinks has been developed so far[12],[13]because of the environmental,topographic, and biophysical complexity of forest ecosystems,which dif-fer in time and space.Besides traditionalfield-based meth-ods,which are accurate but costly,time consuming,and limited to small areas[14]–[19],remote sensing is the most promising technique for estimating biomass at local,regional, and global scales[20]–[26].A number of studies has been carried out using different types of sensors,including optical [4],[5],[26]–[41],synthetic aperture radar(SAR)[42]–[53], and lidar sensors[54]–[58],for biomass/forest parameter estimation.Apart from the use of a single sensor,combining information from multiple sensors has yielded promising results for the estimation of forest parameters/biomass[13],[18],[19],[59]–[62].A useful approach is to combine SAR and optical sensors [60],[61],[63],[64],but many other options have been tested, including different frequencies and polarizations[21],[65]–[72],different sensors[10],[18],[19],[64],[73]–[78],and multiple spatial resolutions[79],and improvements have been obtained because different sensors often have complementary characteristics in their interaction with land surfaces[61],[60]. From this broad range of approaches,widely varying degrees of success have been obtained because of the complexity of0196-2892/$26.00©2010IEEEbiomass in time and space,the lack of comprehensivefield data, and the limitations in the spatial and spectral characteristics of the satellite data.Beyond the shortcomings of the data,processing techniques may be the most important factor in biomass estimation as previous research has shown that the simple reflectance of the optical sensors[25],[26],[28],[31],[36],[80]–[82]and the backscattering of the radar sensors[46],[68],[70],[72],[83], [84]are unable to provide good estimations.Thus,processing techniques need to be selected to complement suitable data configurations.Now that optical sensors with a wide range of spatial and spectral resolutions are available,optical sensors are still an attractive data source,even though previous research has shown the difficulty of biomass estimation based on raw spectral signatures because of the influence of increased canopy shad-owing within large stands,the heterogeneity of vegetation stand structures,and the spectral data saturation[5],[25],[26],[30], [31],[38],[85]–[89].However,vegetation indices,which have the ability to minimize contributions from the soil background, sun angle,sensor view angle,senesced vegetation,and the atmosphere[90]–[95],are proven to be more successful[25], [31],[37],[38],[85],[89],[96]–[98]but still with generally low to moderate accuracies of up to ca.65%.Moreover,these mod-erate results have been obtained in temperate forests because of their simple canopy structure and tree species composition. In tropical and subtropical regions where biomass levels are high,where the forest canopy is closed with multiple layering, and where a great diversity of species is present([21],[25], [26],[31],[38],[85],[86],vegetation indices have shown less potential,with low or insignificant results.On the other hand,the spatial characteristics of images,such as texture,have been able to identify objects or regions of inter-est in an image[99],and image texture is particularly useful infine spatial resolution imagery[61].Many of the texture measures developed[99],[100]–[102]have shown potential for improvements in land use/land cover mapping using both optical and SAR images[103]–[114].Image texture has also proved to be capable of identifying different aspects of forest stand structure,including age,density,and leaf area index([53], [115]–[119])and has shown a potential for biomass estimation with both optical[5],[38],[89]and SAR data([42],[51],[120]. Moreover,although most previous biomass estimation projects used Landsat TM data with a30-m spatial resolution[60], texture is expected to be more effective withfiner spatial reso-lution imagery sincefiner structural details can be distinguished [51],[61],[110],[121]–[125].Two potential drawbacks of the implementation of texture measurement for biomass estimation are the following:1)texture is a very complex property and can vary widely depending on the object of interest,the envi-ronmental conditions,and the selection of window size[105], [119],[126],[127],and2)texture processing can generate a lot of data which are difficult to manage[119],[127].Thus, although texture measurement holds potential for biomass es-timation,it has not yet been fully investigated,and results so far,when applying texture to optical images,have not exceeded 65%accuracy,even in structurally simple temperate and boreal forests[5].Considering the potential advantages of both image texture and multisensor data,this paper investigates texture processing for biomass estimation using data from two high-resolution optical sensors ANVIR-2and SPOT-5along with raw spectral processing and some simple band ratios.The project data were selected by considering the following facts:1)both sensors havefine spatial resolution(10m),and this higher spatial resolution shows promise for image texture analysis;2)the sensors have some common spectral bands(green,red,and NIR)which may help in reducing any random error in the averaging process;and3)the sensors have uncommon spectral bands(blue in Advanced Visible and Near Infrared Radiometer type2(A VNIR-2)and short-wave near infrared(SWNIR) in SPOT-5)which may be able to provide complementary information.A.ObjectivesThe overall objective of the study is to explore the potential of texture processing combined with multisensor capability for the improvement of biomass estimation using data from two high-resolution optical sensors.More specific objectives are to investigate the performance of the following:1)the spectral reflectance of the individual bands of thesensors individually and together;2)the simple ratio of the different bands of the sensorsindividually and jointly;3)the texture parameters of the sensors individually andtogether;4)the simple ratio of the texture parameters of the sensorsindividually and together for the improvement of biomass estimation.II.S TUDY A REA AND D ATAA.Study AreaThe study area for this research is the Hong Kong Special Administrative Region(Fig.1)which lies on the southeast coast of China,just south of the Tropic of Cancer.The total land area of Hong Kong is1100km2,which includes235small outlying islands.Although the population is over7million, only about15%of the territory is built-up,but less than1% is still actively cultivated.Approximately40%of the total area is designated as country parks,which are reserved for forest succession under the management of the Agriculture,Fisheries and Conservation Department.The native subtropical evergreen broad leaf forest has been replaced by a complex patchwork of regenerating secondary forest in various stages of development, and plantations.Forest grades into woodland,shrubland,and then grassland at higher elevations.B.DataImages from two optical sensors were used in this paper.One image was obtained on October24,2007,by A VNIR-2from the ALOS-2satellite launched in January2006,and the other was collected on December31,2006,by the High-ResolutionFig.1.Study area and sample plots.Geometric(HRG)sensor of the SPOT-5Earth Observation Satellite launched in May2002(Table I).The instantaneous field of view of10m for the A VNIR-2multispectral sensor is the main improvement over the16-m resolution A VNIR. The SPOT-5HRG multispectral data add an improved spatial resolution(20to10m)compared with the previous SPOT-4 platform as well as an additional shortwave infrared band at 10m.With swath widths of70and60km,respectively,both A VNIR-2and SPOT-5HRG are suitable for regional scale mon-itoring and ideal for Hong Kong’s land area of ca.40×60km.III.M ETHODOLOGYThe methodology(Fig.2)of this paper comprises two parts, namely,allometric model development forfield biomass esti-mation and processing of A VNIR-2and SPOT-5images.A.Allometric Model DevelopmentDue to the lack of an allometric model for converting the trees measured in thefield to actual biomass,it was necessary to harvest,dry,and measure a representative sample of trees. Since Hong Kong’s forests are very diverse,the harvesting of a large sample was required.This was done by selecting the dominant tree species comprising a total of75trees in 4diameter at breast height(DBH)classes(less than10,10–15, 15–20,and20cm and above),and standard procedures were followed for tree harvesting[14],[128],[129].The harvested trees were separated into fractions,includ-ing leaves,twigs,small branches,large branches,and stem. After measuring the fresh weight(FW),representative sam-ples(Fig.3)from every part of the tree were taken for dry weight(DW)measurement in an oven at80◦C until a con-stant DW was obtained(Fig.3).The weight of every sample was estimated using the same electric weight balance at a 0.002-g precision.The ratio of DW to FW was calculated for every part of the samples using DW and FW of each part of the ing the ratio,DW was calculated for every part,and finally,the DW of each tree was calculated by summing the DW of all parts.Regression models used by previous researchers[20],[128] were tested in order tofind the bestfit by using DW as the dependent variable and DBH and height as independent variables in different combinations.Finally,using the log trans-formed DBH and DW,the bestfit model(Table II)was found, considering all test parameters including the correlation coef-ficient(r),the coefficient of determination(r2),the adjusted coefficient of determination(adjusted r2),and the rmse.Afit of approximately93.2%(adjusted r2of0.932)and an rmse of13.50were obtained for this bestfit model(Table II).This was deemed highly satisfactory in view of the great variety of tree species,and is similar to the accuracies of several other specialist forest inventories[20],[128].B.Field Plot Measurement and Field Biomass EstimationTo build a relationship between image parameters andfield biomass,50sample plots covering a variety of tree stand types were selected using purposive sampling.Circular plots with a15-m radius were determined by considering the image resolution(approximately10m),the orthorectification error, and the GPS positioning error.All sample plots were positioned within a homogenous area of the forest and at least15m distant from other features such as roads,water bodies,and other infrastructure.A Leica GS5+GPS was used to determine the center of each plot using the Differential Global Positioning System mode for accuracy within±3m.For a precise position, a Position Dilution of Precision value below four was always attempted.Both DBH and tree height were measured for all trees within the circular plot region.The DBH of the trees was measured at1.3m above the ground,and the heights of the small and large trees were measured by Telescopic-5and DIST pro4,respectively.Trees with a DBH below2.5cm were not included but were recorded.Finally,using the measured parameter DBH,the biomass of each tree and the biomass of all trees in a plot were estimated(Table III)using the allometric model developed for this study area.C.AVNIR-2and SPOT-5Data PreprocessingThe digital number values of the A VNIR-2and SPOT-5data were converted to spectral radiance using the conversion factors given in the image headerfiles.Orthorectification was carried out using the Satellite Orbital Math Model to compensate distortions such as sensor geometry,satellite orbit and attitude variations,Earth shape,rotation,and relief.In order to ensure an rms error within0.5pixel,a high-resolution(10m)digital elevation model and well-distributed ground control points were used for orthorectification.D.Texture AnalysisTexture is a function of local variance in the image,which is related to the spatial resolution and size of the dominant scene objects[130],and it can be used to identify these objects orTABLE IC HARACTERISTICS OF THED ATA U SED FOR T HIS PAPERFig.2.Overall methodology.regions of interest in any image [99],[131].Studies have shown that,in many cases,texture may be a more important source of information than reflectance or intensity,and this is especially true in high-resolution images (e.g.,[61],[69],[112],[132],and [133]).Thus,in forested landscapes,texture is dependent on the size and spacing of tree crowns,and on high-resolution images if a pixel falls on a tree,its neighbor may also fall on the same tree,resulting in a low local variance.As the resolution increases to a level that is comparable to the dominant tree crown size,the local variance increases,and this should be especially true in tropical forests with high species diversity,where stands are heterogeneous [130].Several methods and techniques for describing texture,based on statistical models,have been developed [51],[112],[113],[120].For this paper,two categories of texture measurement were selected to test their potential for biomass estimation with A VNIR-2and SPOT-5data (Table IV).The first one is the gray level co-occurrence matrix (GLCM)[99]along with some gray level difference vector based texture measurements.The second one is the sum and difference histogram proposed by theFig.3.Tree harvesting procedure for the allometric model development. authors in[134]as an alternative to the usual co-occurrence ma-trices used.Identifying suitable textures additionally involves the selection of moving window sizes[38],[127].A small window size exaggerates the difference within the window (local variance)but retains a high spatial resolution,while a large window may not extract the texture information efficiently due to over-smoothing of the textural variations.Because the resolution of the data used is high(approximately10m)and the forest structure in the study area is dense and compact, all texture measurements were performed using four small to medium window sizes from3×3to9×9.E.Statistical AnalysisTo represent the relationship betweenfield biomass and remotely sensed data,some researchers have used linear re-gression models with or without log transformation of thefield biomass data[28],[31],[34],[35],[65],[66],[83],while others have used multiple regression with or without stepwise selec-tion[18],[19],[26],[27],[37],[46],[69]–[71],[98].Nonlinear regression[45],[135],artificial neural networks[4],[25],[26], [136]–[138],semiempirical models[48],and nonparametric es-timation methods such as k-nearest neighbor and k-means clus-tering have also been widely used[139].Although no model can perfectly express this complex relationship,researchers are still using multiple regression models as one of the best choices.In this paper,simple linear regression and stepwise multiple-linear regression models were used to compare the data derived from all processing steps withfield biomass.The biomass data were collected from50field plots and were used as independent variables.The spectral reflectance of eachfield plot was extracted using an area-of-interest mask of3×3 pixels,for which the mean reflectance was calculated.In multiple regression modeling,difficulties such as mul-ticollinearity and overfitting may arise when a large number of independent variables are used,such that the independent variables are highly correlated with one another.To avoid overfitting problems as well as to ensurefinding the bestfit model,five common statistical parameters,namely,the corre-lation coefficient(r),the coefficient of determination(r2),the adjusted r2,the rmse,and the p-level(for the model),were computed.Another seven statistical parameters such as the beta coefficient(B),the standard error of B,the p-level,the toler-ance(Tol=Tolerance=1−R2x),the variance inflation factor (VIF j=1/1−R2j),the eigen value(EV),and the condition index(CI=k j=(λmax/λj),j=1,2,...,p)were calculated to test the interceptfitness and multicollinearity effects.To indicate multicollinearity problems,a tolerance value that is less than0.10[140],a VIF value that is greater than10[19], [140]–[142],an EV that is close to zero[142],[143],and a condition index that is greater than30[140],[142],[143]were used as determinants.F.Processing of the AVNIR-2and SPOT-5Data for Modeling The data of A VNIR-2and SPOT-5were processed in the following three steps.First Processing Step—Spectral Bands and Simple Band Ratio:To test the potential of the spectral reflectance of all bands of one sensor and both sensors together and the ratios, the following bands and simple band ratios were used in the model.1)The spectral reflectance extracted from all four bands ofANVIR-2and SPOT-5were used individually in a linear regression model,and all bands of a single sensor were used in a multiple regression model.2)The spectral reflectance extracted from all bands ofANVIR-2and SPOT-5and the principal component anal-ysis(PCA)of all bands of both sensors were used to-gether using a stepwise multiple regression model.3)The spectral reflectance extracted from all six simplespectral band ratios(1/2,1/3,1/4,2/3,2/4,and3/4)of both sensors was used individually in a simple regression model.Multiple regression models were also used to test all simple band ratios of each sensor together.4)The spectral reflectance extracted from all simple bandratios(1/2,1/3,1/4,2/3,2/4,and3/4)of both sensors was used together in stepwise multiple regression models. Second Processing Step—Modeling of the Texture Parame-ters:Fifteen types of texture measurements using four window sizes(from3×3to9×9)were used to generate the texture parameters from four spectral bands(each of the A VNIR-2and SPOT-5data).All texture-derived parameters were used in the model in the following manner.1)The texture parameters derived from each band of bothsensors and all texture parameters of a single sensor were used in the stepwise multiple regression model.2)The texture parameters derived from both sensors to-gether were used in the multiple regression model.3)The texture parameters derived from the PCA of bothsensors were used in the multiple regression model.4)The texture parameters derived from the band averagingof both sensors were used in the multiple regression model.Third Processing Step—Modeling the Simple Ratio of the Texture Parameters:In this processing step,six types of ratios (1/2,1/3,1/4,2/3,2/4,and3/4)were performed using theB EST F IT A LLOMETRIC MODELTABLE IIIDW (B IOMASS )D ISTRIBUTION OF S ELECTED F IELD PLOTStexture parameters of both sensors,and modeling was per-formed in the following ways.1)The parameters derived from each texture parameter ratio were used in the multiple regression model.2)The parameters derived from all six simple texture band ratios of an individual sensor were used in the multiple regression model.3)The parameters derived from all texture parameter ratios of both sensors were used in the stepwise multiple regres-sion model together.IV .R ESULTS AND A NALYSISThe field data collected from 50field plots showed a wide range of biomass levels from 52to 530t/ha.The average of ca.150t/ha biomass for our secondary forest study area is more than twice the biomass levels for other reported tropical secondary forests [86]and is representative of a wide variety of successional stages and tree sizes in the study area.For example,most forest is younger than 70years old,with a biomass below 200t/ha.The fewer plots above this level reflect the more restricted distribution of late successional stage forest.In all modeling processes,the 50field plots were used as the dependent variable,and the parameters derived from different processing steps (A VNIR-2and/or SPOT-5)were used as independent variables.The results of the three processing steps are presented as three separate sections.A.Performance of the Raw Bands and Simple Band Ratio The best estimates of biomass using simple spectral bands from A VNIR-2and SPOT-5,as well as different combinations of bands and PCA,produced only ca.50%usable accuracy.From the individual bands of both sensors,best result (r 2=0.494for A VNIR-2and r 2=0.316for SPOT-5)was obtained from the NIR bands,and the lowest performance (r 2=0.002for A VNIR-2and r 2=0.0345for SPOT-5)was obtained from the red bands [Fig.4(a)and (b)].The per-formance of the model (r 2)increased to 0.631and 0.503using all bands of A VNIR-2and SPOT-5,bining all bands of both sensors together was not able to produce a better performance because of a strong intercorrelation among bands.However,although multiband models appear to improve biomass estimation accuracy,the problem is that these models violate the assumption of uncorrelated independent variables and show strong multicollinearity effects (a CI that is more than 30)except for the PCA-based model which was only able to define field biomass with an accuracy of approxi-mately 50%.The simple band ratios of both sensors (individually and together)improved biomass estimation substantially [Fig.5(a)and (b)],with the highest r 2of 0.59being derived from the red/NIR ratio of A VNIR-2,compared to the highest perfor-mance for SPOT-5of r 2=0.387also from the red/NIR ratio.This improvement may be explained by the fact that ratios can enhance the vegetation signal while minimizing the solar irradiance,soil background,and topographic effects [90],[92],[93],[119],[144]–[152].In addition to the assessment of single band ratios,multiple regression models were developed using all simple band ratios of A VNIR-2and SPOT-5for each sensor individually and both together.The results [Fig.5(c)]showed a significant improvement in biomass estimation,with an r 2of 0.739obtained from the combined use of simple ratios of bothF ORMULAS OF THE T EXTURE M EASUREMENTS U SED IN T HIS PAPERsensors.However,as with the raw spectral bands,very strong multicollinearity effects were observed for all three models [Fig.5(c)]due to a strong correlation among the band ratios.In summary,the attempts to estimate biomass using sim-ple spectral bands of A VNIR-2and SPOT-5with different combinations of band ratios and PCA produced only ca.60%usable accuracy.The reasons for this can be explained as follows.1)The field biomass in this study area is very high (52–530t/ha).2)Although the near-infrared reflectance from a single leaf layer increases initially with increasing leaf cover,asFig.4.Accuracy of biomass estimation using rawdata.Fig.5.Accuracy of biomass estimation using a simple ratio of raw data.additional leaf layers are added to a canopy,these in-creases are not sustained [153].Concurrently,as the canopy matures,creating more layers and increasing in complexity,shadowing acts as a spectral trap for incom-ing energy and reduces the amount of radiation returning to the sensor [87],[154].This is a normal situation in tropical and subtropical forests with high biomass.A lower accuracy was also found using simple spectral bands in linear regression in many other studies [25],[26],[28],[31],[36],[80]–[82].3)Although we used 8spectral bands and 12simple band ratios from the two sensors,almost all bands and ratios were highly correlated,and as a result,the multiple re-gression model was found to be unsuitable because of the violation of the assumption of uncorrelated independent variables [25].Hence,we were unable to take advantage of the potential synergies between the different sensors for biomass estimation.4)Ratios and vegetation indices have been shown to be mainly useful in temperate and boreal forest regions [5],[37],[88],[96],[155]–[158],where forests have a relatively simple structure.In tropical and subtropical regions,the forest structure is very complex,and the relationship between the vegetation index and biomass is asymptotic [25],[159],especially in tropical forests with high biomass.Considering the moderate accuracy obtained so far,this paper decided to investigate further using the spatial characteristics of the images,particularly texture,for biomass estimation.Texture is an important variable,and it has already shown po-tential for biomass estimation using optical data [5],[38],[89],[115]–[118],[160].。

计算机视觉、机器学习相关领域论文和源代码大集合--持续更新……zouxy09@/zouxy09注:下面有project网站的大部分都有paper和相应的code。
Code一般是C/C++或者Matlab代码。
最近一次更新:2013-3-17一、特征提取Feature Extraction:·SIFT [1] [Demo program][SIFT Library] [VLFeat]·PCA-SIFT [2] [Project]·Affine-SIFT [3] [Project]·SURF [4] [OpenSURF] [Matlab Wrapper]·Affine Covariant Features [5] [Oxford project]·MSER [6] [Oxford project] [VLFeat]·Geometric Blur [7] [Code]·Local Self-Similarity Descriptor [8] [Oxford implementation]·Global and Efficient Self-Similarity [9] [Code]·Histogram of Oriented Graidents [10] [INRIA Object Localization Toolkit] [OLT toolkit for Windows]·GIST [11] [Project]·Shape Context [12] [Project]·Color Descriptor [13] [Project]·Pyramids of Histograms of Oriented Gradients [Code]·Space-Time Interest Points (STIP) [14][Project] [Code]·Boundary Preserving Dense Local Regions [15][Project]·Weighted Histogram[Code]·Histogram-based Interest Points Detectors[Paper][Code]·An OpenCV - C++ implementation of Local Self Similarity Descriptors [Project]·Fast Sparse Representation with Prototypes[Project]·Corner Detection [Project]·AGAST Corner Detector: faster than FAST and even FAST-ER[Project]· Real-time Facial Feature Detection using Conditional Regression Forests[Project]· Global and Efficient Self-Similarity for Object Classification and Detection[code]·WαSH: Weighted α-Shapes for Local Feature Detection[Project]· HOG[Project]· Online Selection of Discriminative Tracking Features[Project]二、图像分割Image Segmentation:·Normalized Cut [1] [Matlab code]·Gerg Mori’ Superpixel code [2] [Matlab code]·Efficient Graph-based Image Segmentation [3] [C++ code] [Matlab wrapper]·Mean-Shift Image Segmentation [4] [EDISON C++ code] [Matlab wrapper]·OWT-UCM Hierarchical Segmentation [5] [Resources]·Turbepixels [6] [Matlab code 32bit] [Matlab code 64bit] [Updated code]·Quick-Shift [7] [VLFeat]·SLIC Superpixels [8] [Project]·Segmentation by Minimum Code Length [9] [Project]·Biased Normalized Cut [10] [Project]·Segmentation Tree [11-12] [Project]·Entropy Rate Superpixel Segmentation [13] [Code]·Fast Approximate Energy Minimization via Graph Cuts[Paper][Code]·Efficient Planar Graph Cuts with Applications in Computer Vision[Paper][Code]·Isoperimetric Graph Partitioning for Image Segmentation[Paper][Code]·Random Walks for Image Segmentation[Paper][Code]·Blossom V: A new implementation of a minimum cost perfect matching algorithm[Code]·An Experimental Comparison of Min-Cut/Max-Flow Algorithms for Energy Minimization in Computer Vision[Paper][Code]·Geodesic Star Convexity for Interactive Image Segmentation[Project]·Contour Detection and Image Segmentation Resources[Project][Code]·Biased Normalized Cuts[Project]·Max-flow/min-cut[Project]·Chan-Vese Segmentation using Level Set[Project]· A Toolbox of Level Set Methods[Project]·Re-initialization Free Level Set Evolution via Reaction Diffusion[Project]·Improved C-V active contour model[Paper][Code]· A Variational Multiphase Level Set Approach to Simultaneous Segmentation and BiasCorrection[Paper][Code]· Level Set Method Research by Chunming Li[Project]· ClassCut for Unsupervised Class Segmentation[cod e]· SEEDS: Superpixels Extracted via Energy-Driven Sampling[Project][other]三、目标检测Object Detection:· A simple object detector with boosting [Project]·INRIA Object Detection and Localization Toolkit [1] [Project]·Discriminatively Trained Deformable Part Models [2] [Project]·Cascade Object Detection with Deformable Part Models [3] [Project]·Poselet [4] [Project]·Implicit Shape Model [5] [Project]·Viola and Jones’s Face Detection [6] [Project]·Bayesian Modelling of Dyanmic Scenes for Object Detection[Paper][Code]·Hand detection using multiple proposals[Project]·Color Constancy, Intrinsic Images, and Shape Estimation[Paper][Code]·Discriminatively trained deformable part models[Project]·Gradient Response Maps for Real-Time Detection of Texture-Less Objects: LineMOD [Project]·Image Processing On Line[Project]·Robust Optical Flow Estimation[Project]·Where's Waldo: Matching People in Images of Crowds[Project]· Scalable Multi-class Object Detection[Project]· Class-Specific Hough Forests for Object Detection[Project]· Deformed Lattice Detection In Real-World Images[Project]· Discriminatively trained deformable part models[Project]四、显著性检测Saliency Detection:·Itti, Koch, and Niebur’ saliency detection [1] [Matlab code]·Frequency-tuned salient region detection [2] [Project]·Saliency detection using maximum symmetric surround [3] [Project]·Attention via Information Maximization [4] [Matlab code]·Context-aware saliency detection [5] [Matlab code]·Graph-based visual saliency [6] [Matlab code]·Saliency detection: A spectral residual approach. [7] [Matlab code]·Segmenting salient objects from images and videos. [8] [Matlab code]·Saliency Using Natural statistics. [9] [Matlab code]·Discriminant Saliency for Visual Recognition from Cluttered Scenes. [10] [Code]·Learning to Predict Where Humans Look [11] [Project]·Global Contrast based Salient Region Detection [12] [Project]·Bayesian Saliency via Low and Mid Level Cues[Project]·Top-Down Visual Saliency via Joint CRF and Dictionary Learning[Paper][Code]· Saliency Detection: A Spectral Residual Approach[Code]五、图像分类、聚类Image Classification, Clustering·Pyramid Match [1] [Project]·Spatial Pyramid Matching [2] [Code]·Locality-constrained Linear Coding [3] [Project] [Matlab code]·Sparse Coding [4] [Project] [Matlab code]·Texture Classification [5] [Project]·Multiple Kernels for Image Classification [6] [Project]·Feature Combination [7] [Project]·SuperParsing [Code]·Large Scale Correlation Clustering Optimization[Matlab code]·Detecting and Sketching the Common[Project]·Self-Tuning Spectral Clustering[Project][Code]·User Assisted Separation of Reflections from a Single Image Using a Sparsity Prior[Paper][Code]·Filters for Texture Classification[Project]·Multiple Kernel Learning for Image Classification[Project]· SLIC Superpixels[Project]六、抠图Image Matting· A Closed Form Solution to Natural Image Matting [Code]·Spectral Matting [Project]·Learning-based Matting [Code]七、目标跟踪Object Tracking:· A Forest of Sensors - Tracking Adaptive Background Mixture Models [Project]·Object Tracking via Partial Least Squares Analysis[Paper][Code]·Robust Object Tracking with Online Multiple Instance Learning[Paper][Code]·Online Visual Tracking with Histograms and Articulating Blocks[Project]·Incremental Learning for Robust Visual Tracking[Project]·Real-time Compressive Tracking[Project]·Robust Object Tracking via Sparsity-based Collaborative Model[Project]·Visual Tracking via Adaptive Structural Local Sparse Appearance Model[Project]·Online Discriminative Object Tracking with Local Sparse Representation[Paper][Code]·Superpixel Tracking[Project]·Learning Hierarchical Image Representation with Sparsity, Saliency and Locality[Paper][Code]·Online Multiple Support Instance Tracking [Paper][Code]·Visual Tracking with Online Multiple Instance Learning[Project]·Object detection and recognition[Project]·Compressive Sensing Resources[Project]·Robust Real-Time Visual Tracking using Pixel-Wise Posteriors[Project]·Tracking-Learning-Detection[Project][OpenTLD/C++ Code]· the HandVu:vision-based hand gesture interface[Project]· Learning Probabilistic Non-Linear Latent Variable Models for Tracking Complex Activities[Project]八、Kinect:·Kinect toolbox[Project]·OpenNI[Project]·zouxy09 CSDN Blog[Resource]· FingerTracker 手指跟踪[code]九、3D相关:·3D Reconstruction of a Moving Object[Paper] [Code]·Shape From Shading Using Linear Approximation[Code]·Combining Shape from Shading and Stereo Depth Maps[Project][Code]·Shape from Shading: A Survey[Paper][Code]· A Spatio-Temporal Descriptor based on 3D Gradients (HOG3D)[Project][Code]·Multi-camera Scene Reconstruction via Graph Cuts[Paper][Code]· A Fast Marching Formulation of Perspective Shape from Shading under FrontalIllumination[Paper][Code]·Reconstruction:3D Shape, Illumination, Shading, Reflectance, Texture[Project]·Monocular Tracking of 3D Human Motion with a Coordinated Mixture of Factor Analyzers[Code]·Learning 3-D Scene Structure from a Single Still Image[Project]十、机器学习算法:·Matlab class for computing Approximate Nearest Nieghbor (ANN) [Matlab class providing interface to ANN library]·Random Sampling[code]·Probabilistic Latent Semantic Analysis (pLSA)[Code]·FASTANN and FASTCLUSTER for approximate k-means (AKM)[Project]·Fast Intersection / Additive Kernel SVMs[Project]·SVM[Code]·Ensemble learning[Project]·Deep Learning[Net]· Deep Learning Methods for Vision[Project]·Neural Network for Recognition of Handwritten Digits[Project]·Training a deep autoencoder or a classifier on MNIST digits[Project]· THE MNIST DATABASE of handwritten digits[Project]· Ersatz:deep neural networks in the cloud[Project]· Deep Learning [Project]· sparseLM : Sparse Levenberg-Marquardt nonlinear least squares in C/C++[Project]· Weka 3: Data Mining Software in Java[Project]· Invited talk "A Tutorial on Deep Learning" by Dr. Kai Yu (余凯)[Video]· CNN - Convolutional neural network class[Matlab Tool]· Yann LeCun's Publications[Wedsite]· LeNet-5, convolutional neural networks[Project]· Training a deep autoencoder or a classifier on MNIST digits[Project]· Deep Learning 大牛Geoffrey E. Hinton's HomePage[Website]· Multiple Instance Logistic Discriminant-based Metric Learning (MildML) and Logistic Discriminant-based Metric Learning (LDML)[Code]· Sparse coding simulation software[Project]· Visual Recognition and Machine Learning Summer School[Software]十一、目标、行为识别Object, Action Recognition:·Action Recognition by Dense Trajectories[Project][Code]·Action Recognition Using a Distributed Representation of Pose and Appearance[Project]·Recognition Using Regions[Paper][Code]·2D Articulated Human Pose Estimation[Project]·Fast Human Pose Estimation Using Appearance and Motion via Multi-Dimensional Boosting Regression[Paper][Code]·Estimating Human Pose from Occluded Images[Paper][Code]·Quasi-dense wide baseline matching[Project]· ChaLearn Gesture Challenge: Principal motion: PCA-based reconstruction of motion histograms[Project]· Real Time Head Pose Estimation with Random Regression Forests[Project]· 2D Action Recognition Serves 3D Human Pose Estimation[Project]· A Hough Transform-Based Voting Framework for Action Recognition[Project]·Motion Interchange Patterns for Action Recognition in Unconstrained Videos[Project]·2D articulated human pose estimation software[Project]·Learning and detecting shape models [code]·Progressive Search Space Reduction for Human Pose Estimation[Project]·Learning Non-Rigid 3D Shape from 2D Motion[Project]十二、图像处理:· Distance Transforms of Sampled Functions[Project]· The Computer Vision Homepage[Project]· Efficient appearance distances between windows[code]· Image Exploration algorithm[code]· Motion Magnification 运动放大[Project]· Bilateral Filtering for Gray and Color Images 双边滤波器[Project]· A Fast Approximation of the Bilateral Filter using a Signal Processing Approach [Project]十三、一些实用工具:·EGT: a Toolbox for Multiple View Geometry and Visual Servoing[Project] [Code]· a development kit of matlab mex functions for OpenCV library[Project]·Fast Artificial Neural Network Library[Project]十四、人手及指尖检测与识别:· finger-detection-and-gesture-recognition [Code]· Hand and Finger Detection using JavaCV[Project]· Hand and fingers detection[Code]十五、场景解释:· Nonparametric Scene Parsing via Label Transfer [Project]十六、光流Optical flow:· High accuracy optical flow using a theory for warping [Project]· Dense Trajectories Video Description [Project]·SIFT Flow: Dense Correspondence across Scenes and its Applications[Project]·KLT: An Implementation of the Kanade-Lucas-Tomasi Feature Tracker [Project]·Tracking Cars Using Optical Flow[Project]·Secrets of optical flow estimation and their principles[Project]·implmentation of the Black and Anandan dense optical flow method[Project]·Optical Flow Computation[Project]·Beyond Pixels: Exploring New Representations and Applications for Motion Analysis[Project] · A Database and Evaluation Methodology for Optical Flow[Project]·optical flow relative[Project]·Robust Optical Flow Estimation [Project]·optical flow[Project]十七、图像检索Image Retrieval:· Semi-Supervised Distance Metric Learning for Collaborative Image Retrieval [Paper][code]十八、马尔科夫随机场Markov Random Fields:·Markov Random Fields for Super-Resolution [Project]· A Comparative Study of Energy Minimization Methods for Markov Random Fields with Smoothness-Based Priors [Project]十九、运动检测Motion detection:· Moving Object Extraction, Using Models or Analysis of Regions [Project]·Background Subtraction: Experiments and Improvements for ViBe [Project]· A Self-Organizing Approach to Background Subtraction for Visual Surveillance Applications [Project] ·: A new change detection benchmark dataset[Project]·ViBe - a powerful technique for background detection and subtraction in video sequences[Project] ·Background Subtraction Program[Project]·Motion Detection Algorithms[Project]·Stuttgart Artificial Background Subtraction Dataset[Project]·Object Detection, Motion Estimation, and Tracking[Project]。

The Constructs of Augmented RealityA Developer’s Guide to AR—Foundational Constructs, Skills, and T ools Required to Make AR a RealityT able of ContentsBuilding a New Reality (3)Experiencing AR (4)Defining Attributes of AR (5)A Convergence of T echnologies (6)Foundational Constructs (7)Foundational Constructs—Hardware (8)Foundational Constructs—Objects & Behaviors (9)Foundational Constructs—Scene Understanding (10)Foundational Constructs—Rendering (11)Current Use Cases & Opportunities (12)Enterprise Examples (12)Consumer Examples (13)Development & Content Creation Skills (14)Options and Paths to AR (15)Qualcomm T echnologies, Inc. T ools & Resources for AR (16)Innovate T ogether (17)THE CONSTRUCTS OF AUGMENTED REALITY | 3#1 Physical Layer — corresponds to the real, physical world we experiencethrough our 5 senses.—VIEW FROM TOP FLOORTHE CONSTRUCTS OF AUGMENTED REALITY | 4Experiencing ARUsers interact in the Experience Layer through asmartphone screen, an ergonomic interactive headworn unit, or a combination of both. AR allows the physical 3D space to be a canvas for more immersive experiences, new ways of interacting, and establishing more natural user connections. Based on the idea that the brain works best in 3D environments, AR is well-aligned with ourhuman cognitive abilities and poised to revolutionize users’ fascination with the digital world.Early in its evolution, AR developers added digital content like overlays and static objects using systems that could remember their positions and orientations, while respecting users’ viewports (typically smartphones—see Figure 1). This created the illusion of digital objects that appeared to live in the real world, but had no geometric or spatial understanding of the real-world environment.T oday’s latest AR advances facilitate the illusion of realistic interactions between complex digital content and the real world. An AR system associates that digital content with real-world locations and geometry, letting users interact from virtually anywhere while adhering to real-world boundaries and limits.For example, AR technology allows digital objects like a character to be placed and anchored relative to a physical object, like a couch in a room (see Figure 2). Just like in the real world, if the couch moves, the digital object anchored to it moves accordingly. However, the digital object cannot fall through the physical object or be pushed through barriers, like the couch’s pillows.Figure 1: Early AR with simple overlays on a smartphone.TVLightFigure 2: Advanced AR showing digital content (dog character) anchored to a physical object (couch).TVLightAwareness Interactivity Persistence Presence Scale SentienceDefining Attributes of AR5A Convergence of T echnologiesMobile devices are capable of delivering premium AR experiences. This is due to the evolution and convergence of several technologies:3D Spatial Audio: Sounds in the real world come from different sources and directions. AR experiences are enhanced by binaural audio technology that reproduces 3D sound experiences in the digital world.Camera T echnology: The perception of augmented reality depends on a highlevel of detail. For example, when building precise digital twins of real-world environments and objects, mobile device cameras must capture video at high framerates in resolutions upwards of 8K. Multiple cameras capture different aspects of the incoming feeds and their results are fused to generate ultra-high levels of detail. This may be further enhanced with advanced computational photography methods.Cloud Connectivity: High bandwidth, low-latency connectivity from 5G mmWave and Wi-Fi 6E and Wi-Fi 7 can allow for round-trip data transfers to/ from the cloud for low motion-to-photon latency. Interactions can be captured and sent to the cloud for processing, and the results are rendered on the device in near real-time. Developers gain flexibility over processing done at the device edge versus the cloud.Machine Learning (ML): ML algorithms, particularly for computer vision, are key for detecting and tracking objects and features in scenes and mapping the real-world environment.Processor Advances: Advances in mobile processors deliver powerful compute with power efficiency. For example, the heterogeneous design of Snapdragon® technology and our Qualcomm® Kryo™ CPU with powerful and energy-efficient cores, Qualcomm® Adreno™ GPU for PC-quality rendering, and Qualcomm® Hexagon™ DSP for signal processing and heavy vector processing (e.g., for ML).Snapdragon, Qualcomm Kryo, Qualcomm Adreno, and Qualcomm Hexagon are products of Qualcomm T echnologies, Inc.and/or its subsidiaries.Split ProcessingNew XR devices, like lightweight headworn AR glasses, are poised to become the next evolutionof the smartphone. They can offer more immersive experiences than 2D screens andwill transition users from looking down at their phones, to looking around at their surroundings, while retaining that digital view.Split processing powers this experience. Here,the glasses gather and send data to the user’s smartphone for processing and then render anAR view based on data returned from the phone.By engaging the smartphone to perform thisheavy lifting, headsets remain light and power efficient, ideally consuming less than one watt.This processing is expected to be shared bya constellation of other devices surroundingus, including our PCs, connected cars, home routers, etc.THE CONSTRUCTS OF AUGMENTED REALITY |6Foundational ConstructsLet’s review the highlighted foundational constructs in more detail.ARScene Understanding• Scenes• Digital Twins • Plane Detection• Image Recognition & T racking • Spatial Mapping & MeshingHardware• Viewport • Sensors• Positional T racking • Input & Hand T racking • Face & Eye T rackingObjects & Behaviors• Local Anchors & Persistence • T rackables• Object Recognition & T racking • Physics EngineRendering• Occlusion• Foveated Rendering • Shaders• Physics-Based Rendering7Hardware provides the viewport into AR.A device’s viewport consists of a display (e.g., a touch screen or a headworn device) with a camera view to capture a real-time video stream and render digital content. The viewport acts as the canvas where the real-world blends with the digital world.Many sensors are required to digitize data gathered from the real world. Inertial measurement units (IMUs) like the compass, accelerometer, gyroscope, and GPS can track movements, associate virtual locations with real-world locations, and track device orientation. Sensor Fusion combines data from multiple sensors to derive more complex information (e.g., to estimate a position when GPS line-of-sight is obscured). Input allows users to interact with digital objects. Input can come from movements detected by IMUs, gesture recognition on touch screens, or handheld controllers tracked in 3D space.Sophisticated hand tracking methods can involve sensors or computer vision to track the position and orientation of arms, hands, and evenfingers in 3D space. Input data can be used to manipulate digital objects, interact with 3D GUIs, or animate digital representations of the user (e.g., realistic avatars, on-screen hands, etc.).Developers may also incorporate face and eye tracking. Face tracking tracks facial features and movements (e.g., to convey emotions on virtual avatars). Eye tracking follows where a user is looking and can reproduce eye movements on virtual avatars or highlight certain objects in the user’s view based on where they’re looking.Foundational Constructs—HardwareMetadata is required to position, track, and persist digital content.Anchors offer the ability to anchor (i.e., lock or pin) digital assets in space, associating them with real-world GPS locations or objects. Local anchors are those created and used by a single user. Cloud anchors are shared by multiple users, usually in relation to a coordinated space managed by a cloud server.Trackables are virtual points or planes to which anchors may be attached. For example, a trackable associated with a moving surface in a dynamic environment causes all anchored objects toreposition/reorient accordingly. This information is often persisted across sessions. For example, a virtual object placed at a location in one session should be visible in a subsequent session, even if viewed from a different location or orientation.A physics engine can simulate real-world physics, allowing for realistic behaviors and reactions ofvirtual objects (e.g., to simulate how objects fall given gravity, aerodynamics, etc.). A physics engine defines the rules of what’s possible and can even be made to bend the rules for different types of experiences.Foundational Constructs—Objects & BehaviorsxzyFoundational Constructs— Scene UnderstandingTHE CONSTRUCTS OF AUGMENTED REALITY |11Rendering techniques play a key role in blending digital content withthe physical world in a realistic and believable manner, and may relyheavily on scene understanding.Depth understanding (aka, depth estimation) is an importantcalculation and plays a key role in deriving distances to features,objects, and parts of scenes. It can facilitate interactions (e.g., preventthe user from pushing a virtual object through a physical wall) andocclusion, where physical objects can cover virtual objects. Dependingon the user’s viewpoint, a digital object can be partially or even fully covered by a physical object, so it needs to be shown or hidden accordingly, just like a real occluded object.Foveated Rendering(applicable only to headworn units) can optimize performance by reducing the details and resolution to be rendered in peripheral areas. In some units, dynamic foveated rendering based on eye tracking can update the foveated areas based on where the user’s eyes are looking.Shaders can add realism by implementing effects, such as lighting and shadows, particle systems and water effects, motion blur, bump mapping, and distortion. Shaders operate at many levels of granularity, from geometry right down to the pixel level.Physical-based Rendering (PBR), often performed using shaders, simulates how light reflects off different materials like in the real world. This improves realism and helps virtual objects blend in with the physical world. For example, shadows and light sources from digital objects and particle systems can be rendered on the environment.Foundational Constructs—RenderingCurrent Use Cases & Opportunities Enterprise ExamplesVirtual Gatherings (enterprise and consumer) Education and TrainingIndustrial Design and Manufacturing Medical/HealthcareRemote (aka, what-you-see) Assist12The MetaverseAR is poised to drive the spatial web , an evolution of the Internet that goes beyond linking websites together to also link people, spaces, and assets. Perhaps the ultimate use cases for AR will be found in metaverses—environments where users can immerse themselves more deeply than ever before.These immersive environments can exist parallel to the real world, allowing users to interact, explore, and even exchange digital assets. They’ll take many of the aforementioned use cases to the next level by elevating the feeling of human presence, social interactions, and realism of digital content behaviors. For example, realistic avatars are poised to replace today’s 2D profile pictures, and one day, users may have multiple avatars for different uses (e.g., work versus personal).Development & Content Creation SkillsT o start developing in AR, you should be comfortable with the following:• Working in 3D space, including 3D math like vectors and matrices.• Graphics pipelines to convert assets from art software packages to a format optimized for a given platform.• Shaders to implement special effects.• Scene management to load/render only what’s required for the current viewport (i.e., the field of view provided by the user’s 2D screen or immersive headworn device).• Real-time, frame-based software architectures. For example, a typical game loop acquires user input, updates game logic based on that input, and then renders it accordingly. An AR loop adds sensor input collection and considers the physical world in the update and rendering phases. • Real-time debugging techniques, including remote debugging of embedded devices.• Digital content creation, including character modelers and animators, object modelers, UI designers, and texture artists. 2D art assets can include imagery and textures for signage, information boards, virtual UIs, as well as headworn units that remain fixed on screen. T extures are also used for effects like particle systems (e.g., water effects, smoke, etc.). 3D art assets include objects, characters, and environmental models that augment the surroundings. Model rigs can be created to procedurally animate or use streams of animation data.UI and UXQuality AR interactions should have quality user interfaces and quality user experience design.Many of the gestures used in today’s 2D mobile apps (e.g., taps to select objects, swipes to move objects around, and pinches to resize objects), generally translate well for AR interactions so that most mobile app developers can apply these in AR development. This article from Google provides a good overviewof gestures in AR. In addition to implementing these gestures on touchscreens, developers may also implement them via hand tracking.And always remember, safety first! AR experiences are more immersive than standard applications, so users can lose track of their surroundings or even experience cybersickness. T o help prevent this, remind users to be aware of their surroundings and avoid having them walk backward. Also, limit AR session time so users can re-ground themselves in reality, but make it easy to resume their session in the same state.See our eBook on Cybersickness for more tips.THE CONSTRUCTS OF AUGMENTED REALITY |15Options and Paths to ARDevelopers have several options for AR development, ranging from porting existing experiences to writing apps from scratch.Choose the one that works best for your project and your skill level.Add to Mobile/Web ARDevelopers can add AR as a feature by gradually migrating parts of their 2D content into AR to enhance existingexperiences. This can reduce the barrier of entry into AR by adding an AR layer that works together with existing 2D content.For example, a racing game on a smartphone can be viewed through an AR headset that renders a map during gameplay.Migrate from VRVR developers can port their existing VR experiences and content to AR. In the simplest case, start by removing VRbackgrounds from existing games or apps, so objects exist in AR space.Port from Other PlatformsThanks to tools like our Snapdragon Spaces™ XR Developer Platform (discussed below) and standards like OpenXR,it’s easier than ever to port AR apps to mobile devices, including smartphones and headworn displays powered by ourSnapdragon SoCs.Build from ScratchStarting from scratch? Build immersive experiences for headworn AR from the ground up in Unity or Unreal with ourSnapdragon Spaces XR Developer Platform.Snapdragon Spaces is a product of Qualcomm T echnologies, Inc. and/or its subsidiaries.echnologies, Inc. and/or its subsidiaries.Qualcomm T echnologies, Inc. T ools & Resources for ARSnapdragon Spaces XR Developer Platform : XR platform for building immersive Unreal, and an OpenXR compliant runtime.Snapdragon XR2 5G Platform : SoC that brings the best of our mobile compute innovations to XR.Snapdragon XR2 Reference Design : Reference design for building immersive Snapdragon Profiler : Analyze the processing load, memory, power, thermal characteristics, network data, and more in real-time.Qualcomm® Computer Vision SDK : Rich SDK packed with mobile-optimized Qualcomm® 3D Audio T ools : T ools to record, edit, and produce spatial audio that enhances the immersive experience.Qualcomm® 3D Audio Plugin for Unity : Binaural spatial audio plugin for Unity. 16Innovate T ogether 。
I.J. Image, Graphics and Signal Processing, 2019, 10, 1-7Published Online October 2019 in MECS (/)DOI: 10.5815/ijigsp.2019.10.01Facial Expressions Recognition in Thermal Images based on Deep Learning TechniquesYomna M. ElbarawyFaculty of Science, Al-Azhar University, Cairo, EgyptEmail: y.elbarawy@.egNeveen I. GhaliFaculty of Computers & Information Technology, Future University in Egypt, Cairo, EgyptEmail: neveen.ghali@.egRania Salah El-SayedFaculty of Science, Al-Azhar University, Cairo, EgyptEmail: rania5salah@.egReceived: 17 June 2019; Accepted: 07 August 2019; Published: 08 October 2019Abstract—Facial expressions are undoubtedly the best way to express human attitude which is crucial in social communications. This paper gives attention for exploring the human sentimental state in thermal images through Facial Expression Recognition (FER) by utilizing Convolutional Neural Network (CNN). Most traditional approaches largely depend on feature extraction and classification methods with a big pre-processing level but CNN as a type of deep learning methods, can automatically learn and distinguish influential features from the raw data of images through its own multiple layers. Obtained experimental results over the IRIS database show that the use of CNN architecture has a 96.7% recognition rate which is high compared with Neural Networks (NN), Autoencoder (AE) and other traditional recognition methods as Local Standard Deviation (LSD), Principle Component Analysis (PCA) and K-Nearest Neighbor (KNN).Index Terms—Thermal Images, Neural Network, Convolutional Neural Network, Facial Expression Recognition, Autoencoders.I.I NTRODUCTIONThe awareness of facial expressions allows the prediction of the human status which can facilitate the adaptation through social situations. Also in computer-human interaction area facial expressions detection is very important as in driver fatigue detection in order to prevent the accidents on roads [1].In 1997 Y. Yoshitomi et al. [4] introduced a system for FER using thermal image processing and NN with an accuracy recognition rate 90% applied over image sequences of neutral, happy, surprise and sad faces of one female. Deep Boltzmann Machine (DBM) model was [5]. In 2015 a 72.4% recognition rate was achieved by Nakanishi et al. [6] using a thermal dataset consists of three subjects and three facial expressions of "happy", "neutral" and "other". The introduced system uses the 2D discrete cosine transform and the nearest-neighbor criterion in the feature vector space. Elbarawy et al. [21] in 2018 used the local entropy as a feature extractor and KNN as a classifier based on the discrete cosine transform filter achieving 90% recognition rate over the IRIS thermal database [14].In the 1980s, CNN was proposed by Y. LeCun [7] as a NN is composed of two main consecutive layers defined as convolutional and subsampling. In 2012 a deep CNN was presented by Hinton et al. [8] since then image recognition based CNN was given a wide tension.This paper presents CNN as an effective deep learning method to recognize facial expressions in thermal images by achieving acceptable accuracy of recognition rate compared with other recognition methods as explained later in experimental results section. CNN is specifically implemented as it reduces the pre-processing time by passing data through its multiple convolutional layers and making its own data filtering layer by layer which is worthy in real time applications [1]. The proposed system is applied over the IRIS dataset which has different poses for each subject and multiple rotation degrees as well as occlusion by glasses. Although using thermal images in recognition overcomes many challenges that faces recognition through visible images as illumination [2, 3], thermal images has its own challenges to overcome as temperature, occlusion by glasses and poses which will be tackled in this research.The remainder of the paper is structured as follows: Section II briefly introduces feature extraction and classification methods which were used here, including NN, AE and CNN. Proposed system with phases of input, pre-processing, recognition and output are in Section III.under different factors as network structure and pre-processing is illustrated. Finally, conclusions and results analysis are presented in Section V.II. P RELIMINARIESThis section briefly debates classic neural network, AEs and CNN applied on facial expression thermal images data to recognize expressions. A. Neural Networks Based FERNNs have two learning types, supervised and unsupervised techniques [9, 10]. This system uses the supervised technique feedforward with backpropagation training neural network [11] to train and produces a desired output as shown in Fig. 1. Number of inputimages x i are ∑x i 60i=1 and the number of the hidden layer neurons are adjusted according to the recognition accuracy. The numbers of decision classes are 3 denoting different facial expressions in the used dataset.Fig.1. NN based facial expression recognition.Scaled conjugate gradient backpropagation was used torecognize the facial expressions [12] and (1) represents the cross entropy function used for calculating the network error [13].C (X |Y )=−1n ∑y (i)ln (o(x (i)))+(1−y (i))ln(1−o(x (i)))n i=1(1)Where X ={x (1).…. x (n)} are the set of input images in the training data, Y ={y (1).…. y (n)} are the corresponding labels of input examples and o(x (i)) is the output of the neural network given input x i calculated as in (2)o =f(∑x (i)w (i))n i=1 (2)Where w i is the network weight for input x i . Neural network is introduced in algorithm 1. Algorithm 1: Neural Network Algorithm 1) Input pre-processed thermal images.2) Propagate forward through the network andrandomly initiate weights.3) Generate the output expressions.4) Calculate the network error using cross-entropyEquation 1.5) Re-adjust weights using (3).∆w (i)=rCx (i) (3)Where r is defined to be learning rate with proposed value 0.016) Goto 2 until acceptable output accuracy is reached B. Deep Autoencoder Neural Networks Based FER Autoencoder neural networks is an unsupervised learning for features extraction. It sets the output nodes with same dimensions as the input nodes. Therefore, a training goal is created which does not depend on existing labels but on the training data itself. This made an unsupervised optimization of the full neural network [16]. As in general deep learning models, AEs read the input data images as a matrix or array of images. AEs mainly has two parts encoders αand decoders β transited as in (4)α:X →Y.β:Y →X (4)Where X is the input vector and Y is the output one. The lower dimensional feature vector A is represented by (5).A =f(∑Wx +b) (5)Where W associated weight is vector with the input unit and hidden unit, b is the bias associated with the hidden unit.Networks can use more than one AE for feature extraction. Features extracted by the first AE behaves as an input for the second AE and so on. Finally, classification is done at the softmax layer which unlike AEs its training is supervised using the training data labels. The softmax layer uses a softmax function to calculate the probabilities distribution of the images over different expressions. Architecture of AEs network is illustrated in Fig. 2.The predicted probability for the j tℎclass given a sample vector x and a weighting vector w is given by (6).P (y =j |x )=ex T w j ∑ex T w n N n=1 (6)Where x Tw denotes the inner product of xand w.Fig.2. Autoencoders architecture of input vector X with length n.C. Convolutional Neural Network Based FERCNN differs from general deep learning models as it can directly accept 2D images as the input data, so that it has a unique advantage in the field of image recognition [18]. A four-layer CNN architecture designed to be applied over the used dataset, including two convolutional layers (C1, C2) and two subsampling layers (S1, S2). Finally, a Softmax classifier is used for image classification. General network architecture is illustrated in Fig. 3.Fig.3. General convolutional neural network architecture.Where C1 and C2 are used with different number of convolutions and kernel sizes. After each convolutional operation an additional operation is used called Rectified Linear Unit (ReLU) which is applied per pixel and replaces every negative pixel values in the feature map by zero value. Subsampling processes minimize the resolution of the functional map by max-pooling which takes the maximum response within the domestic features map size of the input (which is always the output of the convolutional layer) and reached a definite degree of invariance to deformity in the input [19]. At the fully connected layer, the output unit activation of the network made by softmax function which calculates the probability distribution of K different possible outcomes. After training, the network uses the cross entropy to indicate the distance between the experimental output and the expected output [20].III.F ACIAL E XPRESSION R ECOGNITION S YSTEM U SINGC NNA. System OverviewThis section introduces CNN based facial expression recognition system. The system flow is shown in Fig. 4 where the input thermal images dataset under test is manipulated to detect face to reduce noise and unify size of images before feature extraction. CNN is implemented for feature extraction as discussed previously. From the extracted classes the analysis and accuracy is calculated. Details of each module are stated below.Fig.4. Scheme for facial expression recognition systemB. IRIS DatasetThe proposed system is applied over IRIS dataset [14], the standard facial expression dataset in the OCTBVS database which contain images in bitmap RGB format. The database contains thermal and visible images of 30 subject (28 males and 2 females) with size 320x240, collected by the long wave IR Camera (Thermal-Raythoen Palm IR-Pro) at the University of Tennessee having uneven illuminations and different poses. Each subject has three different expressions Surprise, Happy and Angry. Fig. 5 has samples of the visible thermal images in IRIS dataset with different rotations.Fig.5. IRIS: different rotation sample images.C. Images Pre-processingThe system uses 90 images (60 for training and 30 for testing) with different rotations, as well as occlusion by glasses and poses. Only poses less than 45° rotation were selected.Image Pre-processing was done to reduce unnecessaryregions in the original images through two main steps: First, face detection and extracting useful regions of the face and neglecting other images parts which hold non-essential background information using Viola-Jones algorithm [15]. Fig. 6 shows samples of detected faces with different expressions. Second step was resizing extracted faces with size 120x120 and preparing a two matrices one for training images and the other for the testing images.Fig.6. Sample of detected faces with different expressions.D. Feature Extraction Based CNNProposed CNN applied over pre-processed images to extract features. CNN was robust for expression recognition with different number of convolutions and kernel sizes. The architecture of our CNN is illustrated in Fig. 7.Fig.7. Proposed CNN architecture.The architecture includes two convolutional layers, two sub-sampling layers and one fully connected layer. The network has an input of 120x120 grayscale images and outputs the credit of each expression. The first layer of the CNN is a convolution layer its objective is to extract elementary visual features as corners and borders of face parts, applies a convolution kernel size of 3x3 with stride of 1 horizontally and vertically and outputs 12 images with size 116x116 pixels. This layer is trailed by a sub-sampling layer that utilizes max-pooling with kernel size 2x2 at stride 2 to lessen the image to half of its size, outputs 12 images with size 58x58 pixels. Therefore, a new convolution layer performs 36 convolutions with a 3x3 kernel size and stride of 1 to guide of the past layer and trailed by another sub-sampling, with a 2x2 kernel size at stride 2, their aim is to perform the same operations as earlier, but to handle features at a lower level, perceiving contextual elements rather than borders E. Output ModuleThe output module holds classification results and recognition rates which are calculated as explained earlier in section II. The general output consists of three classes, one for each expression. In case of applying CNN the outputs were given to a fully connected hidden layer that classifies images using the softmax function earlier in (6). The same process is done for NN and AE as feature extraction and classification techniques to be compared with CNN.IV.E XPERIMENTAL R ESULTSThree models were applied over the selected data to show how to overcome the challenge of thermal images as temperature, occlusion by glasses and poses.First, NN model applied over the selected data andrecognition accuracy of applying neural network with multiple different number of neurons 4, 6, 8, 10, 12 and 14. At 8 neurons testing recognition accuracy was the best which gives a 93.3% recognition rate.Table 1. Neural network recognition accuracy.Second model applied AE neural networks as a feature extraction and classification method. Applying different network structures could cause a great impact on the recognition rates hence a variant number of hidden layers were tested. Two level structured network were used and testing results are in Table 2. The maximum recognition rate was made when number of the hidden neurons was 16 and 32 for first level and 8 for the second, with testing accuracy 90%. Table 3 includes processing time for applying each structure which implicates that time is directly proportional to the number of hidden layers in each level.Table 2. Recognition accuracy (%) using AEs.The third applied model used a CNN with two convolutional layers. Convolutional layer one (C1) applied with different number of features map (4, 8,12 and 16) with size 3x3. The second convolutional layer (C2) applied with different number of features map (12, 24 and 36) with size 3x3 and both layers trained with 50 epochs, obtained results are shown in Table 4 with the highest recognition rate being 96.7% in testing. Table 5 shows the processing time for each applied CNN structure. related to the hardware specification which the proposed system uses. This study used a system has 64 bit operating system with 4GB RAMs and processor speed 2.20 GHz.Table 3. AEs processing time in seconds.Table 4. Recognition accuracy (%) using CNN.Table 5. CNN processing time in seconds.Table 6. Overall accuracy results for recognition.The overall results appear in Table 6 imply that using CNNs for expressions recognition in thermal images achieve high recognition rate with 96.7% in less time compared with other recognition methods (AE and NN), since it is easier to train with the pooling operations for down sampling and its many fewer parameters than stacked AEs with the same number of hidden units. Average processing time of deep recognition methods is illustrated in Fig. 8. Table 7 clarifies the confusion matrix of using the proposed architecture of CNN with accuracy 96.7%. Also illustrates the True Positive (TP) and False Negative (FN) rates respectively, where all images with happy and angry expressions are recognized with 100% accuracy. Surprised faces recognized with 90% TP rate, the other 10% FN rate confused with happiness expression.Table 7. Confusion matrix of CNN with accuracy (96.7%).Fig.8. Average elapsed time of recognition methods based deep learning.In real systems the subject image can be taken from a far distance which will make it hard to recognize. In order to add another challenge to the proposed system here, data augmentation was used to simulate the earlier difficulty by using a set of scaled images (horizontally and vertically). All training images were scaled by a randomly selected factor from the range vector [1 2]. Applying the same earlier CNN structure over the augmented images 10 times running for training and testing the average recognition rate was 70.9%.V.C ONCLUSIONGenerally, experience and continuous testing is reliable to get the best network structure for a particular classification task. This paper holds two main approaches of conducted results, the first approach uses traditional NN for feature extraction and classification achieving 93.3% recognition rate. Second approach applies deep learning techniques as AEs and CNNs over the selected data. AEs has the longest processing time and lowest recognition rate with 90%.A standard neural network with the same number of features as in CNN has more parameters, resulting an additional noise during the training process and larger memory requirements. CNN used the same features across the image in different locations at the convolution layer, thus immensely reducing the memory requirement. Therefore, the implementation of a standard neural system identical to a CNN will be permanently poorer. The proposed CNN architecture as a deep supervised learner of features, detects facial expressions in thermal images with high recognition accuracy and less time compared with other deep learning model AE achieving 96.7%. In future, other architecturesmay be experimented to produce a higher accuracy.R EFERENCES[1]S. Naz, Sh. Ziauddin and A. R. Shahid, "Driver FatigueDetection using Mean Intensity, SVM and SIFT", International Journal of Interactive Multimedia and Artificial Intelligence, In press, pp. 1 - 8, 2017.[2] F. Z. Salmam, A. Madani and M. Kissi, "EmotionRecognition from Facial Expression Based on Fiducial Points Detection and Using Neural Network", International Journal of Electrical and Computer Engineering (IJECE), Vol. 8(1), pp. 52-59, 2018.[3]Y. Wang, X. Yang and J. Zou, "Research of EmotionRecognition Based on Speech and Facial Expression", TELKOMNIKA (Telecommunication, Computing, Electronics and Control), Vol. 11(1), pp. 83-90, 2013. [4]Y. Yoshitomi, N. Miyawaki, S. Tomita and S. Kimura,"Facial expression recognition using thermal image processing and neural network", 6th IEEE International Workshop on Robot and Human Communication, Sendai, Japan, pp. 380- 385, 1997.[5]Sh. Wang, M. He, Z. Gao, Sh. He and Q. Ji, "Emotionrecognition from thermal infrared images using deep Boltzmann machine", Front. Comput. Sci., Vol. 8(4), pp.609-618, 2014.[6]Y. Nakanishi, Y. Yoshitomi, T. Asada et al., "Facialexpression recognition using thermal image processing and efficient preparation of training-data", Journal of Robotics, Networking and Artificial Life, Vol. 2(2), pp.79-84, 2015.[7]Y. Lecun, "Generalization and Network DesignStrategies", Pfeifer, Schreter, Fogelman and Steels (eds)’Connectionism in perspective’, Elsevier, 1989. [8] A. Krizhevsky, I. Sutskever, and G. E. Hinton, "ImageNetclassification with deep convolutional neural networks".Advances in Neural Information Processing Systems (NIPS), pp. 1106-1114, 2012.[9]X. Liao and J. Yu, "Robust stability for interval Hopfieldneural networks with time delay", IEEE Transactions on Neural Networks, Vol. 9(5), pp. 1042–1045, 1998. [10]J. J. Hopfield, "Neurons with graded response havecollective computational properties like these of two-state neurons", Proceedings of the National Academy of Sciences, USA, Vol. 81(10), pp. 3088–3092, 1984. [11]R. Amardeep and Dr. K T. Swamy, "TrainingFeedforward Neural Network with Backpropogation Algorithm", International Journal of Engineering and Computer Science, Vol. 6(1), pp. 19860-19866, 2017. [12]M. F. Møller, "A scaled conjugate gradient algorithm forfast supervised learning", Neural Networks, Vol. 6(4), pp.525-533, 1993.[13]G. E. Nasr, E.A. Badr and C. Joun, "Cross Entropy ErrorFunction in Neural Networks: Forecasting Gasoline Demand", Proceedings of the Fifteenth International Florida Artificial Intelligence Research Society Conference, Florida, USA, pp. 381-384, 2002.[14]University of Tennessee: IRIS thermal-visible facedatabase: /pbvs/bench/, last accessed Jul. 2018.[15]P. Viola and M. Jones, "Rapid object detection using aboosted cascade of simple features", Proceedings of the 2001 IEEE Computer Society Conference on Computer Vision and Pattern Recognition, Vol. 1, Kauai, HI, USA, 2001.[16]U. Schmid, J. Günther and K. Diepold, "StackedDenoising and Stacked Convolutional Autoencoders. An Evaluation of Transformation Robustness for Spatial Data Representations", Technical Report, Technische Universität München, Munich, Germany, 2017.[17] B. Leng, S. Guo, X. Zhang, and Z. Xiong, "3d objectretrievalwith stacked local convolutional Autoencoder", Signal Processing, Vol. 112, pp. 119–128, 2015.[18]K. Shan, J. Guo, W. You, D. Lu and R. Bie, "AutomaticFacial Expression Recognition Based on a Deep Convolutional-Neural-Network Structure", Proceeding of IEEE 15th International Conference on Software Engineering Research, Management and Applications (SERA), London, UK, pp. 123-128, 2017. [19]Y. Yang, J. Yang, N. Xu and W. Han, "Learning 3D-FilterMap for Deep Convolutional Neural Networks", Proceeding of the 31st Conference on Neural Information Processing Systems (NIPS 2017), Long Beach, CA, USA, 2017.[20] A. Ruiz-Garcia, M. Elshaw, A. Altahhan and V. Palade,"Stacked Deep Convolutional Auto-Encoders for Emotion Recognition from Facial Expressions", International Joint Conference on Neural Networks (IJCNN), Anchorage, Alaska, pp. 1586-1593, 2017.[21]Y. M. Elbarawy, R. S. El-sayed and N. I. Ghali, "LocalEntropy and Standard Deviation for Facial Expressions Recognition in Thermal Imaging" Bulletin of Electrical Engineering and Informatics, Vol. 7(4), pp. 580-586, 2018. Authors’ ProfilesYomna M. Elbarawy received her B.Sc.and M.Sc. degrees in computer sciencefrom the Faculty of Science, Al-AzharUniversity, Cairo, Egypt in 2008 and2014 respectively. She is currently a Ph.D. student at the same university. Herresearch areas are social networksanalysis, computational intelligence,machine learning and deep learning technologies.Rania Salah El-Sayed is lecturer in the department of Mathematics & Computer Science, Faculty of science, Al-Azhar University, Cairo. Egypt. She received her Ph.D and M.Sc in Pattern Recognition and Network Security from Al-Azhar University in 2013 and 2009 respectively. Her B.Sc degree in Math & Computer Science was received in 2004 from Al-Azhar University. In 2012, she received CCNP security certification from Cisco. Her research interests include pattern recognition, machine learning & network security.Neveen I. Ghali received her B.Sc. from the Faculty of Science, Ain Shams University, Cairo, Egypt. Finished her M.Sc. and Ph.D. degrees in computer science from Faculty of Computers and Information, Helwan University, Cairo, Egypt in 1999 and 2003 respectively. She is currently a Professor in computer science and vice dean, Faculty of Computers and Information Technology in Future University in Egypt. Her research areas are artificial intelligence, computational intelligence and machine learning applications.How to cite this paper:Yomna M. Elbarawy, Neveen I. Ghali, Rania Salah El-Sayed, " Facial Expressions Recognition in Thermal Images based on Deep Learning Techniques", International Journal of Image, Graphics andSignal Processing(IJIGSP), Vol.11, No.10, pp. 1-7, 2019.DOI: 10.5815/ijigsp.2019.10.01。
RealTimeHandPoseEstimationusingDepthSensorsCemKeskin,FurkanKırac¸,YunusEmreKaraandLaleAkarunBo˘gazic¸iUniversityComputerEngineeringDepartment,34342,Istanbul,Turkeykeskinc@cmpe.boun.edu.tr,{kiracmus,yunus.kara,akarun}@boun.edu.tr
AbstractThispaperdescribesadepthimagebasedreal–timeskeletonfittingalgorithmforthehand,usinganobjectrecognitionbypartsapproach,andtheuseofthishandmodelerinanAmericanSignLanguage(ASL)digitrecog-nitionapplication.Inparticular,wecreatedarealistic3Dhandmodelthatrepresentsthehandwith21differentparts.Randomdecisionforests(RDF)aretrainedonsyn-theticdepthimagesgeneratedbyanimatingthehandmodel,whicharethenusedtoperformperpixelclassificationandassigneachpixeltoahandpart.Theclassificationresultsarefedintoalocalmodefindingalgorithmtoestimatethejointlocationsforthehandskeleton.Thesystemcanpro-cessdepthimagesretrievedfromKinectinreal–timeat30fps.Asanapplicationofthesystem,wealsodescribeasupportvectormachine(SVM)basedrecognitionmoduleforthetendigitsofASLbasedonourmethod,whichat-tainsarecognitionrateof99.9%onlivedepthimagesinreal–time1.
1.IntroductionAfterthereleaseofmulti–touchenabledsmartphonesandoperatingsystems,therehasbeenarenewedinterestinnaturalinterfacesandparticularlyinhandgestures.Handgesturesareusedinthesesystemstointeractwithprogramssuchasgames,browsers,e–mailreadersandadiversesetoftools.Visionbasedhandgesturerecognition,andpartic-ularlysignlanguagerecognitionhaveattractedtheinterestofresearchersformorethan20years.Yet,aframeworkthatrobustlydetectsthenakedhandandrecognizeshandposesandgesturesfromcoloredimageshascontinuedtobeelu-sive.Thiscanbeattributedmostlytothelargevarianceoftheretrievedimagescausedbychanginglightconditions,andtothedifficultyofdistinguishingthehandfromotherbodyparts.WiththereleaseofKinect[1],adepthsensor
1ThisworkhasbeensupportedbyresearchgrantsTubitak108E161
andBU-BAP09M101.
thatcanworkinabsolutedarkness,thehanddetectionandsegmentationprocessesareconsiderablysimplified.Thus,librariesforbasichandgesturerecognitiontaskshavebeendeveloped.However,theseonlyconsiderhandmovement,andnothandpose.Theestimationofthehandskeletoncon-figurationhaslargelyremainedunsolved.
Recently,Kinecthasbeenusedtoachievereal–timebodytrackingcapabilities,whichhastriggeredaneweraofnaturalinterfacebasedapplications.Intheirrevolutionarywork,Shottonetal.fitaskeletontothehumanbodyusingtheirobjectrecognitionbasedapproach[14].Theideaisapplicabletothehandposeestimationproblemaswell,buttherearesomenotabledifferencesbetweenthehumanbodyandhand:i)Theprojecteddepthimageofahandismuchsmallerthanthatofabody;ii)Abodycanbeassumedtobeuprightbutahandcantakeanyorientation;iii)Inthecaseofhands,thenumberofpossiblemeaningfulconfigurationsismuchhigherandtheproblemofselfocclusionissevere.Ontheotherhand,theinter–personalvarianceoftheshapeofhandsismuchsmallercomparedtothehugedifferencesbetweenfullyclothedhumanbodies.
MostapproachestohandposeestimationproblemmakeuseofregularRGBcameras.Eroletal.[7]dividetheposeestimationmethodsintotwomaingroupsintheirre-view:partialandfullposeestimationmethods.Theyfurtherdividethefullposeestimationmethodsintosingleframeposeestimationandmodel-basedtrackingmethods.Athit-sosetal.[2]estimate3Dhandposefromaclutteredimage.Theycreatealargedatabaseofsynthetichandposesusinganarticulatedmodelandfindtheclosestmatchfromthisdatabase.DeCamposandMurray[5]usearelevancevec-tormachine[19]basedlearningmethodforsingleframehandposerecovery.Theycombinemultipleviewstoover-cometheself-occlusionproblem.Theyalsoreportsingleandmultipleviewperformancesforbothsyntheticandrealimages.Rosalesetal.[13]usemonocularcolorsequencesforrecovering3Dhandposes.Theirsystemmapsimagefeaturesto3Dhandposesusingspecializedmappings.Ster-giopoulouandPapamarkos[16]fitaneuralnetworkintothedetectedhandregion.Theyrecognizethehandgestureus-
1
2011IEEEInternationalConferenceonComputerVisionWorkshops978-1-4673-0063-6/11/$26.00c2011IEEE1228ingthegridoftheproducedneurons.DeLaGorceetal.[6]usemodel-basedtrackingofthehandposeinmonocularvideos.Oikonomidisetal.[12]presentagenerativesinglehypothesismodel-basedposeestimationmethod.Theyuseparticleswarmoptimizationforsolvingthe3Dhandposerecoveryproblem.Stengeretal.[15]applymodel-basedtrackingusinganarticulatedhandmodelandestimatetheposewithanunscentedKalmanfilter.Anumberofapproacheshavebeenreportedtoestimatethehandposefromdepthimages.MoandNeumann[11]usealaser-basedcameratoproducelow-resolutiondepthimages.Theyinterpolatehandposeusingbasicsetsoffin-gerposesandinter-relations.MalassiotisandStrintzis[10]extractPCAfeaturesfromdepthimagesofsynthetic3Dhandmodelsfortraining.LiuandFujimura[9]recognizehandgesturesusingdepthimagesacquiredbyatime-of-flightcamera.TheauthorsdetecthandsbythresholdingthedepthdataanduseChamferdistancetomeasureshapesim-ilarity.Then,theyanalyzethetrajectoryofthehandandclassifygesturesusingshape,location,trajectory,orienta-tionandspeedfeatures.Suryanarayanetal.[18]usedepthinformationandrecognizescaleandrotationinvariantposesdynamically.Theyclassifysixsignaturehandposesusingavolumetricshapedescriptorwhichtheyformbyaugment-ing2Dimagedatawithdepthinformation.TheyuseSVMforclassification.Inthiswork,welargelyfollowtheapproachin[14].Adoptingtheideaofanintermediaterepresentationforthetrackedobject,wegeneratesynthetichandimagesandlabeltheirparts,suchthateachskeletonjointisatthecenterofoneofthelabeledparts.Weformlargedatasetscreatedfromrandomandmanuallysetskeletonparameters,andtrainseveralrandomizeddecisiontrees(RDT)[3],whicharethenusedtoclassifyeachpixeloftheretrieveddepthimage.Finally,weapplymeanshiftalgorithmtoestimatethejointcentersasin[14].Theresultingframeworkcanestimatethefullhandposesinrealtime.Asaproofofcon-cept,wedemonstratethesystembyusingittorecognizeAmericanSignLanguage(ASL)digits.InSection2wedescribethemethodologyusedforfittingtheskeleton.Section3liststhedetailsofconductedexper-imentsandpresentsourresultsonASLdigitrecognition.Finally,weconcludethepaperanddiscussfutureworkinSection4.2.MethodologyTheflowchartofthesystemcanbeviewedinFigure1.Ourframeworkhandlesautomaticgenerationandlabelingofsynthetictrainingimagesbymanuallysettingorran-domizingeachskeletonparameter.Itcanthenformlargedatasetsbyinterpolatingposesandperturbingjointsviaad-ditionofGaussiannoisetoeachjointanglewithoutviolat-ingskeletonconstraints.Multipledecisiontreesarethentrainedonseparatedatasets,whichformforeststhatboosttheperpixelclassificationaccuracyofthesystem.Finally,posteriorprobabilitiesofeachpixelarecombinedtoesti-matethe3Djointcoordinates,andthecorrespondingskele-tonisrendered.TheapplicationcanconnecttoKinectandperformskeletonfittinginreal–timewithoutexperiencingframedrops.