An Empirical Comparison of Supervised Learning Algorithms
- 格式:pdf
- 大小:157.04 KB
- 文档页数:8
Stat928:Statistical Learning Theory Lecture:1 Introduction and the Bias-Variance TradeoffInstructor:Sham Kakade1Goal of Statistical Learning TheoryThe goal of statistical learning theory is to study the statistical behavior of statistical machine learning algorithms,and understand their theoretical properties such as rate of convergence(upper bound),optimality(whether upper bound matches lower bound),computational efficiency,under different conditions.Some questions to address:This class focuses mostly on the analysis of supervised learning(prediction)algorithms.•Bias Variance•Linear Regression:fixed design(when X’s arefixed and Y’s are random);random design(when X’s and Y’s are random);feature selection(more dimensions than points);ridge regression•Classification•online learning–obtains points in a sequential manner–easy optimization algorithms•convex losses•PCA•Assume using L1regularization for feature selection.Under what conditions it can recover the correct feature set?•sharp analysis and lower bounds,where possibleSome of the tools that we will utilize are:•concentration of measure(central limit theorem;tail bounds)•empirical process theory•oracle inequalities•covering numbers(fundamental),and some Rademacher and VC tools•some martingale tools•(some)convex analysis•(some)random matrix analysis12Goal of Class and RequirementsGoals:1.understand theoretical analysis and basic techniques2.analysis of common algorithms3.ability to read theoretical papers4.basic theoretical analysis5.intuition for performance of algorithmsAssignments:1.occasional HWs2.reading papers with theoretical analysis3.project?3Example Supervised Learning ProblemsTwo basic paradigms we will focus on are regression and classification.3.1Linear Least Squares RegressionThe Input X is a p-dimensional real valued vector in R p.The output Y is a real-valued number(e.g.return of a particular stock).The function class C consists of linear functions,parameterized by linear weight(coefficient)vector w∈R p.That is,f w∈C as a linear function f w(x)=w·x.The quality measure L(f)=E(f(X)−Y)2is the squared error,under some distribution on X and Y.Empirical risk minimization is the least squares estimator:ˆw=1narg minw∈R pi(w X i−Y i)2,and the generalization error ofˆw isE X,Y(ˆw X−Y)2.3.2Binary Linear ClassificationThe Input X is a p-dimensional real valued vector in R p(e.g.,representing information of an email).The output Y is a binary-valued number(whether the email is a spam or not),assume the binary values are{−1,1}.The function class C consists of linear functions,parameterized by linear weight(coefficient)vector w∈R p.That is,f w∈C as a linear function f w(x)=w x.The quality measure is (f(x),y)=I(f(x)=y),where I(·)is the0-1valued indicator function,so that (f(x),y)=0if f(x)=y(prediction is correct),or (f(x),y)=1if f(x)=y(prediction is incorrect).This loss is called classification error loss.2Empirical risk minimization is the least squares estimator:ˆw=1narg minw∈R piI(w X i=Y i)and the generalization error ofˆw isL(f)=E X,Y I(w X=Y).4The Squared Error;Linear Regression;and Bias-VarianceThe(generalization)squared error of f:R p→R isL(f)=E X,Y(f(X)−Y)2.which we are interested in optimizing.Note that the Bayes optimal function is the conditional expectation.To see this,first observe:Lemma4.1.We have that:L(f)=E X(f(X)−E[Y|X])2+E X[VAR(Y|X)]Proof.First,note that:L(f)=E X,Y(f(X)−Y)2=E X,Y(f(X)−E[Y|X]+E[Y|X]−Y)2=E X,Y(f(X)−E[Y|X])2+E X,Y(f(X)−E[Y|X])(E[Y|X]−Y)+E X,Y(E[Y|X]−Y)2=E X,Y(f(X)−E[Y|X])2+E X((f(X)−E[Y|X])E Y(E[Y|X]−Y))+E X,Y(E[Y|X]−Y)2=E X,Y(f(X)−E[Y|X])2+0+E(E[Y|X]−Y)2=E(f(X)−E[Y|X])2+E[V AR(Y|X)](1) which completes the proof.Corollary4.2.The Bayes optimal predictor(that which minimizes the squared loss)is E[Y|X].Aside:Defining the conditional expectation is delicate issue in measure theory(involving the Radon-Nikodyn deriva-tive).From a functional analysis point of view,one can actually define the conditional expectation as any function f(x)which achieves the infimum loss.There are many such functions(though they may only disagree on sets of measure0)—all such functions are considered versions of the conditional expectation.The square loss is actually quite natural when dealing with Y∈{0,1}if we seek to model probabilities,which is what the following corollary observes.Corollary4.3.If Y∈{0,1},then the Bayes optimal predictor is the conditional probability P r(Y=1|X),since P r(Y=1|X)=E[Y|X].4.1Linear Least Squares Regression and the Error DecompositionWe are typically provided with some training set T of the form(X1,Y1),...(X n,Y n).The are two natural sampling processes for this set.3•Fixed Design:Here we consider X1to X n asfixed(e.g.not random variables).Our goal is to estimate the function E[Y|X i].This is sometimes called signal reconstruction.The loss considered uses the uniform distribution over these X i’s,e.g.:L(2)=1niE[(w X i−Y i)2|X i]•Random Design:Both X and Y are random.Letˆw T be the linear function constructed using the training set(we drop the T subscript,when clear from context). The following lemma characterizes the expected loss ofˆw TLemma4.4.Let w∗be the best linear predictor,e.g.w∗∈arg min L(w)Letˆw T be any estimator based on T.For any distribution over(X,Y),and any distribution over T,we have that:E T L(w T)=E X[VAR(Y|X)]+E X(E[Y|X]−E T[w T]·X)2+E X,T(E T[w T]·X−w T·X)2=E X[VAR(Y|X)]+E X(E[Y|X]−w∗·X)2+E X(w∗·X−E[w T]·X)2+E X,T(E[w T]·X−w T·X)2 =”noise variance+”approximation error of function class”+”estimation bias”+”estimation variance”(note we have made no assumptions about T).Proof.For thefirst equality,(using equation1)E T L(w T)=E[V AR(Y|X)]+E X,T(w T·X−E[Y|X])2The last term is equal to:E X,T(w T·X−E[Y|X])2=E X,T(w T·X−E[w T]·X+E[w T]·X−E[Y|X])2Now observe that:E X,T(w T·X−E[w T]·X)(E[w T]·X−E[Y|X])=E X(E T[w T·]X−E[w T]·X)(E[w T]·X−E[Y|X])=0Thefinal equation is a HW problem.Let us make the following observations:•thefirst term is referred to as the noise(note that the noise at a given X may depend on X,e.g.it may be heteroskedastic)•the second term(in the second equation)is referred to as the“bias”,which decomposes into two terms,the approximation error of the class and the bias of the algorithm4•thefinal term is the variance•note that in expectation the approximation error termRemember that our goal is tofindˆf that predicts well on unseen data(test data).However,we only observe prediction accuracy ofˆf on the training data.In order to obtain highly accurate classifier,we have to balance the following two aspects:•prediction rule shouldfit the training data well;that is,achieving small training error–requires a more expressive model.•performance of prediction rule on test data should match that on training data–requires a less expressive(more stable)model.There are various related theoretical concepts:training versus test error,bias variance trade-off,overfitting,model complexity,generalization performance,regularization.4.2Regret and RiskIt is often useful to compare to the best thing we could hope for in our class.In other words,we may be interested in:L(w T)−L(w∗)which is the regret.The risk is the expected value:E T(L(w T)−L(w∗))Note that:E T(L(w T)−L(w∗))=E X(w∗·X−E[w T]·X)2+E X,T(E[w T]·X−w T·X)2Note that the“approximation error”is not explicitly in the risk.5。

传统机器学习算法与深度学习在文本分类中的比较文本分类是自然语言处理中的一个重要问题,并得到了广泛的关注和研究。
传统机器学习算法和深度学习算法都在文本分类中扮演着重要的角色。
本文将从机器学习算法和深度学习算法的角度,对二者在文本分类中的比较进行分析。
一、传统机器学习算法在文本分类中的应用传统机器学习算法在文本分类中的应用主要包括朴素贝叶斯、支持向量机、决策树和随机森林等。
这些算法在文本分类中表现出了不错的性能。
(一)朴素贝叶斯算法朴素贝叶斯算法最初用于垃圾邮件识别,效果非常好。
朴素贝叶斯算法是基于贝叶斯定理的一种算法,它假设特征之间是相互独立的,因此称为“朴素”贝叶斯算法。
在文本分类中,我们可以将每个文档看作是一个词语的集合,对每个词语计算它在各类别中的概率,然后利用贝叶斯定理计算出每个类别下文档的概率,选取概率最大的类别作为文档的分类结果。
朴素贝叶斯算法的优点是模型简单,计算速度快,在小样本下表现不错。
但是它的假设过于简单,因此在面对词汇在不同类别中的分布差距较大时,效果会受到影响。
(二)支持向量机支持向量机是一种常见的机器学习算法,在文本分类中也表现出了非常好的性能。
支持向量机通过找到数据的最优分类超平面来进行分类,使得分类结果的边界与数据点之间的距离最大化。
在文本分类中,我们可以先将文本转化为词向量,然后构建出特征空间,通过支持向量机进行分类。
支持向量机的优点是具有很好的鲁棒性和泛化能力,可以处理高维稀疏数据。
在处理文本分类问题时,它也能够在高维空间中找到一个合适的超平面完成分类任务。
但是支持向量机的计算成本较高,对参数的选取也较为敏感。
(三)决策树决策树是一种基于树形结构的机器学习算法,在文本分类中也得到了广泛的应用。
决策树通过对样本特征进行划分,采用自上而下的递归方式生成分类决策树。
在文本分类中,我们可以将每个单词看作是一个特征,根据其在文本中的出现情况进行划分,建立文本分类决策树,进行分类。

监督学习与无监督学习算法比较研究机器学习已经成为当今科技领域的一个重要分支,其中监督学习和无监督学习算法被广泛应用于数据挖掘、自然语言处理、计算机视觉等领域。
本文将从算法概念、应用场景、优缺点以及性能等方面对监督学习和无监督学习进行比较研究。
1. 算法概念监督学习是一种机器学习方法,其通过已知的输入和输出数据对模型进行训练,将输入数据映射到输出数据。
监督学习算法可以分为分类和回归两种类型,其中分类算法将输入数据分为多个离散的类别,而回归算法则是对输出数据进行连续性预测。
常见的监督学习算法包括K近邻算法、朴素贝叶斯算法、决策树算法、支持向量机算法等。
无监督学习则是一种无需已知输出数据的机器学习方法,它通过对未标注的数据进行聚类、降维等操作以提取数据之间的内在结构。
无监督学习算法常见的包括k-means、自编码器、主成分分析等。
2. 应用场景监督学习算法广泛应用于各个领域,其中在计算机视觉领域,分类算法被广泛应用于目标检测、图像识别等任务中。
以目标检测为例,监督学习算法可以通过训练数据对目标的位置进行定位,从而实现对图像中物体的准确检测。
而无监督学习算法则常被应用于数据挖掘、推荐系统等领域。
比如,在推荐系统中,无监督学习可以通过对用户行为进行聚类,从而识别出相似的用户,进而为这些用户提供更加个性化的推荐内容。
3. 优缺点比较监督学习算法通常需要大量标注好的数据进行训练,而很多场景下,这些标注好的数据很难获得或者代价很高。
而无监督学习算法则可以使用大量的未标注数据进行训练,降低了数据标注的代价。
此外,无监督学习算法可以发现数据内在的结构和模式,从而帮助挖掘数据中的信息。
然而,监督学习算法在面对新的数据时表现更好,因为它通过已知输出数据与新数据进行比对,从而实现对新数据的分类或回归预测。
而无监督学习算法则不能对新的数据进行分类,因为它没有这些数据的标签信息。
4. 性能比较监督学习算法在处理高维度的数据时通常效果更好,另外,监督学习算法相对来说计算速度较快。

介绍常见的监督学习算法及其应用场景监督学习是机器学习的一个重要分支,它通过使用有标记的训练数据集来建立预测模型。
在监督学习中,算法试图学习输入数据和对应的输出标签之间的关系,从而能够对新的、未标记的数据进行准确的预测。
在本文中,我们将介绍几种常见的监督学习算法及其应用场景。
1. 决策树算法决策树是一种基于树状结构的监督学习算法,它通过一系列的判断节点来对输入数据进行分类或回归。
决策树算法能够处理具有多个特征的数据集,并且在解释性和可解释性方面有优势。
它在分类问题和回归问题中都有广泛的应用,例如垃圾邮件过滤、疾病诊断和金融市场预测等。
2. K近邻算法K近邻算法是一种基于实例的监督学习算法,它通过计算新数据点与已知数据点之间的距离来进行分类或回归。
K近邻算法的原理是假设相似的数据具有相似的标签。
该算法适用于样本空间非线性可分的问题,并且对于异常值也具有较好的鲁棒性。
K近邻算法在手写数字识别、图像分类和推荐系统中常被使用。
3. 朴素贝叶斯算法朴素贝叶斯算法是一种基于贝叶斯定理和特征条件独立性假设的监督学习算法。
该算法通过学习训练数据中特征与标签之间的概率关系来进行分类。
朴素贝叶斯算法具有计算简单、速度快的优势,并且对于高维数据集表现良好。
它常被用于文本分类、垃圾邮件过滤和情感分析等应用场景。
4. 支持向量机算法支持向量机(SVM)算法是一种二分类模型,它通过找到一个最优的超平面来进行分类。
SVM算法具有良好的泛化能力,能够有效地处理高维空间和非线性可分数据。
它在图像分类、文本分类和生物信息学等领域有广泛应用。
5. 随机森林算法随机森林算法是一种集成学习方法,该算法通过构建多个决策树来进行分类或回归,并通过投票或平均预测结果来决定最终的输出。
随机森林算法具有较好的鲁棒性和预测能力,并且能够处理高维数据和大量特征。
它在金融风控、医学诊断和股票市场预测等领域广泛使用。
在实际应用中,选择适合的监督学习算法取决于数据集的特征、问题的类型和性能需求。

监督学习与无监督学习在深度学习中的比较研究第一章:引言在深度学习中,监督学习和无监督学习是两种常用的学习方法。
监督学习使用带有标签的训练数据来训练模型,而无监督学习则在没有标签的情况下学习数据的结构和特征。
本文将比较监督学习和无监督学习在深度学习中的优势和局限性,旨在帮助读者更好地理解这两种学习方法。
第二章:监督学习2.1 监督学习概述监督学习是一种常见的机器学习方法,通过使用带有标签的训练数据来训练模型,从而预测新的未标记数据的标签。
监督学习的关键是从训练数据中学习到输入特征和输出标签之间的映射关系,以便在未知数据上进行准确的预测。
2.2 监督学习的优点监督学习具有以下优点:(1)准确性高:监督学习可以通过训练过程中的标签信息进行精确的预测,通常能够提供相对高的准确性。
(2)能够解释预测结果:由于监督学习使用标签进行训练,因此可以解释预测结果是基于哪些特征或规则进行的。
2.3 监督学习的局限性监督学习也存在一些局限性:(1)依赖标签:监督学习需要大量的标签数据来进行训练,而获取标签数据往往需要耗费大量的人力和时间。
(2)过拟合风险:当训练数据过小或训练模型过于复杂时,监督学习容易出现过拟合问题,导致在未知数据上的泛化性能下降。
第三章:无监督学习3.1 无监督学习概述无监督学习是一种无需标签的机器学习方法,旨在通过学习数据的内在结构和特征来发现隐藏的模式和规律。
与监督学习不同,无监督学习从未标记的数据中学习,不需要先验知识。
3.2 无监督学习的优点无监督学习具有以下优点:(1)不依赖标签:无监督学习不需要标签信息,因此可以更好地应用于缺乏标签数据的情况下。
(2)数据驱动:无监督学习可以发现数据自身的结构和规律,无需依赖先验知识。
3.3 无监督学习的局限性无监督学习也存在一些局限性:(1)难以评估结果:由于没有标签进行评价,因此很难对无监督学习的结果进行客观评估。
(2)结果多样性:无监督学习可能得到多个不同的结果,而且每个结果都可能是正确的,这给结果的选择和应用带来挑战。
常用英语词汇 -andrew Ng课程average firing rate均匀激活率intensity强度average sum-of-squares error均方差Regression回归backpropagation后向流传Loss function损失函数basis 基non-convex非凸函数basis feature vectors特点基向量neural network神经网络batch gradient ascent批量梯度上涨法supervised learning监察学习Bayesian regularization method贝叶斯规则化方法regression problem回归问题办理的是连续的问题Bernoulli random variable伯努利随机变量classification problem分类问题bias term偏置项discreet value失散值binary classfication二元分类support vector machines支持向量机class labels种类标记learning theory学习理论concatenation级联learning algorithms学习算法conjugate gradient共轭梯度unsupervised learning无监察学习contiguous groups联通地区gradient descent梯度降落convex optimization software凸优化软件linear regression线性回归convolution卷积Neural Network神经网络cost function代价函数gradient descent梯度降落covariance matrix协方差矩阵normal equations DC component直流重量linear algebra线性代数decorrelation去有关superscript上标degeneracy退化exponentiation指数demensionality reduction降维training set训练会合derivative导函数training example训练样本diagonal对角线hypothesis假定,用来表示学习算法的输出diffusion of gradients梯度的弥散LMS algorithm “least mean squares最小二乘法算eigenvalue特点值法eigenvector特点向量batch gradient descent批量梯度降落error term残差constantly gradient descent随机梯度降落feature matrix特点矩阵iterative algorithm迭代算法feature standardization特点标准化partial derivative偏导数feedforward architectures前馈构造算法contour等高线feedforward neural network前馈神经网络quadratic function二元函数feedforward pass前馈传导locally weighted regression局部加权回归fine-tuned微调underfitting欠拟合first-order feature一阶特点overfitting过拟合forward pass前向传导non-parametric learning algorithms无参数学习算forward propagation前向流传法Gaussian prior高斯先验概率parametric learning algorithm参数学习算法generative model生成模型activation激活值gradient descent梯度降落activation function激活函数Greedy layer-wise training逐层贪心训练方法additive noise加性噪声grouping matrix分组矩阵autoencoder自编码器Hadamard product阿达马乘积Autoencoders自编码算法Hessian matrix Hessian矩阵hidden layer隐含层hidden units隐蔽神经元Hierarchical grouping层次型分组higher-order features更高阶特点highly non-convex optimization problem高度非凸的优化问题histogram直方图hyperbolic tangent双曲正切函数hypothesis估值,假定identity activation function恒等激励函数IID 独立同散布illumination照明inactive克制independent component analysis独立成份剖析input domains输入域input layer输入层intensity亮度/灰度intercept term截距KL divergence相对熵KL divergence KL分别度k-Means K-均值learning rate学习速率least squares最小二乘法linear correspondence线性响应linear superposition线性叠加line-search algorithm线搜寻算法local mean subtraction局部均值消减local optima局部最优解logistic regression逻辑回归loss function损失函数low-pass filtering低通滤波magnitude幅值MAP 极大后验预计maximum likelihood estimation极大似然预计mean 均匀值MFCC Mel 倒频系数multi-class classification多元分类neural networks神经网络neuron 神经元Newton’s method牛顿法non-convex function非凸函数non-linear feature非线性特点norm 范式norm bounded有界范数norm constrained范数拘束normalization归一化numerical roundoff errors数值舍入偏差numerically checking数值查验numerically reliable数值计算上稳固object detection物体检测objective function目标函数off-by-one error缺位错误orthogonalization正交化output layer输出层overall cost function整体代价函数over-complete basis超齐备基over-fitting过拟合parts of objects目标的零件part-whole decompostion部分-整体分解PCA 主元剖析penalty term处罚因子per-example mean subtraction逐样本均值消减pooling池化pretrain预训练principal components analysis主成份剖析quadratic constraints二次拘束RBMs 受限 Boltzman 机reconstruction based models鉴于重构的模型reconstruction cost重修代价reconstruction term重构项redundant冗余reflection matrix反射矩阵regularization正则化regularization term正则化项rescaling缩放robust 鲁棒性run 行程second-order feature二阶特点sigmoid activation function S型激励函数significant digits有效数字singular value奇怪值singular vector奇怪向量smoothed L1 penalty光滑的L1 范数处罚Smoothed topographic L1 sparsity penalty光滑地形L1 稀少处罚函数smoothing光滑Softmax Regresson Softmax回归sorted in decreasing order降序摆列source features源特点Adversarial Networks抗衡网络sparse autoencoder消减归一化Affine Layer仿射层Sparsity稀少性Affinity matrix亲和矩阵sparsity parameter稀少性参数Agent 代理 /智能体sparsity penalty稀少处罚Algorithm 算法square function平方函数Alpha- beta pruningα - β剪枝squared-error方差Anomaly detection异样检测stationary安稳性(不变性)Approximation近似stationary stochastic process安稳随机过程Area Under ROC Curve/ AUC Roc 曲线下边积step-size步长值Artificial General Intelligence/AGI通用人工智supervised learning监察学习能symmetric positive semi-definite matrix Artificial Intelligence/AI人工智能对称半正定矩阵Association analysis关系剖析symmetry breaking对称无效Attention mechanism注意力体制tanh function双曲正切函数Attribute conditional independence assumptionthe average activation均匀活跃度属性条件独立性假定the derivative checking method梯度考证方法Attribute space属性空间the empirical distribution经验散布函数Attribute value属性值the energy function能量函数Autoencoder自编码器the Lagrange dual拉格朗日对偶函数Automatic speech recognition自动语音辨别the log likelihood对数似然函数Automatic summarization自动纲要the pixel intensity value像素灰度值Average gradient均匀梯度the rate of convergence收敛速度Average-Pooling均匀池化topographic cost term拓扑代价项Backpropagation Through Time经过时间的反向流传topographic ordered拓扑次序Backpropagation/BP反向流传transformation变换Base learner基学习器translation invariant平移不变性Base learning algorithm基学习算法trivial answer平庸解Batch Normalization/BN批量归一化under-complete basis不齐备基Bayes decision rule贝叶斯判断准则unrolling组合扩展Bayes Model Averaging/ BMA 贝叶斯模型均匀unsupervised learning无监察学习Bayes optimal classifier贝叶斯最优分类器variance 方差Bayesian decision theory贝叶斯决议论vecotrized implementation向量化实现Bayesian network贝叶斯网络vectorization矢量化Between-class scatter matrix类间散度矩阵visual cortex视觉皮层Bias 偏置 /偏差weight decay权重衰减Bias-variance decomposition偏差 - 方差分解weighted average加权均匀值Bias-Variance Dilemma偏差–方差窘境whitening白化Bi-directional Long-Short Term Memory/Bi-LSTMzero-mean均值为零双向长短期记忆Accumulated error backpropagation积累偏差逆传Binary classification二分类播Binomial test二项查验Activation Function激活函数Bi-partition二分法Adaptive Resonance Theory/ART自适应谐振理论Boltzmann machine玻尔兹曼机Addictive model加性学习Bootstrap sampling自助采样法/可重复采样Bootstrapping自助法Break-Event Point/ BEP 均衡点Calibration校准Cascade-Correlation级联有关Categorical attribute失散属性Class-conditional probability类条件概率Classification and regression tree/CART分类与回归树Classifier分类器Class-imbalance类型不均衡Closed -form闭式Cluster簇/ 类/ 集群Cluster analysis聚类剖析Clustering聚类Clustering ensemble聚类集成Co-adapting共适应Coding matrix编码矩阵COLT 国际学习理论会议Committee-based learning鉴于委员会的学习Competitive learning竞争型学习Component learner组件学习器Comprehensibility可解说性Computation Cost计算成本Computational Linguistics计算语言学Computer vision计算机视觉Concept drift观点漂移Concept Learning System /CLS观点学习系统Conditional entropy条件熵Conditional mutual information条件互信息Conditional Probability Table/ CPT 条件概率表Conditional random field/CRF条件随机场Conditional risk条件风险Confidence置信度Confusion matrix混杂矩阵Connection weight连结权Connectionism 连结主义Consistency一致性/相合性Contingency table列联表Continuous attribute连续属性Convergence收敛Conversational agent会话智能体Convex quadratic programming凸二次规划Convexity凸性Convolutional neural network/CNN卷积神经网络Co-occurrence同现Correlation coefficient有关系数Cosine similarity余弦相像度Cost curve成本曲线Cost Function成本函数Cost matrix成本矩阵Cost-sensitive成本敏感Cross entropy交错熵Cross validation交错考证Crowdsourcing众包Curse of dimensionality维数灾害Cut point截断点Cutting plane algorithm割平面法Data mining数据发掘Data set数据集Decision Boundary决议界限Decision stump决议树桩Decision tree决议树/判断树Deduction演绎Deep Belief Network深度信念网络Deep Convolutional Generative Adversarial NetworkDCGAN深度卷积生成抗衡网络Deep learning深度学习Deep neural network/DNN深度神经网络Deep Q-Learning深度Q 学习Deep Q-Network深度Q 网络Density estimation密度预计Density-based clustering密度聚类Differentiable neural computer可微分神经计算机Dimensionality reduction algorithm降维算法Directed edge有向边Disagreement measure不合胸怀Discriminative model鉴别模型Discriminator鉴别器Distance measure距离胸怀Distance metric learning距离胸怀学习Distribution散布Divergence散度Diversity measure多样性胸怀/差别性胸怀Domain adaption领域自适应Downsampling下采样D-separation( Directed separation)有向分别Dual problem对偶问题Dummy node 哑结点General Problem Solving通用问题求解Dynamic Fusion 动向交融Generalization泛化Dynamic programming动向规划Generalization error泛化偏差Eigenvalue decomposition特点值分解Generalization error bound泛化偏差上界Embedding 嵌入Generalized Lagrange function广义拉格朗日函数Emotional analysis情绪剖析Generalized linear model广义线性模型Empirical conditional entropy经验条件熵Generalized Rayleigh quotient广义瑞利商Empirical entropy经验熵Generative Adversarial Networks/GAN生成抗衡网Empirical error经验偏差络Empirical risk经验风险Generative Model生成模型End-to-End 端到端Generator生成器Energy-based model鉴于能量的模型Genetic Algorithm/GA遗传算法Ensemble learning集成学习Gibbs sampling吉布斯采样Ensemble pruning集成修剪Gini index基尼指数Error Correcting Output Codes/ ECOC纠错输出码Global minimum全局最小Error rate错误率Global Optimization全局优化Error-ambiguity decomposition偏差 - 分歧分解Gradient boosting梯度提高Euclidean distance欧氏距离Gradient Descent梯度降落Evolutionary computation演化计算Graph theory图论Expectation-Maximization希望最大化Ground-truth实情/真切Expected loss希望损失Hard margin硬间隔Exploding Gradient Problem梯度爆炸问题Hard voting硬投票Exponential loss function指数损失函数Harmonic mean 调解均匀Extreme Learning Machine/ELM超限学习机Hesse matrix海塞矩阵Factorization因子分解Hidden dynamic model隐动向模型False negative假负类Hidden layer隐蔽层False positive假正类Hidden Markov Model/HMM 隐马尔可夫模型False Positive Rate/FPR假正例率Hierarchical clustering层次聚类Feature engineering特点工程Hilbert space希尔伯特空间Feature selection特点选择Hinge loss function合页损失函数Feature vector特点向量Hold-out 留出法Featured Learning特点学习Homogeneous 同质Feedforward Neural Networks/FNN前馈神经网络Hybrid computing混杂计算Fine-tuning微调Hyperparameter超参数Flipping output翻转法Hypothesis假定Fluctuation震荡Hypothesis test假定考证Forward stagewise algorithm前向分步算法ICML 国际机器学习会议Frequentist频次主义学派Improved iterative scaling/IIS改良的迭代尺度法Full-rank matrix满秩矩阵Incremental learning增量学习Functional neuron功能神经元Independent and identically distributed/独Gain ratio增益率立同散布Game theory博弈论Independent Component Analysis/ICA独立成分剖析Gaussian kernel function高斯核函数Indicator function指示函数Gaussian Mixture Model高斯混杂模型Individual learner个体学习器Induction归纳Inductive bias归纳偏好Inductive learning归纳学习Inductive Logic Programming/ ILP归纳逻辑程序设计Information entropy信息熵Information gain信息增益Input layer输入层Insensitive loss不敏感损失Inter-cluster similarity簇间相像度International Conference for Machine Learning/ICML国际机器学习大会Intra-cluster similarity簇内相像度Intrinsic value固有值Isometric Mapping/Isomap等胸怀映照Isotonic regression平分回归Iterative Dichotomiser迭代二分器Kernel method核方法Kernel trick核技巧Kernelized Linear Discriminant Analysis/KLDA核线性鉴别剖析K-fold cross validation k折交错考证/k 倍交错考证K-Means Clustering K–均值聚类K-Nearest Neighbours Algorithm/KNN K近邻算法Knowledge base 知识库Knowledge Representation知识表征Label space标记空间Lagrange duality拉格朗日对偶性Lagrange multiplier拉格朗日乘子Laplace smoothing拉普拉斯光滑Laplacian correction拉普拉斯修正Latent Dirichlet Allocation隐狄利克雷散布Latent semantic analysis潜伏语义剖析Latent variable隐变量Lazy learning懒散学习Learner学习器Learning by analogy类比学习Learning rate学习率Learning Vector Quantization/LVQ学习向量量化Least squares regression tree最小二乘回归树Leave-One-Out/LOO留一法linear chain conditional random field线性链条件随机场Linear Discriminant Analysis/ LDA 线性鉴别剖析Linear model线性模型Linear Regression线性回归Link function联系函数Local Markov property局部马尔可夫性Local minimum局部最小Log likelihood对数似然Log odds/ logit对数几率Logistic Regression Logistic回归Log-likelihood对数似然Log-linear regression对数线性回归Long-Short Term Memory/LSTM 长短期记忆Loss function损失函数Machine translation/MT机器翻译Macron-P宏查准率Macron-R宏查全率Majority voting绝对多半投票法Manifold assumption流形假定Manifold learning流形学习Margin theory间隔理论Marginal distribution边沿散布Marginal independence边沿独立性Marginalization边沿化Markov Chain Monte Carlo/MCMC马尔可夫链蒙特卡罗方法Markov Random Field马尔可夫随机场Maximal clique最大团Maximum Likelihood Estimation/MLE极大似然预计/极大似然法Maximum margin最大间隔Maximum weighted spanning tree最大带权生成树Max-Pooling 最大池化Mean squared error均方偏差Meta-learner元学习器Metric learning胸怀学习Micro-P微查准率Micro-R微查全率Minimal Description Length/MDL最小描绘长度Minimax game极小极大博弈Misclassification cost误分类成本Mixture of experts混杂专家Momentum 动量Moral graph道德图/正直图Multi-class classification多分类Multi-document summarization多文档纲要One shot learning一次性学习Multi-layer feedforward neural networks One-Dependent Estimator/ ODE 独依靠预计多层前馈神经网络On-Policy在策略Multilayer Perceptron/MLP多层感知器Ordinal attribute有序属性Multimodal learning多模态学习Out-of-bag estimate包外预计Multiple Dimensional Scaling多维缩放Output layer输出层Multiple linear regression多元线性回归Output smearing输出调制法Multi-response Linear Regression/ MLR Overfitting过拟合/过配多响应线性回归Oversampling 过采样Mutual information互信息Paired t-test成对 t查验Naive bayes 朴实贝叶斯Pairwise 成对型Naive Bayes Classifier朴实贝叶斯分类器Pairwise Markov property成对马尔可夫性Named entity recognition命名实体辨别Parameter参数Nash equilibrium纳什均衡Parameter estimation参数预计Natural language generation/NLG自然语言生成Parameter tuning调参Natural language processing自然语言办理Parse tree分析树Negative class负类Particle Swarm Optimization/PSO粒子群优化算法Negative correlation负有关法Part-of-speech tagging词性标明Negative Log Likelihood负对数似然Perceptron感知机Neighbourhood Component Analysis/NCA Performance measure性能胸怀近邻成分剖析Plug and Play Generative Network即插即用生成网Neural Machine Translation神经机器翻译络Neural Turing Machine神经图灵机Plurality voting相对多半投票法Newton method牛顿法Polarity detection极性检测NIPS 国际神经信息办理系统会议Polynomial kernel function多项式核函数No Free Lunch Theorem/ NFL 没有免费的午饭定理Pooling池化Noise-contrastive estimation噪音对照预计Positive class正类Nominal attribute列名属性Positive definite matrix正定矩阵Non-convex optimization非凸优化Post-hoc test后续查验Nonlinear model非线性模型Post-pruning后剪枝Non-metric distance非胸怀距离potential function势函数Non-negative matrix factorization非负矩阵分解Precision查准率/正确率Non-ordinal attribute无序属性Prepruning 预剪枝Non-Saturating Game非饱和博弈Principal component analysis/PCA主成分剖析Norm 范数Principle of multiple explanations多释原则Normalization归一化Prior 先验Nuclear norm核范数Probability Graphical Model概率图模型Numerical attribute数值属性Proximal Gradient Descent/PGD近端梯度降落Letter O Pruning剪枝Objective function目标函数Pseudo-label伪标记Oblique decision tree斜决议树Quantized Neural Network量子化神经网络Occam’s razor奥卡姆剃刀Quantum computer 量子计算机Odds 几率Quantum Computing量子计算Off-Policy离策略Quasi Newton method拟牛顿法Radial Basis Function/ RBF 径向基函数Random Forest Algorithm随机丛林算法Random walk随机闲步Recall 查全率/召回率Receiver Operating Characteristic/ROC受试者工作特点Rectified Linear Unit/ReLU线性修正单元Recurrent Neural Network循环神经网络Recursive neural network递归神经网络Reference model 参照模型Regression回归Regularization正则化Reinforcement learning/RL加强学习Representation learning表征学习Representer theorem表示定理reproducing kernel Hilbert space/RKHS重生核希尔伯特空间Re-sampling重采样法Rescaling再缩放Residual Mapping残差映照Residual Network残差网络Restricted Boltzmann Machine/RBM受限玻尔兹曼机Restricted Isometry Property/RIP限制等距性Re-weighting重赋权法Robustness稳重性 / 鲁棒性Root node根结点Rule Engine规则引擎Rule learning规则学习Saddle point鞍点Sample space样本空间Sampling采样Score function评分函数Self-Driving自动驾驶Self-Organizing Map/ SOM自组织映照Semi-naive Bayes classifiers半朴实贝叶斯分类器Semi-Supervised Learning半监察学习semi-Supervised Support Vector Machine半监察支持向量机Sentiment analysis感情剖析Separating hyperplane分别超平面Sigmoid function Sigmoid函数Similarity measure相像度胸怀Simulated annealing模拟退火Simultaneous localization and mapping同步定位与地图建立Singular Value Decomposition奇怪值分解Slack variables废弛变量Smoothing光滑Soft margin软间隔Soft margin maximization软间隔最大化Soft voting软投票Sparse representation稀少表征Sparsity稀少性Specialization特化Spectral Clustering谱聚类Speech Recognition语音辨别Splitting variable切分变量Squashing function挤压函数Stability-plasticity dilemma可塑性 - 稳固性窘境Statistical learning统计学习Status feature function状态特点函Stochastic gradient descent随机梯度降落Stratified sampling分层采样Structural risk构造风险Structural risk minimization/SRM构造风险最小化Subspace子空间Supervised learning监察学习/有导师学习support vector expansion支持向量展式Support Vector Machine/SVM支持向量机Surrogat loss代替损失Surrogate function代替函数Symbolic learning符号学习Symbolism符号主义Synset同义词集T-Distribution Stochastic Neighbour Embeddingt-SNE T–散布随机近邻嵌入Tensor 张量Tensor Processing Units/TPU张量办理单元The least square method最小二乘法Threshold阈值Threshold logic unit阈值逻辑单元Threshold-moving阈值挪动Time Step时间步骤Tokenization标记化Training error训练偏差Training instance训练示例/训练例Transductive learning直推学习Transfer learning迁徙学习Treebank树库algebra线性代数Tria-by-error试错法asymptotically无症状的True negative真负类appropriate适合的True positive真切类bias 偏差True Positive Rate/TPR真切例率brevity简洁,简洁;短暂Turing Machine图灵机[800 ] broader宽泛Twice-learning二次学习briefly简洁的Underfitting欠拟合/欠配batch 批量Undersampling欠采样convergence收敛,集中到一点Understandability可理解性convex凸的Unequal cost非均等代价contours轮廓Unit-step function单位阶跃函数constraint拘束Univariate decision tree单变量决议树constant常理Unsupervised learning无监察学习/无导师学习commercial商务的Unsupervised layer-wise training无监察逐层训练complementarity增补Upsampling上采样coordinate ascent同样级上涨Vanishing Gradient Problem梯度消逝问题clipping剪下物;剪报;修剪Variational inference变分推测component重量;零件VC Theory VC维理论continuous连续的Version space版本空间covariance协方差Viterbi algorithm维特比算法canonical正规的,正则的Von Neumann architecture冯· 诺伊曼架构concave非凸的Wasserstein GAN/WGAN Wasserstein生成抗衡网络corresponds相切合;相当;通讯Weak learner弱学习器corollary推论Weight权重concrete详细的事物,实在的东西Weight sharing权共享cross validation交错考证Weighted voting加权投票法correlation互相关系Within-class scatter matrix类内散度矩阵convention商定Word embedding词嵌入cluster一簇Word sense disambiguation词义消歧centroids质心,形心Zero-data learning零数据学习converge收敛Zero-shot learning零次学习computationally计算(机)的approximations近似值calculus计算arbitrary任意的derive获取,获得affine仿射的dual 二元的arbitrary任意的duality二元性;二象性;对偶性amino acid氨基酸derivation求导;获取;发源amenable 经得起查验的denote预示,表示,是的标记;意味着,[逻]指称axiom 公义,原则divergence散度;发散性abstract提取dimension尺度,规格;维数architecture架构,系统构造;建筑业dot 小圆点absolute绝对的distortion变形arsenal军械库density概率密度函数assignment分派discrete失散的人工智能词汇discriminative有辨别能力的indicator指示物,指示器diagonal对角interative重复的,迭代的dispersion分别,散开integral积分determinant决定要素identical相等的;完整同样的disjoint不订交的indicate表示,指出encounter碰到invariance不变性,恒定性ellipses椭圆impose把强加于equality等式intermediate中间的extra 额外的interpretation解说,翻译empirical经验;察看joint distribution结合概率ennmerate例举,计数lieu 代替exceed超出,越出logarithmic对数的,用对数表示的expectation希望latent潜伏的efficient奏效的Leave-one-out cross validation留一法交错考证endow 给予magnitude巨大explicitly清楚的mapping 画图,制图;映照exponential family指数家族matrix矩阵equivalently等价的mutual互相的,共同的feasible可行的monotonically单一的forary首次试试minor较小的,次要的finite有限的,限制的multinomial多项的forgo 摒弃,放弃multi-class classification二分类问题fliter过滤nasty厌烦的frequentist最常发生的notation标记,说明forward search前向式搜寻na?ve 朴实的formalize使定形obtain获取generalized归纳的oscillate摇动generalization归纳,归纳;广泛化;判断(依据不optimization problem最优化问题足)objective function目标函数guarantee保证;抵押品optimal最理想的generate形成,产生orthogonal(矢量,矩阵等 ) 正交的geometric margins几何界限orientation方向gap 裂口ordinary一般的generative生产的;有生产力的occasionally有时的heuristic启迪式的;启迪法;启迪程序partial derivative偏导数hone 怀恋;磨property性质hyperplane超平面proportional成比率的initial最先的primal原始的,最先的implement履行permit同意intuitive凭直觉获知的pseudocode 伪代码incremental增添的permissible可同意的intercept截距polynomial多项式intuitious直觉preliminary预备instantiation例子precision精度人工智能词汇perturbation不安,搅乱theorem定理poist 假定,假想tangent正弦positive semi-definite半正定的unit-length vector单位向量parentheses圆括号valid 有效的,正确的posterior probability后验概率variance方差plementarity增补variable变量;变元pictorially图像的vocabulary 词汇parameterize确立的参数valued经估价的;可贵的poisson distribution柏松散布wrapper 包装pertinent有关的总计 1038 词汇quadratic二次的quantity量,数目;重量query 疑问的regularization使系统化;调整reoptimize从头优化restrict限制;限制;拘束reminiscent回想旧事的;提示的;令人联想的( of )remark 注意random variable随机变量respect考虑respectively各自的;分其他redundant过多的;冗余的susceptible敏感的stochastic可能的;随机的symmetric对称的sophisticated复杂的spurious假的;假造的subtract减去;减法器simultaneously同时发生地;同步地suffice知足scarce罕有的,难得的split分解,分别subset子集statistic统计量successive iteratious连续的迭代scale标度sort of有几分的squares 平方trajectory轨迹temporarily临时的terminology专用名词tolerance容忍;公差thumb翻阅threshold阈,临界。

深度学习与传统机器学习算法的对比分析深度学习和传统机器学习算法是两种在人工智能领域中广泛应用的方法。
虽然它们都旨在从数据中提取模式和关联,但在算法原理、应用场景和性能方面存在显著差异。
本文将对深度学习和传统机器学习算法进行对比分析。
一、算法原理1. 传统机器学习算法传统机器学习算法是基于特征工程的方法。
它从给定的输入特征中学习模式和规律,并通过构建复杂的数学模型来预测和分类数据。
常见的传统机器学习算法包括朴素贝叶斯、决策树、支持向量机等。
这些算法依赖于手动选择和提取特征,需要领域专家的经验和知识。
2. 深度学习算法深度学习算法是一种基于神经网络的方法。
它借鉴了人脑神经元的结构和功能,在多个神经网络层之间传递和处理数据。
与传统机器学习算法不同,深度学习算法能够自动从原始数据中学习特征和规律,无需手动进行特征工程。
常见的深度学习算法有卷积神经网络(CNN)、循环神经网络(RNN)和长短期记忆网络(LSTM)等。
二、应用场景1. 传统机器学习算法传统机器学习算法广泛应用于文本分类、图像识别和推荐系统等领域。
在这些应用场景下,传统机器学习算法能够有效地处理结构化和半结构化的数据,并提供准确的预测和分类结果。
2. 深度学习算法深度学习算法在计算机视觉、自然语言处理和语音识别等领域取得了突破性的成果。
它能够处理大规模的非结构化数据,并从中提取高级的抽象特征。
深度学习算法在图像识别、语音合成和机器翻译等任务中的性能超过了传统机器学习算法。
三、性能比较1. 数据需求传统机器学习算法对输入数据的质量和特征工程较为敏感。
需要人工进行特征选择和处理,以提高算法性能。
而深度学习算法可以通过更多的原始数据,无需人工特征工程进行训练,但对数据量的要求较高。
2. 算法复杂度传统机器学习算法的计算复杂度通常较低,适合处理中小规模数据。
而深度学习算法的计算复杂度较高,特别是在训练大规模神经网络时,需要大量的计算资源和时间。
3. 鲁棒性传统机器学习算法对噪声和异常值较为敏感,容易产生过拟合或欠拟合的问题。

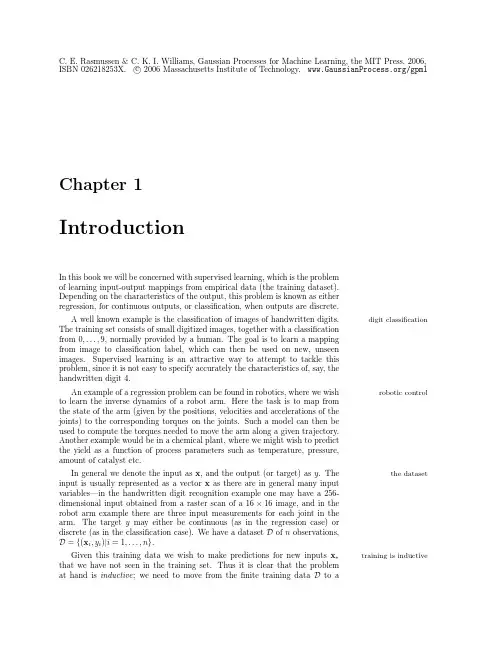
ISBN026218253X.c 2006Massachusetts Institute of /gpmlChapter1IntroductionIn this book we will be concerned with supervised learning,which is the problemof learning input-output mappings from empirical data(the training dataset).Depending on the characteristics of the output,this problem is known as eitherregression,for continuous outputs,or classification,when outputs are discrete.A well known example is the classification of images of handwritten digits.digit classification The training set consists of small digitized images,together with a classificationfrom0,...,9,normally provided by a human.The goal is to learn a mappingfrom image to classification label,which can then be used on new,unseenimages.Supervised learning is an attractive way to attempt to tackle thisproblem,since it is not easy to specify accurately the characteristics of,say,thehandwritten digit4.An example of a regression problem can be found in robotics,where we wish robotic control to learn the inverse dynamics of a robot arm.Here the task is to map fromthe state of the arm(given by the positions,velocities and accelerations of thejoints)to the corresponding torques on the joints.Such a model can then beused to compute the torques needed to move the arm along a given trajectory.Another example would be in a chemical plant,where we might wish to predictthe yield as a function of process parameters such as temperature,pressure,amount of catalyst etc.In general we denote the input as x,and the output(or target)as y.The the dataset input is usually represented as a vector x as there are in general many inputvariables—in the handwritten digit recognition example one may have a256-dimensional input obtained from a raster scan of a16×16image,and in therobot arm example there are three input measurements for each joint in thearm.The target y may either be continuous(as in the regression case)ordiscrete(as in the classification case).We have a dataset D of n observations,D={(x i,y i)|i=1,...,n}.Given this training data we wish to make predictions for new inputs x∗training is inductive that we have not seen in the training set.Thus it is clear that the problemat hand is inductive;we need to move from thefinite training data D to aISBN026218253X.c 2006Massachusetts Institute of /gpml 2Introduction function f that makes predictions for all possible input values.To do this wemust make assumptions about the characteristics of the underlying function,as otherwise any function which is consistent with the training data would beequally valid.A wide variety of methods have been proposed to deal with thesupervised learning problem;here we describe two common approaches.The two approachesfirst is to restrict the class of functions that we consider,for example by onlyconsidering linear functions of the input.The second approach is(speakingrather loosely)to give a prior probability to every possible function,wherehigher probabilities are given to functions that we consider to be more likely,forexample because they are smoother than other functions.1Thefirst approachhas an obvious problem in that we have to decide upon the richness of the classof functions considered;if we are using a model based on a certain class offunctions(e.g.linear functions)and the target function is not well modelled bythis class,then the predictions will be poor.One may be tempted to increase theflexibility of the class of functions,but this runs into the danger of overfitting,where we can obtain a goodfit to the training data,but perform badly whenmaking test predictions.The second approach appears to have a serious problem,in that surely there are an uncountably infinite set of possible functions,and how are wegoing to compute with this set infinite time?This is where the Gaussian Gaussian processprocess comes to our rescue.A Gaussian process is a generalization of theGaussian probability distribution.Whereas a probability distribution describesrandom variables which are scalars or vectors(for multivariate distributions),a stochastic process governs the properties of functions.Leaving mathematicalsophistication aside,one can loosely think of a function as a very long vector,each entry in the vector specifying the function value f(x)at a particular inputx.It turns out,that although this idea is a little na¨ıve,it is surprisingly closewhat we need.Indeed,the question of how we deal computationally with theseinfinite dimensional objects has the most pleasant resolution imaginable:if youask only for the properties of the function at afinite number of points,theninference in the Gaussian process will give you the same answer if you ignore theinfinitely many other points,as if you would have taken them all into account!And these answers are consistent with answers to any otherfinite queries you consistencymay have.One of the main attractions of the Gaussian process framework isprecisely that it unites a sophisticated and consistent view with computational tractabilitytractability.It should come as no surprise that these ideas have been around for some time,although they are perhaps not as well known as they might be.Indeed,many models that are commonly employed in both machine learning and statis-tics are in fact special cases of,or restricted kinds of Gaussian processes.In thisvolume,we aim to give a systematic and unified treatment of the area,showingconnections to related models.1These two approaches may be regarded as imposing a restriction bias and a preference bias respectively;see e.g.Mitchell[1997].ISBN026218253X.c 2006Massachusetts Institute of /gpml 1.1A Pictorial Introduction to Bayesian Modelling3(a),prior(b),posteriorFigure1.1:Panel(a)shows four samples drawn from the prior distribution.Panel(b)shows the situation after two datapoints have been observed.The mean predictionis shown as the solid line and four samples from the posterior are shown as dashedlines.In both plots the shaded region denotes twice the standard deviation at eachinput value x.1.1A Pictorial Introduction to Bayesian Mod-ellingIn this section we give graphical illustrations of how the second(Bayesian)method works on some simple regression and classification examples.Wefirst consider a simple1-d regression problem,mapping from an input regression x to an output f(x).In Figure1.1(a)we show a number of sample functionsdrawn at random from the prior distribution over functions specified by a par-random functions ticular Gaussian process which favours smooth functions.This prior is takento represent our prior beliefs over the kinds of functions we expect to observe,before seeing any data.In the absence of knowledge to the contrary we haveassumed that the average value over the sample functions at each x is zero.mean function Although the specific random functions drawn in Figure1.1(a)do not have amean of zero,the mean of f(x)values for anyfixed x would become zero,in-dependent of x as we kept on drawing more functions.At any value of x wecan also characterize the variability of the sample functions by computing the pointwise variance variance at that point.The shaded region denotes twice the pointwise standarddeviation;in this case we used a Gaussian process which specifies that the priorvariance does not depend on x.Suppose that we are then given a dataset D={(x1,y1),(x2,y2)}consist-functions that agreewith observations ing of two observations,and we wish now to only consider functions that passthough these two data points exactly.(It is also possible to give higher pref-erence to functions that merely pass“close”to the datapoints.)This situationis illustrated in Figure1.1(b).The dashed lines show sample functions whichare consistent with D,and the solid line depicts the mean value of such func-tions.Notice how the uncertainty is reduced close to the observations.Thecombination of the prior and the data leads to the posterior distribution over posterior over functions functions.ISBN026218253X.c 2006Massachusetts Institute of /gpml 4IntroductionIf more datapoints were added one would see the mean function adjust itself to pass through these points,and that the posterior uncertainty would reduceclose to the observations.Notice,that since the Gaussian process is not aparametric model,we do not have to worry about whether it is possible for the non-parametricmodel tofit the data(as would be the case if e.g.you tried a linear model onstrongly non-linear data).Even when a lot of observations have been added,there may still be someflexibility left in the functions.One way to imagine thereduction offlexibility in the distribution of functions as the data arrives is todraw many random functions from the prior,and reject the ones which do notagree with the observations.While this is a perfectly valid way to do inference, inferenceit is impractical for most purposes—the exact analytical computations requiredto quantify these properties will be detailed in the next chapter.The specification of the prior is important,because itfixes the properties of prior specificationthe functions considered for inference.Above we briefly touched on the meanand pointwise variance of the functions.However,other characteristics can alsobe specified and manipulated.Note that the functions in Figure1.1(a)aresmooth and stationary(informally,stationarity means that the functions looksimilar at all x locations).These are properties which are induced by the co-variance function of the Gaussian process;many other covariance functions are covariance functionpossible.Suppose,that for a particular application,we think that the functionsin Figure1.1(a)vary too rapidly(i.e.that their characteristic length-scale istoo short).Slower variation is achieved by simply adjusting parameters of thecovariance function.The problem of learning in Gaussian processes is exactlythe problem offinding suitable properties for the covariance function.Note,that this gives us a model of the data,and characteristics(such a smoothness, modelling andinterpreting characteristic length-scale,etc.)which we can interpret.We now turn to the classification case,and consider the binary(or two-classificationclass)classification problem.An example of this is classifying objects detectedin astronomical sky surveys into stars or galaxies.Our data has the label+1forstars and−1for galaxies,and our task will be to predictπ(x),the probabilitythat an example with input vector x is a star,using as inputs some featuresthat describe each object.Obviouslyπ(x)should lie in the interval[0,1].AGaussian process prior over functions does not restrict the output to lie in thisinterval,as can be seen from Figure1.1(a).The approach that we shall adoptis to squash the prior function f pointwise through a response function which squashing functionrestricts the output to lie in[0,1].A common choice for this function is thelogistic functionλ(z)=(1+exp(−z))−1,illustrated in Figure1.2(b).Thus theprior over f induces a prior over probabilistic classificationsπ.This set up is illustrated in Figure1.2for a2-d input space.In panel(a)we see a sample drawn from the prior over functions f which is squashedthrough the logistic function(panel(b)).A dataset is shown in panel(c),wherethe white and black circles denote classes+1and−1respectively.As in theregression case the effect of the data is to downweight in the posterior thosefunctions that are incompatible with the data.A contour plot of the posteriormean forπ(x)is shown in panel(d).In this example we have chosen a shortcharacteristic length-scale for the process so that it can vary fairly rapidly;inISBN026218253X.c 2006Massachusetts Institute of /gpml1.2Roadmap5(d)Figure1.2:Panel(a)shows a sample from prior distribution on f in a2-d input space.Panel(b)is a plot of the logistic functionλ(z).Panel(c)shows the location of the data points,where the open circles denote the class label+1,and closed circles denote the class label−1.Panel(d)shows a contour plot of the mean predictive probability as a function of x;the decision boundaries between the two classes are shown by the thicker lines.this case notice that all of the training points are correctly classified,including the two“outliers”in the NE and SW corners.By choosing a different length-scale we can change this behaviour,as illustrated in section3.7.1.1.2RoadmapThe book has a natural split into two parts,with the chapters up to and includ-ing chapter5covering core material,and the remaining chapters covering the connections to other methods,fast approximations,and more specialized prop-erties.Some sections are marked by an asterisk.These sections may be omitted on afirst reading,and are not pre-requisites for later(un-starred)material.ISBN026218253X.c 2006Massachusetts Institute of /gpml 6IntroductionChapter2contains the definition of Gaussian processes,in particular for the regressionuse in regression.It also discusses the computations needed to make predic-tions for regression.Under the assumption of Gaussian observation noise thecomputations needed to make predictions are tractable and are dominated bythe inversion of a n×n matrix.In a short experimental section,the Gaussianprocess model is applied to a robotics task.Chapter3considers the classification problem for both binary and multi-classificationclass cases.The use of a non-linear response function means that exact compu-tation of the predictions is no longer possible analytically.We discuss a numberof approximation schemes,include detailed algorithms for their implementationand discuss some experimental comparisons.As discussed above,the key factor that controls the properties of a Gaussian covariance functionsprocess is the covariance function.Much of the work on machine learning so far,has used a very limited set of covariance functions,possibly limiting the powerof the resulting models.In chapter4we discuss a number of valid covariancefunctions and their properties and provide some guidelines on how to combinecovariance functions into new ones,tailored to specific needs.Many covariance functions have adjustable parameters,such as the char-learningacteristic length-scale and variance illustrated in Figure1.1.Chapter5de-scribes how such parameters can be inferred or learned from the data,based oneither Bayesian methods(using the marginal likelihood)or methods of cross-validation.Explicit algorithms are provided for some schemes,and some simplepractical examples are demonstrated.Gaussian process predictors are an example of a class of methods known as connectionskernel machines;they are distinguished by the probabilistic viewpoint taken.In chapter6we discuss other kernel machines such as support vector machines(SVMs),splines,least-squares classifiers and relevance vector machines(RVMs),and their relationships to Gaussian process prediction.In chapter7we discuss a number of more theoretical issues relating to theoryGaussian process methods including asymptotic analysis,average-case learningcurves and the PAC-Bayesian framework.One issue with Gaussian process prediction methods is that their basic com-fast approximationsplexity is O(n3),due to the inversion of a n×n matrix.For large datasets this isprohibitive(in both time and space)and so a number of approximation methodshave been developed,as described in chapter8.The main focus of the book is on the core supervised learning problems of regression and classification.In chapter9we discuss some rather less standardsettings that GPs have been used in,and complete the main part of the bookwith some conclusions.Appendix A gives some mathematical background,while Appendix B deals specifically with Gaussian Markov processes.Appendix C gives details of howto access the data and programs that were used to make the some of thefiguresand run the experiments described in the book.。

监督学习的举例监督学习是机器学习的一种方法,它是基于一组已知的数据,以此来学习如何正确地完成新任务的过程。
监督学习可以帮助机器学习将抽象的数据转化为解决实际问题的解决方案。
它是机器学习最常用的应用之一,也是构建机器学习系统的基础。
监督学习的主要目的是让计算机能够预测某些结果。
它通过分析已知的输入和输出来学习一种将输入映射到输出的模式,所以它也被称为“模式识别”或“关联分析”。
监督学习主要分为监督学习和半监督学习两大类,它们之间的主要区别在于,监督学习中的数据是带有标签的,而半监督学习中的数据是未标记的。
常用的监督学习算法包括K近邻算法(KNN)、决策树(DT)、朴素贝叶斯(NB)算法和支持向量机(SVM)算法等。
K近邻算法是一种基于实例的监督学习技术,它将新实例与已知类别的实例进行比较,根据最邻近的多个实例,来预测新实例的类别。
决策树是一种概率最大化的分类算法,它可以自动的构建一棵决策树,从根节点开始构建决策分支,并逐层深入,从每个决策分支可以流向不同类别的叶子节点,从而进行分类区分。
朴素贝叶斯算法是一种简单有效的监督学习算法,它是基于贝叶斯概率理论进行分类的算法。
朴素贝叶斯算法假设每个特征之间是相互独立的,即不考虑特征之间的相互联系,从而使得参数估计的复杂度得以降低。
此外,朴素贝叶斯算法的模型采用的是最大似然估计的方法,可以有效的应对数据缺失的情况,做出准确的分类。
支持向量机(SVM)是一种非常经典的机器学习算法,用于二分类以及多分类任务。
它的核心思想是,使用支持向量空间将训练数据最大化的分类,使其被正确分配到正确的类别中。
支持向量机可以计算出一个非常高维度的空间,来分析这些数据,从而精确的抓取最相关的特征和数据,可以提高模型的准确度,提高决策准确率。
监督学习在实际应用中被广泛使用,非常重要。
例如,它可以用于智能汽车的自动驾驶,通过分析大量图像数据,使智能汽车能够自动识别路面标志、交通灯以及障碍物,从而使智能汽车更安全的行驶。

监督学习与无监督学习算法比较研究在机器学习领域,监督学习和无监督学习是两种广泛应用的算法,它们可以用于各种不同的任务,例如分类、聚类和推荐系统等。
本文将对监督学习和无监督学习算法进行比较研究,探究它们的优缺点以及适用场景。
一、监督学习算法监督学习算法是一种基于已有标记数据进行的机器学习方法,其目的是预测未标记数据的输出。
这种方法需要训练数据集来建立模型,然后使用该模型对新数据进行预测。
在监督学习中,需要将数据集划分为训练集和测试集,其中训练集用于构建模型,测试集用于检验模型的性能。
监督学习的优点是能够快速、准确地进行预测,同时还能够判断模型的误差和准确性。
监督学习算法比较常用的有决策树、神经网络、支持向量机等。
二、无监督学习算法相比监督学习,无监督学习算法不需要事先标记数据,而是通过数据本身的内在结构得到信息。
例如,在聚类任务中,无监督学习算法通过对数据进行聚类,来发现数据集中的规律和模式。
在降维任务中,无监督学习算法通过降低数据维度来发现数据的特征。
无监督学习算法的优点在于能够处理大量的未标记数据,发现数据集中的隐藏信息和内在结构,同时可以提前发现数据中的异常值。
无监督学习算法比较常用的有k-means聚类、PCA降维等。
三、监督学习和无监督学习的比较在实际应用中,监督学习和无监督学习算法都有各自的优点和缺点。
一方面,监督学习算法能够进行快速、准确的预测,适用于需要有标签数据进行预测的场景。
但是,在处理大规模、高维数据集时,监督学习算法有时会出现过拟合或欠拟合的问题,影响模型的预测性能。
另一方面,无监督学习算法能够处理大量未标记数据,发现数据集中的隐藏信息和内在结构,适用于需要发现数据集中的异常值或隐含规律的场景。
但是,因为无监督学习算法没有明确的目标函数和标准,难以评估它的准确性和效率,同时需要预先设定聚类/降维的数目,一旦设置不当会导致结果不准确。
四、结论总的来说,监督学习和无监督学习算法都有各自适用的场景。
Computer Science and Application 计算机科学与应用, 2023, 13(3), 433-443 Published Online March 2023 in Hans. https:///journal/csa https:///10.12677/csa.2023.133041多任务对比学习的自监督视频表达单东风,于 磊,骆文杰,熊思璇,刘家仁,吴克伟合肥工业大学计算机与信息学院,安徽 合肥收稿日期:2023年2月16日;录用日期:2023年3月17日;发布日期:2023年3月28日摘要现有的自监督学习使用单一的空间或时间代理任务。
单一的代理任务,从未标记的数据中提供单一的监督信号,不足以描述视频表示学习的空间特征和时间特征之间的差异。
在本文中,我们提出了一个多任务对比学习方法,它通过对多个时空代理任务的对比学习,在时空自注意力的情况下学习有区别的时空特征。
不同的空间代理任务学习不同的空间特征,包括空间旋转和空间拼图。
不同的时间代理任务学习不同的时间特征,包括时间顺序和时间节奏。
我们将视频表示为每个代理任务的多个不同特征,并设计基于代理任务的对比损失来分离一个视频中学习的空间特征和时间特征。
基于代理任务的对比损失鼓励不同代理任务学习不同的特征,同一代理任务学习相似的特征,可以学习到同一视频中每个代理任务的判别特征。
实验表明,在UCF-101数据集和HMDB-51数据集的行为识别上优于现有的自监督学习方法。
关键词自监督,空间特征,时间特征,多任务对比学习方法,时空自注意力Multitask Contrastive Learning for Self-Supervised Video RepresentationDongfeng Shan, Lei Yu, Wenjie Luo, Sixuan Xiong, Jiaren Liu, Kewei WuSchool of Computer Science and Information Engineering, Hefei University of Technology, Hefei AnhuiReceived: Feb. 16th , 2023; accepted: Mar. 17th , 2023; published: Mar. 28th, 2023AbstractMost existing self-supervised works use a single spatial or temporal pretext task. A single pretext task, providing single supervision from unlabeled data, is insufficient to describe the difference between spatial features and temporal features for video representation learning. In this paper, we propose an attentive spatiotemporal contrastive learning network, which learns discrimina-单东风等tive spatial-temporal features with self-attention by contrastive learning between multiple spa-tial and temporal pretext tasks. Different spatial features are learned by multiple spatial pretext tasks, including spatial rotation, and spatial jigsaw. Different temporal features are learned by mul-tiple temporal pretext tasks, including temporal order, and temporal pace. We represent video as multiple different features for each pretext task, and design pretext task-based contrastive loss to separate the spatial feature and the temporal feature learned in one video. The pretext task-based contrastive loss encourages the different pretext tasks to learn dissimilar features and the same pretext task to learn similar features, which can learn the discriminative features for each pretext task in one video. Experiments show that it outperforms existing self-supervised learning methods for behavior recognition on the UCF-101 dataset and the HMDB-51 dataset.KeywordsSelf-Supervised, Spatial Feature, Temporal Feature, Multitask Contrastive Learning Method,Spatiotemporal Self-Attention Array Copyright © 2023 by author(s) and Hans Publishers Inc.This work is licensed under the Creative Commons Attribution International License (CC BY 4.0)./licenses/by/4.0/1. 引言视频表达的自监督学习可以从未标记的数据中提取时空特征,不仅减少了昂贵的手工标注需求,而且可以为下游的有监督任务学习到泛化能力很强的视频表达,因此在视频分析应用中具有很大的必要性。
监督学习方法的比较和分析监督学习是机器学习中最常见也是应用最广泛的方法之一。
它的核心思想就是通过已有的数据集来训练模型,从而使模型能够对未知数据做出正确的预测。
和其他机器学习方法相比,监督学习具有易于实现、预测准确度高等优点。
然而,不同的监督学习方法可能会在不同的任务和数据集上带来显著的区别。
因此,本文将对几种常见的监督学习方法进行比较和分析。
1. 决策树决策树是一种用于分类和回归的监督学习方法。
它可以将数据集划分成不同的子集,直到每个子集只包含同一种类别或者达到预定的停止条件。
决策树的优点在于易于理解和解释,同时它可以处理数值和分类特征,并且不需要太多的数据预处理。
但是,由于决策树的分裂方式过于简单,容易出现过拟合的现象。
此外,决策树对噪声和异常值也比较敏感。
2. 支持向量机支持向量机是一种常用于分类和回归的监督学习方法。
它的核心是寻找一个可以将不同类别数据分开的超平面。
支持向量机的优点在于能够处理线性和非线性数据,并且通过核函数的使用,它能够将低维数据映射到高维空间。
但是,支持向量机的运算比较复杂,模型训练时间较长。
同时,支持向量机对于噪声和异常值也比较敏感。
3. 朴素贝叶斯朴素贝叶斯是一种常见的分类方法。
它的核心思想是基于贝叶斯定理,通过观察先验概率和条件概率来确定后验概率。
朴素贝叶斯的优点在于简单快速,并且对于大规模数据集有很好的可扩展性。
此外,朴素贝叶斯对于噪声数据的影响较小。
但是,由于它假设特征之间是彼此独立的,所以在处理不相关特征的时候可能会出现糟糕的效果。
4. K近邻K近邻是一种常用于分类和回归的监督学习方法。
它的核心思想是将新数据分类为与其最近的K个训练数据的大多数类别。
K近邻的优点在于模型简单易懂,并且能够适应复杂的数据集。
此外,K近邻还可以处理离散和连续型数据。
但是,由于需要计算每个数据和所有训练样本间的距离,所以K近邻的算法复杂度很高。
5. 神经网络神经网络是一种基于生物神经元工作原理的多层感知器模型。
supervised contrastive learning公式讲解监督对比学习(Supervised Contrastive Learning)是一种通过对比正负样本对来学习特征表示的方法。
其核心思想是让模型学习将正样本对映射到相近的距离,而将负样本对映射到较远的距离。
在监督对比学习中,通常有两个encoder,一个用于对输入样本进行编码,另一个用于对正负样本对进行编码。
编码器通常采用深度神经网络,如ResNet等。
以下是监督对比学习的损失函数的一般形式:
L=L_pos+λL_neg
其中,L_pos是正样本对的损失函数,L_neg是负样本对的损失函数,λ是正则化项,用于平衡正负样本对的损失。
对于正样本对,通常采用对比损失(Contrastive Loss)或三元损失(Triplet Loss)等。
这些损失函数鼓励模型将正样本对映射到相近的距离。
对于负样本对,可以采用不同的方式来定义损失函数。
一种常见的方法是采用分类损失(Classification Loss),将负样本对看作是正样本的对立类别,并使用交叉熵损失等分类损失函数来计算损失。
在训练过程中,监督对比学习通过最小化损失函数来更新模型参数,使得模型能够更好地区分正负样本对。
同时,为了提高模型的泛化能力,通常还会采用一些正则化技术,如Dropout、
权重衰减等。
总之,监督对比学习是一种通过对比正负样本对来学习特征表示的方法,它能够提高模型的区分能力和泛化能力。
supervised learning regression 例子
【原创实用版】
目录
1.简介
2.监督学习回归的例子
3.监督学习回归的应用
4.结论
正文
1.简介
监督学习是一种机器学习方法,它使用标记数据来开发预测模型。
在监督学习中,算法使用标记数据来学习如何预测新数据的类别或值。
回归是一种监督学习方法,它使用标记数据来预测连续值。
2.监督学习回归的例子
假设我们有一组房屋销售数据,包括房屋面积、价格和其他特征。
我们想要建立一个模型,根据房屋面积预测销售价格。
这就是一个监督学习回归的例子。
在这个例子中,我们的输入(特征)是房屋面积,输出(目标)是销售价格。
我们的目标是建立一个模型,根据输入预测输出。
为了实现这个目标,我们需要使用一些算法来训练模型,比如线性回归、决策树回归或支持向量机回归等。
3.监督学习回归的应用
监督学习回归被广泛应用于各种领域,包括金融、医疗、市场营销和社会科学等。
以下是一些具体的应用:
- 金融:根据历史数据预测股票价格或汇率。
- 医疗:根据患者的特征数据预测疾病的概率。
- 市场营销:根据客户的消费行为预测其购买意愿。
- 社会科学:根据人口统计数据预测选举结果等。
4.结论
监督学习回归是一种重要的机器学习方法,它可以帮助我们根据已知数据预测未知数据。
在实际应用中,我们需要根据具体的问题选择合适的算法,并进行模型评估和优化。
AnEmpiricalComparisonofSupervisedLearningAlgorithmsRichCaruanacaruana@cs.cornell.eduAlexandruNiculescu-Mizilalexn@cs.cornell.eduDepartmentofComputerScience,CornellUniversity,Ithaca,NY14853USA
AbstractAnumberofsupervisedlearningmethodshavebeenintroducedinthelastdecade.Un-fortunately,thelastcomprehensiveempiri-calevaluationofsupervisedlearningwastheStatlogProjectintheearly90’s.Wepresentalarge-scaleempiricalcomparisonbetweentensupervisedlearningmethods:SVMs,neuralnets,logisticregression,naivebayes,memory-basedlearning,randomforests,de-cisiontrees,baggedtrees,boostedtrees,andboostedstumps.WealsoexaminetheeffectthatcalibratingthemodelsviaPlattScalingandIsotonicRegressionhasontheirperfor-mance.Animportantaspectofourstudyistheuseofavarietyofperformancecriteriatoevaluatethelearningmethods.
1.IntroductionTherearefewcomprehensiveempiricalstudiescom-paringlearningalgorithms.STATLOGisperhapsthebestknownstudy(Kingetal.,1995).STATLOGwasverycomprehensivewhenitwasperformed,butsincethennewlearningalgorithmshaveemerged(e.g.,bag-ging,boosting,SVMs,randomforests)thathaveexcel-lentperformance.Anextensiveempiricalevaluationofmodernlearningmethodswouldbeuseful.
Learningalgorithmsarenowusedinmanydomains,anddifferentperformancemetricsareappropriateforeachdomain.ForexamplePrecision/Recallmeasuresareusedininformationretrieval;medicineprefersROCarea;Liftisappropriateforsomemarketingtasks,etc.Thedifferentperformancemetricsmeasuredifferenttradeoffsinthepredictionsmadebyaclas-sifier,anditispossibleforlearningmethodstoper-formwellononemetric,butbesuboptimalonothermetrics.Becauseofthisitisimportanttoevaluatealgorithmsonabroadsetofperformancemetrics.
AppearinginProceedingsofthe23rdInternationalCon-ferenceonMachineLearning,Pittsburgh,PA,2006.Copy-right2006bytheauthor(s)/owner(s).
Thispaperpresentsresultsofalarge-scaleempiricalcomparisonoftensupervisedlearningalgorithmsus-ingeightperformancecriteria.Weevaluatetheperfor-manceofSVMs,neuralnets,logisticregression,naivebayes,memory-basedlearning,randomforests,deci-siontrees,baggedtrees,boostedtrees,andboostedstumpsonelevenbinaryclassificationproblemsusingavarietyofperformancemetrics:accuracy,F-score,Lift,ROCArea,averageprecision,precision/recallbreak-evenpoint,squarederror,andcross-entropy.Foreachalgorithmweexaminecommonvariations,andthoroughlyexplorethespaceofparameters.Forexample,wecomparetendecisiontreestyles,neuralnetsofmanysizes,SVMswithmanykernels,etc.
Becausesomeoftheperformancemetricsweexamineinterpretmodelpredictionsasprobabilitiesandmod-elssuchasSVMsarenotdesignedtopredictprobabil-ities,wecomparetheperformanceofeachalgorithmbothbeforeandaftercalibratingitspredictionswithPlattScalingandIsotonicRegression.
Theempiricalresultsaresurprising.Topreview:priortocalibration,baggedtrees,randomforests,andneu-ralnetsgivethebestaverageperformanceacrossalleightmetricsandeleventestproblems.Boostedtrees,however,arebestifwerestrictattentiontothesixmetricsthatdonotrequireprobabilities.Aftercal-ibrationwithPlatt’sMethod,boostedtreespredictbetterprobabilitiesthanallothermethodsandmoveintofirstplaceoverall.Neuralnets,ontheotherhand,aresowellcalibratedtobeginwiththattheyarehurtslightlybycalibration.AftercalibrationwithPlatt’sMethodorIsotonicRegression,SVMsperformcompa-rablytoneuralnetsandnearlyaswellasboostedtrees,randomforestsandbaggedtrees.Boostingfulldeci-siontreesdramaticallyoutperformsboostingweakerstumpsonmostproblems.Onaverage,memory-basedlearning,boostedstumps,singledecisiontrees,logisticregression,andnaivebayesarenotcompetitivewiththebestmethods.Thesegeneralizations,however,donotalwayshold.Forexample,boostedstumpsandlogisticregression,whichperformpoorlyonaverage,arethebestmodelsforsomemetricsontwoofthetestproblems.
161AnEmpiricalComparisonofSupervisedLearningAlgorithms2.Methodology2.1.LearningAlgorithmsWeattempttoexplorethespaceofparametersandcommonvariationsforeachlearningalgorithmasthor-oughlyasiscomputationallyfeasible.Thissectionsummarizestheparametersusedforeachlearningal-gorithm,andmaysafelybeskippedbyreaderswhoareeasilybored.
SVMs:weusethefollowingkernelsinSVMLight(Joachims,1999):linear,polynomialdegree2&3,ra-dialwithwidth{0.001,0.005,0.01,0.05,0.1,0.5,1,2}.Wealsovarytheregularizationparameterbyfactorsoftenfrom10−7to103witheachkernel.
ANNwetrainneuralnetswithgradientdescentbackpropandvarythenumberofhiddenunits{1,2,4,8,32,128}andthemomentum{0,0.2,0.5,0.9}.Wehalttrainingthenetsatmanydifferentepochsandusevalidationsetstoselectthebestnets.