Charpy impact tests on composite structures – An experimental
- 格式:pdf
- 大小:1.41 MB
- 文档页数:10
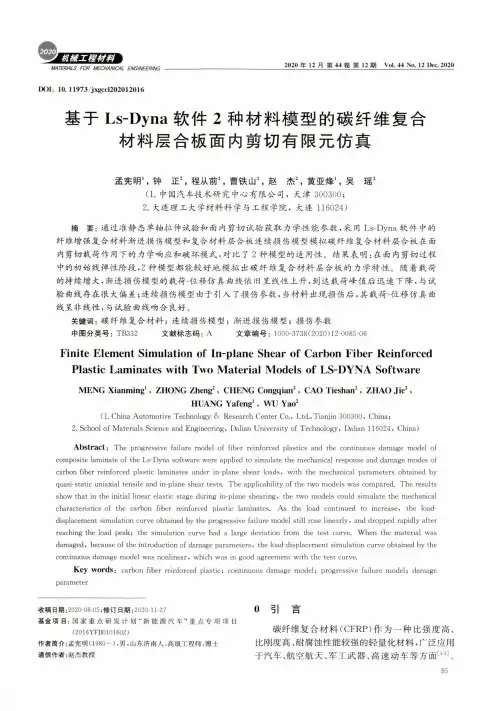
2020年12月第44卷第12期Vol.J4No.12Dec.202() MATERIALS FOR MECHANICAL ENGINEERINGDOI:10.11973/jxgccl202012016基于Ls-Dyna软件2种材料模型的碳纤维复合材料层合板面内剪切有限元仿真孟宪明',钟正S程从前2,曹铁山S赵杰2,黄亚烽-吴瑶2(1.中国汽车技术研究中心有限公司,天津300300;2.大连理工大学材料科学与工程学院,大连116024)摘要:通过准静态单轴拉伸试验和面内剪切试验获取力学性能参数,采用Ls-Dyna软件中的纤维增强复合材料渐进损伤模型和复合材料层合板连续损伤模型模拟碳纤维复合材料层合板在面内剪切载荷作用下的力学响应和破坏模式,对比了2种模型的适用性。
结果表明:在面内剪切过程中的初始线弹性阶段,2种模型都能较好地模拟出碳纤维复合材料层合板的力学特性。
随着载荷的持续增大,渐进损伤模型的载荷-位移仿真曲线依旧呈线性上升,到达载荷峰值后迅速下降,与试验曲线存在很大偏差;连续损伤模型由于引入了损伤参数,当材料出现损伤后.其载荷-位移仿真曲线呈非线性,与试验曲线吻合良好。
关键词:碳纤维复合材料;连续损伤模型;渐进损伤模型;损伤参数中图分类号:TB332文献标志码:A文章编号:1000-3738(2020)12-0085-06Finite Element Simulation of In-plane Shear of Carbon Fiber ReinforcedPlastic Laminates with Two Material Models of LS-DYNA SoftwareMENG Xianming1.ZHONG Zheng2.CHENG Congqian2,CAO Tieshan2.ZHAO Jie2,HUANG Yafeng*,WU Yao2(1.China Automotive Technology&Research Center Co.,Ltd.,Tianjin300300,China;2.School of Materials Science and Engineering,Dalian University of Technology»Dalian116024,China)Abstract:The progressive failure model of fiber reinforced plastics and the continuous damage model of composite laminate of the Ls-Dyna software were applied to simulate the mechanical response and damage modes of carbon fiber reinforced plastic laminates under in-plane shear loads,with the mechanical parameters obtained by quasi-static uniaxial tensile and in-plane shear tests.The applicability of the two models was compared.The results show that in the initial linear elastic stage during in-plane shearing,the two models could simulate the mechanical characteristics of the carbon fiber r&nforced plastic laminates.As the load continued to increase,the loaddisplacement simulation curve obtained by the progressive failure model still rose linearly,and dropped rapidly after reaching the load peak;the simulation curve had a large deviation from the test curve.When the material was damaged,because of the introduction of damage parameters,the load-displacement simulation curve obtained by the continuous damage model was nonlinear,which was in good agreement with the test curve.Key words:carbon fiber reinforced plastic;continuous damage model;progressive failure model;damage parameter收稿日期:2020-08-05;修订日期:2020-11-27基金项目:国家重点研发计划“新能源汽车”重点专项项目(2O16YFBO1O16O2)作者简介:孟宪明(1980—),男,山东济南人,高级工程师•博士通信作者:赵杰教授0引言碳纤维复合材料(CFRP)作为一种比强度高、比刚度高、耐腐蚀性能较强的轻量化材料,广泛应用于汽车、航空航天、军工武器、高速动车等方面口切。
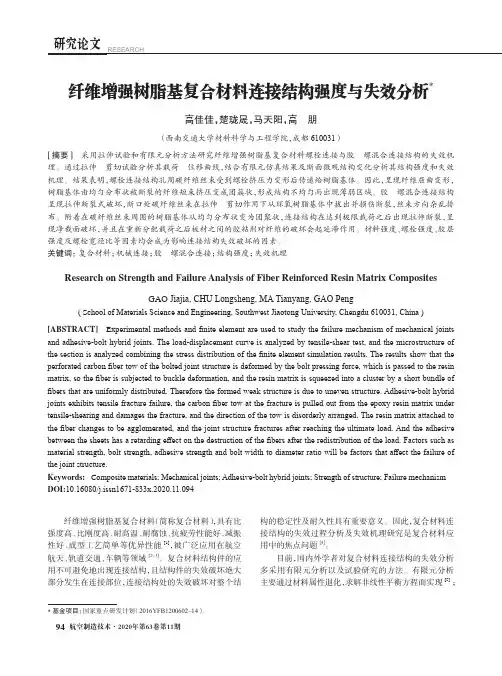
研究论文RESEARCH纤维增强树脂基复合材料连接结构强度与失效分析*高佳佳,楚珑晟,马天阳,高朋(西南交通大学材料科学与工程学院,成都 610031)[摘要]采用拉伸试验和有限元分析方法研究纤维增强树脂基复合材料螺栓连接与胶–螺混合连接结构的失效机理。
通过拉伸–剪切试验分析其载荷–位移曲线,结合有限元仿真结果及断面微观结构变化分析其结构强度和失效机理。
结果表明,螺栓连接结构孔周碳纤维丝束受到螺栓挤压力变形后传递给树脂基体。
因此,呈现纤维屈曲变形,树脂基体由均匀分布状被断裂的纤维短束挤压变成团簇状,形成结构不均匀而出现薄弱区域。
胶–螺混合连接结构呈现拉伸断裂式破坏,断口处碳纤维丝束在拉伸–剪切作用下从环氧树脂基体中拔出并损伤断裂,丝束方向杂乱排布。
附着在碳纤维丝束周围的树脂基体从均匀分布状变为团聚状,连接结构在达到极限载荷之后出现拉伸断裂,呈现净截面破坏,并且在重新分配载荷之后板材之间的胶粘剂对纤维的破坏会起延滞作用。
材料强度、螺栓强度、胶层强度及螺栓宽径比等因素均会成为影响连接结构失效破坏的因素。
关键词:复合材料;机械连接;胶–螺混合连接;结构强度;失效机理Research on Strength and Failure Analysis of Fiber Reinforced Resin Matrix CompositesGAO Jiajia, CHU Longsheng, MA Tianyang, GAO Peng( Scho ol of Materials Science and Engineering, Southwest Jiaotong University, Chengdu 610031, China ) [ABSTRACT] E xperimental methods and finite element are used to study the failure mechanism of mechanical joints and adhesive-bolt hybrid joints. The load-displacement curve is analyzed by tensile-shear test, and the microstructure of the section is analyzed combining the stress distribution of the finite element simulation results. The results show that the perforated carbon fiber tow of the bolted joint structure is deformed by the bolt pressing force, which is passed to the resin matrix, so the fiber is subjected to buckle deformation, and the resin matrix is squeezed into a cluster by a short bundle of fibers that are uniformly distributed. Therefore the formed weak structure is due to uneven structure. Adhesive-bolt hybrid joints exhibits tensile fracture failure, the carbon fiber tow at the fracture is pulled out from the epoxy resin matrix under tensile-shearing and damages the fracture, and the direction of the tow is disorderly arranged. The resin matrix attached to the fiber changes to be agglomerated, and the joint structure fractures after reaching the ultimate load. And the adhesive between the sheets has a retarding effect on the destruction of the fibers after the redistribution of the load. Factors such as material strength, bolt strength, adhesive strength and bolt width to diameter ratio will be factors that affect the failure of the joint structure.Keywords: Comp osite materials; Mechanical joints; Adhesive-bolt hybrid joints; Strength of structure; Failure mechanism DOI:10.16080/j.issn1671-833x.2020.11.094纤维增强树脂基复合材料(简称复合材料),具有比强度高、比刚度高、耐高温、耐腐蚀、抗疲劳性能好、减振性好、成型工艺简单等优异性能[1],被广泛应用在航空航天、轨道交通、车辆等领域[2–3]。
Journal of Materials Processing Technology168(2005)262–269Process optimisation for a squeeze cast magnesium alloy metalmatrix compositeM.S.Yong a,∗,A.J.Clegg ba Singapore Institute of Manufacturing Technology,71Nanyang Drive,Singapore638075,Singaporeb Wolfson School of Mechanical and Manufacturing Engineering,Loughborough University,Loughborough,Leicestershire LE113TU,UKReceived5January2004;received in revised form5January2004;accepted27January2005AbstractThe paper reports the influence of process variables on a zirconium-free(RZ5DF)magnesium alloy metal matrix composite(MMC) containing14vol.%Saffilfibres.The squeeze casting process was used to produce the composites and the process variables evaluated were applied pressure,from0.1MPa to120MPa,and preform temperature from250◦C to750◦C.The principalfindings from this research were that a minimum applied pressure of60MPa is necessary to eliminate porosity and that applied pressures greater than100MPa causefibre clustering and breakage.The optimum applied pressure was established to be80MPa.It was also established that to ensure successful preform infiltration a preform temperature of600◦C or above was necessary.For the optimum combination of a preform preheat temperature of600◦C and an applied pressure of80MPa,an UTS of259MPa was obtained for the composite.This represented an increase of30%compared to the UTS for the squeeze cast base alloy.©2005Elsevier B.V.All rights reserved.Keywords:Magnesium alloys;Squeeze casting;Metal matrix composites;Mechanical properties1.IntroductionMetal matrix composite(MMC)components can be man-ufactured by several methods.The metal casting route is espe-cially attractive in terms of its ability to produce complex near net shapes.However,castings produced by conventional cast-ing processes may contain gas and/or shrinkage porosity.The tendency for porosity formation will be exacerbated whenfi-bres are introduced because they tend to restrict theflow of molten metal and cause even greater gas entrapment within the casting.It is pointless to usefibres to reinforce a casting if defects are present,since the addition offibres will not com-pensate for poor metallurgical integrity.In order to fulfil the potential offibre reinforcement and produce pore free cast-ings the squeeze casting process can be selected.The unique feature of this process is that metal is pressurised throughout solidification.This prevents the formation of gas and shrink-age porosity and produces a metallurgically sound casting.∗Corresponding author.E-mail address:msyong@.sg(M.S.Yong).Selection of this process is also based on its suitability for mass production,ease of fabrication and its consistency in producing high quality composite parts.With the development of MMCs,magnesium alloys can better meet the various demands of diverse applications.The addition of reinforcement to magnesium alloy produces su-perior mechanical properties[1–3]and good thermal stability [4,5].Of the various composite types,the discontinuous and randomly orientedfibre-reinforced composites provide the best“value to strength ratio”.Despite the potential advantage of using magnesium MMC for lightweight and high strength applications,little is known about the influence of squeeze infiltration parame-ters.Key parameters,such as applied pressure and preform temperature must be optimised,especially for the squeeze infiltration of a magnesium–zinc MMC.These process pa-rameters were researched and the results are presented in this paper.However,it wasfirst necessary to select appropriate fibres and binders since their selection is fundamental to the success of the MMC.The main criterion determining the se-lection offibre type is compatibility with the matrix.Two0924-0136/$–see front matter©2005Elsevier B.V.All rights reserved. doi:10.1016/j.jmatprotec.2005.01.012M.S.Yong,A.J.Clegg/Journal of Materials Processing Technology168(2005)262–269263fibre types that are known to be compatible with magnesium are Saffil and carbon[6].Silica and alumina-based binders are widely used in preform production,mainly due to their high temperature properties[7].However,there are concerns about chemical reactions between magnesium alloys and sil-ica[8].To ensure full infiltration of liquid metal into thefibre pre-form,researchers[9–11]have emphasised the importance of preheating the preforms.However,there has been lit-tle research to determine optimum preform temperature for magnesium alloys and that reported has focused on AZ91 (magnesium–aluminium)alloy.The wetting capability of these alloys is different,for instance the wetting and the in-terfacial reaction between Al2O3reinforcement and cerium, lanthanum(both rare earth elements)or magnesium is far better in comparison to aluminium.Most work on applied pressure has focused on aluminium alloys and their composites.However,Ha[12]and Chadwick [13]investigated the influence of applied pressure on the short freezing range Mg–Al family of alloys.The effect on solid-ification will inevitably be different for long freezing range alloys,such as the Mg–Zn family alloys that are the focus of this research.The difference in solidification morphology will be significant when infiltrating the melt into a porousfi-bre preform.Long freezing range alloys retain a liquid phase over a longer period during infiltration and this may promote better infiltration,reduce voids and consequently improve the soundness of the composite.2.Experimental methodologyA zirconium-free magnesium–4.2%zinc–1%-rare earths alloy,designated RZ5DF,was used for this research.Several fibre preform materials,proportions and binder systems,were evaluated to determine their compatibility with the magne-sium alloys and the mechanical properties that they delivered to the composite[14].This preliminary research established that a compopsite based on a silica-bonded,14vol.%Saffil fibre preform delivered the best characteristics in terms of ease of production and maximum‘value to strength ratio’.The effect of applied pressure,between0.1MPa and 120MPa,on the RZ5DF-14vol.%Saffilfibre composite was first evaluated.The maximum permissible applied pressure was limited by both the capability of the squeeze casting press and die design.The metal pouring temperature was main-tained at750◦C,the die temperature at250◦C,the duration of applied pressure at25s,and delay before application of pressure at4s.These conditions replicated those employed for the base alloy that was reported previously[15].Following this,the influence of preform temperature was evaluated for a restricted range of applied pressures.Four preform temperatures were selected:250◦C(similar to the die temperature),400◦C(intermediate temperature),600◦C (at which temperature the RZ5DF alloy is a mixture of liquid and solid),and750◦C(at which temperature the RZ5DF alloy is in the fully molten state).These experiments were conducted at three applied pressures:60MPa,80MPa and 100MPa.The mechanical properties were evaluated using tensile and hardness tests.These tests were complemented by optical microscopy and,for the tensile fracture surfaces,SEM.2.1.Test castingThe test casting was a rectangular plate of126mm in length,75mm in width and16mm in depth.2.2.Melt processingThe alloy was melted in an electric resistance furnace us-ing a steel crucible,thefluxless method and an argon gas cover.The die was coated with boron nitride suspended in water to protect it from excessive wear.2.3.Tensile testingTensile tests were conducted on a50kN Mayes testing ma-chine using position control.Modified test specimens were machined according to BS18(1987)and magnesium Elek-tron Ltd RB4specifications[16].2.4.Hardness testingHardness was measured to determine and study the influ-ence of reinforcement on the magnesium and the isotropy of fibre distribution.The locations of hardness measurements are shown in Fig.1.Hardness measurements were conducted using the Rockwell B scale for both the alloys and com-posites.The preference for the Rockwell rather than Vick-ers hardness measurement was due to the larger indentation needed to ensure a more consistent measurement on the com-posite.The area of the Vickers hardness indentation is so small that,in some cases,the measurement could be taken from the hardfibre causing large variations in hardness val-ues.Fig.1.Locations of hardness measurements(each dot represents the position of a hardness measurement)taken in both‘Longitudinal’and‘Transverse’directions.264M.S.Yong,A.J.Clegg /Journal of Materials Processing Technology 168(2005)262–2692.5.MetallographyAn optical microscope and stereoscan 360electrom mi-croscope (SEM)were used to examine the microstructure of the MMC specimens.Metallographic samples were prepared using standard techniques and were etched using an acetic pi-cral solution.The electron microscope was equipped with a back-scatter detector and was used to characterise fracture surfaces from the tensile test specimens.2.6.Cell sizeThe cell size was established using the intersection method.Five areas were selected at random and 21mea-surements of cell size were taken for each area.The average value for the 105readings was determined.3.Results and observationsThe results are reported in the sequence in which the ex-periments were conducted.In the first series of experiments,the effect of applied pressure was evaluated.In the second se-ries,the combined influences of applied pressure and preform preheat temperature were evaluated.3.1.Series 1experiments:the influence of applied pressure3.1.1.Tensile propertiesThe effect of applied pressure on UTS and ductility of squeeze cast,RZ5DF-14vol.%,Saffil fibre composites is shown in Fig.2.It can be seen that the highest UTS value was obtained with an applied pressure of 80MPa.It would appear from the figure that a pressure in excess of 40MPa is essential to develop a significant improvement in UTS but that levels above 80MPa have a detrimental effect.3.1.2.HardnessThe hardness values along the longitudinal and transverse directions of the composite castings produced atdifferentFig.2.The effects of squeeze infiltration applied pressure on the tensile properties of the RZ5DF matrix with 14vol.%fraction Saffilfibres.Fig.3.The average material hardness along the longitudinal and transverse direction of the squeeze infiltrated RZ5DF alloy with 14vol.%fraction Saffil fibres,cast with constant pouring temperature of 750◦C and die temperature of 250◦C.applied pressures are shown graphically in Fig.3.Whilst the dominating influence on hardness is provided by the presence of the Saffil fibres,the results show that the hardness at the two lowest levels of applied pressure (0.1MPa and 20MPa)is distinctly lower than that associated with applied pressure levels of 40MPa and above.3.1.3.MetallographyMetallography was conducted to examine the influence of applied pressure on the cast structure.Selected opti-cal microstructures are presented in Fig.4.The metal-lographic examination identified the presence of microp-orosity in those samples produced with applied pressures below 60MPa.The microporosity,as expected,occurred mainly at cell boundaries and was most easily confirmed by adjusting the depth of field.It also identified the ten-dency for fibre clustering and fracture at applied pressures greater than 80MPa.The presence of fractured fibres is demonstrated more clearly in the SEM micrographs shown in Fig.5.These micrographs show fractured fibres in the plane transverse to that of load application during the tensile test.3.2.Series 2experiments:the influence of preform temperatureThe preliminary experiments showed that the optimum applied pressure was 80MPa.However,to ensure robustness in the experimentation,the effects of preform preheat temper-ature were evaluated for the optimum applied pressure and pressures of 60MPa and 100MPa.3.2.1.Tensile testsThe effects of preform temperature and applied pressure on UTS are summarised in Fig.6.The results show that a preform preheat temperature of 750◦C produced the most consistent UTS values across the range of applied pressuresM.S.Yong,A.J.Clegg/Journal of Materials Processing Technology168(2005)262–269265Fig.4.Optical microstructure of squeeze infiltrated RZ5DF-14vol.%fraction Saffilfibres produced under(i)atmospheric pressure,0.1MPa,applied pressure of(ii)20MPa,(iii)40MPa,(iv)60MPa,(v)80MPa,(vi)100MPa and(vii)120MPa.and that the maximum UTS of259MPa was obtained with a preform temperature of600◦C and an applied pressure of 80MPa.These results confirm the status of80MPa as the optimum value of applied pressure.3.2.2.HardnessThe results of the hardness tests are shown in Fig.7.The greatest variation in hardness was demonstrated by the test casting produced with the lowest value of appliedpressure Fig.5.SEM micrograph of the fracture face of a squeeze infiltrated RZ5DF-14vol.%fraction Saffilfibres produced under applied pressure of(i)100MPa and (ii)120MPa.266M.S.Yong,A.J.Clegg/Journal of Materials Processing Technology168(2005)262–269Fig.6.The plot of UTS for RZ5DF-14vol.%Saffil MMC produced from various combinations of applied pressure and preform temperature. (60MPa)and preform temperature of400◦C.The range of variation was±8HRB compared to±6HRB observed for the other combinations of preform temperature and applied pressure.3.2.3.MetallographyMetallographic examination of the composite structures showed that more densely packedfibres occurred at the pre-form surface at the lowest preform temperature.This effect is illustrated in Fig.8.The sequence of microstructures show that preform deformation andfibre clustering were less evi-dent at higher preform temperatures.The SEM micrographs of tensile fracture surfaces,Fig.9,confirm the clustering of fibres and provide evidence offibre tofibre contact,for the preheat temperature of400◦C.This effect was not evident for the preheat temperature of600◦C.4.DiscussionTo achieve the successful infiltration of afibre preform the liquid metal must penetrate the preform completely.Potential barriers to this are presented by:the density of the preform, which can be represented by the preform permeability[14]; Fig.7.The average material hardness along the longitudinal and transverse direction of the squeeze infiltrated RZ5DF alloy with14vol.%fraction Saffilfibres produced under different combinations of preform temperatures and appliedpressures.Fig.8.A micrograph taken at the preform infiltration region of a squeeze infiltrated specimen produced with a preform temperature of(i)750◦C,(ii)600◦C, (iii)400◦C and(iv)250◦C.M.S.Yong,A.J.Clegg/Journal of Materials Processing Technology168(2005)262–269267an insufficient pressure head,necessary to displace the air and overcome resistances to metalflow;and/or a low pre-form temperature that promotes premature solidification of the solid before complete infiltration.Increasing either the applied pressure or the preform pre-heat temperature,independently or in combination,may im-prove infiltration.However,there may be adverse conse-quences.Too high a level of applied pressure may physi-cally damage the preform through compression.This leads to compacted preforms that resist infiltration together withfi-bre clustering andfibre breakage that reduce thefibres’effec-tiveness for strengthening the matrix.Although researchers [11,17,18]have resorted to high preform temperatures to achieve infiltration,this too can have adverse effects.For example,an increased heat content in the system may retard solidification.This in turn extends the time during which there is the opportunity for adverse interfacial reactions to occur between the alloy andfibres.Furthermore,an extended pe-riod of solidification can promote the formation of larger cell sizes that in turn impair the mechanical properties.The influence of applied pressure is quite clearly demon-strated in Fig.2.Thefigure can be divided into three distinct regions:<60MPa,61–90MPa,>91MPa.Thefirst of these regions is associated with the presence of porosity and voids in the castings and this porosity is associated with low UTS values.As the applied pressure is increased the porosity is eliminated and the composite develops its optimum UTS of 259MPa at an applied pressure of80MPa.Thereafter,an increase in applied pressure producesfibre clustering and breakage leading to more initiation points for fracture and so the UTS declines.The tensile evidence is supported by evi-dence from hardness tests and metallography.The presence of porosity,revealed in Fig.4,adversely affects the hardness of the castings.Quite simply,low levels of applied pressure are not sufficient to either suppress porosity formation or com-pletely infiltrate thefibre preform.It is interesting to note that the optimum applied pressure level of80MPa for the compos-ite is20MPa higher than that necessary to develop the highest level of strength in thefibre-free base alloy[15].Metallo-graphic examination revealed that preform deformation and fibre clustering was less evident andfibres were less densely packed at the surfaces of the preforms preheated to600◦C or 750◦C(see Fig.8)when compared with400◦C and250◦C.It was found that the highest preform temperature(750◦C) produced the most consistent UTS values over the range of applied pressures considered.This preform temperature is above the liquidus temperature of the alloy.It would,there-fore,be expected that infiltration of the preform would not be impeded by the early onset of solidification of the alloy on thefibre preforms.The preform temperature of600◦C pro-duced a higher variation in UTS than was observed for the 750◦C preform preheat temperature.However,the highest value of UTS of all the experiments was produced with this preheat temperature in combination with an applied pressure of80MPa.A preform temperature of750◦C supported a wider range of applied pressure because,even at the lowest level of 60MPa,there was a minimal resistance to infiltration.It was also noted that there was less variation infibre distri-bution.An even distribution offibres was also evident in the specimens produced at a preheat temperature of600◦C, see Fig.9.This temperature is33◦C below the alloy’s liq-uidus temperature.Although infiltration was not a problem, it can be postulated that solidification would occur quite quickly under these conditions.This postulation is supported by microstructural evidence and cell size measurements,see Fig.8,that show a smaller cell size,associated with better UTS,in the samples produced with a preform temperature of 600◦C.With preheat temperatures of400◦C and,especially, 250◦C the UTS values are generally poor and there is clear evidence of ineffective infiltration.The microstructural evi-dence clearly shows that preform deformation,fibre cluster-ing andfibre breakage is evident to varying degrees.However, such effects were not uniform and produced inconsistent ef-fects.For example,for the combination of400◦C and60MPa applied pressure,microstructural evaluation,see Fig.10,re-vealed a high concentration offibres in the centre of the infil-trated preform.This effect was caused by two factors.Firstly, the low preform preheat temperature promoted rapid solid-ification of the alloy prior to the application of pressure at both the preform surface and at locations near to the die wall. Secondly,the low applied pressure resulted in irregular and curtailed infiltration.In consequence,the applied pressure compacts rather than infiltrates the preform.This produces in-filtrated regions that have a higher concentration offibresand Fig.9.SEM micrograph of the fracture face of a squeeze infiltrated RZ5DF-14vol.%Saffil MMC produced with(i)400◦C and(ii)600◦C preform temperature.268M.S.Yong,A.J.Clegg /Journal of Materials Processing Technology 168(2005)262–269Fig.10.Microstructure showing different parts of the squeeze infiltrated RZ5DF-14vol.%fraction Saffil specimen produced with a preform temperature of 400◦C and applied pressure of 60MPa.The sequence is (i)top,(ii)centre and (iii)bottom portion of the fabricated composite.this can produce higher values of UTS,see Fig.10.However,the effect is inconsistent and therefore undesirable.Hardness measurements also confirmed the inconsistency.For exam-ple,the specimen produced with 60MPa and 400◦C preheat demonstrated the greatest variation in hardness,see Fig.7,and this was attributable to the central clustering of fibres.Ex-amination of the fracture surface of the specimen produced with a preform temperature of 400◦C and an applied pres-sure of 80MPa clearly shows the fibres in contact with one another,see Fig.9.4.1.The influence of zincAlloying magnesium with 4.2%of the lower melting point metal zinc produces a binary alloy that has a long freezing range.Experimentation [16]determined the values of the liquidus and solidus of the RZ5DF alloy to be 633◦C and 474◦C,respectively,a freezing range of 159◦C.Although long freezing range alloys are the most prone to shrinkage porosity,this problem is overcome by squeeze casting.The long freezing range may in fact be beneficial in the produc-tion of a composite since the extended period during which a liquid phase is present may promote infiltration.The pres-ence of zinc may also be significant for the preform preheat temperature.The results show that the optimum UTS of 259MPa was obtained with a preform temperature of 600◦C,a tempera-ture just 33◦C below the alloy’s liquidus temperature.Cell size measurements revealed that specimens produced at this preheat temperature had a smaller average cell size,typically 30m,see Fig.8.For specimens produced with preheat tem-peratures of 750◦C,400◦C and 250◦C the average cell size was >50m.This variation can be explained by consider-ation of the nucleation and growth sequence in the various specimens.The high preform preheat temperature retards the rate of solidification because time is necessary for the heat of the preform to be transferred through the alloy to the die.Nucleating cells have time to grow.Conversely,at low pre-heat temperatures of 400◦C and 250◦C,the alloy solidifiesquickly in contact with the relatively cold fibres.The first solid formed is rich in the primary phase and the remaining liquid becomes richer in the low melting point eutectic.Al-though primary phase still forms by nucleation and growth in the inter-fibre regions,the number of cells formed is reduced and their size is larger.5.Conclusions1.The optimum applied pressure for the squeeze casting of RZ5DF-14vol.%Saffil fibre composites was determined to be 80MPa.At applied pressures below 60MPa,micro-porosity was not suppressed.Conversely,a high applied pressure of 100MPa or above causes fibre clustering and breakage and a concomitant reduction in UTS.2.The optimum preform preheat temperature was estab-lished to be 600◦C.At this temperature consistent fibre in-filtration was achieved and the optimum cell size of 30m was obtained in the matrix.3.The optimum combination of applied pressure and pre-form preheat temperature was determined to be 80MPa and 600◦C,respectively.For this combination,a UTS value of 259MPa was obtained.The composite delivered a 30%increase in UTS compared with that developed in the squeeze cast base alloy.AcknowledgementsDr.Yong gratefully acknowledges the receipt of an Over-seas Research Students Award and a Loughborough Univer-sity Research Studentship.References[1]K.Purazrang,P.Abachi,K.U.Kainer,Investigation of the mechan-ical behaviour of magnesium composites,Composites 25(4)(1994)296–302.M.S.Yong,A.J.Clegg/Journal of Materials Processing Technology168(2005)262–269269[2]K.Purazrang,P.Abachi,K.U.Kainer,Mechanical behaviour of mag-nesium alloy MMCs produced by squeeze casting and powder met-allurgical techniques,Compos.Eng.3(6)(1993)489–505.[3]O.Ottinger,G.Grau,R.Winter,R.F.Singer,The effect of alu-minium additions on the interfacial microstructure and mechanical properties of C/Mg composites,in:Proceedings of the10th Inter-national Conference on Composite Materials(ICCM10),vol.VI, Vancouver,Canada,August1995,pp.447–454.[4]A Materials Edge Report,Metal matrix composites in the automotiveindustry,Met.Bull.plc.,(1993)1–33.[5]W.Toaz,R.R.Bowles,D.L.Mancini,Squeeze casting compositecomponents for diesel engines,Ind.Heat.54(3)(1987)17–19. [6]P.K.Rohatgi,Advances in cast mmc,Adv.Mater.Process137(2)(1990)39–44.[7]T.W.Clyne,P.J.Withers,An Introduction to Metal Matrix Compos-ites,Cambridge University Press,Cambridge,1993.[8]B.Inem,G.Pollard,Interface structure and fractography of amagnesium-alloy metal matrix composite reinforced with SiC parti-cles,J.Mater.Sci.28(1993)4427–4434.[9]H.Fukunaga,K.Goda,Fabrication offiber reinforced metal bysqueeze casting,Bull.JSME27(228)(1984)1245–1250.[10]H.Fukunaga,Processing aspects of squeeze casting for shortfi-bre reinforced metal matrix composite castings,Adv.Mater.Manuf.Process3(4)(1988)669–687.[11]J.Kiehn,W.Riehemann,K.U.Kainer,P.V ostry,I.Stulikova,B.Smola,Annealing effects in shortfibre reinforced and unreinforcedMg–Ag–Nd–Zr alloy,in:Proceedings of the Third International Magnesium Conference,Manchester,UK,April,1996,pp.663–676.[12]T.U.Ha,Squeeze casting of magnesium-based alloys and their metalmatrix composites,Ph.D.Thesis,University of Southampton(1988).[13]G.A.Chadwick,Squeeze casting of magnesium alloys andmagnesium-based metal matrix composites,in:Proceedings of Mag-nesium Technology,London,The Institute of Metals,November 1986,pp.75–82.[14]M.S.Yong,R.I.Temple,A.J.Clegg,Influence offibre preform per-meability on infiltration of magnesium–zinc base alloys,in:Pro-ceedings of Magnesium Alloys and their Applications,Wolfsburg, Germany,18–20November,2003,pp.348–353.[15]M.S.Yong,A.J.Clegg,Process optimisation for a squeeze cast mag-nesium alloy,J.Mater.Process.Technol.145(January(1))(2004) 134–141.[16]M.S.Yong,Process optimisation of squeeze cast magnesium–zinc–rare earth alloys and shortfibre composites,Ph.D Thesis, Loughborough University,1999.[17]S.Kamado,Y.Kojima,Microstructure and tensile properties ofMg–Zn based alloy composite reinforced with Al2O3shortfibre and9Al2O3·2B2O3whisker,p.Mater6(3)(1997) 159–167.[18]J.H.Hsieh,C.G.Chao,Effect of magnesium on mechanical prop-erties of Al2O3/Al–Zn–Mg–Cu metal matrix composites formed by squeeze casting,Mater.Sci.Eng.A.214(1996)133–138.。

碳纤维复合材料蜂窝夹芯特殊结构无损检测研究1.研究内容本文以碳纤维复合材料蜂窝夹芯结构试验件的过渡区为主要被检测对象,该试验件为碳纤维复合材料NOMEX蜂窝夹芯结构,预制缺陷设计较为特殊,采用发泡胶模拟预制缺陷,位于蜂窝过渡区与平板区的三角区域,缺陷宽度仅有2mm,对无损检测的实施提出了较高要求,试验件示意图如图1所示。
为掌握试验件在规定疲劳试验周期内损伤扩展特性,试验过程检测与飞机在役检测更为相似,对其检测方案及可行性的研究显得尤为重要。
1.检测方法无损检测技术是指在不损坏材料或产品原有的形状、性能的基础上,利用光、声、电、磁、热和射线等技术检测其是否有损伤,以确保其可靠性的检测技术。
利用不同的无损检测技术,对材料表面和内部进行检测,并对缺陷的类型、大小、深度、范围、数量等做出准确判断,由此可以判断材料或构件是否可以进行下一步的生产制造或者维修服役情况。
目前碳纤维复合材料蜂窝夹芯结构常用的无损检测方法通常有以下几种方法。
1.1.敲击检测法敲击检测法是使用时间最早应用范围最广的一种无损检测方法。
主要是通过对物体进行适当的敲击来获取试件的振动信息通过振动频率是否改变来判断试件内部是否含有损伤,敲击检测法主要并且广泛应用于蜂窝夹芯结构、多层结构和网状结构对胶粘剂质量的检测。
它适用于结构内部的脱胶、夹杂、分层等缺陷,但对小尺寸缺陷的检测不敏感。
传统的敲击检测是利用适当的敲击工具(小锤、硬币等)对被测材料进行敲击,并通过被测材料振动产生的声咅来判断材料的内部损伤。
现代数字敲击检测是利用传感器对振动信息进行采集,然后对采集的振动信息进行分析从而得到准确的检测结果。
1.1.超声波检测超声波检测法是目前复合材料无损检测的主要方法之一。
超声波无损检测技术主要根据复合材料自身和其缺陷对超声波传播的阻碍来判断材料表面及内部的缺陷,能检测复合材料中的内部缺陷如疏松、分层、夹杂、裂纹等,还能对材料厚度和性能进行评估。
超声波具有很强的穿透能力,可对较厚的材料进行探测,灵敏度高,操作简单,对缺陷的深度、大小,范围进行精准检测。
astm e23
ASTM E23是美国材料和试验协会(ASTM International)
制定的标准,用于评估金属材料的冲击韧性。
该标准的全
称为ASTM E23-18a,标准测试方法为"Standard Test Methods for Notched Bar Impact Testing of Metallic Materials"(金属材料缺口条冲击试验的标准测试方法)。
ASTM E23标准包括了两种试验方法:Charpy冲击试验和
Izod冲击试验。
这两种试验方法用于评估金属材料在低温
下的韧性和抗冲击性能。
Charpy冲击试验是将标准化的缺口试样固定在冲击试验机上,然后施加冲击载荷,测量样品断裂前后的吸收能量。
试样通常是V形缺口,冲击载荷通常是通过一个锤头施加
在试样上。
Izod冲击试验与Charpy冲击试验类似,但试样的缺口形状
不同。
Izod试样的缺口位于试样的一侧,而Charpy试样的
缺口位于试样的中央。
Izod试样的冲击载荷也是通过一个
锤头施加在试样上。
ASTM E23标准规定了试样的尺寸、冲击载荷的大小和试验
温度的选择等细节。
通过进行Charpy或Izod冲击试验,
可以评估金属材料的韧性和抗冲击性能,这对于材料选择
和设计工程结构非常重要。
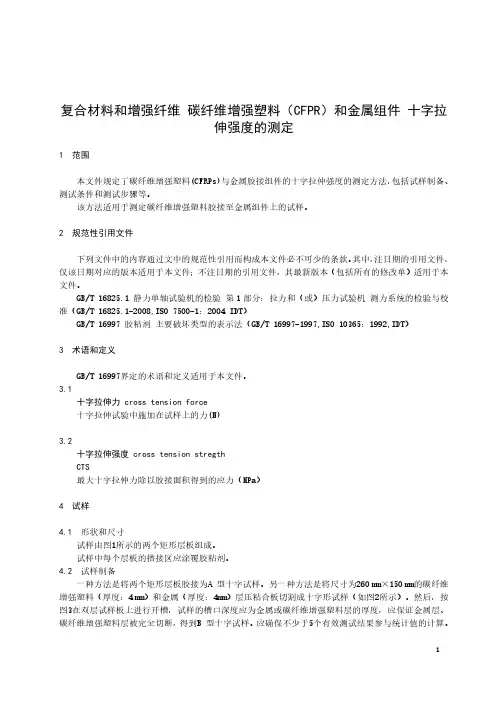
复合材料和增强纤维碳纤维增强塑料(CFPR)和金属组件十字拉伸强度的测定1范围本文件规定了碳纤维增强塑料(CFRPs)与金属胶接组件的十字拉伸强度的测定方法,包括试样制备、测试条件和测试步骤等。
该方法适用于测定碳纤维增强塑料胶接至金属组件上的试样。
2规范性引用文件下列文件中的内容通过文中的规范性引用而构成本文件必不可少的条款。
其中,注日期的引用文件,仅该日期对应的版本适用于本文件;不注日期的引用文件,其最新版本(包括所有的修改单)适用于本文件。
GB/T16825.1静力单轴试验机的检验第1部分:拉力和(或)压力试验机测力系统的检验与校准(GB/T16825.1-2008,ISO7500-1:2004IDT)GB/T16997胶粘剂主要破坏类型的表示法(GB/T16997-1997,ISO10365:1992,IDT)3术语和定义GB/T16997界定的术语和定义适用于本文件。
3.1十字拉伸力cross tension force十字拉伸试验中施加在试样上的力(N)3.2十字拉伸强度cross tension stregthCTS最大十字拉伸力除以胶接面积得到的应力(MPa)4试样4.1形状和尺寸试样由图1所示的两个矩形层板组成。
试样中每个层板的搭接区应涂覆胶粘剂。
4.2试样制备一种方法是将两个矩形层板胶接为A型十字试样。
另一种方法是将尺寸为260mm×150mm的碳纤维增强塑料(厚度:4mm)和金属(厚度:4mm)层压粘合板切割成十字形试样(如图2所示)。
然后,按图3在双层试样板上进行开槽,试样的槽口深度应为金属或碳纤维增强塑料层的厚度,应保证金属层、碳纤维增强塑料层被完全切断,得到B型十字试样。
应确保不少于5个有效测试结果参与统计值的计算。
分散,宜将胶接区制作成直径为20mm的圆形。
附录A给出了胶接区形状(正方形或圆形)对十字拉伸力值及其分散性的影响信息(详见附录A)胶接区为25mm×25mm的正方形,其面积与试样各层板的搭接区面积相同。
新型国产T800碳纤维复合材料制孔特性董慧民1, 王 赫1, 孟繁星2, 耿大喜2, 李跃腾1, 钱黄海1*, 苏正涛1(1.中国航发北京航空材料研究院 减振降噪材料及应用技术航空科技重点实验室,北京 100095;2.北京航空航天大学机械工程及自动化学院,北京 100191)摘要:针对新型国产T800复合材料(carbon fiber reinforced plastic, CFRP)在切削过程中因钻削力及扭矩较大易产生的分层撕裂、纤维损失等缺陷问题,搭建包含立式超声加工中心和测力系统的实验平台,采用硬质合金麻花钻、三尖钻、匕首钻对T800碳纤维复合材料进行制孔质量对比实验。
在相同的工艺参数下,对比了三种刀具结构在普通钻削(conventional drilling, CD)下对T800复合材料制孔的切削力、孔出入口表面形貌、孔径偏差及孔表面粗糙度的影响规律。
在优选刀具结构的基础上,采用超声振动辅助钻削(ultrasonic vibration assisted drilling, UVAD)方法开展可行性实验。
结果表明:硬质合金匕首钻可以有效地抑制T800复合材料制孔时的表面缺陷,然而入口孔径精度较差;超声振动辅助匕首钻可以进一步提升制孔质量,特别是通过提高入钻稳定性显著改善孔径精度。
关键词:T800;复合材料;超声振动钻削;匕首钻;加工精度doi:10.11868/j.issn.1005-5053.2023.000009中图分类号:V262;V258.3 文献标识码:A 文章编号:1005-5053(2023)03-0094-11Hole making characteristics of novel domestic T800 carbonfiber reinforced compositeDONG Huimin1, WANG He1, MENG Fanxing2, GENG Daxi2, LI Yueteng1,QIAN Huanghai1*, SU Zhengtao1(1. Aviation Key Laboratory of Science and Technology on Materials and Application Research for Vibration and Noise Reduction, AECC Beijing Institute of Aeronautical Materials, Beijing 100095, China;2. School of Mechanical Engineering and Automation, Beihang University, Beijing 100191, China)Abstract: In view of the defects of the new domestic T800 carbon fiber reinforced plastic (CFRP), such as lamellar tearing and fiber loss, which would be easily caused by large drilling force and torque during cutting, an experimental platform including a vertical ultrasonic machining center and force measurement system was constructed. Carbide twist drill, carbide candle stick drill and carbide dagger drill were used to compare the hole quality of T800 carbon fiber composite. Under the same technological parameters, the influences of three kinds of cutting tool structures on the cutting force, surface morphology of hole inlet and outlet, aperture deviation and surface roughness of T800 composite were compared with those of conventional drilling (CD). The ultrasonic vibration assisted drilling (UVAD) method was adopted to carry out feasibility experiments on optimum tool structure. The results show that the carbide dagger drill can effectively suppress the surface defects of T800 composite materials, but the entrance aperture accuracy is poor. The ultrasonic vibration assisted dagger drilling can further improve the quality of hole making, especially significantly improve the aperture accuracy by improving the drilling stability.Key words: T800;composite material;ultrasonic vibration assisted drilling;dagger drill;machining accuracy航空工业的飞速发展带来的是航空装备材料与制造技术的快速进步,而航空装备制造的复杂性与极端化使得其成为衡量整个高端制造业水平的一个标准。

基于锤击法的复合材料层合板振动理论及实验模态分析李菊峰;杨涛;杜宇;牛雪娟【摘要】基于实验模态分析理论,构建了复合材料层合板的模态实验理论及测试系统.首先制备了150mm×80 mm×3.75 mm的碳纤维复合材料层合板,通过DH5922N动态数据采集仪提取了加速度传感器以及力锤所感应到的频响函数及激励信号.将频响函数导入DHDAS动态信号分析系统后获得复合材料层合板一阶及二阶固有频率分别为323.103和656.180 Hz,并测得对应频率下的各测点振型.结果表明,利用本文所提出的实验理论及所用设备可精确提取复合材料层合板的模态信息.【期刊名称】《宇航材料工艺》【年(卷),期】2017(047)001【总页数】5页(P25-28,36)【关键词】复合材料;模态测试;模态振型;固有频率【作者】李菊峰;杨涛;杜宇;牛雪娟【作者单位】天津鼎华检测科技有限公司,天津300350;天津市现代机电装备技术重点实验室,天津300387;天津鼎华检测科技有限公司,天津300350;天津市现代机电装备技术重点实验室,天津300387;天津市现代机电装备技术重点实验室,天津300387;天津市现代机电装备技术重点实验室,天津300387【正文语种】中文【中图分类】TB33文摘基于实验模态分析理论,构建了复合材料层合板的模态实验理论及测试系统。
首先制备了150 mm80 mm3.75 mm的碳纤维复合材料层合板,通过DH5922N 动态数据采集仪提取了加速度传感器以及力锤所感应到的频响函数及激励信号。
将频响函数导入DHDAS动态信号分析系统后获得复合材料层合板一阶及二阶固有频率分别为323.103和656.180 Hz,并测得对应频率下的各测点振型。
结果表明,利用本文所提出的实验理论及所用设备可精确提取复合材料层合板的模态信息。
因为碳纤维复合材料结构的比模量与比强度相对金属材料比较高,热稳定性、耐疲劳性及减震性能好,所以普遍使用在航天航空、汽车、船舶工程、休闲用品等领域[1-2]。
复合材料中的“烛芯效应(Wicking effect)”是指由于复合材料内部的不均匀性,导致在加热或燃烧时,热量的传递和物质的流动方向与理想情况下的均匀传递和流动方向相反,形成类似烛芯的结构。
在复合材料中,如果纤维或颗粒的分布不均匀,或者材料的热膨胀系数、热传导系数等物理性能存在差异,就会导致内部的温度场和热流场呈现出不均匀的分布。
这种不均匀性会使得热量从高温区域向低温区域传递的过程中,沿着纤维或颗粒的轴线方向形成一个“烛芯”状的通道。
烛芯效应在复合材料的应用中具有一定的负面影响。
例如,在汽车、飞机等结构件中,由于烛芯效应的存在,可能导致内部局部区域过热,从而影响材料的性能和寿命。
同时,烛芯效应也可能对复合材料的阻燃性能产生一定的影响。
在某些情况下,烛芯效应可能会促进材料的燃烧,增加火灾风险。
为了减小烛芯效应的负面影响,可以采取一些措施来改善材料的均匀性和热处理性能。
例如,优化纤维或颗粒的分布、控制材料的热处理工艺、采用具有较小烛芯效应的材料等。
这些措施可以提高复合材料的力学性能、热稳定性和阻燃性能,从而更好地满足实际应用需求。
4.塑料——简支梁冲击强度的测定Plastics—Determination.of charpyImpact strength第二版1993-05-151适用范围1.1本国际标准规定了塑料在规定条件下测定简支梁冲击强度的方法。
规定了几种不同种类的试样和试验配置。
根据材料类型、试样类型和缺口的类型规定了不同试验参数。
1.2本方法用于研究规定类型的试样在规定冲击条件下的行为,也用于估计试样在试验条件固有范围内的脆性和韧性。
本方法比ISO 180(悬臂梁)有较大的应用范围,且更适用于测试显示层间剪切断裂的材料或由于环境因素存在表面影响的材料。
1.3本方法适用于下列范围的材料——硬质热塑性模塑和挤塑材料,包括填充材料和增强未填充材料,硬质热塑性板材;——硬质热固性模塑材料,包括填充和增强材料,硬质热固性板材,包括层压材料;——纤维增强的热固性和热塑性复合材料,包括单向或非单向的增强材料如毡、织物、纺织粗纱、短丝束、复合和杂混复合材料、玻璃粗纱和碎纤维、预浸渍材料制成的片材(预浸料坯);——热致液晶聚合物。
本方法一般不适用于硬质多孔材料和含有多孔材料的夹层结构材料。
另外,长纤维增强的复合料或热致液晶聚合物一般不用缺口试样。
1.4 本方法适用于模塑到所选尺寸试样,以标准多用途试验试样(见ISO 3167)的中部机械加工的试样,或者由成品和半成品如模塑制品、层压制品和挤塑或铸塑板机械加工的试样。
1.5 本方法规定了试样的优选尺寸。
不同尺寸和缺口的试样以及不同条件下制备的试样进行的试验所得的结果是不可比的。
其他因素,如摆锤的能量大小,冲击速度和试样的状态调节也能影响结果。
因此,当需要可比数据时,必须仔细地控制和记录这些因素。
1.6 本方法不宜用作设计计算数据的来源。
但是,通过在不同的温度试验,改变缺口半径和/或厚度以及不同条件下制备试样,可以获得材料的典型特征资料。
本文引用的下列标准所包含的若干条款,构成本国际标准的条款,出版时所标明的版本是有效的。
Charpyimpacttestsoncompositestructures–Anexperimentalandnumericalinvestigation
W.Hufenbach,F.MarquesIbraim*,A.Langkamp,R.Bo¨hm,A.HornigTechnischeUniversita¨tDresden,InstituteofLightweightStructuresandPolymerTechnology(ILK),01062Dresden,GermanyReceived29May2007;receivedinrevisedform10October2007;accepted15October2007Availableonline23October2007
AbstractAftercarefultailoring,compositestructurescanprovideareasonablewellresponsetoimpactloadswiththeadditionaladvantagesofweightsavingsandstructuralstiffness.Inordertoefficientlydesigncompositestructuresforimpactloads,reliablenumericalmodelsarerequiredandsufficientlyaccuratematerialcodesarenecessary.Thispaperdealswiththeexperimentalinvestigationofcarbonreinforcedcompositesunderlow-velocityimpactanditsnumericalmodellingwithanorthotropiccontinuousdamage-basedmaterialapproachavailableinLSDYNA-3D.ExperimentalinvestigationsinaCharpytestrigwereconductedinordertoidentifykeyparametersinfluencingtheimpactdamageresistanceofcompositestructures.Usingtheexperimentalresults,anumericalstudyoftheimpactedspecimenswasperformedinLSDY-NA-3D.Solidelementsinconjunctionwithadamage-basedcompositematerialmodelwereusedtoperformthecalculations.Agoodcorrelationbetweenexperimentallyandnumericallyobtainedforcesandfailuremodeshasbeenachieved.Furthermore,thepracticalnumericalmodellingofcompositematerialsunderlow-velocityimpact,togetherwithrecommendationsandachievementstowardstheefforttomodeltheircomplexbehaviourunderhighdynamicimpactisdiscussed.Ó2007ElsevierLtd.Allrightsreserved.
Keywords:A.Composites;B.Impactbehaviour;C.Finiteelementanalysis(FEA);C.Damagemechanics
1.IntroductionCompositematerialsarewellknownfortheiroutstand-ingmechanicalpropertiesataspecificlowweight,whatallowsengineerstodesignslenderandstiffstructureswith-outlossofperformance.Despiteoftheirmanyvirtues,theyshowahighlycompleximpactbehaviourandareverysen-sitivetonon-visualdamagethatstronglyinfluencestheirresidualloadbearingcapability[1].Abroadclassificationoftheexperimentaltreatmentofimpactscanbeperformedbydistinguishingbetweeninlow,mediumandhighimpactvelocityevents.Forlow-velocityimpactevents,theusageofpendulumslikethe
onespresentintheCharpytest,droptowersordropweightshasbecomestandard[2].Aconsiderableamountofinformationisavailableaboutonimpactperformanceoflaminatesunderavarietyofloadingconditionsandrates[3].Unfortunately,impactdesignmethodologiesrelyontheirexperimentalboundaryconditionsandtheparticularlaminatesetup,sinceascal-ingoftheresultsisverydifficult.Theoccurrenceofusualfailuremodesunderlow-velocityimpactloadingcondi-tions,likedelamination,matrixtensilefracture,localisedcompressivefailureandfibreshearfailureisstronglydependentofthematerialconfiguration(fibretype,resintype,lay-up,andthickness),theloadingvelocityandpro-jectiletype.Inthisrespect,theCharpytestpresentedinthispaperwasusedasafastandcostefficientcomparisontool.Analternativefortheusuallyextensiveexperimentalproceduresistheusageofadvancednumericalmodellingtechniques.Butalthoughmostoftoday’scommercialFE
0266-3538/$-seefrontmatterÓ2007ElsevierLtd.Allrightsreserved.doi:10.1016/j.compscitech.2007.10.008
*Correspondingauthor.Tel.:+4935146338142;fax:+49351463
38143.E-mailaddress:fib@ilk.mw.tu-dresden.de(F.M.Ibraim).
www.elsevier.com/locate/compscitechAvailable online at www.sciencedirect.comCompositesScienceandTechnology68(2008)2391–2400COMPOSITES
SCIENCEANDTECHNOLOGYsoftwarelikeLSDYNA-3Darecapableofsimulating
impacteventsforisotropicmaterials,modellingcapabili-tiesforcompositecomponentsarelimitedtomodelfailureanddamageprogressionespeciallyinthicklaminates[4].Inthatrespect,failuremechanismsplayakeyrolesincetheycontrolthedeformationpathofastructure.ThebulkoffailurecriteriausedincrashandimpactmodellingisbasedontheworkofHashinetal.[6].Theusageoflinearelastic-itytodescribecompositebehaviouruntilthepointoffirstfailurehasalsofoundwidespreadacceptanceandistheformofchoiceinmostactualFEcodes.Incontrast,exper-imentalevidenceisthattheshearstiffnesswillbehavequitenon-linearlyevenatverylowshearstrainlevelswhereper-manentfailurehasnotbeenreached[7].Itisgenerallyacceptedthatafterverybriefelasticstrain-ing,theweakestlayerwillcrack,whichreducesthestiffnessofthelaminateinthedirectionoftheloadinapropor-tionalratio.ThisconceptwasfirstproposedbyLemaitre[8]formetalsandhasbeenextendedtocompositesbyMat-zenmilleretal.[9].Soutisetal.[10]establishedadirectrela-tionbetweenthecrackdensitygrowthsandthelossofstiffnessunderincreasingstaticloads.Inthefieldofcrashandimpactmodelling,Williamsetal.[11]implementeda2DdamagedegradationapproachforshellelementsinLSDYNA-3D.Ladevezeetal.[12]alsoimplementedastrain-controlled,damage-basedcompositemodelinPAM-CRASH,withthetreatmentofmatrixshearnon-linearitiesbymeansofaplasticityapproach.Oneofthefewcommerciallyavailablesolidorthotropicdamagemodelsforfibre-reinforcedcompositesisMAT161/162inLSDYNA-3D,whereamodifiedHashin[6]failurecriterionisusedforin-planeloadfailureanda