英文材科基实验报告Quantitative Determination of Volume Fraction of Graphite in Ductile Iron
- 格式:doc
- 大小:4.74 MB
- 文档页数:13
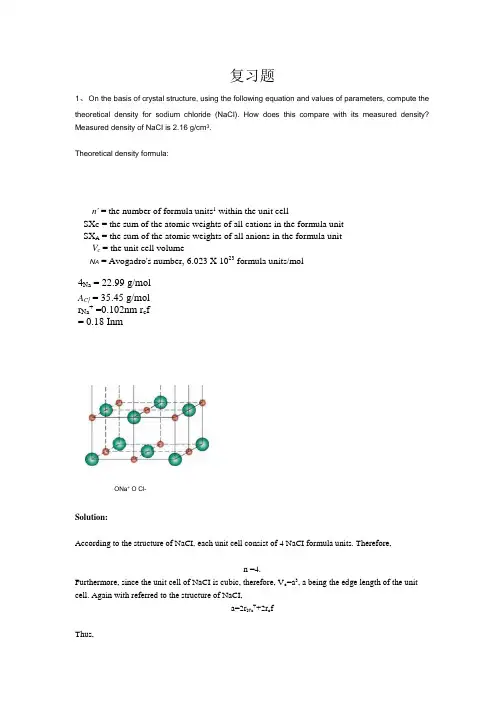
复习题1、On the basis of crystal structure, using the following equation and values of parameters, compute the theoretical density for sodium chloride (NaCI). How does this compare with its measured density? Measured density of NaCI is 2.16 g/cm3.Theoretical density formula:n' = the number of formula units1 within the unit cellSX C = the sum of the atomic weights of all cations in the formula unitSX A = the sum of the atomic weights of all anions in the formula unitV c = the unit cell volumeN A = Avogadro's number, 6.023 X 10²³ formula units/mol4Na = 22.99 g/molA C} = 35.45 g/molr Na+ =0.102nm r c f= 0.18 InmONa+ O Cl-Solution:According to the structure of NaCI, each unit cell consist of 4 NaCI formula units. Therefore,n =4.Furthermore, since the unit cell of NaCI is cubic, therefore, V c=a3, a being the edge length of the unit cell. Again with referred to the structure of NaCI,a=2r Na++2r c fThus,V c=(2r Na++2r C i_)3Using the theoretical density formula,_ 〃'(4卬+ 4q)P = (2『3 + 2,C1 )3'A_ 4(22.99 + 35.45)~ [2(0.102 X 10~7) + 2(0.181 X 10⁻⁷)]3(6.023 X 10²³)=2.14 g/cm3This value agrees fairly well with the experimental value.2、Calculate the number of vacancies per cubic meter in gold at 900°C. The energy for vacancy formation is 1.602xl0'19 J/atom. Furthermore, the density and atomic weight for Au are 18.63 g/cm3 (at 900°C) and 196.9 g/mol, respectively.N〃 = B (-新N v: number of equilibrium vacanciesN: total number of atomic sitesQ v: formation energy of a vacancyk: Boltzmann constant (1.38xlO'23J/K)T: temperature in KelvinSolution:In order to calculate the number of vacancies per cubic meter in gold at 900°C, it has to be known the total number of atomic sites per cubmic meter in gold first. N can be computed as,N=(18.63xl06g/m3/196.9 g/mol)x6.02xl023=5.7xl028Substituting the calculated N and other parameters into the equation, we have- ( 1.602 x 10T9 \N v = 5.7 x 1028 exp —~~——~——~~—— = 2.87 X 1024v 1.38 x 10-23 x (900 + 273)J3、Explain the relative orientation between Burgers vector and dislocation line for edge dislocation, screw dislocation, and mixed dislocation.Solution:For edge dislocation, Burgers vector is perpendicular to the dislocation line.For screw dislocation, Burgers vector is parallel to the dislocation line.For mixed dislocation, the angle between Burgers vector and dislocation is higher than 0° but lower than 90°.4、For both FCC and BCC crystal structures, there are two different types of interstitial sites. In each case, one site is larger than the other; and is normally occupied by impurity atoms. For FCC, this larger one is located at the center of each edge of the unit cell; it is termed an octahedral interstitial site. On the other hand, with BCC the larger site type is found at positions 0 % %; it is termed a tetrahedral interstitial site. For both FCC and BCC crystal structures, compute the radius r of an impurity atom that will just fit into one of these sites in terms of the atomic radius R of the host atom.Solution:Assuming the lattice parameter of both FCC and BCC crystal structures is a.Then, for FCC structure, a 2 + a 2 = (4R)2For octahedral interstitial position, 1, L 、r 0 = -(2V2R - 2R )= 0.414RFor tetragonal interstitial position, I a o a~ a~~「T =北产 + 0 + (J = °・225RFor BCC structure, a 2 + a 2 + a 2 = (4R)2For octahedral interstitial position, 1/4V3 \r 0 - 2(~R-2R ) = 0・155RFor tetragonal interstitial position,2V3 , V3 o (—R)2 + (—R)2 - R = 0.291R O sites T sitesBCCA copper-nickel alloy of composition 70 wt% Ni-30 wt% Cu is slowly heated from a temperature of 1300°C (2370°F).(a) At what temperature does the first liquid phase form?(b) What is the composition of this liquid phase?(c) At what temperature does complete melting of the alloy occur?(d) What is the composition of the last solid remaining prior to complete melting?Composition (at% Ni)(Cu) Composition (wt% Ni) (Ni)Is it possible to have a copper-nickel alloy that, at equilibrium, consists of an a phase of composition 37 wt% Ni-63 wt% Cu, and also a liquid phase of composition 20 wt% Ni-80 wt% Cu? If so, what will be the approximate temperature of the alloy? If this is not possible, explain why.Composition (at% Ni)(Cu) Composition (wt% Ni) (Ni)Solution:No, it is not possible to have such an alloy. From the phase diagram, it can be seen that if the composition of a phase is 37wt.%Ni-63wt.%Cu, at equilibrium, the corresponding composition of liquid phase should be 22wt.%Ni-78wt.%Cu.7、(a) Using the NaCl-H?。
Ministry of DefenceDefence Standard 02-713Issue 2 Publication Date 13 April 2006 Determination of the Toxicity Index of the Products of Combustion from SmallSpecimens of MaterialsCategory 2Def Stan 02-713 Issue 2Intentionally Blank iiDef Stan 02-713 Issue 2ContentsForeword (v)Introduction (viii)1 Scope (1)2 Warning (1)References (1)3 Normative4 Principle (2)5 Definitions (2)descriptionof the test method (2)6 General7 Apparatus (3)7.1 General (3)7.2 Test chamber (see also Annex B) (3)7.3 Burner (3)7.4 Thermocouple (4)7.5 Specimen support (4)7.6 Timingdevice (4)7.7 Sampling and analytical equipment (4)7.8 Use of colorimetric gas reaction tubes (5)7.9 Measurement of Hydrogen Bromide (HBr) using colorimetric gas reaction tubes (5)specimens (6)8 Test8.1 Applicability (6)8.2 Conditioning (7)8.3 Form of test specimens (7)specimen mass (8)8.4 Testtest specimens (8)of8.5 Numberof operators (8)9 Safety10 Procedure (9)offlame temperature (9)10.1 Measurementprocedure (9)10.2 Test11 Determination of background (burner) correction for carbon monoxide (CO), carbondioxide (CO2) and oxides of nitrogen (NO X) (11)11.1 Number of background corrections (11)11.2 Procedure for determining background corrections (11)of Toxicity Index (12)12 Calculationreport (13)13 TestAnnex A Toxic constituents to be analysed and their Critical Factors, Cf (15)Annex B Toxicity test chamber (16)iiiDef Stan 02-713 Issue 2Annex C Informative References (18)FiguresFigure B.1 Front view of a typical toxicity chamber (16)Figure B.2 View of extraction damper shown in the open position and roof mounted mixing fan (17)ivDef Stan 02-713 Issue 2ForewordAMENDMENT RECORDAmd No Date Text Affected Signature and DateREVISION NOTEThis standard is raised to Issue 2 to update its content.HISTORICAL RECORDThis standard supersedes the following:Defence Standard 02-713 Issue 1 01 April 2000NES 713 Issue 3 March 1985Sponsorship1. This Defence Standard (Def Stan) is sponsored by the Defence Procurement Agency, Ministry ofDefence (MOD).2. The complete Def Stan Issue comprises:Procedures for (Def Stan 02-713 Issue 2) Determination of the Toxicity Index of the Products of Combustion from Small Specimens of Materials3. If it is found to be unsuitable for any particular requirement the MOD is to be informed in writing of thecircumstances.4. Any user of this Defence Standard either within MOD or in industry may propose an amendment to it.Proposals for amendments that are not directly applicable to a particular contract are to be made to the publishing authority identified on rear cover, and those directly applicable to a particular contract are to be dealt with using contract procedures.5. No alteration is to be made to this Defence Standard except by the issue of an authorised amendment.6. Unless otherwise stated, reference in this Defence Standard to approval, approved, authorised or similarterms, means the Ministry of Defence in writing.7. Any significant amendments that may be made to this Defence Standard at a later date will be indicatedby a vertical sideline. Deletions will be indicated by 000 appearing at the end of the line interval.8. Extracts from British Standards within this Defence Standard have been included with the permission ofthe British Standards Institution.vDef Stan 02-713 Issue 2Conditions of ReleaseGeneral9. This Defence Standard has been devised solely for the use of the MOD, and its contractors in theexecution of contracts for the MOD. To the extent permitted by law, the Crown hereby excludes all liability whatsoever and howsoever arising (including but without limitation, liability resulting from negligence) for any loss or damage however caused when the Defence Standard is used for any other purpose.10. This document is Crown Copyright and the information herein may be subject to Crown or third partyrights. It is not to be released, reproduced or published without written permission of the MOD.11. The Crown reserves the right to amend or modify the contents of this Defence Standard withoutconsulting or informing any holder.MoD Tender or Contract Process12. This Defence Standard is the property of the Crown. Unless otherwise authorised in writing by the MODmust be returned on completion of the contract or submission of the tender in connection with which it is issued.13. When this Defence Standard is used in connection with a MOD tender or contract, the user is to ensurethat he is in possession of the appropriate version of each document, including related documents, relevant to each particular tender or contract. Enquiries in this connection may be made of the Authority named in the tender or contract.14. When Defence Standards are incorporated into contracts, users are responsible for their correctapplication and for complying with contractual and other statutory requirements. Compliance with a Defence Standard does not of itself confer immunity from legal obligations.Categories of Naval Defence Standard15. The Category of this Naval Defence Standard has been determined using the following criteria:a) Category 1. If not applied may have a Critical affect on the following:Safety of the vessel, its complement or third parties.Operational performance of the vessel, its systems or equipment.b) Category 2. If not applied may have a Significant affect on the following:Safety of the vessel, its complement or third parties.Operational performance of the vessel, its systems or equipment.Through life costs and support.c) Category 3. If not applied may have a Minor affect on the following:MOD best practice and fleet commonality.Corporate experience and knowledge.Current support practice.viDef Stan 02-713 Issue 2 Related Documents16. In the tender and procurement processes the related documents in each Section and Annex A can beobtained as follows:a) British Standards British Standards Institution,Road,389HighChiswickW44ALLondon,b) Defence Standards Defence Procurement AgencyMoDtheofAnExecutiveAgencyStandardization,UKDefenceHouseKentigernStreet,Brown65Glasgow, G2 8EXc) Other documents Tender or Contract Sponsor to advise.17. All applications to Ministry Establishments for related documents are to quote the relevant MODInvitation to Tender or Contract Number and date, together with the sponsoring Directorate and the Tender or Contract Sponsor.18. Prime Contractors are responsible for supplying their subcontractors with relevant documentation,including specifications, standards and drawings.Health and SafetyWarning19. This Defence Standard may call for the use of processes, substances and procedures that may beinjurious to health if adequate precautions are not taken. It refers only too technical suitability and in no way absolves either the supplier or any user from statutory obligations relating to health and safety at any stage of manufacture or use. Where attention is drawn to hazards, those quoted may not necessarily be exhaustive.20. This Defence Standard has been written and is to be used taking into account the policy stipulated inJSP430: MOD Ship Safety Management System Handbook.Additional Information(There is no relevant information)viiDef Stan 02-713 Issue 2IntroductionThis Def Stan. has been revised to introduce a number of new provisions relating to the form of test specimens to be used and to bring it into line with current equipment and procedures.The new provisions relating to specimen form supplement existing requirements. The results are sensitive to variations in the mass and geometry of test specimens and where they are to be used to make comparisons between different materials or with previous results, tests must be carried out using identical specimen configurations.The requirement to analyse the combustion products for phosgene (COCl2) has been removed in this revision. This has been done because experience reported to the sponsor by laboratories using the standard, is that phosgene has never been detected in this test.The procedure for determining background (burner) corrections for carbon monoxide (CO), carbon dioxide (CO2) and oxides of nitrogen (NO X) has been modified to improve its efficacy.The remainder of the text has been revised to bring it into line with current equipment and procedures. For reasons of continuity, this revision is not intended to introduce any other changes that would impact on results for materials tested using any given specimen form and which do not produce phosgene. This is to ensure that Toxicity Index values, obtained in accordance with this version of the standard (i.e. Def Stan. 02-713 Issue 2) are comparable with those obtained according to the previous version (i.e. Def Stan. 02-713 Issue 1, Publication date 01 April 2000, which also incorporated Naval Engineering Standard (NES) 713 Issue 3 March 1985, to which it was technically identical).Due to errors in automated transcription, incorrect values of the Critical factors (Cf) for Ammonia (NH3) and Hydrogen Chloride (HCl) appeared in an unofficial version of Def Stan. 02-713 Issue 1 (Reformatted) that was previously available to download from the Internet. The correct values are Cf (NH3) = 750 ppm and Cf (HCl) = 500 ppm. These have remained unchanged from those originally stated in NES 713 and are as stated in the official version of Def Stan. 02-713 Issue 1 which is available for contractual purposes from D Stan. There is no intention to change any of the Cf values for Def Stan. 02-713 Issue 2 and those quoted in the table at Annex A are correct.Users should be aware that the MOD sponsor (DPA/STGMT) is participating in a NATO standardization committee task to develop a common agreed test method and associated acceptance criteria for toxicity of fire effluents, which it is intended will eventually replace Def Stan. 02-713. The NATO test method is described in AFAP-3 “NATO Reaction-to-fire tests for materials - Toxicity of Fire Effluents”, which forms part a series of Allied Fire Assessment Publications (AFAPs). These support a NATO Standardisation Agreement, STANAG 4602 (Edition 1) “Fire Assessment of Materials”, which has been ratified and was promulgated on 18th November 2004. Work to develop acceptance criteria is continuing and when complete it is intended that the use of AFAP-3 will be phased in to replace Def Stan. 02-713.AFAP-3 is based on a tubular furnace fire model and tests are conducted separately at two temperatures, 350°C and 800°C. It defines a wider range of gases to be analysed, using a selection of modern analytical techniques. The Cf values used in AFAP-3 have been revised, but note that these revised figures are not used in this Def Stan. AFAP-3 is currently undergoing further development to establish repeatability and reproducibility data and to develop acceptance criteria.viiiDef Stan 02-713 Issue 2 Standards for Defence - Determination of the Toxicity Index of the Products of Combustion from Small Specimens of Materials1 Scope1.1 This Defence Standard (Def Stan.) gives the requirements for one of a series of test methods for determining the fire characteristics of materials, which are referred to in Def Stan. 07-247.1.2 The test explores the toxicity of the products of combustion in terms of a limited set of small molecular species arising when a small specimen of a material is completely burnt under specified conditions.1.3 The test is intended to form part of the pre-selection screening process for materials and should not be interpreted as an assessment of toxicity hazard under actual fire conditions. The test method is directed at the analysis of a specified set of gaseous species, which are commonly present in combustion products of materials used in military applications and which may cause lethality at the time of the fire. It does not address acute mental incapacitation effects, delayed/long term toxicity, or toxicity involving particulate combustion products. The set of gaseous species analysed is not exhaustive and the test does not necessarily determine the total toxicity of all the constituents of the products of combustion.1.4 The test does not attempt to account for the influence of the rate of combustion of a material on its contribution to toxicity hazard.2 WarningThe Ministry of Defence (MOD), like its contractors, is subject to both United Kingdom and European laws regarding Health and Safety at Work. All Defence Standards either directly or indirectly invoke the use of processes and procedures that could be injurious to health if adequate precautions are not taken. Defence Standards or their use in no way absolves users from complying with statutory and legal requirements relating to Health and Safety at Work.3 Normative References3.1 The publications shown below are referred to in the text of this standard. Publications are grouped and listed in alpha-numeric order.BS EN ISO 291 Plastics - Standard atmospheres for conditioning and testing.Def Stan. 07-247 Selection of materials on the basis of their fire characteristics.3.2 Reference in this Standard to any normative references means in any Invitation to Tender or contract the edition and all amendments current at the date of such tender or contract unless a specific edition is indicated.3.3 In consideration of clause 3.2 above, users shall be fully aware of the issue and amendment status of all normative references, particularly when forming part of an Invitation to Tender or contract. Responsibility for the correct application of standards rests with users.1Def Stan 02-713 Issue 23.4 DStan can advise regarding where normative references documents are obtained from. Requests for such information can be made to the DStan Helpdesk. How to contact the helpdesk is shown on the outside rear cover of Def Stans. 4 PrincipleAnalytical data of certain small molecular gaseous species arising when the material is completely burnt under specified conditions, are mathematically computed, using the exposure level (in ppm) of each gas to produce fatality in 30 minutes as a base, to derive a combined toxicity index.5 Definitions5.1θCConcentration (ppm) relative to 100g in 1m 3The concentration of the gas (ppm), produced under the conditions of the test , scaled up for 100 grams of material and re-calculated as though the combustion products were diffused into a volume of 1 m 3.5.2CfCritical factorThe concentration (ppm) of a gas considered fatal to man for a 30 minute exposure.5.3CiConcentration of gas measured in the test chamber in ppm.5.4Toxicity IndexThe summation of the toxicity factors (/Cf) of selected gases produced by the combustion of a material under the conditions specified in the test.θC 5.5Manufacturing batchThe quantity of material produced from the same set of starting materials, under the same process conditions, and on the same equipment in the same campaign.5.6Production materialMaterial having the same composition, produced from the same raw materials, by the same process/process conditions, on the same equipment and at the same location as the material to be supplied for end use under the contract/order in which this Def Stan has been specified.6 General description of the test method6.1 Small specimens of pre-determined mass (usually approximately 1 gram) are completely burnt insidea sealed chamber of volume 0.7 - 1.0 m 3, using a Bunsen burner fed with air and gas to give a non-luminous (blue) flame, having a temperature of 1150 ± 25°C. 6.2 The resulting chamber atmosphere is quantitatively analysed for a specified set of gases. Background corrections are subtracted for the amounts of carbon monoxide, carbon dioxide and oxides of nitrogen produced by the burner.26.3 For each gas, the measured concentration (Ci) is scaled up for 100 g of material and re-calculated asthough the combustion products were diffused into a volume of exactly 1 m 3. The resulting concentration() is expressed as a ratio of the Critical factor (Cf), which is equal to the concentration of that gasconsidered fatal to man for a 30 minute exposure. The ratios (/Cf) are summed for all gases detected togive a Toxicity Index (TI) for the material. θC θC 7 Apparatus7.1 GeneralAs far as is possible, all items of equipment within the test chamber shall be constructed of, or coated with,an inert (non-absorbent) non-metallic material.7.2 Test chamber (see also Annex B)7.2.1 The chamber shall consist of an airtight enclosure of between 0.7 m 3 and 1.0 m 3 in volume, linedwith opaque plastic sheeting, having a hinged or sliding door, fitted with a transparent plastic panel, such aspolycarbonate.7.2.2 Some gaseous products of combustion may react with or be adsorbed on the walls of the chamber.The materials of construction must be chosen to minimise this and a lining of polypropylene has been foundsatisfactory.7.2.3 The chamber shall be fitted with a forced air extraction system which can be closed (so that it isairtight) at the exit from the chamber when required and is capable of being operated from outside thechamber.7.2.4 The chamber shall be fitted with sampling positions, such that the airtight integrity of the chamber isnot impaired.NOTE When using colorimetric gas reaction tubes (see Clause 7.8) it is convenient to provide at least 12 ports forgas sampling, in addition to the ports to allow passage of the gas and air supply lines, plus any cabling if an electronicigniter is used (see Clause 7.3.2).7.2.5 The chamber shall contain a mixing fan capable of being switched on and off externally. The fanshall be mounted horizontally and centrally inside the chamber at roof level and shall be capable of ensuringrapid mixing of combustion products.NOTE Two suitable designs are known to be in use: a 135 mm diameter (7 blade) fan rated at 325 m 3/hr and a200 mm diameter (6 blade) fan rotating at 1200 to 1500 r.p.m.7.3 Burner7.3.1 The burner shall provide a non-luminous (blue) flame 100 to 125 mm in height (measured to the tipof the outer blue cone), having a temperature of 1150 ± 25°C at its hottest point. A Bunsen burner operatingon natural gas or methane (see NOTE 1) having a gross calorific value of 35 to 40 MJ/m 3 and modified toprovide an external supply of air connected to the burner collar shall be used.NOTE 1 UK natural gas consists essentially of methane and typically has a calorific value of approximately 38 to 40 MJ/m 3. The calorific value of laboratory grade methane is approximately 36 MJ/m 3.NOTE 2 For example, a Bunsen burner of 125 mm overall height, 11 mm bore burner column and 5 mm bore gas andair supply pipes have been found suitable. With this equipment, flow rates of approximately 2 litres per minute for gas(methane) and approximately 15 litres per minute (air), have been found suitable. Other configurations of equipment,which may require different flow rates, may be used provided the flame characteristics specified in Clause 7.3.1 areachieved.NOTE 3 Unsatisfactory results would be obtained using a conventional Bunsen burner drawing air from within the chamber. The effect is oxygen depletion and a consequential reduction of burner flame temperature, or even extinguishment, during the combustion period of a test causing loss of standard conditions.7.3.2 Provision shall be made for igniting and extinguishing the burner, from outside the chamber, either using a small pilot flame on a separate gas supply or an externally operated electric spark ignition system.7.4 ThermocoupleA thermocouple suitable for measuring the temperature of the burner flame described in Clause 7.3.1, to an accuracy of ± 3°C.NOTE For example an Inconel or stainless steel sheathed mineral insulated K-type thermocouple probe, with an external diameter of 1.5 mm, has been found suitable.7.5 Specimen support7.5.1 A device shall be provided capable of supporting the test specimen over the Bunsen burner without significantly masking it from the flame.7.5.2 The support shall be an annulus cut from a non–combustible material such as sheet steel nominal thickness 2 - 4 mm of approximately 90 - 100 mm overall diameter, with a 75 mm diameter hole carrying temperature resistant wires approximately 10 mm apart to form a lattice. The complete assembly shall be equipped with a non–combustible side support arm to give a ‘tennis racket’ appearance.NOTE The wires used to form the lattice must be of sufficient heat resistance to withstand exposure to the burner for the required test time, but without masking the specimen from the flame. For example, Nickel-chromium alloy wire 0.5 - 0.6 mm in diameter has been found suitable.7.6 Timing deviceThe timing device shall be capable of measuring periods up to 5 minutes to an accuracy within ± 1 second. 7.7 Sampling and analytical equipment7.7.1 The equipment shall be capable of sampling the chamber atmosphere and carrying out quantitative analysis of those gases in the products of combustion detailed in Annex A. (See also Clause 7.9 concerning measurement of Hydrogen Bromide).7.7.2 The measurement range of the system shall be suitable for quantifying the gases at concentrations that result from combustion of specimens of the required dimensions (see Clause 8), within the sealed chamber of the required volume (see Clause 7.2.1).7.7.3 The equipment shall be capable of carrying out sampling of the chamber atmosphere within a maximum of 25 minutes.7.7.4 The preferred method is the use of commercially available colorimetric gas reaction tubes in conjunction with dedicated sampling pumps supplied by the manufacturer (see Clause 7.8 Note 2).7.7.5 Other analytical systems may be used with the prior agreement of the technical authority named in the tender or contact for which this Def Stan. is specified.7.7.6 The sampling/analytical technique and its measurement range, used for each gas, shall be stated in the test report (see Clause 13).7.7.7 In order to minimise losses of certain toxic products through adsorption, condensation, etc, prior to measurement, all sampling lines shall be as short as possible.7.8 Use of colorimetric gas reaction tubes7.8.1 Once combustion of the specimen is complete and after stirring, a controlled volume of chamber atmosphere is drawn through the colorimetric gas reaction tubes via sampling ports. Unique tube types are provided for each gas, which contain indicator chemicals that have a specific reaction with the particular gas, leading to a colour change. The length of the resulting colour indication is measured against a printed scale on the side of the tube that gives a direct reading of the concentration of the gas.7.8.2 Follow the instructions given by the manufacturer for reading the length of the colour indication against the scale graduations. In addition:a) Readings in between the graduations may be estimated visually, noting that the scales on some types oftube are not linear.b) However, if there is a colour indication at the start of a tube which does not reach the lowest graduationon the scale, use zero as the value of the concentration, Ci, for that determination of the gas (see Clause 12.2).7.8.3 The operation of the tubes and pumps shall be in accordance with the manufacturer’s instructions. NOTE 1 This usually requires that the pumps are leak tested each day prior to use.NOTE 2 Tubes are usually configured for the particular flow characteristics of the pumps provided by their own manufacturer, and hence should only be used in conjunction with appropriate equipment.7.8.4 The tubes shall be sited within the chamber itself, as depicted in Annex B, Fig B.1, in order to minimise losses through adsorption, condensation, etc.7.8.5 A sufficient number of pumps shall be provided to enable sampling through all of the tubes to be completed within 25 minutes of the end of the burn time.NOTE It is convenient to provide a number of automatic pumps, so that several tubes can be sampled simultaneously.7.8.6 It is known that for some gases, the indicator chemicals in the tubes have a cross sensitivity to gas species other than those that they are designed to measure. Where appropriate, the possibility of such interferences shall be stated in the test report, but no attempt shall be made to take account of these interferences in the calculation of the Toxicity Index. (An exception to this is the measurement of HBr, see Clause 7.9).7.8.7 It is known that for some gases the stain in the indicator chemicals can fade in a relatively short period of time. These tubes shall be read as soon as possible after the gas sample has been drawn through them.NOTE For example, one type of tube for the measurement of ammonia has been known to exhibit this behaviour. 7.9 Measurement of Hydrogen Bromide (HBr) using colorimetric gas reaction tubes7.9.1 There are currently no colorimetric gas reaction tubes available that are specifically designed to measure hydrogen bromide (HBr). However, some types of tube that are designed for measurement of other gases, are known to give a reading in the presence of HBr, although with a different measurement sensitivity (see EXAMPLE below).7.9.2 For the purposes of this Def Stan it is permissible to make use of these tubes, taking account of the different measurement sensitivity. Alternatively, other analytical techniques may be used (see Clause 7.7.5). If detected, the method used to determine the contribution to Toxicity Index of HBr shall be stated in the test report.EXAMPLE Information for one commonly used make of hydrochloric acid tube is that it will give a reading in the presence of HBr, but with a measurement sensitivity from approximately 1 to 0.3 times that for HCl. (The following is shown schematically overleaf).If this tube gives a zero reading, this may be taken to indicate that HBr (as well as HCl) is not present in thecombustion products.When this tube gives a non-zero reading, it is necessary to distinguish whether the reading is due to HCl, orto HBr, or to a mixture of both of these gases.This may conveniently be achieved by undertaking a separate elemental analysis of the material under test.The “Lassaigne” sodium fusion test is a cost effective and convenient method that has been used for thispurpose, but other analytical techniques may be used. This will determine whether or not the materialcontains bromine (Br) and therefore whether its combustion products could contain HBr.If the material does not contain Br, then the reading on the tube is due to HCl only and the value indicated onthe tube can be used in the normal way, directly as the concentration (Ci) of HCl in the test chamber.If Br or both Br and Cl are present in the material, then the least favourable case (highest possible value of) would be given by treating the reading on the tube as if it were all due to HBr. HBr has the lower Cfvalue (Cf(HBr) = 150, Cf(HCl) = 500) and the tubes are up to (approximately) three times less sensitive toHBr, than they are to HCl, for which the scale on the side of the tube is calibrated. It is therefore necessaryto divide the concentration value indicated on the tube by 0.3 and use the figure obtained as Ci, for HBr, tocalculate a value of for HBr in Clause 12.2. A worst case Toxicity Index contribution (/Cf) is thencalculated using the Cf value for HBr (see Clause 12.4).θC θC θCExample of process for measurement of hydrogen bromide (HBr)using one type of hydrochloric acid gas reaction tube8 Test specimens8.1 Applicability8.1.1 Samples supplied for testing shall be virgin material (i.e. unused), shall be clean/uncontaminatedand shall be taken from a single manufacturing batch.NOTE The definition of a manufacturing batch is given in Clause 5.。
Standard Test Method forFlame Resistance of Textiles (Vertical Test)1This standard is issued under the fixed designation D 6413;the number immediately following the designation indicates the year of original adoption or,in the case of revision,the year of last revision.A number in parentheses indicates the year of last reapproval.A superscript epsilon (´)indicates an editorial change since the last revision or reapproval.1.Scope1.1This test method is used to measure the vertical flame resistance of textiles.1.1.1As a part of the measure of flame resistance,after-flame and afterglow characteristics are evaluated.1.2This standard shall be used to measure and describe the response of materials,products,or assemblies to heat and flame under controlled laboratory conditions and shall not be used to describe or appraise the fire hazard or fire risk of materials,products,or assemblies under actual fire conditions.1.3The values stated in either SI units or other units are to be regarded separately.The values stated in each system are not exact equivalents;therefore,each system shall be used inde-pendently without combining values.1.4This standard does not purport to address all of the safety concerns,if any,associated with its use.It is the responsibility of the user of this standard to establish appro-priate safety and health practices and determine the applica-bility of regulatory limitations prior to use.2.Referenced Documents 2.1ASTM Standards:2D 123Terminology Relating to TextilesD 1776Practice for Conditioning and Testing Textiles D 4391Terminology Relating to The Burning Behavior of Textiles 3.Terminology3.1Definitions —For definitions of terms relating to the combustion of textiles,see Terminology D 4391.For defini-tions of other textile terms used in this test method,refer to Terminology D 123.3.2Definitions of Terms Specific to This Standard:3.2.1afterflame ,n —persistent flaming of a material after the ignition source has been removed.3.2.2after-flame time ,n —the length of time for which a material continues to flame after the ignition source has been removed.3.2.3afterglow ,n —glow in a material after the removal of an external ignition source or after the cessation (natural or induced)of flaming of the material.3.2.4afterglow time ,n —the time afterglow continues after the removal of the ignition source and the cessation of flaming.3.2.5char length ,n —in measuring flame resistance of textiles ,the distance from the fabric edge,which is directly exposed to the flame to the furthest point of visible fabric damage after a specified tearing force has been applied.3.2.6charring ,n —the formation of carbonaceous residue as the result of pyrolysis or incomplete combustion.3.2.7flame ,n —as related to ignition of textiles ,a controlled hot,luminous zone of gas or matter in gaseous suspension,or both,of constant size and shape that is undergoing combustion as evidenced by a low-intensity heat flux of less than 1kw,such as candle flame or match flame.3.2.8flame application time ,n —the time interval for which the ignition flame is applied to a material.3.2.9flame resistance ,n —the property of a material whereby flaming combustion is prevented,terminated,or inhibited following application of a flaming or nonflaming source of ignition,with or without subsequent removal of the ignition source.3.2.10glow ,n —visible,flameless combustion of the solid phase of a material.3.2.11ignition ,n —the initiation of combustion.3.2.12melting ,n —a liquification of material under the influence of heat.3.2.13smoldering ,n —the combustion of a solid material without accompaniment of flame but generally with the pro-duction of smoke.4.Summary of Test Method4.1A specimen is positioned vertically above a controlled flame and exposed for a specified period of time.The flame then is removed,and afterflame time and afterglow time are measured.4.2Char length is measured under a specified force.1This test method is under the jurisdiction of ASTM Committee D13Textiles and is the direct responsibility of Subcommittee D13.52on Flammability.Current edition approved July 15,2008.Published October 2008.Discontinued in 2008and reinstated as D 6413–st previous edition approved in 1999as D 6413–99.2For referenced ASTM standards,visit the ASTM website,,or contact ASTM Customer Service at service@.For Annual Book of ASTM Standards volume information,refer to the standard’s Document Summary page on the ASTM website.Copyright ©ASTM International,100Barr Harbor Drive,PO Box C700,West Conshohocken,PA 19428-2959,UnitedStates.垂直燃烧仪 ASTM D6413–08标准实验(英文版)4.3Any evidence of melting or dripping is noted.5.Significance and Use5.1This test method determines the response of textiles to a standard ignition source,deriving measurement values for afterflame time,afterglow time,and char length.5.2The verticalflame resistance,as determined by this test method,only relates to a specifiedflame exposure and appli-cation time.5.3This test method maintains the specimen in a static, draft-free,vertical position and does not involve movement except that resulting from the exposure.5.4Test Method D6413has been adopted from Federal Test Standard No.191A method5903.1,which has been used for many years in acceptance testing.The between-laboratory precision of this test method has not been established.Refer to Section14for single-laboratory precision.5.4.1If there are differences or practical significance be-tween reported test results for two laboratories(or more), comparative tests should be performed to determine if there is a statistical bias between them,using competent statistical assistance.As a minimum,the test samples used should be as homogeneous as possible,that are drawn from the material from which the disparate test results are obtained,and that are assigned randomly in equal numbers to each laboratory for testing.Other materials with established test values may be used for this purpose.The test results from the two laboratories should be compared using a statistical test for unpaired data,at a probability level chosen prior to the testing series.If a bias is found,either its cause must be found and corrected,or future test results must be adjusted in consideration on the known bias.6.Apparatus6.1Test Cabinet and Accessories,fabricated in accordance with the requirements specified in Figs.1-5.Galvanized sheet metal or other suitable metal can be used.The entire inside back wall of the cabinet shall be painted black to facilitate the viewing of the test specimen and pilotflame.6.1.1The test cabinet shall be set up in a laboratory hood or with comparable equipment so that combustion gases can be removed from the test lab environment.Precautions must be taken to minimize the draft through the laboratory hood while testing.Open doors or windows are examples of unnecessary causes of drafts and must be avoided.A ventilation smoke tube kit3may be used to check for the presence of drafts.6.2Burner,equipped with a needle valve to adjustflame height(see Fig.4).6.2.1The burner shall be constructed by combining a10 mm(0.38in.)inside diameter barrel7666mm(360.25in.) long with a base from an adjustable valve burner.A Tirrill burner is recommended,but a Bunsen burner modified to conform to this test method also will suffice.6.2.2The pilot light tube shall have an inside diameter of approximately1.5mm(0.06in.)and shall be spaced3mm (0.12in.)away from the burner edge.6.2.3Gas controls and connections shall be as specified in Fig.5.The solenoid valve shall be capable of being fully opened or fully closed in less than0.2s and activated by an adjustable timer.6.2.4On the side of the barrel of the burner,opposite the burner pilot light there shall be aflame height gage constructed of metal spaced approximately13mm(0.50in.)from the barrel and extending above the burner.The gage shall have two prongs approximately8mm(0.32in.)long marking the distances of19mm(0.75in.)and38mm(1.50in.)above the top of the burner.6.2.5The burner shall be movable when placed in the cabinet and capable of adjustments to center the burner directly below the center bottom edge of the specimen when perform-ing the tests.6.3Gas Regulator Valve System,a control system with a delivery rate designed to furnish gas to the burner under a pressure of17.261.7kPa(2.560.25lbf/in.2)at the burner inlet.The manufacturer’s recommend delivery rate for the valve system shall include the required pressure.6.4Gas Mixture,methane,99%pure.6.5Test Specimen Holder,constructed as shown in Fig.3. The assembly is shown in Figs.1and2.6.6Specimen Holder Clamps,capable offirmly holding the test specimen in the test specimen holder.6.7Laboratory Hood,in which to carry out the test.6.8Stop Watch,or other device to measure the burning time to0.2s.6.9Measuring Scale,graduated in increments of at least3 mm(0.12in.)to measure the length of char.6.10Metal Hooks and Weights—Metal hooks and a range of weights to produce a series of total loads,which will be used to determine char length.The metal hooks shall consist of 1-mm(0.04-in.)diameter steel wire,76mm(3in.)long.The hook is formed by bending the wire to45°angle forming a hook3mm(0.5in.)from one end.This hook is used for puncturing the fabric.6.11Flame Impingement Timer,a timer and electrical gas solenoid used to control the interval,which gas is supplied to the burner.7.Hazards7.1Normal precautions applicable to pressurizedflammable gases,openflames,hotflames,hot surfaces,burning fabrics and combustion,off gases and solid residue shall be employed.7.2Conduct the tests in a hood to contain the gases evolved during testing and for exhaust of the gases after each test. 8.Preparation of Apparatus8.1Adjust gas pressure to17.261.7kPa(2.5060.25 lbf/in.2)and ignite pilotflame.Adjust the pilotflame to a height of approximately3mm(0.12in.)when measured from its lowest point.Be sure that the tip does not alter shape of the test flame during the12s exposure time.8.1.1Adjust the burnerflame using the needle valve in the base of the burner to achieve aflame height of38mm(1.50 in.).This height is achieved by fully closing the air opening on the burner tube base and fully opening the solenoid valve.3A ventilation smoke tube kit is available from A-Line Safety Appliance Company,Pittsburgh,PA15230.N OTE 1—Tape may be used to close off the air openings on the burner.8.1.2Position the burner so that the middle of the lower edge of the specimen holder is centered 19mm (0.75in.)above the burner.N OTE 2—It may be necessary to turn off nearby lights to make sure of the accuracy of intersect of the midpoint of the flame with the mounting clamp.8.2Adjust the timer to provide a 1260.2-s flame to the specimen.N OTE 3—Using a hand-held timer or stopwatch,verify the flame time.8.2.1Do this by measuring the interval between the opening and closing of the solenoid with an accurate laboratory timer or stopwatch.9.Sampling9.1Primary Sampling Unit —Consider rolls of fabric or fabric components of fabricated assemblies to be the primary sampling unit,as applicable.9.2Laboratory Sampling Unit —As a laboratory sampling unit take from rolls at least one full-width piece of fabric that is 1m (1yd)long along the selvage (machine direction),after removing first a 1-m (1-yd)length.For fabric components of fabricated assemblies the entire assembly may be used.9.3Test Specimens —From each laboratory sampling unit,cut five lengthwise and five widthwise test specimens 76mm (3.0in.)by 300mm (12in.).For woven fabrics,the long dimensions are cut parallel to the warp yarns for lengthwise tests and parallel to the filling yarns for widthwise tests.TakeFIG.1Test ApparatusD 6413–08lengthwise specimens from different positions across the width of the fabric.Consider the long direction as the direction of the bel to maintain specimen identity.9.3.1Cut specimens representing a broad distribution di-agonally across the width of the laboratory sampling unit. Ensure specimens are free of folds,creases,or wrinkles.Avoid getting oil,water,grease,etc.,on the specimens when han-dling.9.3.2If the fabric has a pattern,ensure that the specimens are a representative sampling of the pattern.10.Conditioning10.1Bring the laboratory sampling units or test specimens to moisture equilibrium as directed in Practice D1776,except no preconditioning is necessary.10.2Each specimen to be tested shall be exposed to the test flame within4min after removal from the standard atmosphere or placed in a desiccator without desiccant or equivalent after conditioning for storage until testing and transfer to the testing area.11.Procedure11.1Mount and expose each specimen to theflame within4 min of removal from the conditioning area or storage.11.2Clamp the test specimen between the two halves of the holder,with the bottom of the specimen even with the bottom of the holder.With the holder held vertically,secure the specimen in the holder with a minimum of four clamps. Position two clamps near the top of the holder,one on each side to stabilize the specimen.Similarly,position two clamps at the bottom of the holder,one on each side.11.3Turn off the hood ventilation.Insert the specimen holder containing the specimen into the test cabinet and position the burner with the middle of the lower edge of the test specimen centered19mm(0.75in.)above the burner and leveled with the bottom metal prong.11.4Start theflame impingement timer and expose the specimen for the1260.2s.Observe the specimen for melting or dripping during theflame exposure.Record any observa-tions.Immediately after theflame is removed,start a stopwatch for measurement of the afterflame and afterglow time.11.5Observe how long the specimen continues toflame after the12s exposure time.Record the afterflame time to within0.2s.11.6Observe how long the specimen continues to glow after the afterflame ceases or after removal of theflame if there is no afterflame.Record this afterglow time to the nearest0.2s.Do not extinguish the glow because of potential effect on char length.11.7Remove the specimen holder from the test cabinet. Turn on the hood ventilation to clear the test cabinet of fumes and smoke.Allow the specimen tocool. FIG.2a Test Apparatus Construction Details11.8Measure the char length as shown in Fig.6.11.8.1Make a crease by folding the specimen along a line through the peak of the highest charred area and parallel to the sides of the specimen.11.8.2Puncture the specimen with the hook approximately 6mm(0.25in.)from the bottom edge and from the side edge of the specimen11.8.2.1Attach a weight of sufficient mass to give a combined mass of the weight with the hook that will result in the appropriate tearing force.See Table1to determine the designated total tearing force for fabrics of different basis weights.11.8.3Apply the tearing force as follows.Grasp the corner of the specimen on the opposite bottom fabric edge from where the hook and weight are attached.Raise the specimen upward in a smooth continuous motion until the total tearing force is supported by the specimen.Note any fabric tear in the charred area of the specimen.Mark the end of the tear with a line across the width of the specimen and perpendicular to the fold line.11.8.4Measure the char length along the undamaged edge of the specimen to the nearest3mm(0.12in.).12.Calculation12.1Afterflame Time—Calculate the average afterflame time to the nearest0.5s for the lengthwise and widthwise directions for each laboratory sample.12.2Afterglow Time—Calculate the average afterglow time to the nearest0.5s for the lengthwise and widthwise directions for each laboratory sample.12.3Char Length—Calculate the average char length to the nearest3mm(0.12in.)for the lengthwise and widthwise directions for each laboratory sample.13.Report13.1State that the samples were tested as directed in Test Method D6413.Describe the materials or product tested. 13.2Report the following fabric lengthwise and widthwise information for individual specimens,for the laboratory sam-pling unit and for the lot as applicable to a material specifica-tion or contract order.13.2.1Afterflame time.13.2.2Afterglow time.13.2.3Char length.13.2.4Occurrence of melting or dripping,if any.14.Precision and Bias14.1Precision4:14.1.1Single Laboratory Study—Sevenflame resistant wo-ven fabrics were tested in one laboratory,using one operator to 4Supporting data have beenfiled at ASTM International Headquarters and may be obtained by requesting Research Report RR:D13–1102. FIG.2b Test Apparatus Construction Details(continued)determine char length,afterflame time,and afterglow time and three values measured on each specimen by the procedure.Ten specimens were taken from each fabric sample,five in the lengthwise(machine)andfive in the widthwise(cross-machine)direction.This single-laboratory data set is analyzed and used in writing a temporary precision statement,pending a full interlaboratory study.Until the full study is completed, users of the test method are advised to exercise conventional statistical caution in making any comparisons of the test results.14.1.2Char Length—Variances for lengthwise and width-wise specimens are similar,ranging in value from0.043to 0.632,with an average value of0.320in.2(standard deviation= 0.566in.)as determined by analysis of variance.Critical differences,based on this value and a95%probability level, may be applied either to lengthwise average comparisons,or to widthwise average comparisons,to determine significance. 14.1.3Afterflame—Variances for lengthwise and widthwise specimens are similar,ranging in value from0.008to0.106 with an average value of0.0532(standard deviation=0.230) as determined by analysis of variance.Critical differences, based on this value and a95%probability level,may be applied either to lengthwise average comparisons,or to width-wise average comparisons,to determine significance.14.1.4Afterglow—Variances for lengthwise and widthwise specimens were more dissimilar,but became similar,when four fabrics,with lengthwise and widthwise variances less than 0.9and with an average value of0.278S2(standard deviation= 0.570)were placed in Group1,and two fabrics,with length-wise and widthwise variances greater than1.0and with an average value of1.870S2(standard deviation=1.367)are placed in Group2,both as determined by analysis of variance. One fabric could not be placed in either group.A table of critical differences is calculated for each of the two groups, based on each group’s variance value and a95%probability level.Apply the appropriate group table values,either to lengthwise average comparisons,or to widthwise average comparisons,depending on whether or not the variance values for the averages being compared fall closer to0.28or closer to 1.87.14.2Bias—The procedure of this test method produces a value that can be defined only in terms of a test.There is no independent,referee test method by which bias may be determined.This test method has no known bias.Tables2-4 15.Keywords15.1afterflame;afterglow;char length;flammability;tex-tiles;verticalflame FIG.3a Specimen Holder Construction DetailsFIG.3b Specimen Holder Construction Details(continued)FIG.4a Burner and Flame Height Gage ConstructionFIG.4b Burner and Flame Height Gage Construction(continued)FIG.5Schematic of Methane Gas Controls and AdjustmentsFIG.6a Char Length MeasurementFIG.6b Char Length Measurement(continued)TABLE1Tearing Force for Char Length Determination Fabric Basis Weight A Total Tearing Forceg/m2oz/yd2g oz68to203 2.0to6.0100 4.0over203to508over6.0to15.02008.0over508to780over15.0to23.030012.0over780over23.047516.0A The Fabric Basis Weight refers to the weight of cloth before the addition of any fire retardant treatment or coating.TABLE2Within-Laboratory Critical DifferencesChar Length(in.)(95%Probability Level)N A SE B CD C10.57 1.5830.330.9150.250.7170.210.60A N=Number of determinations per average.B SE=Standard Error for N determinations.C CD=2.8SETABLE3Within-Laboratory Critical DifferencesAfterflame(s)(95%Probability Level)N A SE B CD C10.230.6430.130.3750.100.2970.090.24A N=Number of determinations per average.B SE=Standard Error for N determinations.C CD=2.8SE.TABLE4Within-Laboratory Critical DifferencesAfterglow(s)(95%Probability Level)Group1(Variance approximately0.28)N A SE B CD C10.53 1.4830.300.8550.240.6670.200.56Group2(Variance approximately1.87)N SE CD1 1.37 3.8330.79 2.2150.61 1.7170.52 1.45A N=Number of determinations per average.B SE=Standard Error for N determinations.C CD=2.8SE.ASTM International takes no position respecting the validity of any patent rights asserted in connection with any item mentioned in this ers of this standard are expressly advised that determination of the validity of any such patent rights,and the riskof infringement of such rights,are entirely their own responsibility.This standard is subject to revision at any time by the responsible technical committee and must be reviewed everyfive years and if not revised,either reapproved or withdrawn.Your comments are invited either for revision of this standard or for additional standardsand should be addressed to ASTM International Headquarters.Your comments will receive careful consideration at a meeting of theresponsible technical committee,which you may attend.If you feel that your comments have not received a fair hearing you shouldmake your views known to the ASTM Committee on Standards,at the address shown below.This standard is copyrighted by ASTM International,100Barr Harbor Drive,PO Box C700,West Conshohocken,PA19428-2959, United States.Individual reprints(single or multiple copies)of this standard may be obtained by contacting ASTM at the aboveaddress or at610-832-9585(phone),610-832-9555(fax),or service@(e-mail);or through the ASTM website().11标准集团(香港)有限公司:http://www.standard-groups.com/。
3.2Definitions of Terms Specific to This Standard:3.2.1balanced laminate ,n —a continuous fiber-reinforcedlaminate in which each +u lamina,measured with respect to thelaminate reference axis,is balanced by a –u lamina of the samematerial (for example,[0/+45/–45/+45/–45/0]).3.2.2short-beam strength ,n —the shear stress as calculatedin Eq 1,developed at the specimen mid-plane at the failureevent specified in 11.6.3.2.2.1Discussion —Although shear is the dominant appliedloading in this test method,the internal stresses are complexand a variety of failure modes can occur.Elasticity solutions byBerg et al (1)7,Whitney (2),and Sullivan and Van Oene (3)have all demonstrated inadequacies in classical beam theory indefining the stress state in the short-beam configuration.Thesesolutions show that the parabolic shear-stress distribution aspredicted by Eq 1only occurs,and then not exactly,on planesmidway between the loading nose and support points.Awayfrom these planes,the stress distributions become skewed,withpeak stresses occurring near the loading nose and supportpoints.Of particular significance is the stress state local to theloading nose in which the severe shear-stress concentrationcombined with transverse and in-plane compressive stresseshas been shown to initiate failure.However,for the moreductile matrices,plastic yielding may alleviate the situationunder the loading nose (1)and allow other failure modes tooccur such as bottom surface fiber tension (2).Consequently,unless mid-plane interlaminar failure has been clearly ob-served,the short-beam strength determined from this testmethod cannot be attributed to a shear property,and the use ofEq 1will not yield an accurate value for shear strength.3.2.3symmetric laminate ,n —a continuous fiber-reinforcedlaminate in which each ply above the mid-plane is identicallymatched (in terms of position,orientation,and mechanicalproperties)with one below the mid-plane.3.3Symbols :b —specimen width.CV —sample coefficient of variation (in percent).F sbs —short-beam strength.h —specimen thickness.n —number of specimens.P m —maximum load observed during the test.x i —measured or derived property for an individual specimenfrom the sample population.x ¯—sample mean (average).4.Summary of Test Method4.1The short-beam test specimens (Figs.1-4)are center-loaded as shown in Figs.5and 6.The specimen ends rest ontwo supports that allow lateral motion,the load being appliedby means of a loading nose directly centered on the midpointof the test specimen.5.Significance and Use5.1In most cases,because of the complexity of internalstresses and the variety of failure modes that can occur in thisspecimen,it is not generally possible to relate the short-beam strength to any one material property.However,failures are normally dominated by resin and interlaminar properties,and the test results have been found to be repeatable for a given specimen geometry,material system,and stacking sequence (4).5.2Short-beam strength determined by this test method can be used for quality control and process specification purposes.It can also be used for comparative testing of composite materials,provided that failures occur consistently in the same mode (5).5.3This test method is not limited to specimens within the range specified in Section 8,but is limited to the use of a loading span length-to-specimen thickness ratio of 4.0and a minimum specimen thickness of 2.0mm [0.08in.].6.Interferences 6.1Accurate reporting of observed failure modes is essen-tial for meaningful data interpretation,in particular,the detec-tion of initial damage modes.7.Apparatus 7.1Testing Machine ,properly calibrated,which can be operated at a constant rate of crosshead motion,and which the error in the loading system shall not exceed 61%.The load-indicating mechanism shall be essentially free of inertia7Boldface numbers in parentheses refer to the list of references at the end of thisstandard.N OTE 1—Drawing interpretation per ANSI Y14.5-1982and ANSI/ASM B46.1-1986.N OTE 2—Ply orientation tolerance 60.5°relative to –B–.FIG.1Flat Specimen Configuration(SI)lag at the crosshead rate used.Inertia lag may not exceed 1%of the measured load.The accuracy of the testing machine shallbe verified in accordance with Practices E 4.7.2Loading Nose and Supports ,as shown in Figs.5and 6,shall be 6.00-mm (0.250-in.)and 3.00-mm (0.125-in.)diametercylinders,respectively,with a hardness of 60to 62HRC,asspecified in Test Methods E 18,and shall have finely groundsurfaces free of indentation and burrs with all sharp edgesrelieved.7.3Micrometers —For width and thickness measurements,the micrometers shall use a 4-to 5-mm (0.16-to 0.2-in.)nominal diameter ball interface on an irregular surface such asthe bag side of a laminate and a flat anvil interface on machinededges or very smooth tooled surfaces.A micrometer or caliperwith flat anvil faces shall be used to measure the length of thespecimen.The accuracy of the instrument(s)shall be suitablefor reading to within 1%of the sample dimensions.For typicalsection geometries,an instrument with an accuracy of 60.002mm (60.0001in.)is desirable for thickness and width mea-surement,while an instrument with an accuracy of 60.1mm(60.004in.)is adequate for length measurement.7.4Conditioning Chamber ,when conditioning materials atnonlaboratory environments,a temperature/vapor-level-controlled environmental conditioning chamber is required thatshall be capable of maintaining the required temperature towithin 63°C (65°F)and the required vapor level to within63%.Chamber conditions shall be monitored either on an automated continuous basis or on a manual basis at regular intervals.7.5Environmental Test Chamber ,an environmental test chamber is required for test environments other than ambient testing laboratory conditions.This chamber shall be capable of maintaining the test specimen at the required test environment during the mechanical test method.8.Sampling and Test Specimens 8.1Sampling —Test at least five specimens per test condi-tion unless valid results can be gained through the use of fewer specimens,as in the case of a designed experiment.For statistically significant data,consult the procedures outlined in Practice E 122.Report the method of sampling.8.2Geometry :8.2.1Laminate Configurations —Both multidirectional and pure unidirectional laminates can be tested,provided that there are at least 10%0°fibers in the span direction of the beam (preferably well distributed through the thickness),and that the laminates are both balanced and symmetric with respect to the span direction of the beam.8.2.2Specimen Configurations —Typical configurations for the flat and curved specimens are shown in Figs.1-4.For specimen thicknesses other than those shown,the following geometries are recommended:Specimen length =thickness 36Specimen width,b =thickness 32.0N OTE 2—Analysis reported by Lewis and Adams (6)has shown that a width-to-thickness ratio of greater than 2.0can result in a significant width-wise shear-stress variation.8.2.2.1For curved beam specimens,it is recommended that the arc should not exceed 30°.Also,for these specimens,the specimen length is defined as the minimum chord length.8.3Specimen Preparation —Guide D 5687/D 5687M pro-vides recommended specimen preparation practices and should be followed where practical.8.3.1Laminate Fabrication —Laminates may be hand-laid,filament-wound or tow-placed,and molded by any suitable laminating means,such as press,bag,autoclave,or resin transfer molding.8.3.2Machining Methods —Specimen preparation is impor-tant for these specimens.Take precautions when cutting specimens from the rings or plates to avoid notches,undercuts,rough or uneven surfaces,or delaminations as a result of inappropriate machining methods.Obtain final dimensions by water-lubricated precision sawing,milling,or grinding.The use of diamond tooling has been found to be extremely effective for many material systems.Edges should be flat and parallel within the specified tolerances.8.3.3Labeling —Label the specimens so that they will be distinct from each other and traceable back to the raw material,in a manner that will both be unaffected by the test method and not influence the test method.9.Calibration 9.1The accuracy of all measuring equipment shall have certified calibrations that are current at the time of use of theequipment.N OTE 1—Drawing interpretation per ANSI Y14.5-1982and ANSI/ASME B46.1-1986.N OTE 2—Ply orientation tolerance 60.5°relative to –B–.FIG.2Flat Specimen Configuration (InchPound)10.Conditioning10.1Standard Conditioning Procedure —Unless a differentenvironment is specified as part of the test method,conditionthe test specimens in accordance with Procedure C of TestMethod D 5229/D 5229M,and store and test at standardlaboratory atmosphere (2363°C (7365°F)and 50610%relative humidity).11.Procedure11.1Parameters to Be Specified Before Test :11.1.1The specimen sampling method and coupon geom-etry.11.1.2The material properties and data-reporting formatdesired.N OTE 3—Determine specific material property,accuracy,and data-reporting requirements before test for proper selection of instrumentation and data-recording equipment.Estimate operating stress levels to aid in calibration of equipment and determination of equipment settings.11.1.3The environmental conditioning test parameters.11.1.4If performed,the sampling test method,coupon geometry,and test parameters used to determine density and reinforcement volume.11.2General Instructions :11.2.1Report any deviations from this test method,whether intentional or inadvertent.11.2.2If specific gravity,density,reinforcement volume,or void volume are to be reported,then obtain these samples from the same panels as the test samples.Specific gravityandN OTE 1—Drawing interpretation per ANSI Y14.5-1982and ANSI/ASM B46.1-1986.N OTE 2—Ply orientation tolerance 60.5°relative to –A–.FIG.3Curved Specimen Configuration(SI)density may be evaluated by means of Test Methods D 792.V olume percent of the constituents may be evaluated by one ofthe matrix digestion procedures of Test Method D 3171,or forcertain reinforcement materials such as glass and ceramics,bythe matrix burn-off technique of Test Method D 2584.V oidcontent may be evaluated from the equations of Test MethodD 2734and are applicable to both Test Methods D 2584andD 3171.11.2.3Condition the specimens as required.Store the speci-mens in the conditioned environment until test time,if the testenvironment is different from the conditioning environment.11.2.4Following final specimen machining and any condi-tioning,but before testing,measure and record the specimenwidth and thickness at the specimen midsection and thespecimen length to the accuracy specified in 7.3.11.3Speed of Testing —Set the speed of testing at a rate of crosshead movement of 1.0mm (0.05in.)/min.11.4Test Environment —If possible,test the specimen under the same fluid exposure level as that used for conditioning.However,if the test temperature places too severe requirements upon the testing machine environmental chamber,test at a temperature with no fluid exposure control.In this case,a restriction must be placed upon the time from removal of the specimen from the conditioning chamber until test completion to inhibit nonrepresentative fluid loss from the specimen.Record any modifications to the test environment and specimen weight change after removal from conditioning until test completion.11.4.1Monitor the test temperature by placing an appropri-ate thermocouple at specimen mid-length to be located ontheN OTE 1—Drawing interpretation per ANSI Y14.5-1982and ANSI/ASME B46.1-1986.N OTE 2—Ply orientation tolerance 60.5°relative to –A–.FIG.4Curved Specimen Configuration (InchPound)underside of the beam.11.5Specimen Insertion —Insert the specimen into the testfixture,with the toolside resting on the reaction supports asshown in Fig.5or Fig.6.Align and center the specimen suchthat its longitudinal axis is perpendicular to the loading noseand side supports.Adjust the span such that the span-to-measured thickness ratio is 4.0to an accuracy of 60.3mm(0.012in.).The loading nose should be located equidistantbetween the side supports to within 60.3mm (0.012in.).Boththe loading nose and side supports should overhang thespecimen width by at least 2mm (0.08in.)at each side.In thecase of the flat laminate test,each specimen end shouldoverhang the side support centers by at least the specimenthickness.11.6Loading —Apply load to the specimen at the specifiedrate while recording data.Continue loading until either of thefollowing occurs:11.6.1A load drop-off of 30%,11.6.2Two-piece specimen failure,or11.6.3The head travel exceeds the specimen nominal thick-ness.11.7Data Recording —Record load versus crosshead dis-placement data throughout the test method.Record the maxi-mum load,final load,and the load at any obvious discontinui-ties in the load-displacement data.11.8Failure Mode —Typical failure modes that can be identified visually are shown in Fig.7.However,these may be preceded by less obvious,local damage modes such as transply cracking.Record the mode and location of failure,if possible identifying one or a combination of the modes shown.12.Calculation 12.1Short-Beam Strength —Calculate the short-beam strength using Eq 1as follows:F sbs 50.753P m b 3h (1)where:F sbs =short-beam strength,MPa (psi);P m =maximum load observed during the test,N (lbf);b =measured specimen width,mm (in.),and h =measured specimen thickness,mm (in.).12.2Statistics —For each series of test methods,calculate the average value,standard deviation,and coefficient of varia-tion (in percent)for each property determined asfollows:FIG.5Horizontal Shear Load Diagram (CurvedBeam)FIG.6Horizontal Shear Load Diagram (FlatLaminate)x 5~(i –1n x i !/n (2)s n –15Œ~(i 51nx i 2–n ~x !2!/~n –1!(3)CV 51003s n –1/x(4)where:x ¯=sample mean (average);s n–1=sample standard deviation;CV =sample coefficient of variation,%;n =number of specimens;and x i =measured or derived property.13.Report13.1Report the following information,or references point-ing to other documentation containing this information,to themaximum extent applicable (reporting of items beyond thecontrol of a given testing laboratory,such as might occur withmaterial details or panel fabrication parameters,shall be theresponsibility of the requester):N OTE 4—Guides E 1309,E 1434,and E 1471contain data reportingrecommendations for composite materials and composite materials me-chanical testing.13.1.1This test method and revision level or date of issue.13.1.2Whether the coupon configuration was standard orvariant.13.1.3The date and location of the test.13.1.4The name of the test operator.13.1.5Any variations to this test method,anomalies noticedduring testing,or equipment problems occurring during testing.13.1.6Identification of the material tested including:mate-rial specification,material type,material designation,manufac-turer,manufacturer’s batch or lot number,source (if not from manufacturer),date of certification,expiration of certification,filament diameter,tow or yarn filament count and twist,sizing,form or weave,fiber areal weight,matrix type,prepreg matrix content,and prepreg volatiles content.13.1.7Description of the fabrication steps used to prepare the laminate including:fabrication start date,fabrication end date,process specification,cure cycle,consolidation method,and a description of the equipment used.13.1.8Ply orientation and stacking sequence of the lami-nate.13.1.9If requested,report density,volume percent rein-forcement,and void content test methods,specimen sampling method and geometries,test parameters,and test results.13.1.10Average ply thickness of the material.13.1.11Results of any nondestructive evaluation tests.13.1.12Method of preparing the test specimen,including specimen labeling scheme and method,specimen geometry,sampling method,and coupon cutting method.13.1.13Calibration dates and methods for all measurements and test equipment.13.1.14Details of loading nose and side supports including diameters and material used.13.1.15Type of test machine,alignment results,and data acquisition sampling rate and equipment type.13.1.16Dimensions of each test specimen.13.1.17Conditioning parameters and results.13.1.18Relative humidity and temperature of the testing laboratory.13.1.19Environment of the test machine environmental chamber (if used)and soak time at environment.13.1.20Number of specimens tested.13.1.21Speed oftesting.FIG.7Typical Failure Modes in the Short BeamTest13.1.22Maximum load observed during the test,for eachspecimen.13.1.23Load-displacement curves for each specimen.13.1.24Failure mode of each specimen,identified if pos-sible from Fig.7.14.Precision and Bias14.1Precision —The data required for the development of aprecision statement is not currently available for this testmethod.14.2Bias —Bias cannot be determined for this test method as no acceptable reference standard exists.15.Keywords 15.1composite materials;resin and interlaminar properties;short-beam strengthREFERENCES(1)Berg,C.A.,Tirosh,J.,and Israeli,M.,“Analysis of Short BeamBending of Fiber Reinforced Composites,”in Composite Materials:Testing and Design (Second Conference),ASTM STP 497,ASTM,1972,pp.206-218.(2)Whitney,J.M.,and Browning,C.E.,“On Short-Beam Shear Tests forComposite Materials,”Experimental Mechanics ,V ol 25,1985,pp.294-300.(3)Sullivan,J.L.,and Van Oene,H.,“An Elasticity Analysis for theGenerally and Specially Orthotropic Beams Subjected to ConcentratedLoads,”Composites Science and Technology ,V ol 27,1986,pp.182-191.(4)U.S.Department of Transportation,Federal Aviation Administration,“Test Methods for Composites a Status Report:V olume III Shear Test Methods,”Report No.DOT/FAA/CT-93/17,III,FAA Technical Cen-ter,Atlantic City,1993.(5)Cui,W.,Wisnom,M.R.,and Jones,M.,“Effect of Specimen Size on Interlaminar Shear Strength of Unidirectional Carbon Fibre-Epoxy,”Composites Engineering ,V ol 4,No.3,1994,pp.299-307.(6)Adams,D.F.and Lewis,E.Q.,“Current Status of Composite Material Shear Test Methods,”SAMPE ,V ol 31,No.6,1994,pp.32-41.The American Society for Testing and Materials takes no position respecting the validity of any patent rights asserted in connection with any item mentioned in this ers of this standard are expressly advised that determination of the validity of any such patent rights,and the risk of infringement of such rights,are entirely their own responsibility.This standard is subject to revision at any time by the responsible technical committee and must be reviewed every five years and if not revised,either reapproved or withdrawn.Your comments are invited either for revision of this standard or for additional standards and should be addressed to ASTM Headquarters.Your comments will receive careful consideration at a meeting of the responsible technical committee,which you may attend.If you feel that your comments have not received a fair hearing you should make your views known to the ASTM Committee on Standards,at the address shown below.This standard is copyrighted by ASTM,100Barr Harbor Drive,PO Box C700,West Conshohocken,PA 19428-2959,United States.Individual reprints (single or multiple copies)of this standard may be obtained by contacting ASTM at the above address or at 610-832-9585(phone),610-832-9555(fax),or service@ (e-mail);or through the ASTM website().。
Direct reduction of graphene oxide films into highlyconductive and flexible graphene films by hydrohalic acids通过卤化氢还原法把氧化膜石墨稀膜直接还原成高导热和易弯曲的石墨稀薄膜Songfeng Pei, Jinping Zhao, Jinhong Du *裴松峰,赵金平,杜金红, Wencai Ren, Hui-Ming Cheng ** 任文才,程慧明Shenyang National Laboratory for Materials Science, Institute of Metal Research, Chinese Academy of Sciences, 72 Wenhua Road,沈阳国家实验室的材料科学研究所、金属材料研究、中国科学院,72号文华路,Shenyang 110016, People’s Republic of China沈阳110016,中国人民共和国Article history :Received 3 August 2010。
Accepted 6 August 2010。
Available online 10 August 2010文史:接受2010年8月6日收到2010年8月3在网上10 2010年8月We report a simple but highly-effective hydrohalic acid reducing method to reduce graph- ene oxide (GO) films into highly conductive graphene films without destroying their integrity and flexibility at low temperature based on the nucleophilic substitution reaction.我们报告一个简单而高效卤化氢还原法还原酸-烯氧化物(去)膜成高导电石墨烯而不破坏他们的完整性和低温稳定性基于亲核取代反应的基础上。
英文原版教材班“材料科学基础”考试试题试卷一Examination problems of the course of “fundament of materials science”姓名:班级:记分:1. Glossary (2 points for each)1) crystal structure:2) basis (or motif):3) packing fractor:4) slip system:5) critical size:6) homogeneous nucleation:7) coherent precipitate:8) precipitation hardening:9) diffusion coefficient:10) uphill diffusion:2. Determine the indices for the planes in the cubic unit cell shown in Figure 1. (5 points)Fig. 13. Determine the crystal structure for the following: (a) a metal with a0 =4.9489 Å, r = 1.75 Å and one atom per lattice point; (b) a metal with a0 = 0.42906 nm, r = 0.1858 nm and one atom per lattice point. (10 points)4-1. What is the characteristic of brinell hardness test, rockwell hardness test and Vickers hardness test? What are the effects of strain rate and temperature on the mechanical properties of metallic materials? (15 points)4-2. What are the effects of cold-work on metallic materials? How to eliminate those effects? And what is micro-mechanism for the eliminating cold-work effects? (15 points)5-1. Based on the Pb-Sn-Bi ternary diagram as shown in Fig. 2, try to(1)Show the vertical section of 40wt.%Sn; (4 points)(2) Describe the solidification process of the alloy 2# with very low cooling speed (includingphase and microstructure changes); (4 points) (3)Plot the isothermal section at 150o C. (7 points)5-2. A 1mm sheet of FCC iron is used to contain N 2 in a heated exchanger at 1200o C. The concentration of N at one surface is 0.04 atomic percent and the concentration at the second surface is 0.005 atomic percent. At 1000 o C, if same N concentration is demanded at the second surface and the flux of N becomes to half of that at 1200o C, then what is the thickness of sheet? (15 points)6-1. Supposed that a certain liquid metal is undercooled until homogeneous nucleation occurs. (15 points)(1) How to calculate the critical radius of the nucleus required? Please give the deductionprocess.(2) For the Metal Ni, the Freezing Temperature is 1453︒C, the Latent Heat of Fusion is 2756J/cm 3, and the Solid-liquid Interfacial Energy is 255⨯10-7 J/cm 2. Please calculate the critical radius at 1353︒C. (Assume that the liquid Ni is not solidified.)6-2. Fig.3 is a portion of the Mg-Al phase diagram. (15 points)(1) If the solidification is too rapid, please describe the solidification process of Mg-10wt%Alalloy.(2) Please describe the equilibrium solidification process of Mg-20wt%Al alloy, and calculate theamount of each phase at 300︒C.Fig. 3Fig. 27-1. Figure 4 shows us the Al-Cu binary diagram and some microstructures found in a cooling process for an Al-4%Cu alloy. Please answer following questions according to this figure. (20 points)Fig. 4(1)What are precipitate, matrix and microconstituent? Please point them out in the in the figure and explain.(2)Why is need-like precipitate not good for dispersion strengthening? The typical microstructure shown in the figure is good or not? why?(3)Please tell us how to obtain the ideal microstructure shown in this figure.(4)Can dispersion strengthened materials be used at high temperature? Please give the reasons (comparing with cold working strengthening)7-2. Please answer following questions according to the time-temperature-transformation (TTT) diagram as shown in Fig. 5. (20 points)(1)What steel is this TTT diagram for? And what means P, B, and M in the figure? (2)Why dose the TTT diagram exhibi ts a ‗C‘ shape?(3)Point out what microconstituent will be obtained after austenite is cooled according to the curves I, II, III and IV .(4)What is microstructural difference between the curve I and the curve II? (5)How to obtain the steel with the structure of(a) P+B(b) P+M+A (residual) (c) P+B+M+A (residual)(d) Full tempered martensiteIf you can, please draw the relative cooling curve or the flow chart of heat treatment.Fig. 5III III IV英文原版教材班“材料科学基础”考试试题答案Solution s of the course of “fundament of materials science”1. Glossary (2 points for each)1) The arrangement of the atoms in a material into a repeatable lattice.2) A group of atoms associated with a lattice.3) The fraction of space in a unit cell occupied by atoms.4) The combination of the slip plane and the slip direction.5) The minimum size that must be formed by atoms clustering together in the liquid before thesolid particle is stable and begins to grow.6) Formation of a critically sized solid from the liquid by the clustering together of a largenumber of atoms at a high undercooling (without an external interface).7) A precipitate whose crystal structure and atomic arrangement have a continuousrelationship with matrix from which precipitate is formed.8) A strengthening mechanism that relies on a sequence of solid state phase transformationsin a dispersion of ultrafine precipitates of a 2nd phase. This is same as age hardening. It is a form of dispersion strengthening.9) A temperature-dependent coefficient related to the rate at which atom, ion, or otherspecies diffusion. The DC depends on temperature, the composition and microstructure of the host material and also concentration of the diffusion species.10) A diffusion process in which species move from regions of lower concentration to that ofhigher concentration.2. Solution: A(-364), B(-340), C(346).3. Solution: (a)fcc; (b) bcc.4-1. What is the characteristic of brinell hardness test, rockwell hardness test and Vickers hardness test? What are the effects of strain rate and temperature on the mechanical properties of metallic materials? (15 points)4-2. What are the effects of cold-work on metallic materials? How to eliminate those effects? And what is micro-mechanism for the eliminating cold-work effects? (15 points)5-1. Based on the Pb-Sn-Bi ternary diagram as shown in Fig. 2, try to(1)Show the vertical section of 40wt.%Sn; (5 points)(2) Describe the solidification process of the alloy 2# with very low cooling speed (includingphase and microstructure changes); (5 points)(3)Plot the isothermal section at 150o C. (5 points)5-2. A 1mm sheet of FCC iron is used to contain N2in a heated exchanger at 1200o C. The concentration of N at one surface is 0.04 atomic percent and the concentration at the second surface is 0.005 atomic percent. At 1000 o C, if same N concentration is demanded at the second surface and the flux of N becomes to half of that at 1200o C, then what is the thickness of sheet?(15 points)6-1. Supposed that a certain liquid metal is undercooled until homogeneous nucleation occurs. (15 points)(3)How to calculate the critical radius of the nucleus required? Please give the deductionprocess.(4)For the Metal Ni, the Freezing Temperature is 1453︒C, the Latent Heat of Fusion is 2756J/cm3, and the Solid-liquid Interfacial Energy is 255⨯10-7 J/cm2. Please calculate the critical radius at 1353︒C. (Assume that the liquid Ni is not solidified.)6-2. Fig.3 is a portion of the Mg-Al phase diagram. (15 points)(3)If the solidification is too rapid, please describe the solidification process of Mg-10wt%Alalloy.(4)Please describe the equilibrium solidification process of Mg-20wt%Al alloy, and calculate theamount of each phase at 300︒C. Array Fig. 37-1. Figure 4 shows us the Al-Cu binary diagram and some microstructures found in a coolingprocess for an Al-4%Cu alloy. Please answer following questions according to this figure. (20 points)Fig. 4(1)What are precipitate, matrix and microconstituent? Please point them out in the in the figure and explain.(2)Why is need-like precipitate not good for dispersion strengthening? The typical microstructure shown in the figure is good or not? why?(3)Please tell us how to obtain the ideal microstructure shown in this figure.(4)Can dispersion strengthened materials be used at high temperature? Please give the reasons (comparing with cold working strengthening)7-2. Please answer following questions according to the time-temperature-transformation (TTT) diagram as shown in Fig. 5. (20 points)(1)What steel is this TTT diagram for? And what means P, B, and M in the figure? (2)Why dose the TTT diagram exhibits a ‗C‘ shape?(3)Point out what microconstituent will be obtained after austenite is cooled according to the curves I, II, III and IV .(4)What is microstructural difference between the curve I and the curve II? (5)How to obtain the steel with the structure of(a) P+B(b) P+M+A (residual) (c) P+B+M+A (residual)(d) Full tempered martensiteIf you can, please draw the relative cooling curve or the flow chart of heat treatment.Fig. 5III III IV英文原版教材班“材料科学基础”考试试题试卷二Examination problems of the course of “fundament of materials science”姓名:班级:记分:1. You would like to be able to physically separate different materials in a scrap recycling plant. Describe some possible methods that might be used to separate materials such as polymers, aluminum alloys, and steels from one another. (5 points)2. Plot the melting temperature of the elements in the 1A column of the periodic table versus atomic number (i.e., plot melting temperatures of Li through Cs). Discuss this relationship, based on atomic bonding and binding energy. (10 points)3.Above 882℃, titanium has a BCC crystal structure, with a = 0.332 nm. Below this temperature, titanium has a HCP structure, with a = 0.2978 nm and c = 0.4735 nm. Determine the percent volume change when BCC titanium transforms to HCP titanium. Is this a contraction or expansion? (10 points)4. The density of BCC iron is 7.882 g/cm3and the lattice parameter is 0.2866 nm whenhydrogen atoms are introduced at interstitial positions. Calculate (a) the atomic fraction of hydrogen atoms and (b) the number of unit cells required on average to contain one hydrogen atom. (15 points)5. A carburizing process is carried out on a 0.10% C steel by introducing 1.0% C at the surface at 980℃, where the iron is FCC. Calculate the carbon content at 0.01 cm, 0.05 cm, and 0.10 cm beneath the surface after 1 h. (15 points)6. The following data were collected from a standard 0.505-in.-diameter test specimen of acopper alloy (initial length (t o) = 2.0 in.):Load Gage Length Stress Strain(lb) (in.) (psi) (in/in.)0 2.00000 0 0.03,000 2.00167 15,000 0.0008356,000 2.00333 30,000 0.0016657,500 2.00417 37,500 0.0020859,000 2.0090 45,000 0.004510,500 2.040 52,500 0.0212,000 2.26 60,000 0.1312,400 2.50 (max load) 62,000 0.2511,400 3.02 (fracture) 57,000 0.51After fracture, the gage length is 3.014 in. and the diameter is 0.374 in. Plot the data and calculate (a) the 0.2% offset yield strength, (b) the tensile strength, (c) the modulus of elasticity, (d) the %Elongation, (e) the %Reduction in area, (f) the engineering stress at fracture, (g) the true stress at fracture, and (h) the modulus of resilience. (15 points)7. A 1.5-em-diameter metal bar with a 3-cm gage length is subjected to a tensile test. Thefollowing measurements are made.Change in Force (N) Gage length (cm) Diameter (cm)16,240 0.6642 1.202819,066 1.4754 1.088419,273 2.4663 0.9848Determine the strain hardening coefficient for the metal. Is the metal most likely to be FCC, BCC, or HCP? Explain.(15 points)8. Based on Hume-Rothery’s conditions, which of the following systems would be expected todisplay unlimited solid solubility? Explain. (15 points)(a) Au-Ag (b) Al-Cu (c) Al-Au (d)U-W(e) Mo-Ta (f) Nb-W (g) Mg-Zn (h) Mg-Cd英文原版教材班“材料科学基础”考试试题答案Solutions of the course of “fundament of materials science”1.Steels can be magnetically separated from the other materials; steel (or carbon-containing iron alloys) are ferromagnetic and will be attracted by magnets. Density differences could be used—polymers have a density near that of water; the specific gravity of aluminum alloys is around2.7;that of steels is between 7.5 and 8. Electrical conductivity measurements could be used—polymers are insulators, aluminum has a particularly high electrical conductivity.(5 points)2.T (o C)L i–180.7N a– 97.8K – 63.2R b– 38.9As the atomic number increases, the melting temperature decreases, (10 points)3. We can find the volume of each unit cell. Two atoms are present in both BCC and HCP titanium unit cells, so the volumes of the unit cells can be directly compared.V BCC = (0.332 nm)3 = 0.03659 nm3V HCP= (0.2978 nm)2(0.4735 nm)cos30 = 0.03637 nm3△V=x 100 =×100= -0.6%Therefore titanium contracts 0.6% during cooling. (10 points)4. (a) 7.882 g/cm3 =x = 0.0081 H atoms/cellThe total atoms per cell include 2 Fe atoms and 0.0081 H atoms. Thus:(10 points)(b) Since there is 0.0081 H/cell, then the number of cells containing H atoms is:cells = 1/0.0081 = 123.5 or 1 H in 123.5 cells (5 points)5. D = 0.23 exp[-32,900/(1.987)(1253)] = 42 × 10-8 cm2/sC x= 0.87% CC x= 0.43% CC x= 0.18% C(15 points)6. σ=FI (π/4)(0.505)2 = F/0.2ε = (l-2)/2(a) 0.2% offset yield strength = 45,000 psi(b)tensile strength = 62,000 psi(c) E = (30,000 - 0) / (0.001665 - 0) = 18 x 106 psi(d)%Elongation =(e) %Reduction in area =(f) engineering stress at fracture = 57,000 psi(g)true stress at fracture = 11,400 lb / (TC/4)(0.374)2= 103,770 psi (h) From the graph, yielding begins at about 37,500 psi. Thus:(15 points)7.Force(lb) Gage length(in.) Diameter(in.) True stress(psi) True strain(psi)16,240 3.6642 12.028 143 0.20019,066 4.4754 10.884 205 0.40019,273 5.4663 9.848 249 0.600σt=Kεt2or ln143=ln K + n ln0.2ln 249 = ln K + nln 0.6n=0.51A strain hardening coefficient of 0.51 is typical of FCC metals.(15 points)8.The Au–Ag, Mo–Ta, and Mg–Cd systems have the required radius ratio, the same crystal structures, and the same valences. Each of these might be expected to display complete solid solubility. [The Au –Ag and Mo –T a d o have isomorphous phase diagrams. In addition, the Mg–Cd alloys all solidify like isomorphous alloys; however a number of solid state phase transformations complicate the diagram.] (15 points)英文原版教材班“材料科学基础”考试试题试卷三Examination problems of the course of “fundament of materials science”姓名:班级:记分:1. You would like to be able to identify different materials without resorting to chemical analysis or lengthy testing procedures. Describe some possible testing and sorting techniques you might be able to use based on the physical properties of materials. (5 points)2. Plot the melting temperatures of elements in the 4A to 8-10 columns of the periodic table versus atomic number (i.e., plot melting temperatures of Ti through Ni, Zr through Pd, and Hf through Pt). Discuss these relationships, based on atomic bonding and binding energy, (a) as the atomic number increases in each row of the periodic table and (b) as the atomic number increases in each column of the periodic table. (10 points)3. Beryllium has a hexagonal crystal structure, with a o= 0.22858 nm and c o= 0.35842 nm. The atomic radius is 0.1143 nm, the density is 1.848 g/cm3, and the atomic weight is 9.01 g/mol. Determine (a) the number of atoms in each unit cell and (b) the packing factor in the unit cell.(10 points)4. Suppose we introduce one carbon atom for every 100 iron atoms in an interstitial position in BCC iron, giving a lattice parameter of 0.2867 nm. For the Fe-C alloy, find (a) the density and (b) the packing factor. (15 points)5. Iron containing 0.05% C is heated to 912oC in an atmosphere that produces 1.20% C at the surface and is held for 24 h. Calculate the carbon content at 0.05 cm beneath the surface if (a) the iron is BCC and (b) the iron is FCC. Explain the difference. (15 points)6. The following data were collected from a 0.4-in. diameter test specimen of poly vinyl chloride(l0 = 2.0 in):Load(lb) Gage Length(in.) Stress(psi) Strain(in/in.)0 2.00000 0 0.0300 2.00746 2,387 0.00373600 2.01496 4,773 0.00748900 2.02374 7,160 0.011871200 2.032 9,547 0.0161500 2.046 11,933 0.0231660 2.070 (max load) 13,206 0.0351600 2.094 12,729 0.0471420 2.12 (fracture) 11,297 0.06After fracture, the gage length is 2.09 in. and the diameter is 0.393 in. Plot the data and calculate (a) the 0.2% offset yield strength, (b) the tensile strength, (c) the modulus of elasticity, (d) the %Elongation, (e) the %Reduction in area, (f) the engineering stress at fracture, (g) the true stress at fracture, and (h) the modulus of resilience. (15 points)7. A titanium alloy contains a very fine dispersion of tiny Er203 particles. What will be the effectof these particles on the grain growth temperature and the size of the grains at any particular annealing temperature? Explain. (15 points)8. Suppose 1 at% of the following elements is added to copper (forming a separate alloy witheach element) without exceeding the solubility limit. Which one would be expected to give the higher strength alloy? Is any of the alloying elements expected to have unlimited solid solubility in copper?(a) Au (b) Mn (c) Sr (d) Si (e) Co (15 points)英文原版教材班“材料科学基础”考试试题答案Solutions of the course of “fundament of materials science”1.Steels can be magnetically separated from the other materials; steel (or carbon-containing iron alloys) are ferromagnetic and will be attracted by magnets. Density differences could be used—polymers have a density near that of water; the specific gravity of aluminum alloys is around2.7;that of steels is between 7.5 and 8. Electrical conductivity measurements could be used—polymers are insulators, aluminum has a particularly high electrical conductivity.(5 points)2. Ti –1668 Zr – 1852 Hf – 2227V –1900 Nb –2468 Ta – 2996Cr –1875 Mo–2610 W–3410Mn–1244 Tc –2200 Re–3180Fe –1538 Ru –2310 Os–2700Co –1495 Rh –1963 Ir –2447Ni –1453 Pd –1552 Pt –1769For each row, the melting temperature is highest when the outer ―d‖ energy level is partly full. In Cr, there are 5 electrons in the 3d shell; in Mo, there are 5 electrons in the 4d shell; in W there are 4 electrons in the 5d shell. In each column, the melting temperature increases as the atomic number increases—the atom cores contain a larger number of tightly held electrons, making the metals more stable. (10 points)3.V= (0.22858 nm)2(0.35842 nm)cos 30 = 0.01622 nm3 = 16.22 × 10⁻²⁴ cm3(a)From the density equation:1.848 g/cm3 =x = 2 atoms/cell(b)The packing factor (PF) is:PF == 0.77 (10 points)4. There is one carbon atom per 100 iron atoms, or 1 C/50 unit cells, or 1/50 C per unit cell:(a)(b)(15 points)5. t= (24 h)(3600 s/h) = 86,400 sD BCC = 0.011 exp[-20,900/(1.9871185)] = 1.54 × 10⁻⁶ cm2/sD FCC = 0.23 exp[-32,900/(1.987)(1185)] = 1.97×10⁻⁷ cm2/sBCC: = erf[0.0685] = 0.077C x= 1.11% CFCC: = erf[0.192] = 0.2139C x = 0.95% CFaster diffusion occurs in the looser packed BCC structure, leading to the higher carbon content at point ―x‖. (15 points)6. σ=F /(π/4)(0.4)2 = F/0.1257ε = (l-2)/2(a)0.2% offset yield strength = 11,600 psi(b) tensile strength = 12,729 psi(c) E= (7160 - 0) / (0.01187 - 0) = 603,000 psi(d)%Elongation =(e) %Reduction in area =(f) engineering stress at fracture = 11,297 psi(g)true stress at fracture = 1420 lb / (TC/4)(0.393)2= 11,706 psi (h) From the figure, yielding begins near 9550 psi. Thus:(15 points)7. These particles, by helping pin die grain boundaries, will increase the grain growth temperature and decrease the grain size. (15 points)8.The Cu-Sr alloy would be expected to be strongest (largest size difference). The Cu-Au alloy satisfies Hume-Rothery ’s conditions and might be expected to display complete solid solubility—in fact it freezes like an isomorphous series of alloys, but a number of solid state transformationsoccur at lower temperatures.(15 points)英文原版教材班“材料科学基础”考试试题试卷四Examination problems of the course of “fundament of materials science”姓名:班级:记分:1.Aluminum has a density of2.7 g/cm3. Suppose you would like to produce a compositematerial based on aluminum having a density of 1.5 g/cm3. Design a material that would have this density. Would introducing beads of polyethylene, with a density of 0.95 g/cm3, into the aluminum be a likely possibility? Explain. (5 points)2. (a) Aluminum foil used for storing food weighs about 0.3 g per square inch. How many atomsof aluminum are contained in this sample of foil?(b) Using the densities and atomic weights given in Appendix A, calculate and compare thenumber of atoms per cubic centimeter in (i) lead and (ii) lithium. (10 points)3. The density of potassium, which has the BCC structure and one atom per lattice point, is0.855 g/cm3. The atomic weight of potassium is 39.09 g/mol. Calculate (a) the latticeparameter; and (b) the atomic radius of potassium. (10 points)4. The density of a sample of HCP beryllium is 1.844 g/cm3 and the lattice parameters are a0=0.22858 nm and c0= 0.35842 nm. Calculate (a) the fraction of the lattice points that containvacancies and (b) the total number of vacancies in a cubic centimeter. (15 points)5. A ceramic part made of MgO is sintered successfully at 1700℃in 90 minutes. To minimizethermal stresses during the process, we plan to reduce the temperature to 1500℃. Which will limit the rate at which sintering can be done: diffusion of magnesium ions or diffusion of oxygen ions? What time will be required at the lower temperature? (15 points)6. (a) A thermosetting polymer containing glass beads is required to deflect 0.5 mm when aforce of 500 N is applied. The polymer part is 2 cm wide, 0.5 cm thick, and 10 cm long. If the flexural modulus is 6.9 GPa, determine the minimum distance between the supports. Will the polymer fracture if its flexural strength is 85 MPa? Assume that no plastic deformation occurs.(b) The flexural modulus of alumina is 45 x 106 psi and its flexural strength is 46,000 psi. Abar of alumina 0.3 in. thick, 1.0 in. wide, and 10 in. long is placed on supports 7 in. apart.Determine the amount of deflection at the moment the bar breaks, assuming that no plastic deformation occurs. (15 points)7. Based on the following observations, construct a phase diagram. Element A melts at 850°Cand element B melts at 1200°C. Element B has a maximum solubility of 5% in element A, and element A has a maximum solubility of 15% in element B. The number of degrees of freedom from the phase rule is zero when the temperature is 725°C and there is 35% B present. At room temperature 1% B is soluble in A and 7% A is soluble in B. (15 points)8.Suppose that age hardening is possible in the Al-Mg system (see Figure 10-11). (a)Recommend an artificial age-hardening heat treatment for each of the following alloys, and(b) compare the amount of the precipitate that forms from your treatment of each alloy. (i)Al-4% Mg (ii) Al-6% Mg (iii) Al-12% Mg (c) Testing of the alloys after the heat treatment reveals that little strengthening occurs as a result of the heat treatment. Which of the requirements for age hardening is likely not satisfied? (15 points)英文原版教材班“材料科学基础”考试试题答案Solutions of the course of “fundament of materials science”1. In order to produce an aluminum-matrix composite material with a density of 1.5 g/cm 3, we wouldneed to select a material having a density considerably less than 1.5 g/cm 3. While polyethylene‘s density would make it a possibility, the polyethylene has a very low melting point compared to aluminum; this would make it very difficult to introduce the polyethylene into a solid aluminum matrix —processes such as casting or powder metallurgy would destroy the polyethylene .Therefore polyethylene would NOT be a likely possibility.One approach, however, might be to introduce hollow glass beads .Although ceramic glasses have densities comparable to that of aluminum, a hollow bead will have a very low density. The glass also has a high melting temperature and could be introduced into liquid aluminum for processing as a casting. (5 points)2. (a) In a one square inch sample:number ==6.69 × 10²¹ atoms(b) (i) In lead:= 3.3 × 10²² atoms/cm 3(ii) In lithium:= 4.63 × 10²² atoms/cm 3 (10 points)3. (a) Using Equation 3-5:0.855 g/cm 3 =a o 3 = 1.5189 × 10⁻²² cm 3 or a o = 5.3355 × 10⁻⁸ cm(b) From the relationship between atomic radius and lattice parameter:r == 2.3103 × 10⁻⁸cm (10 points)(a) From the density equation:fraction =29984.12 = 0.0008(b) number == 0.986 x 10²⁰ vacancies/cm 3 (15 points)5. Diffusion of oxygen is the slower of the two, due to the larger ionic radius of the oxygen.D 1700= 0.000043 exp[-82,100/(1.987)(1973)] = 3.455 × 10⁻¹⁴ cm 2/sD1500= 0.000043 exp[-82,100/(1.987)(1773)] = 3.255 × 10⁻¹⁵ cm2/st1500 = D1700 t1700/D1500== 955 min = 15.9 h (15 points)6. (a) Solution:The minimum distance L between the supports can be calculated from the flexural modulus.L3 = 4w/z3δ(flexural modulus)/3FL3 = (4)(20 mm)(5 mm)3(0.5 mm)(6.9 GPA)(1000 MPa/GPa) / 500 NL3 = 69,000 mm3 or L = 41 mmThe stress acting on the bar when a deflection of 0.5 mm is obtained isσ= WL/2wh2 = (3)(500 N)(41 mm) / (2)(20 mm)(5 mm)2 = 61.5 MPaThe applied stress is less than the flexural strength of 85 MPa; the polymer is not expected to fracture.(b) Solution:The force required to break the bar isF = 2w/z2(flexural strength)/3LF= (2)(1 in)(0.3 in)2(46,000 psi / (3)(7 in.) = 394 lbThe deflection just prior to fracture is8 = FZ3/4wh3(flexural modulus)8 = (394 lb)(7 in)3/(4)(l in)(0.3 in)3(45 x 106 psi) = 0.0278 in. (15 points)7.(15 points)8. (a) The heat treatments for each alloy might be:Al-4% Mg Al-6% Mg Al-12% MgT Eutectic451°C 451°C 451°CT Solvs210°C 280°C 390°CSolutionTreat at: 210-451°C 280-451°C 390-451°CQuench Quench QuenchAge at: <210°C <280°C <390°C(b) Answers will vary depending on aging temperature selected. If all threeare aged at 200°C, as an example, the tie line goes from about 3.8 to 35% Mg:A1-4% Mg: %β = (4− 3.82)/(35 − 3.82) X 100 = 0.6%Al-6% Mg: %β = (6 − 3.82)/(35 − 3.82) X 100 = 7.1%Al-12% Mg: %β = (12 −3.82)/(35− 3.82) X 100 = 26.8%(c) Most likely, a coherent precipitate is not formed; simple dispersionstrengthening, rather than age hardening, occurs. (15 points)英文原版教材班“材料科学基础”考试试题试卷五Examination problems of the course of “fundament of materials science”姓名:班级:记分:1. You would like to design an aircraft that can be flown by human power nonstop for adistance of 30 km. What types of material properties would you recommend? What materials might be appropriate? (5 points)2. Boron has a much lower coefficient of thermal expansion than aluminum, even though bothare in the 3B column of the periodic table. Explain, based on binding energy, atomic size, and the energy well, why this difference is expected. (10 points)3. Determine the ASTM grain size number if 20 grains/square inch are observed at amagnification of 400. (10 points)4. We currently can successfully perform a carburizing heat treatment at 1200o C in 1 h. In aneffort to reduce the cost of the brick lining in our furnace, we propose to reduce the carburizing temperature to 950℃. What time will be required to give us a similar carburizing treatment? (15 points)5.The data below were obtained from a series of Charpy impact tests performed on foursteels, each having a different manganese content. Plot the data and determine (a) the transition temperature (defined by the mean of the absorbed energies in theductile and brittle regions) and (b) the transition temperature (defined as the temperature that provides 50 J absorbed energy). Plot the transition temperature versus manganese content and discuss the effect of manganese on the toughness of steel. What would be the minimum manganese allowed in the steel if a part is to be used at 0°C?Test temperature°C Impact snergy (J)0.30% Mn 0.39% Mn 1.01% Mn 1.55% Mn-100 2 5 5 15-75 2 5 7 25-50 2 12 20 45-25 10 25 40 700 30 55 75 11025 60 100 110 13550 105 125 130 14075 130 135 135 140100 130 135 135 140(15 points)。
Quantitative Determination of Volume Fraction ofGraphite in Ductile Iron(School of Materials Science and Engineering, University of Science and Technology Beijing, Beijing 100083, China)Abstract The relative amount of the graphite phase in a ductile iron sample can be quantitatively determined with both the manual point counting method and the automatic imagine analysis method. In the experiment, I analyzed the micro-structure of the ductile iron sample. I used two different methods to determine the volume fraction of graphite of the ductile iron sample with the serial number 1. One of the methods is the manual point counting method which takes advantages of reticle with an orthogonl grid placed in one of the eyepiece. The other is the automatic image analysis method which uses Image Tool to analysis a set of micro-graphs of the sample. The volume fraction of graphite was determined as 9.67%±0.52% and 9.67% ±0.23% from the manual method and the automatic method, respectively. Basing on the assumption that the ductile iron is absolutely binary all, the carbon content of the manual counting method and the automatic method is 2.84 % and 2.85% , separately. There exist some errors in both the manual method and automatic method.Key Words: Graphite, Volume Fraction, Ductile iron, Quantitative microscopy, Stereology1.IntroductionThe experiment we conducted mainly uses the principle of the materials stereology, especially the principle related to the photomicrography and quantitative microscopy. The stereology for materials science refers to the quantitative method and theory to obtain the three-dimensional information such as the volume fraction or the amount of one certain interface in unit volume by analyzing the two-dimensional section or the projection image. The quantitative metallography means the kind of metallographic technique that determine the micro-structure of materials quantitatively(estimate and measure the size of grain/ the content of each phase/the size, amount, shape and distribution of second the phase .etc) by the materials stereology and image analysis technique. The relationship of the two is that the stereology for materials science is the important foundation of the quantitative metallography.The experiment is divided into two parts. One part is photographic recording of the etched structures and the other part is the stereoligical evaluation of micro-structures. In term of the photomicgraphy, we use the digital imagining metallographic microscope with digital camera to take micrograph of the given sample of ductile(nodular) iron and the sample with the hypo eutectic micro-structure. As for the stereological evaluation of micro-structure, we use both manual point counting method and the automatic image analysis method. Then we analysis and compare the result obtained from two methods.2.Material and Methods2.1The Sample for the Experiment2.1.1 The grinding and the polishing of the sampleAfter cutting a small representative piece from the metal to be studied, we got the sample that is rough and scratched. But examining the sample in the microscope without prior preparation will not reveal informative image of the micro-structure because roughness and scratches at the surface will reflect the incident light randomly. As a result, we need to grind and polish the sample before examine and observe the sample in the microscope.Grinding is done using rotating discs covered with silicon carbide paper and water or just using silicon carbide paper on a glass plate. What we should pay attention to is that the strength should be equally pressed on the sample in order to make sure the whole surface of the sample is equally grinded. What is further more, we need to keep rotating the sample with 90 degree regularly during the grinding until the scratches are on the same direction.Polishing steps are similar to those of the grinding. In addition, we need to maintain the moist degree of the sample. Because the sample will become hotter then oxide if it is too dry or the pitting corrosion will formed if the sample is too wet.2.1.2 The etching of the sampleThe purpose of etching is two-fold. Firstly, grinding and polishing produce a highly deformed, thin layer on the surface which is removedchemically during etching. Secondly, the etchant attacks the surface with preference for those sites with the highest energy, leading to surface relief. 2.2 Manual Point Counting MethodPoint counting is one of the simplest operations of quantitative stereology. The term refers to test points(for example, the intersection of an orthogonal test grid) that are counted when they superimpose on some areal feature of interest in the micro-structure of a metallographic cross section. Such features may be individual phase, pores or inclusions present in the structure. The point counting technique allows determination of the volume fraction of such features in the specimen under study.The ability to count systematically the occurrence of a feature within a given area on a plane surface and to translate that count into the volume fraction of that feature within the material under study is based on the following relation:The number of pints P that fall on the feature F:P P (point fraction) isequal to: the volume fraction(V V ), which is the volume feature F divided by the total volume of the sample(TF V V ). That is:The volume fraction of the second phase:V V =P P .The point fraction:P P =∑Gr P /(n ×T P )And the relative standard deviation:22[()/][()/]1/v v p p a V V P P P σσ==The derivation of the above equation:The systematic method of point counting can be divided into 3 parts. Firstly, place the polished and etched section on the stage and adjust the magnification so that the feature of interest is easily seen. Select a representative portion of the sample randomly. Secondly, count the points. If a reticle is available with an orthogonal grid, this is placed in one of the eyepieces. Counting is accomplished by recording the identity of the material over which each grid point lies, i.c. a count is made of all points on the grid that lie over the feature of interest. The point fraction of that features is its point count divided by the total number of test points on thegrid.2.3Automatic Image Analysis MethodAutomatic imagine analysis method is refers to the method analysis and obtain the data of the volume fraction automatically photomicroscope and Image Tool software.The image analysis refers to the quantitative metallographic technique that infer the quantitative data such as geometrical information and optical density from the image, which associate the automatic image analysis with the theory of the materials stereology. The image processing means the technique which using the computer depose the image in order to meet the certain requirement. The difference between them is the image analysis can obtain the final result we want automatically.The systematic method the automatic image analysis method can be divided into 2 parts. Firstly, shot ten photos of the sample surface with the photomicroscope. Secondly, use the Image Tool to transform the photos into gray-scale version and white-black version. Then the Image Tool will analysis the photo and provide us with the volume fraction automatically.3.Results and Discussion3.1V olume Fraction of Graphite: Determined ManuallyThe experimental data:P=3624.5; n=402From the data above we can calculate:1)P P =∑Gr P /(n ×T P ) ∑Gr P =1394.5, n=402, T P =36Thus,P P =1394.5/(402× 36)=9.64%.2)αP =3624.5Thus,V V V V /)(σ=1/1394=2.68%)(P P σ=P V V P V V ⨯/)(σ=2.68%×9.64%=0.26% And n-1=402-1=401>40, thus C=2 Hence,C )(P P σ=2×0.26%=0.52%The final result: on the 95%confidence level, the volume fraction of graphite V V =9.64%±0.52%.3.2 V olume Fraction of Graphite: Determined Using Automatic Image AnalysisThe final result of the automatic image analysis:(a) (b)(c) (d)Image and results of volume fraction determination of graphite in ductileiron, using Image Tool 2.0(a)original image (b)gray image(c)binary image(d)Image Tool result tableThe Image Tool show us the volume fraction V V =9.67% and the standarddeviation)(V V σ=0.23 automatically. Thus the final result is the volumefraction of graphite V V =9.67%±0.23% in the automatic method.3.3 Chemical Composition Estimation Based on V olume Fraction Data The basic functions and parameters are listed as below:33%/86.7;/62.2))1(/(cmg cm g V V V C Fe C Fe V C V C V wt ==++=ρρρρρHence, the chemical composition : 1)on the manual point counting method:=%wt C 9.64%×2.62/(9.64%×2.62+(1+9.64%)7.86)=2.84% 2)on the automatic image method: =%wt C 9.67%×2.62/(9.67%×2.62+(1+9.67%)7.86)=2.85%3.4 Comparison and Discussion3.4.1 The comparison of the manual point counting method and the automatic methodFrom the above analysis and calculate we obtain that the volume fraction of graphite was determined as 9.64%±0.52% and 9.67% ±0.23% as well as the carbon content is 2.84% and 2.85% from the manual method and the automatic method, respectively. The result indicates that the difference between the two methods is small. As a result, we can say thatthe graphite volume fraction of the sample is about 9.64% and the carbon content is about 2.84%.It is obviously that there exist some difference between the two methods. The manual point counting method is more accurate because it is difficult for us to choose the most suitable and accurate threshold when using the Image Tool. As a result we may calculate the impurity as the graphite or miss some small graphite particles, which lead to the inaccuracy .3.4.2 Error analysisEven though the error is not obvious, the error analysis is necessary.The reason that could demonstrate the error are list as follows:1)On the manual point counting methodi.The surface of the sample is not clean enough and may lead me to count the impurities as the grapheme particles mistakenly.ii. The brightness of the field of view isn’t be adjusted properly.iii.The micro-structure of the sample is heterogeneous, which leads to the asymmetrical of the number when we counting.iv. The amount of counting is not large enough to estimate the whole surface of the sample. And the points we count is on the 2-dimensional surface while the micro-structure is 3-dimensional, which result in the inner structure can’t be obtained.v. During the point counting process, we need to count a great amount of points with our eyes, which may lead to the eyestrain so that we can’t count accurately.2)On the automatic image methodi.The amount of photos we take is not large enough to estimate thewhole surface of the sample. And the photos we take is on the 2-dimensional surface while the micro-structure is 3-dimensional, which result in the inner structure can’t be obtained.ii. It is difficult for us to choose the most suitable and accurate threshold when using the Image Tool. As a result we may calculate the impurity as the graphite or miss some small graphite particles, which lead to the inaccuracy4.ConclusionsThe manual point counting method illustrates that the volume fraction of the volume fraction of the graphite is =9.64%, the standard deviation is =0.52% . The final estimate result is: on the 95% confidence level, the volume fraction of graphiteV=9.64%±0.52%. The carbon content of theVsample is 2.84%.As for the automatic image method, the volume fraction of the volume fraction of the graphite is =9.67% with the standard deviation 0.23% . The final estimate result is: on the 95% confidence level, the volume fraction of graphiteV=9.67%±0.23%. The carbon content of the sample is 2.85%.VAcknowledgementsThis experiment was supervised by Professor Guoquan LIU, the sample and the instruments were provided by Professor Guoquan LIU.References[1] The Metallographic Examination of Archaeological Artifacts -Laboratory Manual. MIT Summer Institute in Materials Science and Material Culture, June 2003[2] .E.E.Underwood, Quantitative Stereology, Addison-Wesley,1970[3] ./wiki/stereology[4]ASTM E562-02 Standard Test Method for Determining V olumeFraction by Systematic Manual Point Count。