Evidence for Massive Black Holes in Nearby Galactic Nuclei
- 格式:pdf
- 大小:287.32 KB
- 文档页数:10
a r X i v :0712.3538v 1 [a s t r o -p h ] 20 D e c 2007Draft version February 2,2008Preprint typeset using L A T E X style emulateapj v.10/09/06COMPARING SUZAKU AND XMM-NEWTON OBSERVATIONS OF THE SOFT X-RAY BACKGROUND:EVIDENCE FOR SOLAR WIND CHARGE EXCHANGE EMISSIONDavid B.Henley and Robin L.SheltonDepartment of Physics and Astronomy,University of Georgia,Athens,GA 30602Draft version February 2,2008ABSTRACTWe present an analysis of a pair of Suzaku spectra of the soft X-ray background (SXRB),obtained from pointings on and offa nearby shadowing filament in the southern Galactic hemisphere.Because of the different Galactic column densities in the two pointing directions,the observed emission from the Galactic halo has a different shape in the two spectra.We make use of this difference when modeling the spectra to separate the absorbed halo emission from the unabsorbed foreground emission from the Local Bubble (LB).The temperatures and emission measures we obtain are significantly different from those determined from an earlier analysis of XMM-Newton spectra from the same pointing directions.We attribute this difference to the presence of previously unrecognized solar wind charge exchange (SWCX)contamination in the XMM-Newton spectra,possibly due to a localized enhancement in the solar wind moving across the line of sight.Contemporaneous solar wind data from ACE show nothing unusual during the course of the XMM-Newton observations.Our results therefore suggest that simply examining contemporaneous solar wind data might be inadequate for determining if a spectrum of the SXRB is contaminated by SWCX emission.If our Suzaku spectra are not badly contaminatedby SWCX emission,our best-fitting LB model gives a temperature of log(T LB /K)=5.98+0.03−0.04and a pressure of p LB /k =13,100–16,100cm −3K.These values are lower than those obtained from other recent observations of the LB,suggesting the LB may not be isothermal and may not be in pressure equilibrium.Our halo modeling,meanwhile,suggests that neon may be enhanced relative to oxygen and iron,possibly because oxygen and iron are partly in dust.Subject headings:Galaxy:halo—Sun:solar wind—X-rays:diffuse background—X-rays:ISM1.INTRODUCTIONThe diffuse soft X-ray background (SXRB),which is observed in all directions in the ∼0.1–2keV band,is composed of emission from several different components.For many years,the observed 1/4-keV emission was believed to originate from the Local Bubble (LB),a cavity in the local interstellar medium (ISM)of ∼100pc radius filled with ∼106K gas (Sanders et al.1977;Cox &Reynolds 1987;McCammon &Sanders 1990;Snowden et al.1990).However,the discovery of shadows in the 1/4-keV background with ROSAT showed that ∼50%of the 1/4keV emission originates from beyond the LB (Burrows &Mendenhall 1991;Snowden et al.1991).This more distant emission origi-nates from the Galactic halo,which contains hot gas with temperatures log(T halo /K)∼6.0–6.5(Snowden et al.1998;Kuntz &Snowden 2000;Smith et al.2007;Galeazzi et al.2007;Henley,Shelton,&Kuntz 2007).As the halo gas is hotter than the LB gas,it also emits at higher energies,up to ∼1keV.Above ∼1keV the X-ray background is extragalactic in origin,and is due to un-resolved active galactic nuclei (AGN;Mushotzky et al.2000).X-ray spectroscopy of the SXRB can,in principle,de-termine the thermal properties,ionization state,and chemical abundances of the hot gas in the Galaxy.These properties give clues to the origin of the hot gas,which is currently uncertain.However,to de-termine the physical properties of the hot Galactic gas,one must first decompose the SXRB into its con-Electronic address:dbh@stituents.This is achieved using a technique called “shadowing”,which makes use of the above-mentioned shadows cast in the SXRB by cool clouds of gas be-tween the Earth and the halo.Low-spectral-resolution ROSAT observations of the SXRB were decomposed into their foreground and background components by modeling the intensity variation due to the varying absorption column density on and around shadow-ing clouds (Burrows &Mendenhall 1991;Snowden et al.1991,2000;Snowden,McCammon,&Verter 1993;Kuntz,Snowden,&Verter 1997).The same tech-nique was used to decompose ROSAT All-Sky Survey data over large areas of the sky (Snowden et al.1998;Kuntz &Snowden 2000).With higher resolution spectra,such as those from the CCD cameras onboard XMM-Newton or Suzaku ,it is possible to decompose the SXRB into its foreground and background components spectroscopically.This is achieved using one spectrum toward a shadowing cloud,and one toward a pointing to the side of the cloud.The spectral shape of the absorbed background component (and hence of the overall spectrum)will differ between the two directions,because of the different absorbing col-umn densities.Therefore,by fitting a suitable multicom-ponent model simultaneously to the two spectra,one can separate out the foreground and background emis-sion components.Such a model will typically consist of an unabsorbed single-temperature (1T )thermal plasma model for the LB,an absorbed thermal plasma model for the Galactic halo,and an absorbed power-law for the ex-tragalactic background.The Galactic halo model could be a 1T model,a two-temperature (2T )model,or a dif-2HENLEY AND SHELTONferential emission measure (DEM)model (Galeazzi et al.2007;Henley et al.2007;S.J.Lei et al.,in preparation).Recent work has shown that there is an additional complication,as X-ray emission can originate within the solar system,via solar wind charge exchange (SWCX;Cox 1998;Cravens 2000).In this process,highly ion-ized species in the solar wind interact with neutral atoms within the solar system.An electron transfers from a neutral atom into an excited energy level of a solar wind ion,which then decays radiatively,emitting an X-ray photon.The neutral atoms may be in the outer reaches of the Earth’s atmosphere (giving rise to geo-coronal emission),or they may be in interstellar ma-terial flowing through the solar system (giving rise to heliospheric emission).It has been estimated that the heliospheric emission may contribute up to ∼50%of the observed soft X-ray flux (Cravens 2000).The geocoro-nal emission is typically an order of magnitude fainter,but during solar wind enhancements it can be of similar brightness to the heliospheric emission (Wargelin et al.2004).SWCX line emission has been observed with Chandra ,XMM-Newton ,and Suzaku (Wargelin et al.2004;Snowden,Collier,&Kuntz 2004;Fujimoto et al.2007).As the SWCX emission is time varying,it cannot easily be modeled out of a spectrum of the SXRB.If SWCX contamination is not taken into account,analyses of SXRB spectra will yield incorrect results for the LB and halo gas.This paper contains a demonstra-tion of this fact.Henley et al.(2007)analyzed a pair of XMM-Newton spectra of the SXRB using the pre-viously described shadowing technique.One spectrum was from a direction toward a nearby shadowing filament in the southern Galactic hemisphere (d =230±30pc;Penprase et al.1998),while the other was from a direc-tion ∼2◦away.The filament and the shadow it casts in the 1/4-keV background are shown in Figure 1.Contem-poraneous solar wind data from the Advanced Composi-tion Explorer (ACE )showed that the solar wind was steady during the XMM-Newton observations,without any flares or spikes.The proton flux was slightly lower than average,and the oxygen ion ratios were fairly typ-ical.These observations led Henley et al.(2007)to con-clude that their spectra were unlikely to be severely con-taminated by SWCX ing a 2T halo model,they obtained a LB temperature of log(T LB /K)=6.06and halo temperatures of log(T halo /K)=5.93and 6.43.The LB temperature and the hotter halo temperature are in good agreement with other recent measurements of the SXRB using XMM-Newton and Suzaku (Galeazzi et al.2007;Smith et al.2007),and with analysis of the ROSAT All-Sky Survey (Kuntz &Snowden 2000).We have obtained spectra of the SXRB from the same directions as Henley et al.’s (2007)XMM-Newton spectra with the X-ray Imaging Spectrometer (XIS;Koyama et al.2007)onboard the Suzaku X-ray obser-vatory (Mitsuda et al.2007).The XIS is an excellent tool for studying the SXRB,due to its low non-X-ray background and good spectral resolution.Our Suzaku pointing directions are shown in Figure 1.We analyze our Suzaku spectra using the same shadowing technique used by Henley et al.(2007).We find that there is poor agreement between the results of our Suzaku analysis and the results of the XMM-Newton analysis in Henley et al.(2007).We attribute this discrepancy to previously un-Fig. 1.—The shadowing filament used for our observations,shown in Galactic coordinates.Grayscale :ROSAT All-Sky Sur-vey R1+R2intensity (Snowden et al.1997).Contours :IRAS 100-micron intensity (Schlegel et al.1998).Yellow squares :Our Suzaku pointing directions.recognized SWCX contamination in the XMM-Newton spectra,which means that SWCX contamination can oc-cur at times when the solar wind flux measured by ACE is low and does not show flares.This paper is organized as follows.The Suzaku obser-vations and data reduction are described in §2.The anal-ysis of the spectra using multicomponent spectral models is described in §3.The discrepancy between the Suzaku results and the XMM-Newton results is discussed in §4.This discrepancy is due to the presence of an additional emission component in the XMM-Newton spectra,which we also describe in §4.In §5we measure the total intensi-ties of the oxygen lines in our Suzaku and XMM-Newton spectra.We concentrate on these lines because they are the brightest in our spectra,and are a major component of the 3/4-keV SXRB (McCammon et al.2002).In §6we present a simple model for estimating the intensity of the oxygen lines due to SWCX,which we compare with our observations.We discuss our results in §7,and con-clude with a summary in §8.Throughout this paper we quote 1σerrors.2.OBSERVATIONS AND DATA REDUCTIONBoth of our observations were carried out in early 2006March.The details of the observations are shown in Ta-ble 1.In the following,we just analyze data from the back-illuminated XIS1chip,as it is more sensitive at lower energies than the three front-illuminated chips.Our data were initially processed at NASA Goddard Space Flight Center (GSFC)using processing version 1.2.2.3.We have carried out further processing and fil-tering,using HEAsoft 1v6.1.2and CIAO 2v3.4.We first combined the data taken in the 3×3and 5×5observa-tion modes.We then selected events with grades 0,2,3,4,and 6,and cleaned the data using the standard data selection criteria given in the Suzaku Data Reduc-tion Guide 3.We excluded the times that Suzaku passed through the South Atlantic Anomaly (SAA),and also times up to 436s after passage through the SAA.We also excluded times when Suzaku ’s line of sight was el-evated less than 10◦above the Earth’s limb and/or was1/lheasoft 2/ciao3/docs/suzaku/analysis/abc/abc.htmlOBSERVING CHARGE EXCHANGE WITH SUZAKU AND XMM-NEWTON3TABLE1Details of Our Suzaku ObservationsObservation l b Start time End time Usable exposureID(deg)(deg)(UT)(UT)(ks)Offfilament501001010278.71−47.072006-03-0116:56:012006-03-0222:29:1455.6Onfilament501002010278.65−45.302006-03-0320:52:002006-03-0608:01:1969.0less than20◦from the bright-Earth terminator.Finally,we excluded times when the cut-offrigidity(COR)wasless than8GV.This is a stricter criterion than that inthe Data Reduction Guide,which recommends exclud-ing times with COR<6GV.However,the higher CORthreshold helps reduce the particle background,and forobservations of the SXRB one desires as low a particlebackground as possible.The COR threshold that weuse has been used for other Suzaku observations of theSXRB(Fujimoto et al.2007;Smith et al.2007).Finally,we binned the2.5–8.5keV data into256-s time bins,andused the CIAO script analyzepublic4HENLEY AND SHELTON34:00.03:33:00.032:00.031:00.015:00.020:00.025:00.0-63:30:00.035:00.040:00.0Right ascensionD e c l i n a t i o nOn filament22:00.021:00.03:20:00.019:00.015:00.0-62:20:00.025:00.030:00.035:00.0Right ascensionD e c l i n a t i o nOff filamentFig.2.—Cleaned and smoothed Suzaku XIS1images in the 0.3–5keV band for our on-filament (left )and off-filament (right )observations.The data have been binned up by a factor of 4in the detector’s x and y directions,and then smoothed with a Gaussian whose standard deviation is equal to 1.5times the binned pixel size.The particle background has not been subtracted from the data.The red circles outline the regions that were excluded from the analysis (see text for details).in our fit (Snowden et al.1997).The R1and R2count-rates help constrain the model al lower energies (below ∼0.3keV),while the higher channels overlap in energy with our Suzaku spectra.We extracted the ROSAT spec-tra from 0.5◦radius circles centered on our two Suzaku pointing directions using the HEASARC X-ray Back-ground Tool 8v2.3.The spectral analysis was carried out using XSPEC 9v11.3.2(Arnaud 1996).For the thermal plasma com-ponents,we used the Astrophysical Plasma Emission Code (APEC)v1.3.1(Smith et al.2001)for the Suzaku data and the ROSAT R4–7bands,and the Raymond-Smith code (Raymond &Smith 1977and updates)for the ROSAT R1–3bands.For a given model component (i.e.,the LB or one of the two halo components),the tem-perature and normalization of the ROSAT Raymond-Smith model are tied to those of the corresponding Suzaku APEC model.We chose to use the Raymond-Smith code for the lower-energy ROSAT channels be-cause APEC’s spectral calculations below 0.25keV are inaccurate,due to a lack of data on transitions from L-shell ions of Ne,Mg,Al,Si,S,Ar,and Ca 10.As the upper-limit of the ROSAT R1and R2bands is 0.284keV,and the R3band also includes such low-energy photons (Snowden et al.1997),APEC is not ideal for fitting to these energy bands.For the absorption,we used the XSPEC phabs model,which uses cross-sections from Ba l uci´n ska-Church &McCammon (1992),with an updated He cross-section from Yan,Sadeghpour,&Dalgarno (1998).Following Henley et al.(2007),we used the interstellar chemical abundance table from Wilms,Allen,&McCray (2000).For many astrophysically abundant elements,these abundances are lower than those in the widely used solar abundance table of Anders &Grevesse (1989).However,recently several elements’solar photospheric abundances have been revised downwards (Asplund et al.2005),and are in good agreement with the Wilms et al.(2000)8/cgi-bin/Tools/xraybg/xraybg.pl9/docs/xanadu/xspec/xspec1110/atomdb/issuesOBSERVING CHARGE EXCHANGE WITH SUZAKU AND XMM-NEWTON5-4-2 0 2 40.3135channel energy (keV)(d a t a -m o d e l )/σ0.001 0.010.11c o u n t s s -1k e V-1On filamentLocal Bubble Halo (cold)Halo (hot)ExtragalacticInstrumental lines TotalO V I I O V I I IN e I XM g X I ?A l KS i KA u M -4-2 0 2 40.3135channel energy (keV)(d a t a -m o d e l )/σ0.0010.010.11c o u n t s s -1k e V-1Off filamentLocal Bubble Halo (cold)Halo (hot)ExtragalacticInstrumental lines TotalN V I I ?O V I I O V I I IN e I XA l KS i KA uMFig.3.—Our observed on-filament (left )and off-filament (right )Suzaku spectra,with the best-fitting model obtained by fitting jointly to the Suzaku and ROSAT data (Model 1in Table 7).The gap in the Si K instrumental line is where channels 500–504have been removed from the data (see §2).10100100010-6 c o u n t s s -1 a r c m i n-2-4-2 0 2 4R1R2R3R4R5R6R7ROSAT band(d a t a - m o d e l ) / σFig. 4.—The on-filament (dashed )and off-filament (solid )ROSAT All-Sky Survey spectra,compared with Model 1from Ta-ble 7.For clarity the individual model components have not been plotted.CALDB.This model component attenuated the emis-sion from the LB,halo,and extragalactic background for the Suzaku spectra only.We adjusted the model oxygen abundance to give C /O =6(Koyama et al.2007),and set the abundances of all other elements to zero.The results of this model are given as Model 2in Table 7.Figures 5and 6show this model com-pared with the Suzaku and ROSAT spectra,respec-tively.One can see from Figure 6that the fit to the ROSAT data is greatly improved.The model implies a column density of carbon atoms,N C =(0.28±0.04)×1018cm −2,in addition to the amount of contamina-tion given by the CALDB contamination model,which is N C =3.1×1018cm −2at the center of the XIS1chip(from the CALDB file aecontami xrtxis08.html6HENLEY AND SHELTON-4-2 0 2 40.3135channel energy (keV)(d a t a -m o d e l )/σ0.0010.010.1c o u n t s s -1k e V-1On filamentLocal Bubble Halo (cold)Halo (hot)ExtragalacticInstrumental lines Total-4-2 0 2 40.3135channel energy (keV)(d a t a -m o d e l )/σ0.0010.010.1c o u n t s s -1k e V-1Off filamentLocal Bubble Halo (cold)Halo (hot)ExtragalacticInstrumental linesTotalFig. 5.—As Figure 3,but with a vphabs component included for the Suzaku spectra to model XIS contamination above that included in the CALDB (Model 2in Table 7;see §3.2for details).10 100100010-6 c o u n t s s -1 a r c m i n-2-4-2 0 2 4R1R2R3R4R5R6R7ROSAT band(d a t a - m o d e l ) / σFig.6.—As Figure 5,but for Model 2from Table 7.In Model 5we fit exactly the same model to the Suzaku data alone.Without the ROSAT data,we cannot con-strain the LB temperature T LB .We therefore fix it at the value determined in Model 2:T LB =105.98K.We also fix N C for the vphabs contamination component at the Model 2value:N C =0.28×1018cm −2.The best-fitting model parameters are in very good agree-ment with those obtained by fitting jointly to the Suzaku and ROSAT spectra (compare Models 2and 5).We can only get consistent results between the Suzaku -ROSAT joint fit and the fit to just the Suzaku data by using a two-temperature model for the halo.However,note that the Model 5LB emission measure is consistent (within its errorbar)with zero.This is not to say that our data imply that there is no LB at all:as noted above,we need a LB component and two halo components to get a good joint fit to the Suzaku and ROSAT data.Instead,the Model 5results imply that our Suzaku data are consis-tent with the LB not producing significant emission in the Suzaku band (i.e.,E 0.3keV).Also shown in Table 7are the results of fitting our model (without any LB component)to the on-and off-filament Suzaku spectra individually (Models 6and 7,respectively).As has already been noted,the normaliza-tion of the extragalactic background differs significantly between the two spectra.However,the plasma model pa-rameters for the individual spectra are in good agreement with each other.These results seem to justify allowing the extragalactic normalization to differ between the two spectra while keeping all other model parameters equal for the two spectra.3.3.Chemical Abundances in the HaloWe investigated the chemical abundances of the X-ray-emissive halo gas by repeating the above-described mod-eling,but allowing the abundances of certain elements in the halo components to vary.In particular we wished to investigate whether or not varying the neon and magne-sium halo abundances improved the fits to the Ne ix and Mg xi features noted above.We also allowed the abun-dance of iron to vary,as iron is an important contributor of halo line emission to the Suzaku band.For this investigation we just fit to the Suzaku data,fixing the LB temperature at log(T LB /K)=5.98,and fixing the carbon column density of the vphabs contam-ination component at N C =0.28×1018cm −2.As we could not accurately determine the level of the contin-uum due to hydrogen,we could not measure absolute abundances.Instead,we estimated the abundances rel-ative to oxygen by holding the oxygen abundance at its Wilms et al.(2000)value,and allowing the abundances of neon,magnesium,and iron to vary.Both halo com-ponents were constrained to have the same abundances.The best-fitting temperatures and emission measures of the various model components are presented as Model 8in Table 7,and the abundances are presented in Table 2.The best-fitting model parameters are not significantly affected by allowing certain elements’abun-dances to vary (compare Model 8with Model 5).Iron does not seem to be enhanced or depleted relative to oxy-gen in the halo.Neon and magnesium both appear to be enhanced in the halo relative to oxygen,which is what one would expect from Figures 3and 5,as the modelsOBSERVING CHARGE EXCHANGE WITH SUZAKU AND XMM-NEWTON7 TABLE2Halo AbundancesElement AbundanceO1(fixed)Ne a1.8±0.4Mg a4.6+3.5−2.8Fe1.2+0.4−0.5Note.—Abun-dances are relative tothe Wilms et al.(2000)interstellar abundances:Ne/O=0.178,Mg/O=0.051,Fe/O=0.055.a These enhanced abun-dances may be an arte-fact of SWCX contami-nation;see§7.2.shown in thosefigures underpredict the neon and mag-nesium emission.We discuss these results in§§7.2and§7.5.In§7.2we discuss the possibility that the enhanced neon and mag-nesium emission is in fact due to SWCX contamination of these lines,rather than being due to these elements being enhanced in the halo.On the other hand,in§7.5 we discuss the implications of neon really being enhanced in the halo with respect to oxygen and iron.PARING THE SUZAKU AND XMM-NEWTONSPECTRAFor comparison,Table7also contains the results of the analysis of the XMM-Newton spectra from the same ob-servation directions by Henley et al.(2007).The Model9 results are taken directly from their“standard”model. However,it should be noted that Henley et al.(2007) used APEC to model all of their data,whereas in the analysis described above we used the Raymond-Smith code to model the ROSAT R1–3bands.We have therefore reanalyzed the XMM-Newton+ROSAT spec-tra,this time using the Raymond-Smith code to model the ROSAT R1–3bands,and using APEC to model the ROSAT R4–7bands and the XMM-Newton spec-tra.This new analysis allows a fairer comparison of our XMM-Newton results with our Suzaku results.The XMM-Newton spectra we analyzed are identical to those used by Henley et al.(2007)–see that paper for details of the data reduction.We added a broken power-law to the model to take into account soft-proton contamination in the XMM-Newton spectra.This broken power-law was not folded through XMM-Newton’s effective area, and was allowed to differ for the on-and off-filament datasets(see Henley et al.2007).The presence of this contamination means we cannot independently constrain the normalization of the extragalactic background.We therefore freeze the on-and off-filament normalizations at the Suzaku-determined values.The results of this new analysis are presented as Model10in Table7.As can be seen,there is poor agreement between the best-fit parameters of the Suzaku +ROSAT model(Model2)and the XMM-Newton+ ROSAT model(Model10).We believe this discrepancy is due to an extra emission component in the XMM-Newton spectra.In Figure7we plot the differences between the XMM-Newton spectra and our best-fitting0.10.20.30.40.5data-model(ctss-1keV-1)On filament MOS 1MOS 2 00.10.20.30.40.50.5125channel energy (keV)Off filament MOS 1MOS 2Fig.7.—The excesses in our on-filament(top)and off-filament (bottom)XMM-Newton spectra over our best-fitting model to the Suzaku+ROSAT data(Table7,Model2).The gap in the data between1.4and1.9keV is where two bright instrumental lines have been removed.Suzaku+ROSAT model(Model2from Table7).To our best-fitting Suzaku+ROSAT model we have added a broken power-law to model the soft-proton contami-nation in the XMM-Newton spectra.The parameters of this broken power-law are frozen at the values de-termined from thefitting to the XMM-Newton spectra described in the previous paragraph.The on-filament XMM-Newton spectra show excess line emission at∼0.57 and∼0.65keV,most likely due to O vii and O viii,re-spectively.The features in the off-filament spectra are not as clear.However,there appears to be excess O vii emission in the MOS1spectrum,and excess emission at ∼0.7keV(of uncertain origin)and∼0.9keV(proba-bly Ne ix)in the MOS2spectrum.We can estimate the significance of the excess emission by calculatingχ2 for the XMM-Newton data compared with the Suzaku +ROSAT model.We concentrate on the excess oxy-gen emission and calculateχ2for the0.5–0.7keV energy range.Wefindχ2=106.28for24degrees of freedom for the on-filament spectra,andχ2=43.03for22degrees of freedom for the off-filament spectra.These correspond toχ2probabilities of2.5×10−12and0.0047,respectively, implying that the excesses are significant in both sets of spectra at the1%level.We measure the intensities of the extra oxygen emis-sion byfittingδ-functions at E=0.570keV and 0.654keV to the excess spectra in Figure7.Wefit theseδ-functions simultaneously to the on-and off-filament XMM-Newton excess spectra.The intensities of the excess oxygen emission in the XMM-Newton spec-tra over the best-fitting Suzaku+ROSAT model are 3.8±0.5L.U.(O vii)and1.4±0.3L.U.(O viii).We believe that this excess oxygen emission is due to SWCX contamination in our XMM-Newton spectra.As noted in the Introduction,this was not taken into ac-count in the original analysis of the XMM-Newton spec-tra.This is because the solar windflux was steady and slightly below average during the XMM-Newton obser-vations,leading Henley et al.(2007)to conclude that SWCX contamination was unlikely to be significant.We discuss the SWCX contamination in our spectra further in§6.5.MEASURING THE OXYGEN LINES8HENLEY AND SHELTONAs well as using the above-described method to sep-arate the LB emission from the halo emission,we mea-sured the total intensities of the O vii complex and O viii line at∼0.57and∼0.65keV in each spectrum.These lines are a major component of the SXRB,accounting for the majority of the observed ROSAT R4diffuse back-ground that is not due to resolved extragalactic discrete sources(McCammon et al.2002),and are easily the most prominent lines in our Suzaku spectra.To measure the oxygen line intensities,we used a model consisting of an absorbed power-law,an absorbed APEC model whose oxygen abundance is set to zero,and two δ-functions to model the oxygen lines.As in the pre-vious section,the power-law models the extragalactic background,and its photon index was frozen at1.46 (Chen et al.1997).The APEC model,meanwhile,mod-els the line emission from elements other than oxygen, and the thermal continuum emission.The absorbing columns used were the same as those used in the ear-lier Suzaku analysis.As with our earlier analysis,we multiplied the whole model by a vphabs component to model the contamination on the optical blockingfilter which is in addition to that included in the CALDB con-tamination model(see§3.2).Wefix the carbon column density of this component at0.28×1018cm−2(Table7, Model2).Wefit this model simultaneously to our on-and off-filament spectra.However,all the model param-eters were independent for the two directions,except for the oxygen line energies–these were free parameters in thefit,but were constrained to be the same in the on-and off-filament spectra.We used essentially the same method to measure the oxygen line intensities in our XMM-Newton spectra.However,we did not use a vphabs contamination model,and,as before,we added a broken power-law to model the soft-proton contami-nation.Table3gives the energies and total observed intensities of the O vii and O viii emission measured from our Suzaku and XMM-Newton spectra.We can use the difference in the absorbing column for the on-and off-filament directions to decompose the ob-served line intensities into foreground(LB+SWCX)and background(halo)intensities.If I fg and I halo are the in-trinsic foreground and halo line intensities,respectively, then the observed on-filament intensity I on is given byI on=I fg+e−τon I halo,(1) whereτon is the on-filament optical depth at the energy of the line.There is a similar expression for the observed off-filament intensity I off,involving the off-filament op-tical depthτoff.These expressions can be rearranged to giveI fg=eτon I on−eτoff I offe−τon−e−τoff.(3) For the purposes of this decomposition,we use the Ba l uci´n ska-Church&McCammon(1992)cross-sections (with an updated He cross-section;Yan et al.1998)with the Wilms et al.(2000)interstellar abundances.We use the cross-sections at the measured energies of the lines. For the Suzaku measurements,the cross-sections we use are7.17×10−22cm2for O vii(E=0.564keV)and 4.66×10⁻²²cm2for O viii(E=0.658keV).For the XMM-Newton O vii emission we use a cross-section of 7.03×10⁻²²cm2(E=0.568keV).We cannot decom-pose the XMM-Newton O viii emission because the on-filament O viii line is brighter than the off-filament line. This gives rise to a negative halo intensity,which is un-physical.The results of this decomposition are presented in Ta-ble4.Note that the foreground oxygen intensities mea-sured from the Suzaku spectra are consistent with zero. This is consistent with our earlierfinding that the Suzaku spectra are consistent with there being no local emis-sion in the Suzaku band(see§3.2).The difference be-tween the foreground O vii intensities measured from our XMM-Newton and Suzaku spectra is5.1±3.1L.U.. This is consistent with the O vii intensity measured from the excess XMM-Newton emission over the best-fitting Suzaku+ROSAT model(3.8±0.5L.U.;see§4).The halo O vii intensities measured from our XMM-Newton and Suzaku spectra are consistent with each other.This is as expected,as we would not expect the halo intensity to significantly change in∼4years.6.MODELING THE SOLAR WIND CHARGE EXCHANGEEMISSIONIn§§4and5we presented evidence that our XMM-Newton spectra contain an extra emission component,in addition to the components needed to explain the Suzaku spectra.In particular,the O vii and O viii emission are enhanced in the XMM-Newton spectra.We attribute this extra component to SWCX emission,as it seems unlikely to be due to a change in the Local Bubble or halo emission.This extra component helps explain why our XMM-Newton and Suzaku analyses give such different results in Table7.Previous observations of SWCX have found that in-creases in the SWCX emission are associated with en-hancements in the solar wind,as measured by ACE. These enhancements consist of an increase in the pro-tonflux,and may also include a shift in the ionization balance to higher ionization stages(Snowden et al.2004; Fujimoto et al.2007).In§6.1,we present a simple model for heliospheric and geocoronal SWCX emission,and use contemporaneous solar wind data from the ACE and WIND satellites to determine whether or not the ob-served enhancement of the oxygen lines in the XMM-Newton spectra is due to differences in the solar wind between our two sets of observations.In addition to the variability associated with solar wind enhancements,the heliospheric SWCX intensity is also expected to vary during the solar cycle,due to the dif-ferent states of the solar wind at solar maximum and solar minimum(Koutroumpa et al.2006).As our two sets of observations were taken∼4years apart,at differ-ent points in the solar cycle,in§6.2we examine whether the SWCX intensity variation during the solar cycle can explain our observations.6.1.A Simple Model for Heliospheric and GeocoronalSWCX Emission6.1.1.The BasicsA SWCX line from a X+n ion of element X results from a charge exchange interaction between a X+(n+1) ion in the solar wind and a neutral atom.The intensity of that line therefore depends on the density of X+(n+1)。
Probing the Physics of Active Galactic Nuclei by Multiwavelength MonitoringASP Conference Series,Vol.TBD,2000B.M.Peterson,R.S.Polidan,and R.W.PoggeRadio-Variability in Radio-Quiet Quasars andLow-Luminosity AGNHeino FalckeMax-Planck-Institut f¨u r Radioastronomie,Auf dem H¨u gel69,53121Bonn,Germany(hfalcke@mpifr-bonn.mpg.de)Joseph Leh´a rHarvard-Smithsonian Center for Astrophysics,60Garden Street,Cambridge,MA02138Richard BarvainisNational Science Foundation,4201Wilson Boulevard,Arlington,VA22230(rbarvai@)Neil M.Nagar1,Andrew S.Wilson2Astronomy Department,University of Maryland,College Park,MD20742-2421(neil,wilson@)Abstract.We report on two surveys of radio-weak AGN to look for radio variability.Wefind significant variability with an RMS of10-20% on a timescale of months in radio-quiet and radio-intermediate quasars.This exceeds the variability of radio cores in radio-loud quasars(exclud-ing blazars),which vary only on a few percent level.The variability in radio-quiet quasars confirms that the radio emission in these sources is indeed related to the AGN.The most extremely variable source is the radio-intermediate quasar III Zw2which was recently found to containa relativistic jet.In addition wefind large amplitude variabilities(up to300%peak-to-peak)in a sample of nearby low-luminosity AGN,Liners and dwarf-Seyferts,on a timescale of1.5years.The variability could be related to the activity of nuclear jets responding to changing accretion rates.Simultaneous radio/optical/X-ray monitoring also for radio-weak AGN, and not just for blazars,is therefore a potentially powerful tool to study the link between jets and accretionflows.2Falcke et al.1.IntroductionIn the past a lot of emphasis has been put on studying the radio variability of radio-loud AGN and specifically those of blazars(Wagner&Witzel1995). There the radio emission is most certainly due to a relativistically beamed jet and one goal of multi-wavelength monitoring,including radio,is to understand particle acceleration processes in the jet plasma as well as the relativistic effects associated with the changing geometry and structure of jets.On the other hand,for radio-weak AGN–here meant to include everything but radio-loud quasars–the situation is somewhat different and the database is much sparser.In fact,very few surveys exist that address the issue of radio variability in either radio-quiet quasars or low-luminosity AGN such as Liners and dwarf-Seyferts(e.g.,Barvainis,Lonsdale,&Antonucci1996;Ho et al.1999). In many of these cases we are not even entirely sure that the radio emission is indeed related to the AGN itself.It has been proposed that radio jets are a natural product of AGN,even that accretionflow and jet form a symbiotic system(Falcke&Biermann1995), and this view seems to catch on(e.g.,Livio1997).This also implies a prediction for radio emission from nuclear jets across the astrophysical spectrum of AGN, including those being of low power or being radio-weak(Falcke&Biermann 1999).For radio-quiet quasars some evidence exists that this is indeed the case,like thefinding of optical/radio correlations(e.g.,Baum&Heckman1989; Miller,Rawlings,&Saunders1993;Falcke,Malkan,&Biermann1995),or the detection of high-brightness temperature radio cores in a few radio-quiet quasars (Blundell&Beasley1998).Clearly,if(some of)the radio-emission in radio-weak AGN is coming from the central engine,we would expect to see a certain degree of radio variability as seen in other wavebands.Finding this would,firstly,confirm the AGN nature of the radio emission and,secondly,allow us to study the link between accretion flows and radio jet in more detail.In a symbiotic picture of accretion disk and radio jet one would expect to see a change in the accretion ratefirst reflected in a change in optical emission and then later in a change in the radio emission. The type of radio variability found in radio-weak AGN should also depend on whether or not the jets are relativistic and whether or not they are pointing towards the observer.To start addressing some of these questions we have started a number of projects targeted at different classes of AGN–mainly radio-quiet quasars and LINERs.In the following we will present a report offirst and preliminary results of these projects.2.Radio-Quiet and Radio-Intermediate QuasarsTo study the radio-variability of quasars we selected a sample of thirty sources from the PG quasar sample(Schmidt&Green1983;Kellermann et al.1994), the LBQS sample(Visnovsky et al.1992;Hooper et al.1995;Hooper et al. 1996),and the NVSS(Bischof&Becker1997).The sources were selected to give a detectableflux density at3.6cm(8.5GHz)above0.3mJy and to roughly equallyfill the parameter space of the radio-to-opticalflux ratio(R),includingRadio-Variability in Radio-Weak AGN3 radio-quiet(RQQ,R<3),radio-intermediate(RIQ,3<R<100),and radio-loud quasars(RLQ,R>100,see Falcke,Sherwood,&Patnaik1996).In the end we had10,13,and7objects respectively in each category.The quasars were observed with the VLA roughly every month for eight epochs and then at one more epoch a year later.Integration times varied between 2and12minutes.Where applicable,i.e.for some radio-loud quasars,we picked out the compact core and ignored emission from the extended lobes.The other sources appeared point-like on themaps.Figure1.Light Curves of four selected quasars–three radio-quietand one radio-intermediate–from our survey as observed with theVLA at8.5GHz over two years.Three of the sources show significantvariation within a year,while L0010+01does not.A few sample light curves are shown in Figure1.Error bars include statis-tical and systematic(calibration uncertainties)errors.Thefigure shows that in some cases we have distinctflux density variations within one year.Despite the rather low,li-Jansky,flux density level we are able to clearly trace the variations from month to month in some of these galaxies.For comparison we also show one rather faint quasar where we consistently measure a constantflux density from epoch to epoch.This demonstrates that measuring radio-variability even in radio quiet quasars is not too much of a daunting task anymore.The overall result of our survey is shown in Fig.2,where we plot a debiased variability index V against the R-parameter.The index is defined here asV=N· Sν,(1)where N is the number of data points,σis the measurement error,and Sν is the meanflux density(see Akritas&Bershady1996).We set the index to4Falcke et al.Figure2.Debiased variability index for all sources in our survey ver-sus the radio-to-opticalflux ratio(R-parameter).A negative index in-dicates a non-significant variability.The sources are categorized simplyas radio-quiet(triangles),radio-intermediate(boxes),and radio-loud(squares)according to their R-parameter alone.Open circles representcalibrator sources many of which are typically blazars.The variabilityindex of III Zw2–the highest point in the diagram–is shown hereonly as a lower limit to keep the scale of the plot in reasonable bounds.be negative when the value inside the square root becomes negative(i.e.,for non-variable sources where the error bars are too conservative).In about80%of the sources wefind at least some marginal evidence for variability.The variability index is about10-20%in the RQQs and RIQs and only a few percent for RLQs.Most of the radio cores in the RIQs and RLQs haveflat to inverted radio spectra and there may be a trend for higher variability with more inverted spectra.We point out,that our sample does not include blazars.However,many of our phase calibrators naturally are.Surprisingly,these heterogeneously selected calibrators do show a variability that is not too distinct from the RLQs&RIQs in our sample.The nature of RIQs had been discussed in the literature ler, Rawlings,&Saunders(1993)and Falcke,Sherwood,&Patnaik(1996)had sug-gested that they could be the relativistically boosted counter-parts to radio-quiet quasars.And indeed three out of the two RIQs discussed by Falcke,Sherwood, &Patnaik(1996),III Zw2and PG2209+18,are included here and show some of the highest variability amplitudes observed in our survey.Recently Brunthaler et al.(2000)detected superluminal expansion–a clear indication of relativisticRadio-Variability in Radio-Weak AGN5 motion–in the former1.The fact that wefind similarly strong variability in some RQQs could also point to the activity of relativistic jets.Clearly,since the radio emission at centimeter wavelengths should come from the parsec scale (because of self-absorption arguments,e.g.,Falcke&Biermann1995)–a vari-ability timescale of months could not be achieved by jets with highly sub-luminal speeds.Overall,thefinding of variability in many RQQs and RIQs strengthens the conclusion that the radio emission detected in these quasars is indeed produced by the AGN.The rather low level of variability in the cores of radio-loud quasars is rather puzzling and might be related to larger black hole masses and thus longer timescales.The absence of relativistic beaming due to larger inclination angles(in contrast to blazars)and perhaps the presence of slow-moving cocoons surrounding the inner fast jets(e.g.,Cygnus A,Krichbaum et al.1998)could also play a role.3.LLAGN:LINERs and Dwarf-SeyfertsAnother group of AGN for which radio variability has not been studied in a co-herent fashion are low-luminosity AGN(LLAGN).Almost a third of all galaxies in our cosmic neighborhood show evidence for low-level nuclear activity in emis-sion lines,i.e.show Liner or Seyfert spectra(Ho,Filippenko,&Sargent1997). In many of these cases it is not entirely clear whether the activity is due to stars or a central black hole.We have used the VLA and VLBA to observe two samples of nearby LLAGN. One of them was a distance-limited sample of LLAGN within19Mpc,the other consisted of a collection of48well-studied Liners and a few dwarf-Seyferts.The VLA survey revealed a remarkable high detection rate of compact radio cores at15GHz(Nagar et al.2000).Initial VLBA observations of the smaller sam-ple confirm that these sources have high brightness temperature radio cores indicative of AGN(Falcke et al.2000b).For the sources in our combined sam-ples withflux densities above3mJy at15GHz and aflat radio spectrum we have now a100%detection rate with VLBI(Falcke et al.2000a).This shows that a large fraction(∼50%)of LINERS and dwarf-Seyferts are indeed genuine AGN.In addition,having two frequencies and in some cases more,wefind no evidence for highly inverted radio cores as predicted in the ADAF model:the (non-simultaneous)spectral indices are on average aroundα=0.0.In the six brightest sources we detect extended emission which appears to originate in jets. Together with the spectral indices this suggests that the nuclear emission at cen-timeter radio waves is largely dominated by emission from radio jets rather than an ADAF(Falcke&Biermann1999),very similar to the situation in more lu-minous AGN.The energy released in these jets could be a significant fraction of the energy budget in the accretionflow.Hence,there is ample reason to also consider the radio variability of LLAGN and perhaps learn more about the underlying black hole/accretionflow system powering them.6Falcke et al.As a by-product of our observing program,we have a number of sources that were observed several times and hence can be used to obtain some initial and basic information on LLAGN radio variability.In fact,all 18sources in our combined samples with flux densities above 3mJy (the sample studied also by the VLBA)were observed at least two times;those who were part of our first sample (48LLAGN)were observed three times,all epochs separated by roughly1.5years.All observations were made in a similar manner at 15GHz with the VLA in A-configuration.This way we are not affected by resolution effects –from the VLBI observations we know that basically all the flux on this scale and at this frequency comes from a compact mas-component,i.e.the core.F l u x d e n s i t y [m J y ]Figure 3.Radio light curves at 15GHz taken with the VLA in A-configuration for radio cores in low-luminosity AGN from our sample.The vertical line gives the average flux density level for all epochs.The error bars only reflect the r.m.s.error and not calibration uncertainties.As an example,simple light curves are shown in Figure 3.Again,the milli-Jansky level radio flux density is not a major problem in detecting variability.Surprisingly,we find a number of sources with rather large variations.HighlyRadio-Variability in Radio-Weak AGN 7significant peak-to-peak variability of 200-300%is seen for example in the radio cores of NGC2787,NGC4143,and NGC4565.Variability IndexN u m b e r Figure 4.Distribution of variability index for all LLAGN in our sam-ples with flux density larger than 3mJy at 15GHz.This is very pre-liminary,since it includes only 2-3epochs per source.For such sparsely sampled light curves a variability index is rather ill-defined for individual sources.Nevertheless,we can assume that in a statistically useful sample as ours the distribution of the variability index (i.e.the r.m.s.divided by the mean),as shown in Fig.4,will have some meaning.The general trend of this distribution confirms the first impression from looking at the light curves:vari-ability on a timescale of years is common place among LLAGN and amplitudes can reach rather large values –from 20-70%.This variability is even larger than the one seen in quasars.The rather large fraction of LLAGN with radio cores and the fact that our sample was initially optically selected,speaks for a rather broad range of inclination angles.Strong variations in the accretion rate rather than effects of relativistic boosting therefore seem to be a more likely explanation for the variability.This would be in line with some of the X-ray variability seen in LLAGN where on scales of years the flux has changed by factors of a few (e.g.,Uttley et al.1999).The apparent difference in variability index between LLAGN and RQQs seen here could be related to possibly smaller black hole masses in the former.Since we are probing only a narrow range of time scales in our programs it could well be that for larger black hole masses the time scale of strong variability is significant larger than a year and hence remains undetected.Alternatively,one could postulate a different type of accretion which is more volatile in LLAGN than in quasars.For example,if the accretion onto the central black hole is fed by stellar winds from a few sources only,as speculated for example for the Galactic Center (Coker &Melia 1997),then evolution and change in orbits of individual stars can have a much more pronounced effect on the overall accretion rate than in a situation where the accretion proceeds through a large scale and massive accretion disk.8Falcke et al.4.SummaryWe have established significant intra-year variability in a sample of radio-quiet and radio-intermediate quasars as well as in a sample of low-luminosity AGN. The variability in quasars strengthens the notion that also in supposedly radio-quiet quasars the radio emission is produced by the AGN–a large fraction of that very close to the central engine.The strong variability could be related to the presence of relativistic jets in at least some RQQs and RIQs.In the radio cores of low-luminosity AGN the radio variability on the time-scales probed here–roughly one year–seems to be even higher.Lower black hole masses could be one possible explanation.The detection of radio cores and radio-variability in these sources opens up the possibility to obtain a closer look on the connection between jet formation and accretionflows through coordinated optical/X-ray/radio monitoring also for radio-weak AGN.Changes in the accretion rate should be reflected also in the radio emission.Already now one can speculate that from the large radio-variability of some Liners and dwarf-Seyfert rather largefluctuations in the accretion rate are expected.Future long-term monitoring campaigns should therefore seriously consider including radio monitoring as well,even if theflux densities are only a few milli-Jansky in a compact core.Acknowledgments.this works summarizes two partially unpublished re-sults from various projects.The work was split in the following manner:RB& JL were involved in the quasar monitoring while AW&NN were involved in the LLAGN observations.ReferencesAkritas,M.G.,&Bershady,M.A.1996,ApJ,470,706Barvainis,R.,Lonsdale,C.,&Antonucci,R.1996,AJ,111,1431Baum,S.A.,&Heckman,T.1989,ApJ,336,702Bischof,O.B.,&Becker,R.H.1997,AJ,113,2000Blundell,K.M.,&Beasley,A.J.1998,MNRAS,299,165Brunthaler,A.,Falcke,H.,Bower,G.C.,Aller,M.F.,Aller,H.D.,Ter¨a sranta,H.,Lobanov,A.P.,Krichbaum,T.P.,&Patnaik,A.R.2000,A&A,357,L45Coker,R.F.,&Melia,F.1997,ApJ,488,L149Falcke,H.,&Biermann,P.L.1995,A&A,293,665Falcke,H.,&Biermann,P.L.1999,A&A,342,49Falcke,H.,Malkan,M.A.,&Biermann,P.L.1995,A&A,298,375Falcke,H.,Nagar,N.M.,Wilson,A.S.,&Ulvestad,J.S.2000a,in Black Holes in Binaries and Galactic Nuclei,ESO Workshop,ed.P.W.L.Kaper,E.P.J.van den Heuvel(Springer Verlag),in pressFalcke,H.,Nagar,N.M.,Wilson,A.S.,&Ulvestad,J.S.2000b,ApJ,in press Falcke,H.,Sherwood,W.,&Patnaik,A.R.1996,ApJ,471,106Ho,L.C.,Filippenko,A.V.,&Sargent,W.L.W.1997,ApJ,487,568Radio-Variability in Radio-Weak AGN9 Ho,L.C.,van Dyk,S.D.,Pooley,G.G.,Sramek,R.A.,&Weiler,K.W.1999, AJ,118,843Hooper,E.J.,Impey,C.D.,Foltz,C.B.,&Hewett,P.C.1995,ApJ,445,62 Hooper,E.J.,Impey,C.D.,Foltz,C.B.,&Hewett,P.C.1996,ApJ,473,746 Kellermann,K.I.,Sramek,R.A.,Schmidt,M.,Green,R.F.,&Shaffer,D.B.1994,AJ,108,1163Krichbaum,T.P.,Alef,W.,Witzel,A.,Zensus,J.A.,Booth,R.S.,Greve,A., &Rogers,A.E.E.1998,A&A,329,873Livio,M.1997,in Accretion Phenomena and Related Outflows;IAU Colloquium 163,ed. D.T.Wickramasinghe,G.V.Bicknell,and L.Ferrario,ASP Conference Series,Vol.121,845Miller,P.,Rawlings,S.,&Saunders,R.1993,MNRAS,263,425Nagar,N.M.,Falcke,H.,Wilson,A.S.,&Ho,L.C.2000,ApJ,in press Schmidt,M.,&Green,R.F.1983,ApJ,269,352Uttley,P.,McHardy,I.M.,Papadakis,I.E.,Guainazzi,M.,&Fruscione,A.1999,MNRAS,307,L6Visnovsky,K.L.,Impey,C.D.,Foltz,C.B.,Hewett,P.C.,Weymann,R.J.,& Morris,S.L.1992,ApJ,391,560Wagner,S.J.,&Witzel,A.1995,ARA&A,33,163。
活动星系核VLBI 观测的新进展蒋栋荣(1,2)(1.中国科学院上海天文台,上海200030;2.国家天文台,北京100012)摘要:介绍了活动星系核(AGN )的VLBI 观测的新近展,特别关注其中心结构和低光度的活动星系核。
主要目的是强调VLBI 观测在该领域的重要性。
关键词:VLBI 技术;活动星系核中图分类号:P 157.6 文献标识码:A 1001-7526(2003)01-0037-04Progress in the VLBI observation of AG NsJI ANG Dong -rong 1,2(1.Shanghai Astronomical Observatory ,The Chinese Academy of Sciences ,Shanghai 200030,China ;2.National Astronomical Observatories ,The Chinese Academy of Sciences ,Beijing 100012,China .E -mail :djiang @center .s hao .ac .cn )A bstract :This paper r eports some recent pr ogresses in the VLBI observation of the AGNs ,specially those in the investigations about the central structure of the AGNs and the low luminosity AGNs .The main goal is to sho w the importance of the VLBI observations in this field .Key words :VLBI ;active galactic nuclei1 INTRODUC TIONAs the improvement of the sensitivity and angular resolution ,the Ver y Long Baseline Interferometry (VLBI )has become a po werful tool to pr obe the most compact structur e in the various astronomical objects ,including the active galactic nuclei (AGN ),the micr oquasars in the Milk Way ,the astronomical masers and radio stars .The VLBI observations of the radio emission in the radio -loud AGNs have made many contributions to the development of the relativistic jet model and the standard model of AGNs .The one -side pc scale jet and the apparent superluminal motion (SLM )of the components in the compact structure in the radio -loud AGNs suggested that the bulk motion of the pc scale jet is 2003No .1 云 南 天 文 台 台 刊Publications of Yunnan Observatory 2003年第1期Foundati on item :This work was funded by the NKBR SF (G1999075403)收稿日期:2002-10-08relativistic and the relativistic beaming in these objects is important .The alignment between the pc scale jet and the kpc scale emission gives the evidence that the central engine supports the ener gy of the radio emission on the large scale .All these makes the radio jet as the one of the main activities in the central engine of the AGNs .Since the ne w progr ess in the field is so plentiful ,in this paper we report only some new results form the literature ,specially those on the investigations about the central structure of the AGNs and the lo w luminosity AGNs .The main goal is to show the importance of the VLBI observations in this field .2 SOME NEW RESULTS2.1 central Black holeThe spectral line VLBI observations at 22GHz in the central nucleus of the NGC 4258r evealed that the H 2O maser spots are distributed on a thin sub -pc scale disk ,the high velocity maser featur es have a Keplerian distribution of the velocities ,which indicate the pr esence of a mass of3.6×107solar masses in a region less than 0.13pc ,the central object is very possible aSuppermassive black hole .(Miyoshi et al .1995,Greenhill et al .1995)[1,2].2.2 jet formationThe global VLBI high resolution image of M87at 43GHz sho ws a broad jet near the center ,the jet opening angle decreases as the distance within 1pc from the VLBI core .Apparently ,the jetcollimation is on scales more than 0.04pc (corresponding to 100r s )(Junor et al .1999)[3].Thismay be the first time that the VLBI observation can probe the process on the jet for mation and collimation in the AGNs .2.3 disk and torusIn the inner regions of the disks in AGNs ,a lar ge fraction of the gas must be ionized by the central engine ,and this results in the free -free absorption of the radio continuum emission .When the orientation of the pc scale jet is near the sky plane ,the jet and counter -jet are detected with the VLBI ,then the structure of the accretion disk can be probed through the free -free absorption of the synchrotron emission .The best example is the near FRI galaxy NGC4161,the multi -band VLBI investigation suggested that the average electron number density in the inner 0.1pc is 103-108c m -3and the mass of the ionized gas in the disk is 101-103solar masses (Jones et al .2000)[4].The neutral gas in the circumnuclear torus results in the 21cm HI absorption line ,ther efore the VLBI observation of the broad absorption line toward the central r egion will provide the important infor mation about the distribution and the kinematics of the gas in the torus .The several radio galaxies and Compact Symmetric Objects (CSOs )have been probed by the HI line VLBI .In PKS 2322-123,the absorption lines are redshifted with respect to the systemic velocity ,and thissuggested that ther e are inward strea ming motions in this atomic torus (Taylor et al .1999)[5].38 云 南 天 文 台 台 刊 2003年2.4 Space VLBIThe VSOP is the first space VLBI mission ,together with the ground telescopes that pr oduces a lot of high resolution images of the jets in the AGNs .The one of the results in the survey project shown that there is a significant fraction of sources ,of which the brightness temperature in thesource -frame is greater than 1012K (Lovell et al .2000)[6].The radio emission acr oss the jet inthe VSOP image of the 3C273was r esolved ,a double helix structure was found (Lobanov and Zensus 2001)[7].The statistic results of the PR sample provided more evidence of the relativisticbea m in these sources (Lister et al .2001)[8].2.5 Lo w luminosity AGNsThe difference between the radio -loud and the radio -quite AGNs is still an open question .The infor mation about the compact structure of the radio emission in the low luminosity AGNs is very important for understanding the properties of the radio emission and the role of the relativistic bea ming effect in the unified scheme .Thanks to the high sensitivity of the current VLBI observation ,it is possible to study the structure of the radio emission on the pc scale .A apparent transversal velocity of 2.7c was detected in the pc scale jet of the giant ,lo w -power radio galaxyB21144+35(Giovannini et al .1999)[9].In the VLBI monitoring of the Seyfert 1galaxy ⅢZw 2,the inner jet suddenly expanded during about a few months with a speed about 1.2c ,and it is the first detected SL M in the inner radio jet of the spiral galaxy (Br unthaler et al .2000)[10].These r esults suggested that the inner jets in the low luminosity AGNs is also r elativistic ,at least in some sources .The VLBA observation of a sample of nearby LINER galaxies revealed high brightness temperature radio cores in their nuclei ,the average T b is about 1.0×10⁸K .In the brightest cores the VLB A resolved the radio emission into jet -like structures (Falc ke et al .2000)[11].European VLBI Net w or k (EVN )1.6GHz observation of the Hubble Deep Field region detected three radiosources at about 210μJy /bea m detection level (Garrett et al .2001)[12].The mor e systematic study of the radio structur e on the pc scale in the lo w luminosity AGNs is certainly needed for well understanding the differ ence between the radio -loud and radio -quite AGNs and the connection between the AGNs and the starburst system .3 THE FUTURE IN ASIAIn East -Asia ,the VLBI at high frequencies will be developed ,including the Japanese pr ojects ,VLBI E xploration of Radio Astrometry (VERA )and the secondary space VLBI mission VSOP -2,and Korean VLBI Network (KVN ).The VLBI community in China hase to think the possibility for jointing the regional c ooperation in this field .39第1期 蒋栋荣:活动星系核VLBI 观测的新进展 References[1] Miyoshi M ,Moran J M ,Herrnstein J R ,et al .Natur e ,1995,373:127.[2] Greenhill L J ,Jiang D R ,Moran J M ,et al .ApJ .,1995,440:619.[3] Junor W ,Biretta J A ,Livio M .Natur e ,1999,401:891.[4] Jones D L ,Wehrle A E ,Meier D L ,et al .ApJ .,2000,534:165.[5] Taylor G B ,OD ′ea C P ,Peck A B ,et al .ApJ .,1999,512:L27.[6] Lovell J E J ,Horiuchi S ,Moellenbrock G ,et al .In :H Hiraba yashi et al ,eds .Astrophysical Phenomena Revealed by Space VLBI ,Kanaga wa :ISAS ,2000,183.[7] Lobanov A P ,Zensus J A .Sci .,2001,294:128.[8] Lister M L ,Tingay S J ,Preston R A .ApJ .,2001,554:964.[9] Giovannini G ,Taylor G B ,Arbizzani E ,et al .ApJ .,1999,522:101.[10] Brunthaler A ,Falcke H ,Bower G C ,et al .A &A .,2000,357:L45.[11] Falcke H ,Nagar N M ,Wilson A S ,et al .ApJ .,2000,542:197.[12] Garrett M A ,Muxlo w T W B ,Garrington S T ,et al .A &A .,2001,L5.40 云 南 天 文 台 台 刊 2003年。
a rXiv:as tr o-ph/998255v123Aug1999Accepted –To appear in The Astrophysical Journal.Parsec-Scale Images of Flat-Spectrum Radio Sources in Seyfert Galaxies C.G.Mundell Department of Astronomy,University of Maryland,College Park,MD,20742,USA;A.S.Wilson 1Department of Astronomy,University of Maryland,College Park,MD,20742,USA;J.S.Ulvestad National Radio Astronomy Observatory,P.O.Box O,Socorro,NM,87801,USA;A.L.Roy 2National Radio Astronomy Observatory,P.O.Box O,Socorro,NM,87801,USA ABSTRACT We present high angular resolution (∼2mas)radio continuum observations of five Seyfert galaxies with flat-spectrum radio nuclei,using the VLBA at 8.4GHz.The goal of the project is to test whether these flat-spectrum cores represent thermal emission from the accretion disk,as inferred previously by Gallimore et al.for NGC 1068,or non-thermal,synchrotron self-absorbed emission,which is believed to be responsible for more powerful,flat-spectrum nuclear sources in radio galaxies and quasars.In four sources (T0109−383,NGC 2110,NGC 5252,Mrk 926),the nuclear source is detected but unresolved by the VLBA,indicating brightness temperatures in excess of 108K and sizes,on average,less than 1pc.We argue that the radio emission is non-thermal and synchrotron self-absorbed in these galaxies,but Doppler boosting by relativistic outflows is not required.Synchrotron self-absorption brightness temperatures suggest intrinsic source sizes smaller than ∼0.05−0.2pc,for these four galaxies,the smallest of which corresponds to a light-crossing time of ∼60light days or 104gravitational radii for a 108M ⊙black hole.In one of these galaxies (NGC 2110),there is alsoextended(∼0.2pc)radio emission along the same direction as the400-pc scalejet seen with the VLA,suggesting that the extended emission comes from thebase of the jet.In another galaxy(NGC4388),theflat-spectrum nuclear sourceis undetected by the VLBA.We also present MERLIN and VLA observations ofthis galaxy and argue that the observed,flat-spectrum,nuclear radio emissionrepresents optically thin,free-free radiation from dense thermal gas on scales≃0.4to a few pc.It is notable that the two Seyfert galaxies with detectedthermal nuclear radio emission(NGC1068and NGC4388)both have largeX-ray absorbing columns,suggesting that columns in excess of≃1024cm−2areneeded for such disks to be detectable.Subject headings:accretion disks—galaxies:active—galaxies:jets—galaxies:nuclei—galaxies:Seyfert1.IntroductionIt has become generally accepted that supermassive black holes(SBH)lie at the center of most,if not all,galaxies(e.g.,Richstone et al.,1998;van der Marel,1999),with some lying dormant and others being triggered into an active phase to produce active galactic nuclei(AGN)(e.g.,Haehnelt&Rees,1993;Silk&Rees,1998).The power source for this activity is thought to be accretion of material onto the SBH,with the infalling material forming an accretion disk which,depending on detailed conditions,then regulates the fueling rate(e.g.Narayan&Yi,1994;Kato,Fukue&Mineshige,1998;Blandford& Begelman,1998).The radius to which these accretion disks extend(and hence become more easily observable)is not well established,but current AGN unification schemes advocate a geometrically thick and clumpy torus(e.g.Krolik&Begelman,1988;Krolik and Lepp, 1989;Pier&Krolik,1992)or warped thin disk(Miyoshi et al.,1995;Greenhill et al.,1995; Herrnstein,Greenhill&Moran,1996;Pringle,1996;Maloney,Begelman&Pringle,1996) which hides the nucleus when viewed edge-on.Our viewing angle with respect to the torus or disk is then responsible for the observed differences between narrow-line AGNs(e.g Seyfert2’s),in which our view of the nuclear broad-line region is obscured(edge-on view), and unobscured(pole-on view)broad-line AGNs(e.g.Seyfert1’s).Indirect evidence in support of such tori includes the discovery of broad lines in the polarized(hence scattered) light of Seyfert2s(Antonucci&Miller,1985;Tran,1995),sharp-edged bi-cones of ionized gas(e.g.,Wilson&Tsvetanov,1994)photo-ionized by anisotropic nuclear UV radiation (perhaps originating from the accretion disk and further collimated by the torus),large gas column densities(1023−25cm−2)to the nuclei of Seyfert2’s,inferred from photoelectricabsorption of soft X-rays(Turner et al.,1997)and strong mid-infrared emission in both Seyfert types(e.g.,Antonucci,1993;Alonso-Herrero,Ward&Kotilainen,1996).Recent,high-resolution studies at optical and radio wavelengths have begun to provide more direct evidence for‘nuclear’disks on size-scales ranging from the∼100-1000-pc diameter dusty disks imaged by HST(Jaffe et al.,1993;Ford et al.,1994;Carollo et al., 1997)and millimeter interferometry(Baker&Scoville,1998;Downes&Solomon,1998)to pc-scale disks inferred from HI and free-free absorption studies(Mundell et al.,1995;Carilli et al.,1998;Peck&Taylor,1998;Wilson et al.,1998;Taylor et al.,1999;Ulvestad,Wrobel &Carilli,1999),down to the0.25-pc warped,edge-on,Keplerian maser disk in NGC4258, imaged by the VLBA(Miyoshi et al.,1995,Greenhill et al.,1995;Herrnstein,et al.,1996).Theoretical work indicates that UV/X-ray radiation from the central engine can heat, ionize and evaporate the gas on the inner edge of the torus(Pier&Voit,1995;Balsara& Krolik,1993;Krolik&Lepp,1989).Indeed,simple Str¨o mgren sphere arguments suggest a radius for the ionized region of R(pc)=1.5(N⋆/1054s−1)1/3(n e/105cm−3)−2/3,where N⋆is the number of nuclear ionizing photons per second and n e is the electron density. Recalling the typical density n e∼105−6cm−3of the ionized disk in NGC1068(see below), we expect R∼0.3−1.5pc which is comparable to the tenths of pc to∼pc-scale resolutions achievable with the VLBA for nearby Seyferts.Recent high angular resolution VLBA radio observations of the archetypal Seyfert2galaxy,NGC1068,by Gallimore et al.(1997),have shown that emission from one of the radio components(‘S1’)may be associated with the inner,ionized edge of the torus.This radio component has aflat or rising(towards higher frequencies)spectrum,suggesting it contains the AGN,and a brightness temperature of up to4×106K;it is elongated perpendicular to the inner radio ejecta and extends over∼40 mas(3pc).The radiation mechanism may be free-free thermal emission(Gallimore et al., 1997),direct synchrotron emission(Roy et al.,1998)or Thomson scattering of a nuclear flat-spectrum synchrotron self-absorbed radio core(itself not detected)by the electrons at the inner edges of the torus(Gallimore et al.,1997;Roy et al.,1998).This discovery highlights the possibility of using the VLBA to image the pc-scale disks or tori in other Seyfert galaxies.However,flat-spectrum radio sources in AGNs often represent non-thermal synchrotron self-absorbed radio emission with a much higher brightness temperature(>108K)than is characteristic of component S1in NGC1068. High resolution radio observations are thus required to distinguish between the two emission processes.In the present paper,we report parsec-scale VLBA imaging offive Seyfert galaxies withflat-spectrum radio cores and hundred-pc scale,steep-spectrum,radio jets and lobes.Two of these galaxies also exhibit ionization cones with sharp,straight edges and axes aligned with the radio ejecta.Our goal is to determine whether theflat spectrumnuclear radio emission represents thermal emission from the accretion disk/obscuring torus or synchrotron self-absorbed emission from a compact radio core source.The paper is organized as follows;Sections2and3describe the sample selection, observations and reduction techniques whilst in Section4,the results of the study are presented.Section5discusses possible scenarios for the observed radio emission including direct non-thermal radiation from the AGN,emission from supernovae or supernova remnants produced in a starburst,or thermal emission from the accretion disk.The observed brightness temperatures are discussed in the context of the NGC1068result and comparison is made with other types of active nuclei such as radio galaxies,radio-loud and radio-quiet quasars.Section6summarizes the conclusions.Throughout,we assume H0=75km s−1Mpc−1and q0=0.5.2.Sample SelectionThe radio emission of Seyfert galaxies imaged at resolutions0.′′1–1′′almost always has the steep spectrum characteristic of optically thin synchrotron radiation.Flat spectrum cores are rare.In order to identify galaxies that may contain radio components similarto‘S1’in NGC1068,we have reviewed both published(e.g.,Ulvestad&Wilson,1989, and earlier papers in this series atλ6cm andλ20cm;Kukula et al.,1995at3.6cm)and unpublished(Wilson,Braatz&Dressel at3.6cm)VLA‘A’configuration surveys and other interferometric studies(e.g.,Roy et al.,1994).In selecting candidate galaxies for VLBA observations,we used the following criteria:•The radio component that is coincident with the optical nucleus(the position of which is known to≈0.′′2accuracy–e.g.,Clements,1981,1983),has aflat spectrum(α≤0.4, S∝ν−α)between20cm and6cm or3.6cm with the VLA in‘A’configuration.This component must also be unresolved in the VLA‘A’configuration at2cm and/or3.6cm.•Theflux density of this component exceeds5mJy at3.6cm(for comparison,the total flux density of component‘S1’in NGC1068at this wavelength is14mJy).•There is,in addition,extended,‘linear’(double,triple or jet-like),steep spectrum radio emission on the hundreds of parsecs–kiloparsec scales,or well-defined,optical ionization cones.The reason for this last criterion is to define the axis of ejection of the radio components and thus the expected axis of the accretion disk.We found only six(excluding NGC1068)Seyfert galaxies that satisfy these three criteria in the entire sample of about130imaged in the‘A’configuration.We omit one ofthem because of its unfavorable declination(–44◦),leavingfive for imaging with the VLBA. These galaxies are T0109−383,NGC2110,NGC4388,NGC5252and Mrk926.3.Observations and Reduction3.1.VLBA ObservationsThe observations were obtained with the10-element VLBA(Napier et al,1994)at8.4 GHz during observing runs in1997and1998,details of which are given in Table1.Dual circular polarizations(Right&Left)were recorded for all sources,and only the parallel hands(i.e.RR and LL)were correlated.T0109−383,NGC2110and Mrk926were recorded with a32-MHz bandwidth and two-bit sampling(8MHz per IF,4IFs,2polarizations)and NGC4388and NGC5252were recorded with a16-MHz bandwidth and two-bit sampling.The target sources are too weak to obtain estimates of the phase errors using standard VLBI self-calibration/imaging techniques(e.g.Walker,1995);instead the targets were observed in phase referencing mode,in which frequent observations of a nearby bright calibrator are interleaved with target scans and used for fringefitting,which corrects the large phase errors,delays(phase variations as a function of frequency)and delay rates (phase variations as a function of time)present in the data(Beasley&Conway,1995). As described below,extending the coherence time in this way improves the signal-to-noise ratio and enables an image of the target source to be made,which can then be usedas a starting model for subsequent cycles of self-calibration.Target source plus phase calibrator cycle times are shown in Table1.This method is similar to that used on smaller, connected-element arrays,such as the VLA(known as‘phase calibration’),but is more problematic for VLBI due to larger and more rapidly varying phase errors.Rapid changes in the troposphere at8.4GHz therefore require short switching times to satisfy the condition that the change in atmospheric phase be less than a radian over the switching interval,thus enabling reliable phase connection,without2π-radian ambiguities,for successful imaging of the target source(Beasley&Conway,1995).In addition,less frequent observations were made of a bright calibrator(‘phase check’)source.Data editing and calibration followed standard methods(Greisen&Murphy,1998) and used the NRAO Astronomical Image Processing System(aips)(van Moorsel,Kemball &Greisen,1996).Amplitude scales were determined from standard VLBA antenna gain tables,maintained by NRAO staff,and measurements of T sys made throughout the run. In addition,all data for source elevations below∼5◦were removed,and the antennas at Hancock(HN),and North Liberty(NL)were deleted from the NGC5252dataset as nofringes were detected to HN,and NL showed poor phase stability due to bad weather.The final phase corrections,interpolated over time,were used as a guide for additional data editing.Despite short switching times between galaxy and phase calibrator,poor tropospheric conditions and uncertainty in the target source position prevented immediate imaging of the phase-referenced target sources using all the data.Observations of the‘phase check’source were therefore used to verify the quality of the phase referencing,before applying the phase corrections to the target sources,and to provide ancillary calibration such as manual pulse calibration and amplitude calibration checks.After imaging the phase calibrator to verify that the corrections derived from fringe fitting were valid,phase,delay and rate corrections were applied to the‘check source’,from phase calibrator scans that were adjacent in time to the check source.Many baselines displayed poor phase coherence at some point in the observing run,preventing a coherent image of the source from being produced initially from the whole dataset.Instead,small time ranges(e.g.around1hour),within which the majority of antennas had less rapidly varying phases,were selected to be used in the initial stages of the imaging process.The ‘check’source,with calibration applied from the phase calibrator,was imaged for the selected small time range.The resultant image was then used as an input/starting model for subsequent cycles of self-calibration.This self-calibration process then enabled the remaining data to be fully calibrated and used to make afinal image of the‘check’source. Thefinal structure,flux and position of each‘check’source compared well with previously published images(e.g.Browne et al.,1998;Fey&Charlot,1997)and images produced from our data using self-calibration alone.This method provides an independent consistency check on the phase referencing,increasing our confidence in the images of the target sources. Only one‘check’source(J0044-3530)was not successfully imaged due to insufficient data (i.e.only3minutes at very low elevation).The target sources were then imaged using the same method,with natural and uniform data weighting.The uniformly weighted images (with robust parameter0-Briggs,1995)are shown in Figure1.The naturally weighted images,with more sensitivity to extended emission,were used to derive the brightness temperature limits to possible thermal emission from the program galaxies;these limits are ∼30%lower than those derived from the uniformly weighted images shown in this paper.The uncertainty in theflux scale is taken to be∼5%and is included in the total uncertainties influx densities quoted in Table2.These errors were derived by adding,in quadrature,the5%amplitude scale error,the r.m.s.noise in thefinal image and the error in the Gaussianfitting.The accuracy of the target source positions is dominated by the uncertainty in theposition of the phase calibrators(∼0.4–14mas;see Table1).Additional positional errors, due to the transfer of phase corrections from the phase calibrator to the target source,are negligible due to the promixity of each calibrator to its target source.3.2.MERLIN observationsNGC4388was not detected by the present VLBA observations.We therefore obtained and analyzed MERLINλ6-cm(4.993-GHz)archival data for NGC4388,which was observed on7th December,1992with six antennas.Phase referencing was performed with regular observations of1215+113,interleaved throughout the observing run and3C286was used for flux and bandpass calibration.Aflux of7.087Jy for3C286was adopted,assuming a total flux density of7.382Jy(Baars et al.,1977)and correcting for MERLIN resolution effects. After initial gain-elevation corrections and amplitude calibration using MERLIN software, the data were transferred to aips for all subsequent phase and amplitude calibration,data editing and imaging.Dual polarizations were recorded for a15-MHz bandwidth,centered at4.993GHz,but the right circular polarization data were removed due to instrumental problems,resulting in afinal image of the left circular polarization only(Figure2).4.ResultsFiveflat-spectrum-core Seyferts,were observed with the VLBA at8.4GHz.Four of thefive sources were detected(T0109−383,NGC2110,NGC5252,Mrk926)and show compact,unresolved cores with brightness temperatures T B>108K,total luminosities at 8.4GHz of∼1021W Hz−1and sizes,on average,less than1pc.In addition to the core emission,NGC2110shows extended emission which may represent the inner parts of the radio jets,and NGC5252may be marginally extended(Figure1).NGC4388is not detected with the VLBA,but is detected at5GHz with MERLIN(Figure2).Wefind no evidence for emission(to a3-σlimit of T B∼106K)extended perpendicular to the hundred-pc scale radio emission in T0109−383,NGC2110,NGC5252or Mrk926,as would be expected for emission from an accretion disk,but we discuss the possibility of thermal emission from NGC4388(Section5.4).The measured and derived properties of each source are listed in Table2,while more detailed properties of NGC2110and NGC4388are given in Tables3 and4respectively.The properties of each source are discussed more fully below.Distances are calculated assuming H0=75km s−1Mpc−1and q0=0.5,except for NGC4388which is assumed to be at the distance of the Virgo cluster,taken to be16Mpc.4.1.T0109−383T0109−383(NGC424)is a highly inclined(∼75◦)early-type((R)SB(r)0/a–de Vaucouleurs et al.1991)Seyfert galaxy at a distance of46.6Mpc.The nucleus ofT0109−383,originally classified as a Seyfert type2(Smith,1975),exhibits strong line emission from highly ionized species such as[Fe vii]λ5720,6086and[Fe x]λ6374(Fosbury &Sansom,1983;Penston et al.,1984).Analysis of the continuum emission from thefar IR to the far UV and decomposition of the Hα–[N ii]blend led Boisson&Durret (1986)to suggest a re-classification of T0109−383to a Seyfert1.The recent discoveryof broad components to the Hαand Hβlines,along with emission from Fe ii,confirms the type1classification(Murayama et al.,1998).VLA images of the radio emissionat6and20cm,show the nuclear radio source to consist of an unresolved core with aflat spectrum(α206=0.17±0.07)betweenλ6andλ20cm,and a weaker,secondary,steep spectrum component≃1.′′4east of the core(Ulvestad&Wilson,1989).Similar radio structure is seen in the8.4-GHz VLA image(Braatz,Wilson&Dressel,unpublished), shown in Figure1,with the core spectrum remaining relativelyflat(α63.5=0.21)between6 and3.5cm(Morganti et al.,1999).The results of Gaussianfitting to the8.4-GHz VLBA image(Figure1),given in Table2,show the sub-pc scale nuclear emission to be unresolved, with a peak brightness of T B>8.1×10⁸K,adopting a source size smaller than half of the beamsize.The peak and integrated8.4-GHz VLAfluxes for the core,10.4mJy beam−1 and11.2mJy respectively,are in excellent agreement with those measured from the VLBA image(Table2),indicating that little nuclear emission was missed by the VLBA.A similar peak brightness of10.4mJy beam−1is found in the3.5-cm ATCA image of Morganti et al. (1999),while their slightly higher integratedflux includes some of the emission≃1′′E and W of the nucleus(Ulvestad&Wilson,1989;Figure1).The excellent agreement between the nuclearλ3.6-cmfluxes in observations spanning∼six years indicates no significant variability.In the VLBA image,we detected no extended emission in the N-S direction(as might be expected from a parsec-scale,thermal disk if the arcsec-scale,steep spectrum,E-W emission in the VLA image is interpreted as emission from nuclear ejecta)brighter than ∼1.3×10⁶K(3σin the naturally weighted image)and more extended than0.27pc(half of the beamsize in the naturally weighted image).4.2.NGC2110NGC2110was initially classified as a Narrow Line X-ray Galaxy,NLXG,(Bradt et al., 1978),and lies in an S0/E host galaxy(Wilson,Baldwin&Ulvestad,1985)at a distanceof30.4Mpc.Such NLXG’s have a sufficient column of dust to the nucleus to obscure the broad line region,thus leading to a Seyfert2classification of the optical spectrum,but an insufficient gas column to attenuate the2–10keV emission,so the hard X-ray luminosity is comparable to those of Seyfert1’s(Weaver et al.,1995a;Malaguti et al.,1999).Early radio observations found NGC2110to be a strong radio source(Bradt et al.,1978)and subsequent VLA imaging(Ulvestad&Wilson,1983;1984b)showed symmetrical,jet-like radio emission,extending∼4′′in the N-S direction and straddling a central compact core.A more recent VLA A-configuration image atλ3.6cm,obtained by Nagar et al.(1999)and shown in Figure1,contains a wealth of complex structure.Ulvestad&Wilson(1983)found the spectrum of the core to be relativelyflat(spectral indexα206∼0.36±0.05)betweenλ20 cm andλ6cm,but becoming steeper(α62∼0.96±0.09)betweenλ6cm andλ2cm(assuming no time variability).Using theλ3.6-cm coreflux measurement of Nagar et al.(1999)and ignoring variability or resolution effects gives spectral indices ofα63.6=0.61andα3.62=1.31, also suggesting a steepening of the spectrum at higher frequencies.The radio continuum emission of NGC2110,imaged with the VLBA atλ3.6cm and shown in Figure1,consists of a compact core,presumably the nucleus,and slightly extended emission which is most pronounced to the north.The results offitting a single-component Gaussian are given in Table2;the fact that the integratedflux is significantly higher than the peakflux also suggests the source is resolved.Resolved structure is also evident in the time-averaged(u,v)data(not shown),consistent with an unresolved point source(with a flux density of∼8mJy)superimposed on an extended“halo”with approximate dimensions of2.5(N-S)×0.5(E-W)mas.Preliminary two-component Gaussianfits to the image are also consistent with an unresolved point source and an extended component.We therefore subtracted an8-mJy point source(in the(u,v)plane using the aips task uvsub)positioned at the peak of the3.6cm VLBA image,and studied the residual emission.This emission is extended both north and south of the core by∼0.7mas,consistent with emission from the inner regions of the northern and southern jets.Using the brightness of8mJy beam−1for the unresolved component and assuming an upper limit to the source size of0.94×0.36mas(half of the beamsize),wefind T B> 6.0×10⁸K.In addition to the core and extended emission,the Gaussianfits suggest the presence of a third component,centered∼1.95mas north of the core;its size and direction of elongation are not well constrained.This component may be a knot in the northern jet.A summary of thefitted properties of each component is given in Table3.The total VLBA-detectedflux density of the source(zero baselineflux measured in the uv plane)is30mJy.Thisflux density is lower than the previously measured VLA core flux of77.6mJy at this frequency(Nagar et al.,1999),presumably due to the high spatialresolution of the present observations and missing short spacings of the VLBA compared to the VLA,thereby reducing our sensitivity to extended structure.This may also explain why we detect no VLBA counterpart to the small eastern extension present in theλ3.6-cm VLA image,which contains about3.6mJy offlux and extends approximately0.′′5east of the core(Nagar et al.,1999).Alternatively,the extension in the VLA image may be a result of instrumental effects caused by the source position being close to the celestial equator and the short duration of the snapshot observation,an effect termed‘equator disease’(Antonucci&Ulvestad,1985).In the VLBA image,we detect no extended emission in the E-W direction(such as might be expected from a parsec-scale thermal disk)brighter than 3.1×10⁶K(3σin the naturally weighted image),and more extended than0.07pc(one half of the E-W beamsize in the naturally weighted image).4.3.NGC4388NGC4388is a nearby,edge-on spiral galaxy(SB(s)b pec-Phillips&Malin,1982) which is thought to lie close to the centre of the Virgo cluster(Phillips&Malin,1982)and may be tidally disturbed by nearby cluster core galaxies M84or IC3303(Corbin,Baldwin &Wilson,1988).Ionization cones extend approximately perpendicular to the disk(Pogge, 1988;Corbin et al.,1988;Falcke,Wilson&Simpson,1998)and the kinematics of the ionized gas in the narrow line region(NLR)shows a complex combination of rotation and outflow(Corbin et al.1988;Veilleux,1991;Veilleux et al.,1999).The nucleus is variously classified as Seyfert type1or2,with the high galactic inclination and obscuring dust lanes making unambiguous classification difficult(Falcke et al.,1998).Shields&Filippenko (1988)report broad,off-nuclear Hαemission,but subsequent IR searches for broad lines such as Paβ(Blanco,Ward&Wright,1990;Ruiz,Rieke&Schmidt,1994)and Brαand Brγ(Veilleux,Goodrich&Hill,1997)have failed to detect a broad nuclear component.Previous radio continuum images of NGC4388(Stone et al.,1988;Carral,Turner& Ho,1990;Hummel&Saikia,1991;Falcke et al.,1998)show complex,extended structure, both along the galactic plane and perpendicular to it.A recent3.5cm VLA image of the extended radio emission(Falcke et al.,1998)shows,in more detail,the‘hour-glass’-shaped radio outflow to the north of the galactic plane,and the compact(∼1.′′9separation)central double,which were suggested by earlier images.In Section4.3.1we concentrate on the radio emission from the northern component of the compact radio double,which shows a flat spectrum up to2cm(Carral,Turner&Ho,1990)and is thought to be the nucleus,and in Section4.3.2,we discuss the extended emission to the SW.4.3.1.The nucleusAs stated earlier,NGC4388is not detected in the8.4-GHz VLBA observations, with a3-σbrightness temperature limit of T B∼<2.2×10⁶K(σ=63.2µJy/beam with a beam size of2.52×1.46mas in the naturally weighted map,with a factor1.7applied to correct for decorrelation due to residual imperfections in the phase referencing corrections, estimated using the check source).We do,however,detect emission from NGC4388at λ6cm with MERLIN.The uniformly weighted MERLIN image(Figure2)shows emission from two components,labelled M1and M2,the stronger of which we identify with the nucleus and discuss in more detail here,while M2is discussed in Section4.3.2.The nuclear component M1,has a peak brightness of1.2mJy beam−1which corresponds to a brightness temperature T B>2.4×10⁴K at5GHz(beamsize91×39.5mas,see Table4).The nucleus is unresolved in the MERLIN data,indicating that the source size is intermediate between the MERLIN and VLBA beam sizes.However,a combination of the MERLIN and VLBA results with published spectral index information can further constrain the source size.Earlier radio observations of NGC4388have found the nuclear spectrum to beflat from1.49GHz to15GHz.The spectral index was measured to beα=0.26between1.49 GHz and4.86GHz with a relatively large beamsize of1.′′2(Hummel&Saikia,1991)and Carral et al.(1990)report aflat spectrum up to15GHz with an upper limit to the nuclear size of70mas.Including the VLA8.4GHz coreflux of Kukula et al(1995)suggests that the spectrum of the nucleus may be very slightly inverted between8.4GHz and15GHz (α=–0.05)but within the errors it can be taken asflat.We therefore used the measured MERLIN5-GHz peakflux to derive predicted VLBA8.4GHzfluxes of the nucleus,for spectral indices of bothα=0.0and0.26,and converted these predictedfluxes to brightness temperatures,assuming the source is unresolved by the representative VLBA beamsize of 2.52×1.46mas.These predicted temperatures are listed in Table4and are above the detection threshold of the VLBA observations for a source size equal to or smaller than the VLBA beam.The larger predicted brightness temperature,for a source size equal to the VLBA beam,of T B≃8.3×10⁶K is,however,only3.8times greater than our3-σ,VLBA detection limit and so the solid angle of the source need only be3.8times larger than the VLBA beamsize to be undetected.We therefore constrain the size of the nucleus to be∼> 3.7mas(α=0.0)or∼>0.3pc.Sensitive,high angular resolution VLBA observations at lower frequencies such as2.3GHz and1.4GHz are required to determine the actual size and structure of the nucleus in NGC4388.。
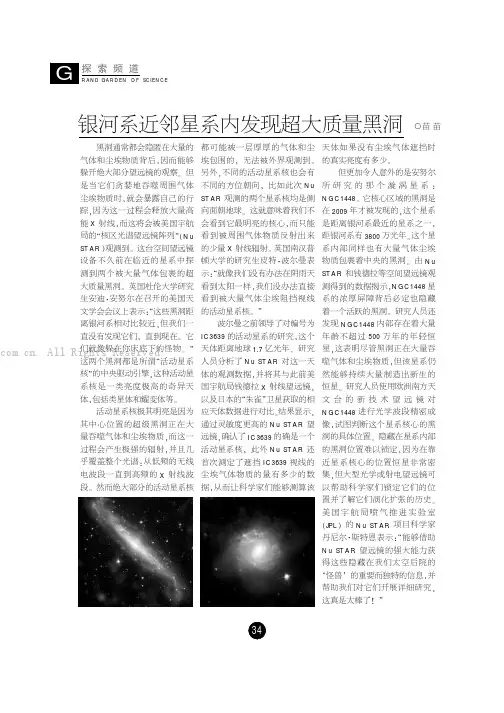
探索频道RAND GARDEN OF SCIENCE黑洞通常都会隐匿在大量的气体和尘埃物质背后,因而能够躲开绝大部分望远镜的观察。
但是当它们贪婪地吞噬周围气体尘埃物质时,就会暴露自己的行踪,因为这一过程会释放大量高能X射线,而这将会被美国宇航局的“核区光谱望远镜阵列”(Nu STAR)观测到。
这台空间望远镜设备不久前在临近的星系中探测到两个被大量气体包裹的超大质量黑洞。
英国杜伦大学研究生安迪·安努尔在召开的美国天文学会会议上表示:“这些黑洞距离银河系相对比较近,但我们一直没有发现它们,直到现在。
它们就像躲在你床底下的怪物。
”这两个黑洞都是所谓“活动星系核”的中央驱动引擎,这种活动星系核是一类亮度极高的奇异天体,包括类星体和耀变体等。
活动星系核极其明亮是因为其中心位置的超级黑洞正在大量吞噬气体和尘埃物质,而这一过程会产生极强的辐射,并且几乎覆盖整个光谱:从低频的无线电波段一直到高频的X射线波段。
然而绝大部分的活动星系核都可能被一层厚厚的气体和尘埃包围的,无法被外界观测到。
另外,不同的活动星系核也会有不同的方位朝向,比如此次NuSTAR观测的两个星系核均是侧向面朝地球。
这就意味着我们不会看到它最明亮的核心,而只能看到被周围气体物质反射出来的少量X射线辐射。
英国南汉普顿大学的研究生皮特·波尔曼表示:“就像我们没有办法在阴雨天看到太阳一样,我们没办法直接看到被大量气体尘埃阻挡视线的活动星系核。
”波尔曼之前领导了对编号为IC3639的活动星系的研究,这个天体距离地球1.7亿光年。
研究人员分析了Nu STAR对这一天体的观测数据,并将其与此前美国宇航局钱德拉X射线望远镜,以及日本的“朱雀”卫星获取的相应天体数据进行对比。
结果显示,通过灵敏度更高的Nu STAR望远镜,确认了IC3639的确是一个活动星系核,此外Nu STAR还首次测定了遮挡IC3639视线的尘埃气体物质的量有多少的数据,从而让科学家们能够测算该天体如果没有尘埃气体遮挡时的真实亮度有多少。
a rXiv:as tr o-ph/21160v11Jan22Gamma-Ray Summary Report J.Buckley ∗Washington University,St.Louis T.Burnett †University of Washington G.Sinnis ‡Los Alamos National Laboratory P.Coppi §Yale University P.Gondolo ¶Case Western Reserve University J.Kapusta ∗∗University of Minnesota J.McEnery ††University of Wisconsin J.Norris ‡‡NASA/Goddard Space Flight Center P.Ullio §§SISSA D.A.Williams University of California Santa Cruz ¶¶(Dated:February 1,2008)This paper reviews the field of gamma-ray astronomy and describes future experiments and prospects for advances in fundamental physics and high-energy astrophysics through gamma-ray measurements.We concentrate on recent progress in the understanding of active galaxies,and the use of these sources as probes of intergalactic space.We also describe prospects for future experi-ments in a number of areas of fundamental physics,including:searches for an annihilation line from neutralino dark matter,understanding the energetics of supermassive black holes,using AGNs as cosmological probes of the primordial radiation fields,constraints on quantum gravity,detection of a new spectral component from GRBs,and the prospects for detecting primordial black holes.I.INTRODUCTIONWith new experiments such as GLAST and VERITAS on the horizon,we are entering an exciting period for gamma-ray astronomy.The gamma-ray waveband has provided a new spectral window on theuniverseand has already resulted in dramatic progress in our understanding of high energy astrophysical phenomena. At these energies the universe looks quite different then when viewed with more traditional astronomical tech-niques.The sources of high energy gamma rays are limited to the most extreme places in the universe:the remnants of exploding stars,the nonthermal Nebulae surrounding pulsars,the ultra-relativistic jets emerging from supermassive black holes at the center of active galaxies,and the still mysterious gamma-ray bursters. While understanding these objects is of intrinsic interest(how does nature accelerate particles to such high energies?how do particles andfields behave in the presence of strong gravitationalfields?),these objects can also be used as probes of the radiationfields in the universe and possibly of spacetime itself.In this case,the astrophysics of the object is a confounding factor that must be understood to produce a quantitative measurement or a robust upper limit.While some may view this as a limitation of such indirect astrophysical measurements,in most cases there are no earth-bound experiments that can probe the fundamental laws of physics at the energy scales available to gamma-ray instruments.Gamma-ray astronomy has developed along two separate paths.From the ground,simple,inexpensive exper-iments were built in the1950’s to observe the Cherenkov light generated by extensive air showers generated by photons with energies above several TeV.Despite decades of effort it was not until the late1980’s that a source of TeV photons was observed.There are now roughly10known sources of TeV gamma rays,three galactic sources and at least three active galaxies.From space,the COS-B satellite,launched in1975,observed thefirst sources of cosmic gamma rays at energies above70MeV.The launch of the Compton Gamma Ray Observatory (CGRO)in1991,with the Energetic Gamma Ray Experiment Telescope(EGRET)instrument,brought thefield to maturity.Whereas COS-B discovered a handful of sources,EGRET observed over65active galaxies[1],seven pulsars,many gamma-ray bursts,and over60sources that have no known counterparts at other wavelengths. The disparity in the development of the two techniques can be traced to the extremely lowfluxes of particles present above a TeV(∼4γfootballfield−1hr−1)and the cosmic-ray background.Above the earth’s atmosphere, one can surround a gamma-ray detector with a veto counter that registers the passage of charged particles. From the ground,one is forced to infer the nature of the primary particle by observing the secondary radiation generated as the extensive air shower develops.It was not until such a technique was developed for air Cherenkov telescopes[2],that sources of TeV photons were discovered.Despite these difficulties a new generation of ground-based instruments is under development that will have a sensitivity that will rival that of space-based instruments.At the same time a space-based instrument,GLAST,with a relatively large area(∼1m2)and excellent energy and angular resolution is scheduled to be launched in2005.In this paper we will give a brief survey of the gamma-ray universe and demonstrate some of the fundamental measurements(relevant to particle physicists)that can be made using distant objects that emit high-energy photons.What will hopefully become clear from this exposition are some development paths for future instru-ments.The need to see to the far reaches of the universe,makes a compelling case for ground-based instruments with energy thresholds as low as10GeV.The need to detect and study the many transient phenomena in the universe makes a compelling case for the development of an instrument that can continually monitor the entire overhead sky at energies above∼100GeV with sensitivities approaching that of the next generation of pointed instruments.As with any new branch of astronomy,it is impossible to predict what knowledge will ultimately be gained from studying the universe in a different waveband,but early results hint at a rich future.New and planned instruments with greatly increased sensitivity will allow us to look farther into the universe and deeper into the astrophysical objects that emit gamma rays.Gamma-ray astronomy can be used to study the most extreme environments that exist in the universe,and may also provide a number of unique laboratories for exploring the fundamental laws of physics at energies beyond the reach of earth-bound particle accelerators.II.PHYSICS GOALS OF GAMMA RAY ASTRONOMYA.Active Galactic NucleiActive galactic nuclei(AGN)are believed to be supermassive black holes,108−1010M⊙,accreting matter from the nucleus of a host galaxy.The accretion of matter onto a black hole is a very efficient process,capable of releasing∼10%of the rest energy the infalling matter(∼40%for a maximally rotating black hole).(For comparison fusion burning in stars releases∼0.7%of the rest energy.)Radio loud AGN emit jets of relativistic particles,presumably along the rotation axis of the spinning black hole.The COS-B instrument observed the first AGN in the gamma-ray regime(E>100MeV),3C273.But it was not until the launch of the CGRO and EGRET that many AGN could be studied in the gamma-ray regime.More recently,ground-based instruments have extended these observations into the TeV energy band.The energy output of these objects in gamma rays is of order1045ergs s−1,and many of these objects emit most of their energy into gamma rays.The relativisticmotion has several effects:1)the energy of the photons is blue-shifted for an observer at rest(us),2)the timescale is Lorentz contracted(further increasing the apparent luminosity),and3)the relativistic beaming suppresses photon interactions.Thus,one expects that AGN observed in the TeV regime should have their jets nearly aligned with our line-of-sight.The types of AGN detected at high energies,which includeflat spectrum radio quasars(FSRQs)and BL Lacertae(BL Lac)objects,are collectively referred to as blazars.The Whipple Observatory10m atmospheric Cherenkov telescope demonstrated that the emission spectra of several blazars extend into TeV energies.Two of these detections(Markarian421and Markarian501)have been confirmed by independent experiments(CAT and HEGRA),at significance levels of between20σin a half hour to80σfor a season.Blazar emission is dominated by highly variable,non-thermal continuum emission from an unresolved nucleus. The broadband emission and high degree of polarization suggest synchrotron radiation extending from radio up to UV or even hard X-ray energies.The short variability timescales and high luminosities are thought to result from highly relativistic outflows along jets pointed very nearly along our line of sight.The spectral energy distributions(SEDs)of these objects have a double-peaked shape(see Figure1)with a synchrotron component that peaks in the UV or X-ray band,and a second component typically rising in the X-ray range and peaking at energies between∼1MeV and1TeV[3].The most natural explanation of the second peak is inverse-Compton scattering of ambient or synchrotron photons[4]although other possibilities such as proton-induced cascades have not been ruled out[5].These two models have somewhat complementary strengths and weaknesses.Since electrons are lighter than protons,they can be confined in a smaller acceleration region but lose energy more quickly(by synchrotron and IC emission),making it difficult to accelerate electrons to extreme energies.For hadronic models,very high energies can be attained given sufficient time,a large acceleration region and high magneticfields.However,the short variability timescales,implying short acceleration times and compact regions are difficult to explain.In addition,the electron models make natural predictions on the correlation between X-ray and gamma ray luminosities.While it has been claimed that proton models can be constructed that explain these correlations,detailed calculations have not appeared in the literature.Whipple observations of the vast majority of EGRET blazars have yielded only upper limits[6,7,8];Mrk421 (z=0.031)[9]being the exception.Subsequent searches for emission from X-ray bright BL Lac objects has led to the detection of Mrk501(z=0.034)[10],and four other as yet unconfirmed sources[1ES2344+514 (z=0.044[11],1ES2155-304(z=0.117)[12],1ES1959+650(z=0.048)[13]and1H1426+428(z=0.13)[14]]. The SEDs observed for these sources show higher energy synchrotron andγ-ray peaks,and comparable power output at the synchrotron andγ-ray peak.These observations are well described by the classification scheme of Padovani and Giommi[15].The AGN detected by EGRET are all radio-loud,flat-spectrum radio sources and lie at redshifts between0.03and2.28. They are characterized by two component spectra with peak power in the infrared to optical waveband and in the10MeV to GeV range.For many of the GeV blazars,the total power output of these sources peaks in the gamma-ray waveband.The objects detected at VHE,appear to form a new class distinct from the EGRET sources.All are classified as high-energy peaked[15]BL Lacs(HBLs)defined as sources with their synchrotron emission peaked in the UV/X-ray band and gamma-ray emission peaking in the∼100GeV regime(see,e.g.,Fig.1).The correspondence of the position of the peak of the synchrotron andγ-ray energy is naturally explained in models where the same population of electrons produces both spectral components.Proton induced cascade models[5]might also reproduce the spectra,but have no natural correlation in the cutoffenergy of the two components,or the observed correlated variability.Another difference in the VHE detections is that only the nearest sources with redshifts z<∼0.1have been detected.The sensitivity of EGRET for a one-year exposure is comparable to that of Whipple for a50hour exposure for a source with spectral index of2.2.The failure of ACTs to detect any but the nearest AGNs therefore requires a cut-offin theγ-ray spectra of the EGRET sources between10GeV and a few hundred GeV. This cutoffcould be intrinsic to the electron acceleration mechanism,due to absorption offof ambient photons from the accreting nuclear region[16],or caused by absorption via pair production with the diffuse extragalactic background radiation[17,18].While the latter mechanism establishes an energy-dependent gamma-ray horizon it can also be used to measure the radiationfields thatfill intergalactic space.In the framework of Fossati et al.,[19]the low energy peaked EGRET BL Lacs(LBLs)correspond to AGNs with a more luminous nuclear emission component than HBLs.The relatively high ambient photon density in the LBLs is up-scattered by relativistic electrons toγ-ray energies.With high enough ambient photon densities, the resulting inverse-Compton emission can exceed that resulting from the up-scattering of synchrotron photons. This accounts for the observation of relatively high levels of gamma-ray emission,dominating the power output over the entire spectrum.The higher luminosity could also shut down the acceleration process at lower energies.For lack of another viable hypothesis,consider the common hypothesis that the energetic particles in AGNs come from electronsor protons accelerated by relativistic shocks traveling down the AGN jets.In the model of diffusive shock acceleration(essentially thefirst order Fermi process),particles are accelerated as they are scattered from magnetic irregularities on either side of a shock.For strong,non-relativistic shocks,a constant escape probability with each shock crossing results in an∼E−2spectrum,close to that observed.More realistic models including nonlinear effects lead to slightly steeper spectra;if the shock velocity is relativistic the spectral index may range from1.7to2.4.In any event,an electron spectrum∼E−γwill give rise to synchrotron radiation with a spectral indexα=(γ−1)/2,in good agreement with observations.The maximum energy attainable is given by equating the rate of energy loss from synchrotron emission or inverse-Compton emission to the acceleration rate as given by the shock parameters.In the low-energy peaked objects,it is thought that high ambient photon densities result in inverse-Compton losses that dominate over synchrotron losses and limit the maximum electron energy achieved by shock acceleration.Thus one also obtains a natural explanation for the lower energies of the peak synchrotron and IC power in these objects.In HBLs, the ambient photonfields are presumably weaker and self-Compton emission dominates over Comptonization of external photons(EC).Electrons can reach higher energies by shock acceleration,and the peaks in the SED move to higher energies and have more nearly equal peak power.This model is consistent with the data and serves as a useful paradigm for searching for new VHE sources.The SEDs shown in Fig.1,combine the results of a number of different measurements of the X-ray and VHE spectra of Mrk501,and compare them with simple synchrotron self-Compton(SSC)models(see Buckley[20] and references therein).The agreement between the spectral measurements and the model is exceptionally good for Mrk501.1.Multiwavelength Observations:VariabilityData taken on Mrk421over the years1995[21]to2001[22]show that theγ-ray emission is characterized by a succession of approximately hour-longflares with relatively symmetric profiles(see Figure2).While most of the multiwavelength observations of Mrk421show evidence for correlated X-ray and gamma ray variability,the nature of the correlation is unclear and the data have traditionally undersampled the variability. However,a multi-wavelength campaign conducted on Mrk501in1997revealed a strong correlation between TeVγ-rays and soft X-rays(the50–500keV band detected by OSSE)(Fig.1).Recent multiwavelength observations of Mrk421made during the period March18,2001to April1,2001 with the Whipple gamma-ray telescope,and the Proportional Counter Array(PCA)detector on the Rossi X-ray Timing Explorer(RXTE)better sample the rapid variability of Mrk421.Key to the success of this campaign is the nearly continuous>330ks exposure with RXTE[23].Numerous ground-based atmospheric Cherenkov and optical observations were scheduled during this period to improve the temporal coverage in the optical and VHE bands.Frequent correlated hour-scale X-ray andγ-rayflares were observed.Fig.2shows a subset of these data showing the close correlation of the well-sampled TeV and X-ray(2–10keV)lightcurves on March 19,2001[22].Leptonic models provide a natural explanation of the correlated X-ray and gamma-rayflares,and can re-produce the shape of theflare spectrum.The simplest model for blazar emission is the one-zone synchrotron self-Compton(SSC)model where energetic electrons in a compact emission region up-scatter their own syn-chrotron radiation.As shown in Fig.1,such a model results in surprisingly goodfits to the Mrk501SED. In the SSC model,the intensity of the synchrotron radiation is proportional to the magnetic energy density and the number density of electrons I synch∝n e.Since these same electrons up-scatter this radiation,the IC emission scales as I IC∝n2e.Thus we expect I IC∝I2synch.Krawczynski et al.,[24]examined the correlation of TeVγ-ray and X-ray intensity for several strongflares of Mrk501in1997.The results,plotted in Figure3,show evidence for such a quadratic dependence.(However the possibility of a baseline level of the X-ray emission can not be excluded.)While the interpretation of these observations is not unambiguous,this analysis is an important example of what can be learned with continued multiwavelength studies of AGNs.How do these observations constrain the alternative hypothesis that proton induced cascades(PIC),not elec-trons,are responsible for the gamma-ray emission?In the hadronic models of Mannheim and collaborators,the gamma-ray emission typically comes from synchrotron emission from extremely energetic,secondary electrons produced in hadronic cascades.Since a viable hadronic target for pp→ppπappears to be lacking(except per-haps in the broad line clouds),the assumption is made that the cascade begins with ultrarelativistic particles interacting with ambient photons to produce pions.This implies proton energies in excess of10∼16eV.The neutral pions presumably give rise to gamma rays and electromagnetic cascades,while the charged pions could give a neutrino signal.These models have attracted much interest since,in the most optimistic cases,these models may produce an observable neutrino signal and may provide a mechanism for producing the ultra-high energy cosmic rays.If the sources are optically thick to the emerging protons(i.e.,they absorb some fractionThis figure is available as p42_fig1a.gif051000.51100200300120.80.91F l u x (γ/m i n )F l u x (c n t s /s )F l u x (c n t s /s )F l u x (c n t s /s )MJDF l u x (a r b i t r a r y u n i t s )FIG.1:Left:SED of Mrk 501from contemporaneous and archival observations.Right:Multi-wavelength observations of Mrk 501;(a)γ-ray,(b)hard X-ray,(c)soft X-ray,(d)U-band optical light curves during the period 1997April 2–20(April 2corresponds to MJD 50540).The dashed line in (d)indicates the optical flux in 1997March.(from [20]and references therein.)This figure is available as p42_fig2.gifFIG.2:Simultaneous X-ray/γ-ray flare observed on March 19,2001.The 2–10keV X-ray light curve was obtained with the PCA detector on RXTE [22,23];data points are binned in roughly 4minute intervals.of the cosmic rays,but not the neutrinos)then it may be possible to produce a relatively large neutrino signal without overproducing the local cosmic ray flux [25].While these models have a number of attractive features,there is some debate about whether they can provide a self-consistent description for the observations.To overcome the threshold condition for pion production,protons must have energies in excess of 1016to 1018eV where abundant infrared photons can provide the target.Since the cross section for photo-pion produc-tion is relatively low,very high ambient photon densities are required to initiate the cascades.In this case,pair creation (γγ→e +e −),which has a much higher cross-section,must be important.The proton cascade models may well have a significant problems explaining the emission from objects like Mkn 421/501for this reason.FIG.3:Plot of TeVγ-rayflux versus X-rayflux measured with the HEGRA experiment during an intenseflare of Mrk501(courtesy Henric Krawczynski).In the PIC models[5]the proton-photon interaction occur with radio-IR photons in the jet.While a detailed analysis has not been published,Aharonian and others have pointed out that the required photon densities also imply large pair production optical depths,and may mean that the PIC models are not self-consistent. Models where the primary protons produce synchrotron radiation(and subsequent pair-cascades)may avoid this problem,but require even larger magneticfields[26].One advantage of the photon-pair cascade is that it produces a rather characteristic spectrum that does not depend sensitively on the model parameters.The detailed shape of this spectrum does not match some observations.Typically the spectra are too soft and overproduce X-rays,giving a spectrum that does not reproduce the strongly double-peaked spectrum observed.For the typical magneticfield values,the synchrotron spectrum is often too soft and lacks the spectral breaks that are observed.For these hadronic models to account for the double-peaked spectrum,the radio to X-ray emission is most likely produced by primary shock-accelerated electrons,while the gamma-ray emission is produced by energetic secondary electrons from the cascade.There is no natural explanation for the correlated variability in the two spectral bands,or in the correlation in the X-ray and gamma-ray cutoffenergy.To reach these energies on a sufficiently short timescale,the gyroradius must be limited to a compact region in the jet,the inverse-Compton emission must be suppressed,and magneticfields of up to40Gauss are required. The spectral variability seen in the X-ray waveband is consistent with much longer synchrotron cooling times than predicted by the hadronic models,and is quite consistent with magneticfields of a10to100mGauss. This is the same value of the magneticfield derived by a completely independent method within the framework of the synchrotron inverse-Compton model.The criticisms leveled at the electron models are that the magneticfields are too small compared with the value required for magnetic collimation of the jets,and that the required electron energies are too large to be explained by shock acceleration.Moreover,electron injection into shocks is poorly understood since the electron gyroradius is small compared to the proton gyroradius and presumably to the width of the broadened shock front.However we know that electrons are accelerated to100TeV energies in supernovae shocks,regardless of the theoretical difficulties in accounting for this observation.As will be shown below,if one accepts relatively large Doppler factors,a self-consistent explanation for the VHE gamma-ray emission can be derived from leptonic models.In the framework of either the EC or SSC models theγ-ray and X-ray data can be used to constrain the Doppler factorδ(this is thought to be close to the bulk Lorentz factor of the jet for blazars)and magneticfield B in the emission regions of Mrk421and Mrk501.The maximumγ-ray(IC)energy E C,max provides a lower limit on the maximum electron energy(with Lorentz factorγe,max)given byδγe,max>E C,max/m e c2;combining this with the measured cut-offenergy of the synchrotron emission E syn,max one obtains an upper limit on thelog n ,Hz -13-12-11-10-9-8l o g n F n ,e r g s -1c m -2FIG.4:Model fit to Mrk 421SED with both an SSC and external Compton component[20]magnetic field B <∼2×10⁻²E syn ,max δE −2C ,max (where E C ,max is in TeV).A lower limit on the magnetic fieldfollows from the requirement that the electron cooling time,t e ,cool ≈2×10⁸δ−1γ−1e B −2s,must be less than theobserved flare decay timescale.These limits depend on the Doppler factor of the jet and in some cases cannot be satisfied unless δis significantly greater than unity [27,28].Typically,these arguments lead to predictions of ∼100mGauss fields and Doppler factors δ>10to 40for Mrk 421.Similar values for Mrk 501but typically with a reduced lower limit on the Doppler factor.Model fits (that ignore the fact that the multiwavelength data are not truly time-resolved)give similar values for the Doppler factor and magnetic field strength.For example,a simple one-zone model fit for Mrk 421,shown in Fig.4,only gives good fits for a Doppler factor approaching a value of δ≈100(as shown)[20].Doppler factors this large may present other problems.Radio observations of jets show radio components moving with velocities that imply bulk Lorentz factors Γ<∼10further out in the jet.If the jet is decelerated by the inverse-Compton scattering,most of the energy would be used up before such extended radio lobes could form in apparent contradiction to observations.Given the good progress to date,it appears that it will be possible to determine the dominant radiation processes in AGNs.After this first issue is resolved,further multiwavelength observations can address the more fundamental questions about the energetics of the central supermassive black hole,and the processes behind the formation of the relativistic jets.The very short variability timescales already observed with the Whipple instrument (15minute doubling times for Markarian 421)hint that the gamma-ray observations may be probing very close to the central engine,beyond the reach of the highest resolution optical and radio telescopes.B.Gamma-Ray BurstsGamma-ray bursts (GRBs)were discovered by the Vela satellites in the late 1960’s [29].GRBs are bright flashes of hard X-rays and low energy gamma rays coming from random directions in the sky at random times.Until the launch of the CGRO in 1992it was generally believed that GRBs were galactic phenomena associated with neutron stars.The BATSE instrument on-board the CGRO detected over 2000GRBs and the observed spatial distribution was isotropic,with no evidence of an excess from the galactic plane.Thus GRBs were either cosmological or populated an extended galactic halo.In 1997the BeppoSax satellite was launched.With a suite of hard X-ray detectors,this instrument has the ability to localize GRBs to within ∼1minute of arc [30](BATSE could localize GRBs to within ∼5degrees).The increased angular resolution allowed conventional ground-based telescopes to search the error box without significant source confusion.The observation of emission and absorption lines from the host galaxies led to measurements of redshifts;some thirty years after their discovery the cosmological nature of gamma-ray bursts was determined.In Figure II B we show the redshift distribution of those gamma-ray bursts where the redshift has been determined.The enormous energy output from GRBs,and transparency of the universe below 100MeV makes GRBs visible across the universe.Thus gamma-rayFIG.5:The magnitude redshift distribution of gamma-ray bursts.Also shown on the plot is the magnitude vs.redshift relation for the observed type Ia supernovae.bursts have the potential to probe the universe at very early times and to study the propagation of high-energy photons over cosmological distances.To use GRBs as cosmological probes it is necessary to understand their underlying mechanism.While GRBs may never be standard candles on par with the now famous Type-IA supernovae,there has been great progress made in the lastfive years in understanding GRBs.While we still do not know what the underlying energy source is,we are beginning to understand the environment that creates the observed high-energy photons. The large distances to GRBs implies that the energy released is∼1050−54ergs,depending on the amount of beaming at the source.While the origin of the initial explosion is unknown,the subsequent emission is well described by the relativisticfireball model.In this model shells of material expand relativistically into the interstellar medium.The complex gamma-ray light-curves of the prompt radiation arises from shocks formed as faster and slower shells of material interact.A termination shock is also formed as the expanding shells of material interact with the material surrounding the GRB progenitor.In this model the observed afterglows (x-ray,optical,and radio)arise from the synchrotron radiation of shock accelerated electrons.The afterglow emission can be used to determine the geometry of the source.Since the shell is expanding relativistically,the radiation(emitted isotropically in the bulk frame)is beamed into a cone with with opening angleΓ−1(the bulk Lorentz factor of the material in the shell).Thus at early times,only a small portion of the emitting surface is visible and one cannot distinguish between isotropic and beamed(jet-like)emission. However,as the shell expands it sweeps up material andΓdecreases.If the emission is not isotropic the beaming angle(Γ−1)will eventually become larger than the opening angle of the jet.At this point one should observe a break in the light curve(luminosity versus time)of the afterglow.This distinctive feature has been observed in15GRBs.By measuring the temporal breaks in GRBs of known redshift Frail et al.,[31]have measured the jet opening angles of15gamma-ray bursts(with some assumptions about the emission region:the jet is uniform across its face,the electron distribution in the shock is a power law,the afterglow radiation is due to synchrotron emission and inverse Compton scattering).If one integrates the observed luminosity over the inferred jet opening angle one can determine the intrinsic luminosity of each GRB.Surprisingly,Frail et al., conclude that the intrinsic luminosities of the observed gamma-ray bursts are peaked around5×1050ergs with a spread of roughly a factor of six.Thus the observed variation in luminosity(a factor of∼500)may be mainly due to the variation in the jet opening angle.Note that this conclusion applies only to the“long”GRBs,as these are the only GRBs for which optical counterparts have been observed.With a similar goal,to reduce the wide divergence in the observational properties of GRBs,Norris[32]has found a correlation between energy dependent time lags and the observed burst luminosity.Three things occur as one moves from high energy photons to low energy photons.The pulse profiles widen and become asymmetric, and the centroid of the pulse shifts to later times.The time lag is defined as the shift in the centroid of the pulse profile in the different energy channels of the BATSE instrument.In Figure II B we show the observed luminosity(assuming isotropic emission)versus the time lag observed between two energy channels on the BATSE experiment.(Channel1corresponds to photons with energies between25–50keV and channel3to 100300keV photons.)The line is the function,L53=1.1×(τlag/0.01s)−1.15,where L53is the luminosity in units of1053ergs.It may be that the time lag is dependent upon the jet opening angle for reasons that are not yet understood and this observed correlation is simply an way of paramterizing the relationship observed by Frail et al.As discussed above,gamma-ray observations of AGNs revealed a new spectral component due to inverse-Compton emission,distinct from the synchrotron emission observed in the radio to X-ray wavebands.This observation resulted in an independent constraint on the electron energy that allowed a determination of the magneticfields,electron densities,and bulk Lorentz factors in the sources.While AGNs are quite different for GRBs,the non-thermal radiation mechanisms may be quite similar,and we might expect similar progress to follow from high energy gamma-ray measurements.At higher energies less is known about GRBs.The EGRET instrument covered the energy range from100 MeV to a few tens of GeV.EGRET detected several GRBs at high energy(HE E>100MeV).From EGRET。
The Stellar Black HoleKenneth Dalton【期刊名称】《高能物理(英文)》【年(卷),期】2018(4)4【摘要】A black hole model is proposed in which a neutron star is surrounded by a neutral gas of electrons and positrons. The gas is in a completely degenerate quantum state and does not radiate. The pressure and density in the gas are found to be much less than those in the neutron star. The radius of the black hole is far greater than the Schwarzschild radius.【总页数】4页(P651-654)【关键词】Black;Hole;Model;Neutron;Stars;Degenerate;Lepton;Gas【作者】Kenneth Dalton【作者单位】89/2 M.1 Th. Pongprasart, Bang Saphan, Thailand【正文语种】中文【中图分类】P1【相关文献】1.Evidence of Pulsars Metamorphism and Their Connection to Stellar Black Holes [J], Ahmad A. Hujeirat2.How a Laser Physics Induced Kerr-Newman Black Hole Can ReleaseGravitational Waves without Igniting the Black Hole Bomb (Explosion of a Mini Black Hole in a Laboratory) [J], Andrew Walcott Beckwith3.On detecting stellar binary black holes via the LISA-Taiji network [J], 陈举;闫昌硕;陆由俊;赵悦同;葛均强4.Looking at Quantization Conditions, for a Wormhole Wavefunction, While Considering Differences between Magnetic Black Holes, Versus Standard Black Holes as Generating Signals from a Wormhole Mouth [J], Andrew Beckwith5.Stellar Rotating Black Holes [J], Ardeshir Irani因版权原因,仅展示原文概要,查看原文内容请购买。
龙源期刊网
The First-Ever Image of a Black Hole Is Stunning
作者:
来源:《中学生英语·九年级》2019年第08期
The existence of black holes was first proposed by Albert Einstein in his 1916 general theory of relativity. However, astrophysicists have thus far relied on indirect evidence. That changed on April 10, 2019, with the release of the first-ever direct visual evidence of a black hole in the center of the galaxy M87, located 55 million light-years from Earth.
○有史以来第一张黑洞的图像令人吃惊
阿尔伯特·爱因斯坦在1916年“广义相对论”中首次提出黑洞的存在。
然而,到目前為止,天体物理学家们一直依靠间接证据来证明他们的存在。
这种情况随着2019年4月10日M87
星系中心一个黑洞的首次直接视觉证据的发布而发生了变化,这个黑洞距离地球5500万光年。
(宇宙)高中英语阅读短文《发现黑洞》及答案北京时间2019年4月10日21时,天文学家召开全球新闻发布会,宣布首次直接拍摄到黑洞的照片。
阅读题目,回答问题文本选自:The Guardian(卫报)Recently,scientists produced the first real image of a black hole,shining a light onone of the universe’s great mysteries,in a galaxy called Messier87.The image is not a photograph but an image created by the Event Horizon Telescope(EHT)ing a network of eight ground-based telescopes across the world,the EHT collected data to produce the image.The black hole itself is unseeable,as it’s impossible for light to escape from it;what we can see is its even thorizon.The EHT was also observing a black hole located at the centre of the Milky Way, but was unable to produce an image.While Messier87is furtheraway,it was easier to observe,due to its larger size.The golden ring is the event horizon,the moment an object approaching a black hole reaches a point of no return,unable to escape its gravitational pull.Objects that pass into the event horizon are thought to go through spaghettification(意大利面条化),a process,first described by Stephen Hawking,in which they will be stretchedout like a piece of pasta by gravitational forces.Heino Falcke,professor of radio astronomy and astroparticle physics at Radboud University in Nijmegen,and chair of the EHT science council, says the image shows asilhouette(剪影)of the hole against the surrounding glow of the event horizon,all of the matter being pulled into the hole.At the centre of the black hole is a gravitational singularity, where all matter is crushed into an infinitely small space.The black hole lies55m light years away from us.It is around100bn km wide,larger than the entire solar system and6.5bn times the mass of our sun.Through creating an image of a black hole,something previously thought to be impossible,the EHT project has made a break through in the understanding ofblack holes,whose existence has long been difficult to prove.The image will help physicists to better understand how black holes work and images of the event horizon are particularly important for testing the theory of general relativity.1.What’s the text mainly about?A.The image of a black hole.B.The photo created by the EHT.C.The event horizon of the black hole.D.The introduction of the EHT project.2.How does EHT collect data?A.By producing the image of a black hole.0B.By studying the golden ring in the photo.C.By observing the center of the Milky Way.D.By using a network of eight ground-based telescopes.3.What do we know about the black hole fromthe text?A.Its image shows a silhouette of the event horizon.B.There is a possibility that light can escape from it.C.All matter is crushed into small space at its centre.D.Objects will be stretched out outside the event horizon.4.What does the last paragraph mainly present?A.Creating an image of a black hole is thought to be impossible.B.It’sstill hard for physicists to prove the existence of the black hole.C.The image will help physicists to test the theory of general relativity.D.The image of a black hole created by EHT project is highly significant.参考答案:ADCD生词及长难句1.Galaxy n.星系the galaxy银河系2.event horizon视界德国天文学家卡尔·史瓦西计算出一个巨大天体可扭曲周围空间,以至于连光都无法逃脱,这个特定的半径就是我们所致的史瓦西半径,也可以称之为“视界”。
Lesson 3 Knowing the World Cosmically Earth (or the Earth) is not a star, nor a satellite. It is a planet, the third planet from the Sun, and the densest and fifth-largest of the eight planets in the Solar System. It is also the largest of the Solar System’s four terrestrial planets. It is sometimes referred to as the World, the Blue Planet, or by its Latin name, Terra. Earth formed 4.54 billion years ago, and life appeared on its surface within one billion years. The planet is home to millions of species, including humans. Earth’s biosphere has significantly altered the atmosphere and other abiotic conditions on the planet, enabling the proliferation of aerobic organisms as well as the formation of the ozone layer which, together with Earth's magnetic field, blocks harmful solar radiation, permitting life on land. The physical properties of the Earth, as well as its geological history and orbit, have allowed life to persist during this period. The planet is expected to continue supporting life for at least another 500 million years. Earth’s outer surface is divided into several rigid segments, or tectonic plates, that migrate across the surface over periods of many millions of years. About 71% of the surface is covered by salt water oceans, with the remainder consisting of continents and islands which together have many lakes and other sources of water that contribute to the hydrosphere. Liquid water, necessary for all known life, is not known to exist in equilibrium on any other planet's surface. Earth's poles are mostly covered with solid ice (Antarctic ice sheet) or sea ice (Arctic ice cap). The planet's interior remains active, with a thick layer of relatively solid mantle, a liquid outer core that generates a magnetic field, and a solid iron inner core. Earth interacts with other objects in space, especially the Sun and the Moon. At present, Earth orbits the Sun once every 366.26 times it rotates about its own axis, which is equal to 365.26 solar days, or one sidereal year. The Earth's axis of rotation is tilted 23.4° away from the perpendicular of its orbital plane, producing seasonal variations on the planet's surface with a period of one tropical year (365.24 solar days). Earth's only known natural satellite, the Moon, which began orbiting it about 4.53 billion years ago, provides ocean tides, stabilizes the axial tilt, and gradually slows the planet's rotation. Between approximately 3.8 billion and 4.1 billion years ago, numerous asteroid impacts during the Late Heavy Bombardment caused significant changes to the greater surface environment. Both the mineral resources of the planet, as well as the products of the biosphere, contribute resources that are used to support a global human population. These inhabitants are grouped into about 200 independent sovereign states, which interact through diplomacy, travel, trade, and military action. Human cultures have developed many views of the planet, including personification as a deity, a belief in a flat Earth or in the Earth as the center of the universe, and a modern perspective of the world as an integrated environment that requires stewardship.
arXiv:astro-ph/0009249v1 15 Sep 2000EvidenceforMassiveBlackHolesinNearbyGalacticNuclei
TimdeZeeuwLeidenObservatory,Postbus9513,2300RALeiden,TheNetherlands
Abstract.Massesofblackholesinnearbygalacticnucleicanbemeasuredinavarietyofways,usingstellarandgaseouskinematics.Reliableblackholemassesareknownforseveraldozenobjects,sothatdemographicquestionscanstarttobeaddressedwithsomeconfidence.Prospectsforthenearfuturearediscussedbriefly.
1IntroductionActivegalaxiesandquasarsarepoweredbyphysicalprocessesinanaccretiondisksurroundingamassiveblackhole[37,54].Theobservednumberofactivegalaxiesincreasestowardshighredshiftz,sothatmany‘normal’galaxiesmusthavebeenactiveinthepast[59].Thisimpliesthatinactivemassivecentralblackholesmustlurkinthenucleiofnearbynormalgalaxies.Inthepastdecade,muchworkhasbeendonetomeasurethemassesoftheseblackholes,toestablishtherelationbetweenblackholemassandtheglobal/nuclearpropertiesofthehostgalaxy,andtounderstandtheroletheseobjectsplayindrivinginternaldynamicalevolution[47,64].AblackholeofmassMBHinagalacticnucleusdominatesthegravi-tationalpotentialinsidetheso-calledradiusofinfluencewhichisusuallydefinedasrBH=GMBH/σ2,whereGisthegravitationalconstant,andσisthecharacteristicvelocitydispersioninthehostgalaxy.Inphysicalunits
rBH∼0.4MBHσ2pc.(1)ForagalaxyatdistanceD,rBHcorrespondstoanangularsizeθBH∼0.′′1MBHσ21Mpc2TimdeZeeuwFig.1.TheradiusofinfluencerBH=GMBH/σ2ofcentralblackholeswithwell-determinedmassesversusthedistanceofthehostgalaxy.Themasseswerederivedfromstellarkinematics(stars),gaskinematics(dots)andVLBImeasurementsofmasers(triangles).ThesolidlinecorrespondstoanangularsizeθBH=1.′′0,andthedottedlinecorrespondsto0.′′1.TheerrorbarsrepresentthequoteduncertaintyinMBH[2,8,12,15,16,20,21,24,28,30,38,42,43,49,63].
andgas.Thisrequireshighspatialresolution.Forexample,the3×109M⊙
blackholeinthenucleusofthegalaxyM87[31]intheVirgoclusterhas
θBH≈1.′′5.Thegeneralapproachistodeterminetheluminousmassinstarsfromtheobservedsurfacebrightnessdistribution,andtocomparethiswiththedynamicalmassderivedfromkinematicmeasurementsofstarsorgas[32,55].Ifonecanshowthatthemassdensityinsideacertainradiusislargerthananythingthatcanbeproducedbynormaldynamicalprocesses,thentheobjectisconsideredtobeablackhole.Inafewcasesitispossibletofinddirectevidenceforthepresenceofarelativisticobject(§3).Figure1showsrBHasdefinedineq.(1)forthebestpublishedblackholemassdeterminationsversusthedistancetothehostgalaxy.Linesofconstantangularresolutionθresrundiagonal.Theearlydeterminationsclusterednearθres≈1.′′0[56],butHSThaspushedthistoθres≈0.′′1.Detailedmodelinghasshownthat,dependingontheinternaldynamicalstructureofthehostgalaxy,theeffectsoftheblackholeoftenarevisibleonlyinsideprojectedradiithataresignificantlysmallerthanrBH(e.g.,eq.(4.2)in[52]).ThissuggeststhatmeasuredmassescorrespondingtoθBH∼θresshouldbetreatedwithcaution,astheyarelikelytobeoverestimates(see§4).Atpresent,onlyVLBImeasurementscanprobetheregimeθres<0.′′1.BlackHolesinGalacticNuclei32StellardynamicalmodelingThenearestgalacticnucleusisthecenterofourownGalaxy.Despitethelargeforegroundextinction,itispossibletoresolveindividualstarsintheGalacticcenterintheinfrared,andtomeasurenotonlytheirradialvelocities,butalsotheirpropermotions[15,28],andaccelerations[29]!DynamicalmodelingofthisremarkabledataprovidesunequivocalproofthatourGalaxycontainsacentralblackholeofnearlythreemillionsolarmasses.Thedynamicsofthenucleiofnearbyearly-typegalaxiescanbeprobedwithstellarabsorption-linespectroscopyoftheintegratedlight.Thisgener-allyrequireslongexposuretimes.Theorbitalstructureinthesesystemsisrich[47,64],soatrueinwardincreaseofthemass-to-lightratioM/Lmustbedistinguishedfromradialvariationofthevelocityanisotropy.Thiscanbedonebymeasuringtheshapeoftheline-of-sightvelocitydistribution[27,41].Theorbitalstructureisrelatedtotheintrinsicshapeofthegalaxy.Thiscanbeconstrainedbymeasurementsalongmultiplepositionangles[5,44],or,evenbetter,byintegral-fieldspectroscopy(§5).Determinationoftheblackholemassandtheorbitalstructurerequiresconstructionofdynamicalmodels.Therehasbeenasteadyincreaseinthesophisticationofmodelconstructioninthepastdecade.Earlyisotropicspher-icalmodelswerereplacedbyanisotropicspheres,andthenbyaxisymmetricmodelswithaspecialorbitalstructure(phase-spacedistributionfunctionf=f(E,Lz)whereEistheorbitalenergyandLzistheangularmomentumcomponentparalleltothesymmetryaxis,e.g.,[52]).Morerecentlyaxisym-metricmodelswiththefullrangeofpossibleanisotropies,andmultiplecom-ponentshavebeenused.ThefirstsuchstudywasdoneforM32,andincludedground-baseddataalongfourpositionanglesandeightFOSpointings[44].ThemodelwasconstructedbyaversionofSchwarzschild’s[57]numericalorbit-superpositionmethod,whichfitsthesurfacebrightnessdistributionaswellasallkinematicobservables[13].AnotherexampleofthisapproachisprovidedbytheE7/S0galaxyNGC4342inVirgo.Thisisalow-luminosityobject,seennearlyedge-on,withaprominentnuclearstellardisk.Cretton&vandenBosch[12]usedground-basedmajor-axiskinematicsfromtheWHTandfiveFOSpointings[7],andcomparedthesewithgeneralaxisymmetricmodelscontainingaspheroid,astellardisk,anucleardiskandablackhole.FreeparametersinthemodelingwereMBHandthestellarmass-to-lightratioΥ.Contoursofconstantχ2inthe(Υ,MBH)-planeshowthatthebestfitisobtainedforMBH∼3×108M⊙,butwithasignificantuncertainty(Figure2).Todate,blackholemasseshavebeenderivedinthiswayforaboutfif-teenobjects.ThefullanalysishasbeenpublishedonlyforM32[44],N4342[12],andNGC3379[24],allbasedonground-basedandFOSdata.Blackholemassesbasedonthree-integralaxisymmetricmodelingofSTISabsorption-linespectroscopyhavebeenreportedforadozenobjectsbyGebhardt’sgroup[25],butthedataandthemodelshavenotyetbeenpublished.