Rheological properties of Salecan as a new source of thickening agent
- 格式:pdf
- 大小:659.89 KB
- 文档页数:7
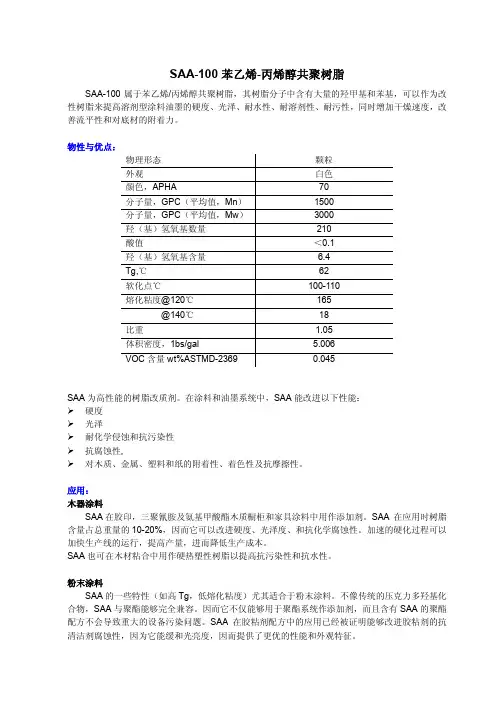
Rheology and Viscosity Scaling of the Polyelectrolyte Xanthan GumNicholas B.Wyatt,Matthew W.LiberatoreDepartment of Chemical Engineering,Colorado School of Mines,Golden80401,ColoradoReceived8April2009;accepted10July2009DOI10.1002/app.31093Published online19August2009in Wiley InterScience().ABSTRACT:The viscosity as a function of concentration for xanthan gum in both salt-free solution and in50m M NaCl is measured and compared with a scaling theory for polyelectrolytes.In general,the zero shear rate viscosity and the degree of shear thinning increase with polymer concentration.In addition,shear thinning was observed in the dilute regime in both solvents.In salt-free solution, four concentration regimes of viscosity scaling and three associated critical concentrations were observed(c*% 70ppm,c e%400ppm,and c D%2000ppm).In salt solu-tion,only three concentration regimes and two critical concentrations were observed(c*%200ppm and c e%800 ppm).In the presence of salt,the polymer chain structure collapses and occupies much less space resulting in higher values of the critical concentrations.The observed viscos-ity-concentration scaling is in very good agreement with theory in the semidilute unentangled and semidilute entangled regimes in both salt-free and50m M NaCl solu-tion.V C2009Wiley Periodicals,Inc.J Appl Polym Sci114:4076–4084,2009Key words:biopolymers;polyelectrolytes;rheologyINTRODUCTIONCharged polymer systems are encountered daily in nature as many biological polymers,such as DNA,are polyelectrolytes.Polyelectrolytes are used exten-sively in many industrial applications such as food additives,flocculants,drilling fluids,and dragreducers.Because polyelectrolytes are such an im-portant part of so many different systems and indus-tries,a fundamental understanding of the rheologyof polyelectrolyte solutions is critical.Xanthan gum is a high molecular weight,anionic, extracellular polysaccharide produced by the bacte-rium Xanthomonas campestris.1The primary struc-ture of xanthan consists of a b-1,4-linked glucan backbone with charged trisaccharide side chains(b-D-mannopyrannosyl-(1,4)-a-D-glucopyrannosyl-(1,2)-b-D-mannopyrannosyl-6-O-acetate)on alternating backbone residues(Fig.1).2,3Variations in process-ing procedures and conditions lead to varying degrees of acetyl substitution(of the mannose resi-dues adjacent to the backbone)and pyruvic acetal substitution(of the terminal mannose units).The variations in degrees of substitution on the side chains have been shown to affect the rheological properties of the polymer.4,5The primary industrial applications for xanthan gum are viscosity modifica-tion and stabilization in food products(i.e.,salad dressing,ice cream,yogurt)and personal care prod-ucts(i.e.,lotions,creams,body washes),drilling flu-ids for enhanced oil recovery,drug delivery,and drag reduction.3,6–12The global market for xanthan is$$500million annually and continues to grow. Xanthan solution properties have been studied extensively over the past40years.3,7,9,13–29The main topics of interest have included solution viscosity, polymer conformation,temperature effects on poly-mer conformation,and the effects of salt on both so-lution properties and chain conformation.Xanthan exhibits both anisotropic and isotropic phases in so-lution.24–27The relative amount of each phase pres-ent in solution depends on the polymer molecular weight,polymer concentration,and solution ionic strength.The highest concentration used here remains well below the biphasic regime.Further, xanthan has been shown to exhibit two different conformational states:an ordered,helical conforma-tion and a disordered conformation that can be described as a broken or imperfect helix.2,17,21The conformation assumed by the xanthan molecules is highly dependent on the ionic content of the solvent. In salt-free solution,the xanthan backbone is disor-dered and highly extended due to electrostatic repulsions between charges on the side chains.In this state,the chains are relatively stiff,but retain some degree of flexibility.When salt ions are present in solution,the ordered,helical conformation is sta-bilized.Xanthan chains in the helical conformationCorrespondence to:M.W.Liberatore(mliberat@mines. edu).Contract grant sponsor:Donors of the American Chemical Society Petroleum Research Fund.Journal of Applied Polymer Science,Vol.114,4076–4084(2009) V C2009Wiley Periodicals,Inc.are much more rigid than the disordered chains and have been shown to have a persistence length simi-lar to that of double stranded DNA.Several studies have reported values,both experi-mental and predicted,of critical concentrations of varying definitions.However,a comprehensive study of solution viscosity,critical concentrations,and the effects of added salt on both the viscosity and critical concentrations for solutions from dilute to entangled does not exist.In the current study,this void is filled by experimentally deriving values for the overlap (c*)and entanglement (c e )concentrations for isotropic solutions in both salt-free and 50m M NaCl solution.Scaling observations of the zero shear rate viscosity and characteristic relaxation time for xanthan solutions are also compared with a theory proposed by Dobrynin et al.30Polyelectrolyte solution rheology is complex because of the sensitivity of the polymer to the pres-ence of ions in solution.31–41Several theories have been proposed to explain the observed differences in properties between polyelectrolytes and neutral polymers.30,42–47According to the theory proposed by Dobrynin et al.30,43polyelectrolyte chains can be represented as a chain of electrostatic blobs.The blobs repel each other resulting in a fully extended chain of electrostatic blobs.The chain conformation within the electrostatic blob is essentially independ-ent of electrostatic interactions and depends solely on the thermodynamic interactions between uncharged polymer and solvent.The dynamics of the polymer chain within the electrostatic blobs are described as Zimm like,whereas the dynamics of the chain outside the blob are Rouse like.The poly-mer chain remains rodlike up to the correlation length (n ),the distance over which fluctuations in a system are correlated.For length scales larger than n ,the chain becomes flexible and is described by a random walk of correlation blobs,which are com-posed of rodlike assemblies of electrostatic blobs.The flexibility on length scales larger than the corre-lation length is due to the charge screening of sur-rounding chains in solution.Using this conceptual picture of polyelectrolye chain behavior,several scaling regimes for the zero shear rate viscosity (g 0)and characteristic relaxation time (s )for flexible polyelectrolytes in salt-free solu-tion were proposed.30Although scaling theories are stated to apply to flexible polyelectrolytes,the poly-mer persistence length,or other characteristics of chain stiffness do not appear within the theory.30,43,48When the polyelectrolyte concentration exceeds the overlap concentration (c*),g 0is propor-tional to the square root of concentration (g 0$c 1/2),in agreement with the phenomenological law pro-posed by Fuoss.33,49Empirically,the overlap concen-tration generally occurs at about twice the solvent viscosity (g s )in polyelectrolyte solutions.30The semidilute unentangled regime is predicted to be very wide,spanning three to four decades in poly-mer concentration (c e ¼103c*).The large span of the semidilute unentangled regime is attributed to the stronger concentration dependence on chain size (R $c À1/4as opposed to R $c À1/8for neutral poly-mers)30coupled with the need for each polymer chain to overlap n others to become entangled.For concentrations above c e ,the proportionality increases to g 0$c 3/2.For polyelectrolyte solutions,a certain concentration c D exists where the electrostatic blobs begin to overlap.Above c D ,the viscosity scaling is predicted to be the same as for uncharged polymers in good or H solvents (g 0$c 15/4or g 0$c 14/3).In the present work,scaling of zero shear rate vis-cosity of xanthan with concentration and the theory proposed by Dobrynin et al.are compared over a range of concentration from 10to 6000parts per mil-lion by weight (ppm).Further,viscosity,critical con-centrations,relaxation times,and dynamic moduli are reported for xanthan in both salt-free solution and in 50m M NaCl.MATERIALS AND METHODSMaterialsThe xanthan gum used in the current study is a commercial,food grade polymer (Keltrol T 622,Mat.#20000625)donated by CP Kelco in powder form.The xanthan has an estimated molecular weight of 2Â106Da and polydispersity index of $2.The man-ufacturer reports that the product is ‘‘clarifed,’’meaning extra steps were taken to remove residual cellular debris from the fermentation process.Solu-tions with concentrations up to 10,000ppm have been made and observed to be optically clear.The powder was used as received without further purifi-cation or modification.For comparison,a quantityofFigure 1Molecular structure of xanthan according to Jansson et al.2RHEOLOGY AND VISCOSITY SCALING 4077Journal of Applied Polymer Science DOI 10.1002/appthe xanthan used here was dialyzed exhaustively toobtain the potassium salt form.The rheology of the dialyzed xanthan agreed to within experimentalerror and errors expected from batch to batch varia-tion in xanthan products.Deionized water was obtained by passing house deionized water througha Barnstead NANOpure Diamond UV ultrapurewater system followed by a0.2-l m filter.The result-ing deionized water had a measured resistance of18.2M X cm.The reagent grade NaCl used wasobtained from Mallinckrodt Chemicals(Product #7581-12)and was used without further purification.The glassware used for mixing and storage of xan-than solutions was carefully cleaned with either ethanol or acetone(reagent grade),then rinsed withpurified deionized water to remove all traces of salt. Sample preparationXanthan solutions were prepared by dissolving the polymer powder in either deionized water(salt-freesolution,i.e.,no added salt)or50m M NaCl.Thesolutions were stirred using a magnetic stir bar for $1h,allowed to rest for$24h at room tempera-ture,and finally used for rheological testing.Severalsamples were prepared by adding NaCl to a xan-than solution to compare the resulting rheological properties to solutions prepared by adding xanthan powder to a NaCl solution.No measurable differen-ces in viscosity or dynamic moduli were observed when comparing the sample preparation methods. In all cases,measurements were made1–4days after solution preparation.In the period of1–4days after sample preparation,no measurable change in rheo-logical properties of the solutions was observed.The solutions were discarded6days after preparation as polymer degradation became evident(e.g.,signifi-cant decrease in viscosity and loss of optical clarity).RheologyAll rheological data were collected using a TA Instruments AR-G2stress controlled rheometer. Experiments were conducted using either a stainless steel cone(60-mm diameter,1degree)and plate or a concentric cylinder(Couette cell)geometry(of outer diameter30.0mm and inner diameter28.0mm)in steady or oscillatory shear.Sample evaporation was minimized by using a solvent trap in conjunction with the appropriate geometry.Temperature was controlled at25.0Æ0.1 C using a Peltier plate(cone and plate)or a Peltier jacket(Couette).Calibration with viscosity standard oils showed agreement with an error of<3%.The AR-G2rheometer has a torque range of0.01–200mNÁm,which is sufficiently sensi-tive to measure zero shear rate viscosities at very low polymer concentrations(c<10ppm).The data reported here are the averages of at least three replicate data sets and the associated errorbars represent one standard deviation unless other-wise noted.RESULTS AND DISCUSSIONSalt-free solutionXanthan solutions in the absence of salt exhibit a newtonian plateau and shear thinning behavior typi-cal of polymer solutions(Fig.2).Below20ppm,the xanthan solutions behave like newtonian solutions. Of note,shear thinning behavior was observed forxanthan concentrations in the dilute regime(20ppm <c<70ppm).Representative flow curves from each of the four concentration regimes(Fig.2)aredescribed well by the Cross model,g¼gÀg11þK_cðÞmþg1where g0is the zero shear rate viscosity,g1is the infinite shear rate viscosity,K is the characteristic time of the solution,and m is the rate index.As expected,g0increases monotonically with xanthan concentration and g1for all concentrations is near the solvent viscosity(Table I).Further,a power law of the formg¼A_c nfit to the shear thinning region shows that the degree of shear thinning(quantified by the power law index,n;Table I)increases with polyelectrolyteconcentration.Figure2Viscosity as a function of shear rate for several xanthan concentrations in salt-free solution.Solid lines are Cross model fits to the measured points.4078WYATT AND LIBERATORE Journal of Applied Polymer Science DOI10.1002/appUsing a set of30flow curves(four representative examples are shown in Fig.2),the critical concentra-tions for xanthan were determined from the depend-ence of zero shear rate viscosity on polyelectrolyte concentration.Over a range of three decades of xan-than concentration,four distinct regions of viscosity scaling show very good agreement with the theory proposed by Dobrynin et al.(Fig.3).The overlap concentration(c*%70ppm)is characterized by a sudden increase(by a factor of$5)in g0over a nar-row range in concentration($15ppm).The increase is attributed to the fact that as the number of polye-lectrolyte chains in solution increases,the space between the chains(and therefore the anionic charges on the chains)decreases.As the charges get closer to one another,the repulsive forces between the chains increase.Thus,there is an increase in the resistance of the chains when trying to move past one another leading to the observed increase in vis-cosity.Empirically,c*usually occurs at about twice the viscosity of the solvent(0.00088Pa s,in this case).However,the viscosity at c*for xanthan is $90times larger than the solvent viscosity.It is interesting to note that for dilute solutions,g0scales with concentration to a degree(g$c1.6)that is very close to the scaling observed in the semidilute entangled regime(g$c1.5).In the semidilute unentangled regime(c*<c< c e),g0increases as the square root of polyelectrolyte concentration,which is a weaker concentration de-pendence than for neutral polymers(g0$c in H sol-vent).The entire semidilute unentangled regime is well described by the empirical Fuoss law(g0$c1/2). Unlike the three to four decades in concentration that the semidilute unentangled region is predicted to span,this region is found to be relatively small for xanthan,spanning less than one decade in concentra-tion(c*%70ppm to c e%400ppm).Further agreement with theory is shown in the semidilute entangled regime,where g0was found to scale as c3/2.The dependence of viscosity on polye-lectrolyte concentration in the semidilute entangled regime is much weaker than the neutral polymer case(g$c15/4in good solvents and g$c14/3in H solvents).Also,the entanglement concentration is evidenced by a minimum in a plot of the reduced viscosity g R[where g R¼(gÀg s)/g s c]versus poly-mer concentration(not shown).The final critical concentration(c D)and associated increase in viscosity is observed at around2000 ppm.Dobrynin et al.defined c D as the concentration at which electrostatic blobs begin to overlap.A crossover in viscosity behavior is predicted to occur at c D where the behavior changes from that of charged polymers to neutral polymers in good or H solvents.For concentrations above c D,the electro-static blob concept breaks down,and the solution rheology is due mainly to the polymeric nature of the polyelectrolyte solution.30In this study,g0was observed to scale to the power of15/4above c D, which is identical to the scaling predicted for neutral polymers in good solvents.Therefore,our observa-tions confirm the crossover to neutral polymer behavior in this concentration region.Although the theory proposed by Dobrynin et al. is based on flexible polyelectrolytes,we show re-markable agreement for xanthan,which has been shown to be rather rigid.Several studies report the persistence length of xanthan to be100–150nm in salt solution.10,50–52Double-stranded DNA has a per-sistence length of$50nm in salt solution.48A recent study reports the persistence length of short-chain branched polyethylene(a flexible polymer)in solution to be$0.8nm.53Although most studies report persistence lengths for xanthan in an ionic so-lution,it is clear that xanthan retains a high degree of rigidity in salt-free solution.The role of chain flexibility in the scaling theory is unclear;however, our data suggest that scaling principles may success-fully be applied to rigid polyelectrolyte systems. Comparing the measured shear viscosity with the dynamic viscosity indicates that the well knownTABLE IFit Parameters for Cross and Power Law Models for Several Xanthan Concentrations Concentration(ppm)g0(Pa s)g1(Pa s)K(s)m n400039 5.1Â10À3410.78À0.72 1000 1.5 2.3Â10À3 5.80.73À0.61 2000.33 3.1Â10À3 4.80.78À0.58 500.01 1.6Â10À30.490.76À0.34Cox-Merz rule applies to the xanthan solutions stud-ied here for all but the lowest concentrations (Fig.4).The validity of the Cox-Merz rule observed seems to disagree with previous studies that have shown that the Cox-Merz rule does not hold for xanthan.25,54The discrepancy is likely due to the concentration of the xanthan solutions used.According to the phase diagram given by Inatomi et al.,27the solutions where the Cox-Merz rule does not apply lie in either the biphasic or anisotropic regime while all solutions in the present work lie in the isotropic regime.The dynamic moduli provide additional informa-tion on the viscoelastic nature of the xanthan solu-tions in the four concentration regimes (Fig.5).In the dilute limit [Fig.5(b)],the storage modulus (G 0)tends to zero (i.e.,newtonian fluid)as the concentra-tion decreases.As the polymer concentration is increased,a crossover in G 0and G 00is observed [Fig.5(a)].The crossover in G 0and G 00signifies the cross-over from more liquid like to more elastic behavior.The inverse of the crossover frequency is directly related to a relaxation time for the polyelectrolyte.The dependence of the relaxation time (s )on poly-mer concentration for polyelectrolytes differs greatly from neutral polymer behavior.Dobrynin et al.pre-dict that the relaxation time decreases with polymer concentration (scaling as c À1/2)for the semidilute unentangled regime,and the relaxation time in the semidilute entangled regime is predicted to be inde-pendent of polymer concentration.For neutral poly-mers,s is expected to increase with concentration for all concentrations.To further compare the experimental observations for xanthan with theoretical predictions,relaxation times were determined from the measured rheologi-cal data.Following the method of Boris et al.,55the characteristic relaxation time (s )was determinedfrom the viscosity verses shear rate data by deter-mining the intersection of the power law fit to the shear thinning regime and the least squares fit to the newtonian plateau.The reciprocal of the shear rate at which the power law fit and the least squares fit intersect gives a characteristic relaxation time.Four distinct scaling regions in the dependence of the characteristic relaxation time on the polyelectrolyte concentration in salt-free solution are observed (Fig.6).In the semidilute unentangled regime,the relaxa-tion time decreases with increasing polymer concen-tration (s $c À1/2)whereas in the semidilute entangled regime,the relaxation time is independent of polymer concentration.Therefore,very good agreement with theory was found in the range c*<c <c D .Published theories do not explain the relaxation time dependencies observed in salt-free solution in the concentration ranges below c*or above c D .For the xanthan solutions studied here,relaxation time increases with concentration as $c 3/2in thediluteFigure 5Dynamic mechanical properties (G 0filled,G 00open)as a function of frequency for (a)one concentration above c D and one concentration in the semidilute entangled regime and (b)one concentration in the semidi-lute unentangled regime and one concentration in the dilute regime in salt-free solution.4080WYATT AND LIBERATOREJournal of Applied Polymer Science DOI 10.1002/appregime,which is the expected result for a neutral polymer in the entangled regime.Further,as the polymer concentration is increased,a maximum in the relaxation time was observed at low polymer concentration (near c*)followed by a decrease into the semidilute unentangled regime.Similar behavior has been observed in other polyelectrolyte solu-tions,55,56but is not described by theory.In addition,the scaling of s in the dilute regime agrees very well with the scaling of g 0in the same concentration range (Fig.3).The similar dependence on concentra-tion for s and g 0suggests that,in the dilute limit,all rheological properties may exhibit a similar depend-ence on polymer concentration.For concentrations above c D ,the relaxation time shows a much stronger dependence on polymer con-centration (s $c 4).Above c D ,the polymer chains arecompletely entangled.As the polymer concentration is increased,the number of entanglements also increases.As the number of entanglements increases,the time required to dissipate the energy imparted to the solution also increases as the chains become less mobile due to the entanglements.Boris et al.55showed similar results for a well characterized sulfo-nated polystyrene sample.However,the scaling above c D for the sulfonated polystyrene was weaker (s $c 1.8)than for xanthan due,perhaps,to differen-ces in molecular structure,chain stiffness,or hydro-gen bonding.Salt solutionFor polyelectrolytes,the presence of salt in solution dramatically changes the structure of the polymer in solution which,in turn,changes the rheological properties of the solution.In 50m M NaCl solution,xanthan exhibits shear thinning behavior for concen-trations $80ppm (Fig.7).As in salt-free solution,the flow curves (Fig.7)are well described by the Cross model,and the degree of shear thinning (power law index,n )increases with polymer concen-tration (Table II).For concentrations below c D (deter-mined in salt-free solution),a sharp decrease in g 0(up to one order of magnitude)is observed in salt solution.The decrease in viscosity in the presence of salt is commonly observed for polyelectrolytes.The decrease in viscosity is attributed to the salt ions in solution shielding the ionic charges on the polymer chain from one another.The shielding due to the salt ions allows the polymer chain to assume a more compact structure in solution.Because the domains of the polymer chains decrease in size,the number of interactions with neighboring chains also decreases.In other words,more polymer chains are required in solution to get the same amount of inter-molecular interaction and subsequent viscosity increase.The relatively strong shear thinning observed at very low polyelectrolyte concentrations ($50ppm)in salt-free solution is no longer observed in the presence of salt (Fig.7).In salt solu-tion,xanthan concentrations below 80ppm were observed to be newtonian.Critical concentrations for xanthan in 50m M NaCl were determined from a plot of g 0versuspolymerFigure 6Dependence of relaxation time on xanthan con-centration in salt-free solution.Solid lines show scaling predicted by theory (c*<c <c D )whereas dashed lines are power law fits.Critical concentrations were determined from Figure 3.TABLE IIFit Parameters for Cross and Power Law Models for Several Xanthan Concentrations in 50m M NaClConcentration(ppm)g 0(Pa s)g 1(Pa s)K (s)mn2000 4.0 2.6Â10À3170.69À0.625000.04 1.9Â10À30.420.62À0.331000.0031.4Â10À30.300.57À0.08RHEOLOGY AND VISCOSITY SCALING 4081Journal of Applied Polymer Science DOI 10.1002/appconcentration (Fig.8).When salt is present,three concentration regimes are observed (as opposed to four in salt-free solution).For concentrations above c*,the dependence of g 0on concentration is much stronger than in salt-free solution.In the dilute re-gime,g 0scales directly with xanthan concentration (g $c ).Above c *,the scaling increases to g 0$c 2.In the semidilute entangled regime,the scaling of g 0is much stronger with concentration (g 0$c 14/3).Very good agreement with the scaling predictions for a neutral polymer in a H solvent was observed in the dilute,semidilute unentangled,and semidilute entangled concentration regimes despite the rigidity of the xanthan chains in salt solution.The measure-ments confirm the prediction that neutral polymer behavior is observed in the presence of salt.Further,in the presence of NaCl,the abrupt increase in g 0observed at c*in salt-free solution was not observed.The less dramatic transition near c*may be due to the salt ions in solution screening the Coulombic interactions that the polymer experiences in salt-free solution.An increase in both c*and c e is observed in the presence of NaCl.The overlap concentration ($200ppm)is almost three times larger than c*in salt-free solution ($70ppm).The entanglement concentra-tion ($800ppm)is twice the value of c e in salt-free solution ($400ppm).The third critical concentra-tion observed in salt-free solution (c D )is not observed in the presence of NaCl in the polymer concentration range studied here.Because the critical concentrations are dependent on interactions between polymer chains,it follows that solutions of smaller chains would exhibit higher critical concen-trations.As stated previously,the salt ions in solu-tion screen the electrostatic interactions between the ions in solution and allow the polymer chains toassume a smaller average configuration.Thus,smaller domain size of the polymer chains corre-sponds to higher critical concentrations.The scaling of the relaxation time for xanthan in the presence of salt (Fig.9)differs markedly from the scaling in salt-free solution.Theory predicts that s scales as c 1/4in the semidilute unentangled regime and as c 3/2in the semidilute entangled regime for polyelectrolytes in salt solution.Experimental meas-urements agree very well with theory in these two concentration regimes.For xanthan concentrations below 80ppm,the samples are newtonian,therefore no relaxation time can be determined (by definition,s ¼0for newtonian fluids).For concentrations above 80ppm in the dilute regime,relaxation time seems to be independent of polymer concentration (s $c 0).The apparent independence of relaxation time in the dilute regime is likely due to the relatively small number of polymer chains present in the solu-tion.Below c*,the polymer chains do not interact appreciably one with another.Therefore,the relaxa-tion time observed for the solution will be depend-ent solely on how individual chains react to the stress applied to the solution.The maximum in s observed for xanthan in salt-free solution (Fig.6)was not observed in the presence of NaCl.When the polymer concentration is increased above c*,inter-molecular interactions become important,and the result is an increase in the relaxation time (i.e.,s is no longer independent of polymer concentration).Further,the decrease in the magnitude of the relaxa-tion time in both the semidilute unentangled and semidilute entangled regimes is consistent with the fact that the rigid,helical xanthan conformation is stabilized by the presence of salt.The increaseinFigure 8Zero shear rate viscosity scaling dependence on xanthan concentration in 50m M NaCl.Solid lines show scaling predictions for neutral polymers in H solventconditions.。
Electrochimica Acta 92 (2013) 248–256Contents lists available at SciVerse ScienceDirectElectrochimicaActaj o u r n a l h o m e p a g e :w w w.e l s e v i e r.c o m /l o c a t e /e l e c t a c taGel-combustion synthesis of LiFePO 4/C composite with improved capacity retention in aerated aqueous electrolyte solutionMilica Vujkovi´c a ,Ivana Stojkovi´c a ,Nikola Cvjeti´canin a ,Slavko Mentus a ,b ,∗,1a University of Belgrade,Faculty of Physical Chemistry,P.O.Box 137,Studentski trg 12-16,11158Belgrade,Serbia bThe Serbian Academy of Sciences and Arts,Kenz Mihajlova 35,11158Belgrade,Serbiaa r t i c l ei n f oArticle history:Received 2October 2012Received in revised form 3January 2013Accepted 5January 2013Available online 11 January 2013Keywords:Aqueous rechargeable Li-ion battery Galvanostatic cycling Gel-combustion Olivine LiFePO 4LiFePeO 4/C compositea b s t r a c tThe LiFePO 4/C composite containing 13.4wt.%of carbon was synthesized by combustion of a metal salt–(glycine +malonic acid)gel,followed by an isothermal heat-treatment of combustion product at 750◦C in reducing atmosphere.By a brief test in 1M LiClO 4–propylene carbonate solution at a rate of C/10,the discharge capacity was proven to be equal to the theoretical one.In aqueous LiNO 3solu-tion equilibrated with air,at a rate C/3,initial discharge capacity of 106mAh g −1was measured,being among the highest ones observed for various Li-ion intercalation materials in aqueous solutions.In addition,significant prolongation of cycle life was achieved,illustrated by the fact that upon 120charg-ing/discharging cycles at various rates,the capacity remained as high as 80%of initial value.The chemical diffusion coefficient of lithium in this composite was measured by cyclic voltammetry.The obtained val-ues were compared to the existing literature data,and the reasons of high scatter of reported values were considered.© 2013 Elsevier Ltd. All rights reserved.1.IntroductionThanks to its high theoretical Coulombic capacity (170mAh g −1)and environmental friendliness,LiFePO 4olivine became a desir-able cathodic material of Li-ion batteries [1,2],competitive to other commercially used cathodic materials (LiMnO 4,LiCoO 2).As evidenced in non-aqueous electrolyte solutions,a small vol-ume change (6.81%)that accompanies the phase transition LiFePO 4 FePO 4enables Li +ion insertion/deinsertion reactions to be quite reversible [1–3].The problem of low rate capability,caused by low electronic conductivity [4,5],was shown to be solv-able to some extent by reduction of mean particle size [6].Further improvements in both conductivity and electrochemical perform-ances were achieved by forming composite LiFePO 4/C,where in situ produced carbon served as an electronically conducting con-stituent [5,7–27].Ordinarily,both in situ formed carbon and carbon black additive,became unavoidable constituent of the LiFePO 4-based electrode materials [28–37].Zhao et al.[27]reported that Fe 2P may arise as an undesirable product during the synthesis of LiFePO 4/C composite under reducing conditions,however,other authors found later that this compound may contribute positively∗Corresponding author at:University of Belgrade,Faculty of Physical Chemistry,P.O.Box 137,Studentski trg 12-16,11158Belgrade,Serbia.Tel.:+381112187133;fax:+381112187133.E-mail address:slavko@ffh.bg.ac.rs (S.Mentus).1ISE member.to the electronic conductivity and improve the electrochemical per-formance of the composite [28–30].Severe improvement in rate capability and capacity retention was achieved by partial replace-ment of iron by metals supervalent relative to lithium [31–37].Thus one may conclude that the main aspects of practical applica-bility of LiFePO 4in Li-ion batteries with organic electrolytes were successively resolved.After the pioneering studies by Li and Dahn [38,39],recharge-able Li-ion batteries with aqueous electrolytes (ARLB)attracted considerable attention [40–50].The first versions of ARLB’s,suf-fered of very low Coulombic utilization and significantly more pronounced capacity fade relative to the batteries with organic electrolyte,regardless on the type of electrode materials [43].For the first time,LiFePO 4was considered as a cathode material in ARLB’s by Manickam et al.in 2006[44].He et al.[46],in an aqueous 0.5M Li 2SO 4solution,found that LiFePO 4displayed both a surprisingly high initial capacity of 140mAh g −1at a rate 1C and recognizable voltage plateau at a rate as high as 20C,which was superior relative to the other electrode materials in ARLB’s.Recently,the same authors reported a high capacity decay in aer-ated electrolyte solution,amounting to 37%after only 10cycles [48].In the same study,they demonstrated qualitatively by a brief cyclovoltammetric test,that a carbon layer deposited from a vapor phase over LiFePO 4particles,suppressed the capacity fade [48].Inspired by the recent discoveries about excellent rate capa-bility [46]but short cycle life [48]of LiFePO 4in aerated aqueous solution,we attempted to prolong the cycle life by means of protecting carbon layer over the LiFePO 4particles.Therefore we0013-4686/$–see front matter © 2013 Elsevier Ltd. All rights reserved./10.1016/j.electacta.2013.01.030M.Vujkovi´c et al./Electrochimica Acta92 (2013) 248–256249synthesized LiFePO4/C composite by a fast and simple glycine-nitrate gel-combustion technique.This method,although simpler than a classic solid state reaction method combined with ball milling[44,48],was rarely used for LiFePO4synthesis[19,27].It yielded a porous,foamy LiFePO4/C composite,easily accessible to the electrolyte.Upon the fair charging/discharging performance was confirmed by a brief test in organic electrolyte,we examined in detail the electrochemical behavior of this material in aqueous electrolyte,by cyclic voltammetry,complex impedance and cyclic galvanostatic charging/discharging methods.In comparison to pure LiFePO4studied in Ref.[48],this composite displayed markedly longer cycle life in aerated aqueous solutions.The chemical dif-fusion coefficient of lithium was also determined,and the reasons of its remarkable scatter in the existing literature were considered.2.ExperimentalThe LiFePO4/C composite was synthesized using lithium nitrate, ammonium dihydrogen phosphate(Merck)and iron(II)oxalate dihydrate(synthesized according to the procedure described else-where[51])as raw materials.Our group acquired the experience in this synthesis technique on the examples of spinels LiMn2O4 [52]and LiCr0.15Mn1.85O4[53],where glycine served as both fuel and complexing/gelling agent to the metal ions.A stoichiometric amount of each material was dissolved in deionized water and mixed at80◦C using a magnetic stirrer.Then,first glycine was added into the reaction mixture to provide the mole ratio of glycine: nitrate of2:1,and additionally,malonic acid(Merck)was added in an amount of60wt.%of the expected mass of LiFePO4.The role of malonic acid was to decelerate combustion and provide con-trollable excess of carbon[14].After removing majority of water by evaporation,the gelled precursor was heated to initiate the auto-combustion,resulting in aflocculent product.The combustion product was heated in a quartz tube furnacefirst at400◦C for3h in Ar stream,and then at750◦C for6h,under a stream of5vol.%H2in Ar.This treatment consolidated the olivine structure and enabled to complete the carbonization of residual organic matter.The VO2powder prepared by hydrothermal method was used as an active component of the counter electrode in the galvanostatic experiments in aqueous electrolyte solution.The details of the syn-thesis and electrochemical behavior of VO2are described elsewhere [54,55].The considerable stoichiometric excess of VO2was used,to provide that the LiFePO4/C composite only presents the main resis-tive element,i.e.,determines the behavior of the assembled cell on the whole.The XRD experiment was performed using Philips1050diffrac-tometer.The Cu K␣1,2radiation in15–70◦2Ârange,with0.05◦C step and2s exposition time was used.The carbon content in the composite was determined by its com-bustion in theflowing air atmosphere,by means of thermobalance TA SDT Model2090,at a heating rate of10◦C min−1.The morphology of the synthesized compounds was observed using the scanning electron microscope JSM-6610LV.For electrochemical investigations,the working electrode was made from LiFePO4/C composite(75%),carbon black-Vulcan XC72 (Cabot Corp.)(20%),poly(vinylidenefluoride)(PVDF)binder(5%) and a N-methyl-2-pyrrolidone solvent.The resulting suspension was homogenized in an ultrasonic bath and deposited on electron-ically conducting support.The electrode was dried at120◦C for 4h.Somewhat modified weight ratio,85:10:5,and the same drying procedure,were used to prepare VO2electrode.The non-aqueous electrolyte was1M LiClO4(Lithium Corpo-ration of America)dissolved in propylene carbonate(PC)(Fluka). Before than dissolved,LiClO4was dried over night at140◦C under vacuum.The aqueous electrolyte solution was saturated LiNO3solution.The cyclic voltammetry and complex impedance experiments were carried out only for aqueous electrolyte solutions,by means of the device Gamry PCI4/300Potentiostat/Galvanostat.The three electrode cell consisted of a working electrode,a wide platinum foil as a counter electrode,and a saturated calomel electrode(SCE) as a reference one.The experiments were carried out in air atmo-sphere.The impedance was measured in open-circuit conditions, at various stages of charging and discharging,within the frequency range10−2−105Hz,with7points per decade.Galvanostatic charging/discharging experiments were carried out in a two-electrode arrangement,by means of the battery testing device Arbin BT-2042,with two-terminal connectors only.In the galvanostatic tests in non-aqueous solution,working electrode was a2×2cm2platinum foil carrying2.3mg of compos-ite electrode material(1.5mg of olivine),while counter electrode was a2×2cm2lithium foil.The cell was assembled in an argon-filled glove box and cycled galvanostatically within a voltage range 2.1–4.2V.The galvanostatic tests in the aqueous electrolyte solution were carried out in a two-electrode arrangement,involving3mg of cathodic material,as a working electrode,and VO2in a multi-ple stoichiometric excess,as a counter electrode.According to its reversible potential of lithiation/delithiation reaction[55],VO2per-formed as an anode in this cell.The4cm2stainless steel plates were used as the current collectors for both positive and negative electrode.The cell was assembled in room atmosphere,and cycled within the voltage window between0.01and1.4V.3.Result and discussion3.1.The XRD,SEM and TG analysis of the LiFePO4/C compositeFig.1shows the XRD patterns of the composite LiFePO4/C pre-pared according to the procedure described in the Experimental Section.As visible,the diffractogram agrees completely with the one of pure LiFePO4olivine,found in the JCPDS card No.725-19. The narrow diffraction lines indicate complete crystallization and relatively large particle dimensions.On the basis of absence of diffraction lines of carbon,we may conclude that the carbonized product was amorphous one.Fig.2shows the SEM images of the LiFePO4/C composite at two different magnifications.Theflaky agglomerates,Fig.2left,with apparently smooth surface and low tap density,are due to a partial liquefaction and evolution of gas bubbles during gel-combustion procedure.These agglomerates consist of small LiFePO4/CFig.1.XRD patterns of LiFePO4/C composite in comparison to standard crystallo-graphic data.250M.Vujkovi´c et al./Electrochimica Acta 92 (2013) 248–256Fig.2.SEM images of LiFePO 4/C composite at two different magnification,20000×and 100000×.composite particles visible better at higher magnification,Fig.2,ly at the magnification of 100,000×,one may see that the size of majority of composite particles was in the range 50–100nm.The mean particle diameter,2r,as per SEM microphotograph amounted to 75nm.This analysis evidences that the gel-combustion method may provide nanodisprsed particles,desirable from the point of view of rate capability.For instance,Fey et al.[16]demonstrated that particle size reduction from 476to 205nm improved the rate capa-bility of LiFePO 4/C composite in organic electrolyte,illustrated by the increase of discharge capacity from 80mAh g −1to 140mAh g −1at discharging rate 1C.Also,carbon matrix prevented particles from agglomeration providing narrow size distribution,contrary to often used solid state reaction method of synthesis,when sintering of ini-tially nanometer sized particles caused the appearance of micron sized agglomerates [22].The SEM microphotograph (Fig.2)alone did not permit to rec-ognize carbon constituent of the LiFePO 4/C composite.However,carbonized product was evidenced,and its content measured,by means of thermogravimetry,as described elsewhere [9].The dia-gram of simultaneous thermogravimetry and differential thermal analysis (TG/DTA)of the LiFePO 4/C composite performed in air is presented in Fig.3.The process of moisture release,causing a slight mass loss of 1%,terminated at 150◦C.In the temperature range 350–500◦C carbon combustion took place,visible as a drop of the TG curve and an accompanying exothermic peak of the DTA curve.However,the early stage of olivine oxidation merged to some extent with the late stage of carbon combustion,and therefore,the minimum of the TG curve,appearing at nearly 500◦C,was not so low as to enable to read directly the carbon content.Fortunately,as proven by XRD analysis,the oxidation of LiFePO 4at tempera-ture exceeding 600◦C,yielded only Li 3Fe 2(PO 4)3and Fe 2O 3,whatFig.3.TGA/DTA curve of LiFePO 4/C under air flow at heating rate of 10C min−1.corresponded to the relative gain in mass of exactly 5.07%[9].Therefore,the weight percentage of carbonaceous fraction in the LiFePO 4/C composite was determined as equal to the difference between the TG plateaus at temperatures 300and 650◦C,aug-mented for 5.07%.According to this calculation the carbon fraction amounted to 13.4wt.%,and by means of this value,the electro-chemical parameters discussed in the next sections were correlated to pure LiFePO 4.Specific surface area of LiFePO 4,required for the measurement of diffusion constant,was determined from SEM image (Fig.2).Assuming a spherical particle shape and accepting mean particle radius r =37.5nm,the specific surface area was estimated on the basis of equation [17,22,45,46]:S =3rd(1)where the bulk density d =3.6g cm −3was used .This calculation resulted in the value S =22.2m 2g −1.In this calculation the contri-bution of carbon to the mean particle radius was ignored,however the error introduced in such way is more acceptable than the error which may arise if standard BET method were applied to the com-posite with significant carbon ly,due to a usually very developed surface area of carbon,the measured specific sur-face may exceed many times the actual surface area of LiFePO 4.3.2.Electrochemical measurements3.2.1.Non-aqueous electrolyte solutionIn order to compare the behavior of the synthesized LiFePO 4/C composite to the existing literature data,available predominantly for non-aqueous solutions,a brief test was performed in non-aqueous 1M LiClO 4+propylene carbonate solution by galvano-static experiments only.The results for the rates C/10,C/3and C,within the voltage limits 2.1–4.2V,were presented in Fig.4.The polarizability of the lithium electrode was estimated on the basis of the study by Churikov [56–67],who measured the current–voltage curves of pure lithium electrode in LiClO 4/propylene carbon-ate solutions at various temperatures.To the highest rate of 1C =170mA g −1in nonaqueous electrolyte,the corresponding cur-rent amounted to 0.25mA,which was equal to the current density of 0.064mA cm −2through the Li counter electrode.According to Fig.2in Ref.[67],for room temperature,the corresponding over-voltage amounted to only 6mV.Since lithium electrode is thus practically non-polarizable in this system,the voltages presented on the ordinate of the left diagram are the potentials of the olivine electrode expressed versus Li/Li +reference electrode.The clear charge and discharge plateaus at about 3.49V and 3.40V,respec-tively,correspond to the LiFePO 4 FePO 4phase equilibria [5].At discharging rate of C/10,the initial discharge capacity,within the limits of experimental error,was close to a full theoreticalM.Vujkovi´c et al./Electrochimica Acta 92 (2013) 248–256251Fig.4.The initial charge/discharge curves (a)and cyclic performance (b)of LiFePO 4/C composite in 1M LiClO 4+PC at different rates within a common cut-off voltage of2.1–4.2V.Fig.5.Charge/discharge profile and corresponding cyclic behavior of LiFePO 4/C in 1M LiClO 4+PC at the rate of 1C.capacity of LiFePO 4(170mAh g −1).This value is higher than that for LiFePO 4/C composite obtained by glycine [19],malonic acid [14]and adipic acid/ball milling [15]assisted methods.As usual,the discharge capacity decreased with increasing discharging rate (Fig.4b),and amounted to 127mAh g −1at C/3,and 109mAh g −1at 1C.For practical application of Li-ion batteries,a satisfactory rate capability and long cycle life are of primary importance.The charge/discharge profiles and dependence of capacity on the cycle number at the rate 1C are presented in Fig.5.The capacity was almost independent on the number of cycles,similarly to theearlier reports by Fey et al.[37–39].For comparison,Kalaiselvi et al.[19],by a glycine assisted gel-combustion procedure,with an additional amount (2wt.%)of carbon black,produced a similar nanoporous LiFePO 4/C composite displaying somewhat poorer per-formance,i.e.,smaller discharge capacity of 160mAh g −1at smaller discharging rate of C/20.On the other hand,better rate capability of LiFePO 4/C com-posite,containing only 1.1–1.8wt.%of carbon,in a non-aqueous solution,was reported by Liu et al.[21].For instance they mea-sured 160mAh g −1at the rate 1C,and 110at even 30C [21].This may be due to a thinner carbon layer around the LiFePO 4olivine particles.However the advantage of here applied thicker carbon layer exposed itself in aqueous electrolyte solutions,as described in the next section.3.2.2.Aqueous electrolyte solution3.2.2.1.Cyclic voltammetry.By the cyclic voltammetry method (CV)the electrochemical behavior of LiFePO 4/C composite in satu-rated aqueous LiNO 3solution was preliminary tested in the voltage range 0.4–1V versus SCE.The cyclic voltammograms are pre-sented in Fig.6.The highest scan rate of 100mV s −1,tolerated by this material,was much higher than the ones (0.01–5mV s −1)used in previous studies in both organic [13,24,25]and aqueous electrolyte solutions [47,48].Since one deals here with the thin layer solid redox electrode,limited in both charge consumption and diffusion length,the voltammogram is more complicated for interpretation comparing with the classic case of electroactive species in a liquid solution.A sharp,almost linear rise of current upon achieving reversible potential,with overlapped rising parts at various scan rates,similar to ones reported elsewhere [21,25],resembles closely the voltammogram of anodic dissolution ofaFig.6.Cyclic voltammograms of LiFePO 4/C in saturated LiNO 3aqueous electrolyte with a scan rate of 1mV s −1(left)and at various scan rates in the range 1–100mV s −1.252M.Vujkovi´c et al./Electrochimica Acta 92 (2013) 248–256Fig.7.Anodic and cathodic peak current versus square root of scan rate forLiFePO 4/C composite in aqueous LiNO 3electrolyte solution.thin metal layer [56],which proceeds under constant reactant activity.Since the solid/solid phase transitions LiFePO 4 FePO 4accompanies the redox processes in this system [5,8,57,58],the positive scan of the voltammograms depict the phase transition of LiFePO 4to FePO 4,while the negative scan depicts the phase transi-tion FePO 4to LiFePO 4.As shown by Srinivasan et al.[5],LiFePO 4may be exhausted by Li not more than 5mol.%before to trans-form into FePO 4,while FePO 4may consume no more than 5%Li before to transform into LiFePO 4,i.e.cyclic voltammetry exper-iments proceeds under condition of almost constant activity of the electroactive species.Although these aspects of the Li inser-tion/deinsertion process do not fit the processes at metal/liquid electrolyte boundary implied by Randles–Sevcik equation:i p =0.4463F RT1/2C v 1/2AD 1/2(2)this equation was frequently used to estimate apparent diffusion coefficient in Li insertion processes [5,17,21,46,59].To obtain peak current,i p ,in amperes,the concentration of lithium,C =C Li ,should be in mol cm −3,the real surface area exposed to the electrolyte in cm 2,chemical diffusion coefficient of lithium through the solid phase,D =D Li ,in cm 2s −1,and sweep rate,v ,in V s −1.The Eq.(2)pre-dicts the dependence of the peak height on the square root of sweep rate to be linear,as found often in Li-ion intercalation processes [17,21,25,59,60].This condition is fulfilled in this case too,as shown in Fig.7.The average value of C Li may be estimated as a reciprocal value of molar volume of LiFePO 4(V M =44.11cm 3mol −1),hence C Li =2.27×10⁻²mol cm −3.The determination of the actual surface area of olivine is a more difficult task,due to the presence of carbon in the LiFePO 4/C ly,classical BET method of sur-face area measurement may lead to a significantly overestimated value,since carbon surface may be very developed and participate predominantly in the measured value [15].Thus the authors in this field usually calculated specific surface area by means of Eq.(1),using mean particle radius determined by means of electron microscopy [17,22,45,46].Using S =22.2m 2g −1determined by means of Eq.(1),and an actual mass of the electroactive substance applied to the elec-trode surface (0.001305g),the actual electrode surface area was calculated to amount to A =290cm 2.This value introduced in Randles–Sevcik equation yielded D Li ∼0.8×10⁻¹⁴cm 2s −1.From the aspect of capacity retention,the insolubility of olivine in aqueous solutions is advantageous compared to the vanadia-based Li-ion intercalation materials,such as Li 1.2V 3O 8[61],LiV 3O 8[62]and V 2O 5[63],the solubility of which in LiNO 3solution was perceivable through the yellowish solutioncoloration.Fig.8.The Nyquist plots of LiFePO 4/C composite in aqueous LiNO 3solution at var-ious stages of delithiation;inset:enlarged high-frequency region.3.2.2.2.Impedance measurements.Figs.8and 9present the Nyquist plots of the LiFePO 4/C composite in aqueous LiNO 3solution at various open circuit potentials (OCV),during delithiation (anodic sweep,Fig.8)and during lithiation (cathodic sweep,Fig.9).The delithiated phase,observed at OCV =1V,as well as the lithi-ated phase,observed at OCV =0V,in the low-frequency region (f <100Hz)tend to behave like a capacitor,characteristic of a surface thin-layered redox material with reflective phase bound-ary conditions [64].At the OCV not too far from the reversible one (0.42V during delithiation,0.308V during lithiation),where both LiFePO 4and FePO 4phase may be present,within the whole 10−2–105Hz frequency range,the reaction behaves as a reversible one (i.e.shows the impedance of almost purely Warburg type).The insets in Figs.8and 9present the enlarged parts of the impedance diagram in the region of high frequencies,where one may observe a semicircle,the diameter of which corresponds theoretically to the charge transfer resistance.As visible,the change of open circuit potential between 0and 1V,in spite of the phase transition,does not cause significant change in charge transfer resistance.The small charge transfer resistance obtained with the carbon participation of 13.4%,being less than 1 ,is the smallest one reported thus far for olivine based materials.This finding agrees with the trend found by Zhao et al.[27],that the charge transfer resistance scaleddownFig.9.The Nyquist plots of LiFePO 4/C composite in aqueous LiNO 3solution at var-ious stages of lithiation;inset:enlarged high-frequency region.M.Vujkovi´c et al./Electrochimica Acta 92 (2013) 248–256253Fig.10.The dependence Z Re vs.ω−1/2during lithiation at 0.308V (top)and delithi-ation at 0.42V (down)in the frequency range 72–2.68Hz.to 1000,400and 150 when the amount of in situ formed carbon in the LiFePO 4/C composite increased in the range 1,2.8and 4.8%.For OCV corresponding to the cathodic (0.42V)and anodic (0.308V)peak maxima,the Warburg constant W was calculated from the dependence [21]:Z Re =R e +R ct + W ω−1/2(3)In the frequency range 2.7–72Hz,almost purely Warburg impedance was found to hold (i.e.the slope of the Nyquist plot very close to 45degrees was found).At the potential of cathodic current maximum (0.42V),from Fig.10, W was determined to amount to 7.96 s −1/2.At the potential of anodic maxima,0.308V, W was determined to amount to 9.07 s −1/2.In the published literature,for the determination of diffusion coefficient on the basis of impedance measurements,the following equation was often used [66,68,69]:D =0.5V M AF W ıE ıx2(4)where V M is molar volume of olivine,44.1cm 3, W is Warburg con-stant and ıE /ıx is the slope of the dependence of electrode potential on the molar fraction of Li (x )for given value of x .However,the potentials of CV maxima in the here studied case correspond to the x range of two-phase equilibrium,where for an accurate deter-mination of ıE /ıx a strong control of perturbed region of sample particles is required [69],and thus the determination of diffusion coefficients was omitted.3.2.2.3.Galvanostatic measurements.The galvanostatic measure-ments of LiFePO 4/C in saturated LiNO 3aqueous solution were performed in a two-electrode arrangement using hydrother-mally synthesized VO 2[55]as the active material of thecounterFig.11.Capacity versus cycle number and charge/discharge profiles (inset)for thecell consisting of LiFePO 4/C composite as cathode,and VO 2in large excess as anode,in saturated LiNO 3aqueous electrolyte observed at rate C/3.electrode.Preliminary cyclovoltammetric tests of VO 2in saturated LiNO 3solution at the sweep rate 10mV s −1,evidenced excellent cyclability and stable capacity of about 160mAh g −1during at least 50cycles.The voltage applied to the two-electrode cell was cycled within the limits 0and 1.4V.Due to a significant stoichiometric excess of VO 2over LiFePO 4/C composite (5:1)the actual voltage may be considered to be the potential versus reference VO 2/Li x VO 2electrode.Fig.11shows the dependence of the discharging Coulombic capacity of the LiFePO 4/C composite on the number of galvano-static cycles at discharging rate C/3,as well as (in the inset)the voltage vs.charging/discharging degree for 1st,2nd and 50th cycle.The charge/discharge curves do not change substantially in shape upon cycling,indicating stable capacity.For an aqueous solution,a surprisingly high initial discharge capacity of 106mAh g −1and low capacity fade of only 6%after 50charge/discharge cycles were evidenced.This behavior is admirable in comparison to other elec-trode materials in aqueous media reported in literature (LiTi 2(PO 4)3[42],LiV 3O 8[57]),and probably enabled by a higher thermody-namic stability of olivine structure [1].Fig.12presents the results of cyclic galvanostatic investigations of LiFePO 4/C composite in aqueous LiNO 3solution at various dis-charging rates.The charging/discharging rate was initially C/3for 80cycles and then was increased stepwise up to 3C.ThecapacityFig.12.Cyclic performance of LiFePO 4/C in saturated LiNO 3aqueous electrolyte at different charging/discharging rates.。
第43 卷第 4 期2024 年4 月Vol.43 No.4532~540分析测试学报FENXI CESHI XUEBAO(Journal of Instrumental Analysis)基于木质素-有机黏土复合水凝胶的固相萃取-SERS 联用技术用于变压器油中微量1,2,3-苯并三氮唑的现场分析刘叶1,余东1,廖思杰1,沈爱国2,何治柯1*,韩方源3*(1.武汉大学化学与分子科学学院,湖北武汉430072;2.武汉纺织大学生物工程与健康学院,湖北武汉430200;3.广西电网有限责任公司电力科学研究院,广西电力装备智能控制与运维重点实验室,广西南宁 530023)摘要:该文以脱碱木质素(DAL)和硅藻土(DE)为原料,通过加入2.5%丙烯酸(AA)、0.75%过硫酸铵(APS)和0.25% N’N-亚甲基双丙烯酰胺(MBA),基于自由基聚合法制备了DAL/DE水凝胶。
利用高效液相色谱法考察了水凝胶对变压器油中1,2,3-苯并三氮唑(BTA)的吸附性能,随后使用表面增强拉曼散射(SERS)辅以固相萃取技术现场检测了变压器油中的BTA。
研究结果表明,在0.6 g DAL/DE水凝胶为固相萃取填料,水为活化剂,BTA变压器油样稀释1倍,洗脱剂为1 mL乙酸的条件下,BTA在776 cm-1处的峰强于1 ~ 500mg/kg范围内与其含量呈良好的线性关系,检出限低至0.28 mg/kg。
关键词:变压器油;1,2,3-苯并三氮唑;木质素;水凝胶;固相萃取;表面增强拉曼散射(SERS)中图分类号:O657.3;U473.7文献标识码:A 文章编号:1004-4957(2024)04-0532-09Solid Phase Extraction-SERS Technique for Field Analysis of Trace 1,2,3-Benzotriazole in Transformer Oil Based on Lignin-Organoclay Composite HydrogelLIU Ye1,YU Dong1,LIAO Si-jie1,SHEN Ai-guo2,HE Zhi-ke1*,HAN Fang-yuan3*(1.College of Chemistry and Molecular Sciences,Wuhan University,Wuhan 430072,China;2.College ofBioengineering and Health,Wuhan Textile University,Wuhan 430200,China;3.Guangxi Key Laboratory of Intelligent Control and Maintenance of Power Equipment,Electric Power Research Institute of GuangxiPower Grid Co.,Ltd.,Nanning 530023,China)Abstract:Simple and rapid sample pretreatment technology is needed for the surface-enhanced Ra⁃man scattering(SERS) detection of trace organic components in transformer oil.In this paper,the dealkaline lignin/diatomite(DAL/DE)hydrogel was prepared by free radical polymerization using dealkaline lignin(DAL)and diatomite(DE)as raw materials,adding 2.5%acrylic acid(AA),0.75% ammonium persulphate(APS) and 0.25% N’N-methylene bisacrylamide(MBA). The adsorp⁃tion propertiesof hydrogel to 1,2,3-benzotriazole(BTA)in transformer oil were investigated by high-performance liquid chromatography. Then SERS combined with solid phase extraction was used to detect BTA in transformer oil. The results showed that 0.6 g DAL/DE hydrogel as solid phase ex⁃traction filler water as activator,and the transformer oil sample of BTA with 1-fold dilution,the elu⁃ent was 1 mL acetic acid. In the content range of 1-500 mg/kg BTA,the peak strength at 776 cm-1 shows a good linear relationship with the content of BTA,and the detection limit was as low as 0.28 mg/kg.Key words:transformer oil;1,2,3-benzotriazole;lignin;hydrogel;solid phase extraction;surface-enhanced Raman spectroscopy硫化铜沉积加速绝缘油老化是引起变压器频繁故障的重要原因之一。
化学固砂剂的制备及性能评价发布时间:2021-07-12T15:58:51.087Z 来源:《科学与技术》2021年8期作者:张喜玲[导读] 为解决春光油田常采井细粉砂出砂严重的问题,研制了适应春光油藏储层的低温固化泡沫固砂体系。
张喜玲河南油田分公司石油工程技术研究院河南南阳 473132摘要:为解决春光油田常采井细粉砂出砂严重的问题,研制了适应春光油藏储层的低温固化泡沫固砂体系。
通过优选高活性树脂新材料,实现了35℃低温下的高强度固结,研发温和型固化剂,实现单液法施工和地层可靠固结,从树脂泡沫防砂体系性能入手,通过合成树脂、偶联剂、稳泡剂、气液比等的优化,形成了低密度、高渗透和高强度的树脂泡沫防砂体系,体系密度为0.54~0.62g/cm3,固结体抗压强度达到6.12MPa,渗透率达到1.76μm2,实现了高强度和渗透性的良好结合。
关键词:固砂剂,树脂,泡沫,固结体Preparation and Performance Evaluation of Sand Consolidation AgentZhang xilingResearch Institute of Petroleum Engineering and Technology,Henan Oilfield Branch,Henan Nanyang 473132Abstract:In order to solve the production problem of fine silt sand, starting from the performance of resin foam system for sand control, through the optimization of synthetic resin, coupling agent, foaming agent, gas-liquid ratio and so on, a resin foam system for sand control is developed that with low density, high permeability and high strength.The density of the system is 0.54g/cm3, the consolidation body strength is 6.12MPa and its permeability is 1.76μm2.Keywords:Sand consolidation agent,Resin,Foam,Consolidation body1前言春光油田油藏埋藏浅726-1802m,一般在900-1400m,平均孔隙度为30%以上,渗透率在1000×10-3um2以上,原油粘度为35.34mPa.s。
梳状聚合物因受到聚合物主链和侧链的影响[1-3],其热性能、结晶行为不同于传统线性分子[4-5]。
通过控制聚合物主链的刚性、侧链接枝度和长度以及极性态,可实现疏水或亲水转变、刺激响应性、多级组装等功能特征[1,6]。
梳状聚合物的主链类型、侧链长度和主侧链键接方式对其链堆积方式和侧链结晶有很大的影响。
研究者们已经制备了刚性、半刚性和柔性主链的梳状聚合正十八烷基化聚(苯乙烯-co-马来酰亚胺)梳状聚合物制备及表征石海峰,王延鹏(天津工业大学材料科学与工程学院,天津300387)摘要:为探究由聚(苯乙烯-co-马来酸酐)(SMA )和正十八烷基胺(C 18NH 2)所构成的梳状聚合物主侧链间不同键接方式对其结构和性能的影响,以SMA 为主链,以C 18NH 2为侧链,通过酰胺反应(开环反应)和酰亚胺反应(闭环反应),制备了十八烷基化聚(苯乙烯-co-马来酸酐)(SMAC18N )和聚(苯乙烯-co-马来酰亚胺)(SMIC18N )梳状聚合物;通过傅里叶红外光谱(FTIR )、X 射线衍射(XRD )、差示扫描量热分析(DSC )、热重分析(TGA )等方法对比研究了SMAC18N 和SMIC18N 梳状聚合物的热行为和结晶行为。
结果表明:SMAC18N 出现明显侧链结晶行为,而SMIC18N 未出现热行为和结晶现象;SMIC18N 的热失重温度为370益,而SMAC18N 为202益;SMIC18N 表现出明显疏水能力,疏水角为101.9毅。
这说明主侧链键接方式对侧链烷基有序堆积结构和热性能有显著影响。
关键词:聚(苯乙烯-co-马来酸酐)(SMA );正十八烷基胺;梳状聚合物;热性能;结晶行为中图分类号:TB325.2文献标志码:A 文章编号:员远苑员原园圆源载(圆园22)园1原园园34原05Preparation and characterization of octadecylated poly (styrene-co-maleimide )comb-like polymerSHI Hai-feng ,WANG Yan-peng(School of Material Science and Engineering ,Tiangong University ,Tianjin 300387,China )Abstract :In order to explore the influence of different bonding methods between the main side chains of comb -likepolymers composed of poly渊styrene -co -maleic anhydride冤渊SMA冤and n -octadecylamine渊C 18NH 2冤on its structure and performance袁octadecylated poly渊styrene -co -maleic anhydride冤渊SMAC18N冤and poly渊styrene -co -maleimi -de冤渊SMIC18N冤comb -like polymers were prepared via amide reaction渊ring opening reaction冤and imide reaction 渊ring -closing reaction冤with SMA as the main chain and C 18NH 2as the side chain.The thermal and crystallization behavior of SMAC18N and SMIC18N comb -like polymers were compared and studied by Fourier temperature infrared spectroscopy渊FTIR冤袁X -ray diffraction渊XRD冤袁differential scanning calorimetry渊DSC冤袁thermogravi -metric analysis 渊TGA冤and other methods.The results showed that SMAC18N had obvious side chain crystalliza -tion behavior袁while SMIC18N had no thermal behavior and crystallization.The thermal weight loss temperature of SMIC18N was 370益袁while SMAC18N was 202益.SMIC18N showed obvious hydrophobic ability袁with a hydrophobic angle of 101.9毅.This showed that the main side chain bonding mode had a significant impact on theordered stacking structure and thermal properties of side chain alkyl groups.Key words :SMA曰octadecylamine曰comb -like polymer曰thermal properties曰crystallization behaviorDOI :10.3969/j.issn.1671-024x.2022.01.006第41卷第1期圆园22年2月Vol.41No.1February 2022天津工业大学学报允韵哉砸晕粤蕴韵云栽陨粤晕GONG 哉晕陨灾耘砸杂陨栽再收稿日期:2021-02-28基金项目:国家自然科学基金资助项目(21875163)通信作者:石海峰(1975—),男,博士,教授,博士生导师,主要研究方向为高分子结构化材料。
pickering emulsion 机制下载温馨提示:该文档是我店铺精心编制而成,希望大家下载以后,能够帮助大家解决实际的问题。
文档下载后可定制随意修改,请根据实际需要进行相应的调整和使用,谢谢!并且,本店铺为大家提供各种各样类型的实用资料,如教育随笔、日记赏析、句子摘抄、古诗大全、经典美文、话题作文、工作总结、词语解析、文案摘录、其他资料等等,如想了解不同资料格式和写法,敬请关注!Download tips: This document is carefully compiled by the editor. I hope that after you download them, they can help you solve practical problems. The document can be customized and modified after downloading, please adjust and use it according to actual needs, thank you!In addition, our shop provides you with various types of practical materials, such as educational essays, diary appreciation, sentence excerpts, ancient poems, classic articles, topic composition, work summary, word parsing, copy excerpts, other materials and so on, want to know different data formats and writing methods, please pay attention!稳定性好、界面活性低、可控性高——这些优点使得Pickering乳液机制备受科学界和工业界的青睐。
AMPS/DMAM/AA 共聚物固井降滤失剂的研究朱兵;聂育志;邱在磊;王浩任;陈红壮;马鹏【摘要】为解决固井降滤失剂普遍存在的抗温能力差、与其他外加剂配伍性欠佳以及综合性能差等问题,选用2丙烯酰胺基2甲基丙磺酸(AMPS)、N ,N 二甲基丙烯酰胺(DMAM)和丙烯酸(AA)为共聚单体,采用水溶液聚合法制得共聚物AMPS/DMAM/AA。
对共聚物AMPS/DMAM/AA的微观结构进行了分析,并对其性能进行了评价,结果表明:各单体都参与了聚合,共聚物分解温度为380℃;淡水基浆中该共聚物加量超过3%时,在温度不高于120℃时,可将滤失量控制在100 m L以内,且水泥浆初始稠度低,过渡时间短,稠化曲线线形良好,抗压强度适中,没有过度缓凝现象;饱和NaCl盐水基浆中该共聚物加量超过4%时,可将滤失量控制在80 mL以内。
这表明AM PS/DM AM/AA共聚物降滤失剂的抗温、抗盐能力强,与其他外加剂、尤其是高温缓凝剂配伍性好,以该共聚物为降滤失剂的水泥浆具有很好的综合性能。
%In order to improve the temperature‐resistance performance of some domestic fluid loss addi‐tives and to understand their poor compatibility with other additives as well as their comprehe nsive proper‐ties ,a cement fluid loss additive was synthesized using monomers acrylic acid (AA) ,2‐acrylamido‐2‐meth‐yl‐propane sulphonic acid (AMPS) and N ,N‐dimethylacrylamide(DMAM)through aqueous solution poly‐merization .The micro‐structural characterization of AMPS/DMAM/AA was analyzed and its performance was tested .The result showed that copolymerAMPS/DMAM/AA has the structure of all monomers and can resist high temperatures up to 380℃ .When the amount of AMPS/DMAM/AA wasmore than 3.0 % , the fil tration of fresh‐water cement slurry can be reduced to less than 100 mL .Moreover ,the cement slurry has excellent properties such as low initial consistency ,short transition time ,good thickening curve without far delayed solidification and appropriate compressible strength .When the amount of AM PS/DM AM/AA is more than 4.0 % ,the filtration of saturated NaCl cement slurry can be reduced to less than 80 mL .It showed that the fluid loss additive AMPS/DMAM/AA has excellent temperature‐resistance and salt‐toler‐ance and good compatibility with other additives ,especially with high temperature retarders .In addition , the cement slurry that has been prepared mainly from AMPS/DMAM/AA has excellent comprehensive properties .【期刊名称】《石油钻探技术》【年(卷),期】2014(000)006【总页数】5页(P40-44)【关键词】固井;水泥浆;降滤失剂;共聚物;水泥浆性能【作者】朱兵;聂育志;邱在磊;王浩任;陈红壮;马鹏【作者单位】中国石化石油工程技术研究院,北京 100101;中国石化石油工程技术研究院,北京 100101;中国石化石油工程技术研究院,北京 100101;中国石化石油工程技术研究院,北京 100101;中国石化石油工程技术研究院,北京 100101;中国石化石油工程技术研究院,北京 100101【正文语种】中文【中图分类】TE256+.6当前,国内固井用降滤失剂普遍存在抗温抗盐能力差、与其他外加剂配伍性差及综合性能差等问题[1-9]。
Vol. 35 No. 1功 能 高 分 子 学 报2022 年 2 月Journal of Functional Polymers93文章编号: 1008-9357(2022)01-0093-08DOI: 10.14133/ki.1008-9357.20210322002温度响应型酰腙可逆共价键水凝胶的制备及性能何 元1, 罗媛媛2, 刘 通1, 张银山1, 郭赞如1, 章家立1(1. 华东交通大学材料科学与工程学院,高分子材料与工程系,南昌 330013;2. 重庆市计量质量检测研究院,重庆 401120)摘 要: 首先,通过可逆加成-断裂转移(RAFT)聚合制备了丙烯酰胺(AM)、双丙酮丙烯酰胺(DAAM)和N-异丙基丙烯酰胺(NIPAM)的共聚物(PAM-co-PDAAM-co-PNIPAM);然后,使PAM-co-PDAAM-co-PNIPAM与己二酸二酰肼(ADH)反应后,得到了具有温度和pH双重响应性的水凝胶。
通过核磁共振氢谱(1H-NMR)和凝胶渗透色谱(GPC)、流变仪、扫描电镜(SEM)以及傅里叶变换红外光谱(FT-IR)对共聚物和水凝胶的结构和组成,以及水凝胶的温度和pH双重响应行为进行了研究。
研究表明,该水凝胶具有温度调控的自愈合性,对药物阿霉素(Dox)表现出pH和温度双重响应的可控释放行为。
关键词: 智能水凝胶;酰腙可逆共价键;自愈合;温度响应中图分类号: O633 文献标志码: APreparation and Properties of Temperature-Responsive HydrogelsBased on Acylhydrazone Reversible Covalent BondsAll Rights Reserved.HE Yuan1, LUO Yuanyuan2, LIU Tong1, ZHANG Yinshan1, GUO Zanru1, ZHANG Jiali1(1. Department of Polymer Materials and Engineering, School of Materials Science and Engineering, East China JiaotongUniversity, Nanchang 330013, China; 2. Chongqing Academy of Metrology andQuality Inspection, Chongqing 401120, China)Abstract: A series of PAM-co-PDAAM-co-PNIPAM copolymers were synthesized by reversible addition fracture transfer(RAFT) polymerization from acrylamide (AM), diacetone acrylamide (DAAM) and N-isopropylacrylamide (NIPAM). Theirstructure and composition were characterized by Nuclear Magnetic Resonance (NMR) and Gel Permeation Chromatography(GPC). Hydrogel with pH and temperature dual-response formed by the acyl hydrazone dynamic bonds between ketocarbonylin polymer and hydrazide in adipic dihydrazide (ADH). The dual-responsive behavior of hydrogels to temperature and pHwas researched by rheological measurement, Scanning Electron Microscope (SEM) and Fourier Transform Infrared (FT-IR)spectroscopy. At the same time, the hydrogel demonstrated temperature controlled self-healing properties. Besides, thehydrogels showed pH-and temperature-responsive controlled release behaviors for doxorubicin(Dox).Key words: smart gel; acylhydrazone dynamic covalent bond; self-healing; temperature response收稿日期: 2021-03-22基金项目: 国家自然科学基金(21802041,51563009,21865009);江西省杰出青年基金(20202ACBL214001)作者简介: 何 元(1994—),男,硕士,主要研究方向为功能高分子材料。
俎鹏姣, 董均阳, 李毅, 谢海姣, 张松伟, 李军, 胡丽天. S-N 型功能分子用作多功能添加剂的缓蚀及摩擦学行为研究[J]. 摩擦学学报(中英文), 2024, 44(4): 573−584. ZU Pengjiao, DONG Junyang, LI Yi, XIE Haijiao, ZHANG Songwei, LI Jun, HU Litian.Corrosion Inhibition and Tribological Behavior of S-N Functional Molecules as Multifunctional Additives[J]. Tribology, 2024,44(4): 573−584. DOI: 10.16078/j.tribology.2023018S-N 型功能分子用作多功能添加剂的缓蚀及摩擦学行为研究俎鹏姣1,2, 董均阳1,3, 李 毅1,3, 谢海姣4, 张松伟1,3*, 李 军2, 胡丽天1(1. 中国科学院兰州化学物理研究所 固体润滑国家重点实验室,甘肃 兰州 730000;2. 河北工业大学 理学院,天津 300401;3. 青岛市资源化学与新材料研究中心,山东 青岛 266071;4. 杭州研趣信息技术有限公司,浙江 杭州 310003)摘 要: 利用电化学、摩擦学试验和量子化学模拟等手段,研究了巯基甲基噻二唑(MMT)和二壬基萘磺酸(DNS)这2种功能分子作为缓蚀剂的缓蚀性能和作为极压抗磨添加剂的摩擦学性能及其作用机理. 电化学试验表明,DNS 分子的缓蚀能力较差,缓蚀效率为58.6%;MMT 分子表现出优异的缓蚀能力,缓蚀效率达93.3%. 摩擦学试验表明,DNS 作为添加剂时,油样的摩擦系数与PEG 基础油的摩擦系数相当,磨损量增大;MMT 作为添加剂时,油样的摩擦系数和磨损量较PEG 基础油明显降低,极压性能较基础油明显提高. 量子化学模拟结果表明,DNS 分子与钢表面具有更高的反应活性,因此作为极压抗磨和缓蚀添加剂,加剧了金属的腐蚀和磨损. 表面分析结果表明,DNS 分子润滑下的磨斑表面主要起到减摩作用的是铁的氧化物和FeSO 4等. MMT 分子润滑下的磨斑表面的摩擦产物为Fe 2(SO 4)3、FeS 2、铁的氧化物以及含氮有机物.关键词: 巯基甲基噻二唑; 抗腐蚀性能; 减摩抗磨性能; 极压性能中图分类号: TH117.1文献标志码: A文章编号: 1004-0595(2024)04–0573–12Corrosion Inhibition and Tribological Behavior of S-NFunctional Molecules as Multifunctional AdditivesZU Pengjiao 1,2, DONG Junyang 1,3, LI Yi 1,3, XIE Haijiao 4, ZHANG Songwei 1,3*, LI Jun 2, HU Litian1(1. State Key Laboratory of Solid Lubrication, Lanzhou Institute of Chemical Physics,Chinese Academy of Sciences, Gansu Lanzhou 730000, China;2. School of Science, Hebei University of Technology, Tianjin 300401, China;3. Qingdao Center of Resource Chemistry & New Materials, Shandong Qingdao 266071, China;4. Hangzhou Yanqu Information Technology Co, Ltd, Zhejiang Hangzhou 310003, China )Abstract : Through electrochemical experiments, friction tests and quantum chemical simulation, the corrosion inhibitionReceived 10 February 2023, revised 12 April 2023, accepted 13 April 2023, available online 17 April 2023.*Corresponding author. E-mail: ****************.cn, Tel: +86-931-4968833.This project was supported by the National Key Research and Development Program of China (2022YFB3809000), the National Natural Science Foundation of China (51975559) and the Cooperation Fund of Collaborative Innovation Alliance for Young Scientific and Technological Workers of Lanzhou Institute of Chemical Physics (HZJJ22-10).国家重点研发计划项目(2022YFB3809000)、国家自然科学基金项目(51975559)和兰州化物所青年科技工作者协同创新联盟合作基金项目(HZJJ22-10)资助.第 44 卷 第 4 期摩擦学学报(中英文)Vol 44 No 42024 年 4 月TribologyApr, 2024△G 0ads abilities as inhibitors in hydrochloric acid corrosive solution and tribological performance as additives inbase oil of mercaptomethylthiadiazole (MMT) and dinonylnaphthalenesulfonic acid (DNS) were investigated in this work. Results of electrochemical experiments showed that DNS molecule exhibited poor corrosion inhibition effect on the attack of corrosive solution against the mild steel surface. Then, the calculated maximum corrosion inhibition efficiency was 58.6%. MMT molecule formed a more complete adsorption film on the mild steel surface that the surface coverage was about 93.3%, effectively obstructingthe assault of aggressive solution tomild steel. The adsorption behavior of MMT molecule obeys Langmuir adsorption isotherm and Gibbs free energy was about −32 kJ/mol, indicating that the adsorption mode of MMT molecule involved a mixed adsorption manner with physisorption and chemisorption.Corrosion inhibition efficiency enhanced with the increase of the amountof inhibitor and the largest valuecould reach 93.3%, demonstrating that MMT molecule could suppress the corrosion process well. Results of friction tests exhibited that the friction coefficient under lubrication of DNS molecule was not changedobviously compared with that of the base oil, but the wear volumebecame huge. Surpisingly, the friction coefficientand wear volume of base oil wereremarkably reduced after the addition of MMT molecule. Analysis of SEM-EDS results indicated that the worn morphology was flat and smooth with some dark areas likely adsorbed molecule or tribo-film covered on the surface in the case of MMT molecule lubrication. It was further comfirmed by XPS results that there were tribo-chemical products(Fe 2(SO 4)3, FeS 2),oxide and nitrogen-containing degradation products with friction-reducing and anti-wear effect enshrouding on worn scar surface. It can be observed from SEM micrographs that the worn morphology under DNS lubrication was similiar with that of base oil. Combined with XPS results of DNS molecule lubrication, it could be inferred that oxide, FeSO 4existed on worn scar surface that played a role in friction-reducing. Moreover, extreme pressure experiments were also carried out under the load from 100~700 N. The outcomes suggested that the base oil sample exhibited poorextreme pressure property. As the addition of DNS molecule, extreme pressure performance was barely enhanced. It could bededuced that the molecule layer adsorbed on the metal surface was not enough compact so that the friction coefficient sharply rised causing lubrication failure. To our surprise, the addition of MMT moleculeimmensely improved the extreme pressure performance of base oil. The load capacity of MMT molecule as additive in base oil was up to 700 N and the friction coefficient can keep stable during the whole process. Therefore, MMT molecule can be treated as an effective inhibitor and extreme pressure anti-wear reagent.Key words : mercaptomethylthiadiazole; corrosion resistance property; friction-reducing and anti-wear performance;extreme pressure performance在工业技术飞速发展的过程中,金属腐蚀已成为全球性问题,涉及到各个国家生产生活等诸多方面[1].由腐蚀造成的材料劣化,设备使用寿命变短以及环境污染等是亟待解决的重要问题,使用有效的缓蚀剂能在很大程度上限制外部环境等对金属材料的侵蚀[2].摩擦和磨损是机械设备运行中常见的损耗现象,长此以往会造成巨大的经济损失和能源浪费[3]. 据相关统计,摩擦磨损消耗的能量约占全球消耗总能量的23%[4]. 因此,为了顺应节能减排的发展要求,发展兼具防腐蚀和润滑性能的添加剂是至关重要的[5].含氮元素的杂环化合物及其衍生物常常作为润滑油防锈[6]、抗氧化剂和抗腐蚀剂用于机械设备中,部分衍生物具备极佳的承载能力[7]. 另一方面,含O 、N 、S 和极性官能团的有机分子具有较强的吸附能力,能够形成完整致密的保护膜,对金属腐蚀具有很好的抑制作用[8]. 研究表明含酯基的二巯基噻二唑二聚物作为极压抗磨剂能够在金属表面形成吸附膜和摩擦化学反应膜,有效降低了摩擦系数和磨损量,同时大大改善了承载能力[9]. 磺酸醇胺离子液体作为水基润滑添加剂在多种摩擦副上起到稳定的减摩作用[10].1,3,4-噻二唑衍生物作为缓蚀剂在金属表面形成的化学吸附膜有效地抑制高氯酸对低碳钢的腐蚀[11]. 2-氨基-5-巯基-1,3,4-噻二唑缓蚀剂加入到盐酸腐蚀体系前后浸泡120 h ,结果表明2-氨基-5-巯基-1,3,4-噻二唑分子上的活性元素与金属表面形成的络合物较好地覆盖在金属表面,表现出优异的抗腐蚀能力,缓蚀效率高达99%[12].聚乙二醇(PEG)因环保、可降解等优良特性在压缩机油、金属加工液、制动液和齿轮油中已有广泛应用[13]. 近年来,多种新型添加剂在PEG 润滑油中显著提高了其润滑性能,有利于其在工业中的进一步应用[14]. 其中,巯基甲基噻二唑(MMT)和二壬基萘磺酸(DNS)功能分子对PEG 润滑油的摩擦学性能的影响值得研究,为新型添加剂的结构设计与应用提供参考依据.574摩擦学学报(中英文)第 44 卷因此,在本工作中,作者将利用电化学试验研究巯基甲基噻二唑(MMT)和二壬基萘磺酸(DNS)在稀盐酸腐蚀体系对金属的缓蚀能力,然后将这2种化合物作为基础油(PEG)添加剂在钢-钢摩擦副上考察其减摩抗磨和极压性能. 研究结果有望对极压抗磨防腐型高性能多功能添加剂的设计研究提供新的设计思路与数据支持.1 试验与理论计算1.1 试验材料2-巯基-5-甲基-1,3,4-噻二唑(MMT)和二壬基萘磺酸(DNS)均购于上海阿拉丁公司,基础油聚乙二醇(PEG 200)购于广东西陇化工股份有限公司,3种化合物的分子式如图1所示. 2种化合物分子以及基础油聚乙二醇的典型理化性能列于表1中.H OOHnPEGSO3HC9H19C9H19DNSN NSMMTSHFig. 1 The molecular structures of PEG、DNS and MMT图 1 PEG、DNS和MMT的分子结构式表 1 PFG及DNS和MMT的典型理化性能Table 1 Typicalphysical and chemical properties ofPEG、DNS and MMTCompound Meltingpoint/℃Kinematic viscosity/(mm2/s)Viscosityindex40 ℃100 ℃PEG−23.74 4.92135DNS−28.57−−MMT188.1−−−1.2 电化学试验所用的电化学工作站型号为Gamry Reference 3000,在试验中使用的是参比电极(饱和甘汞电极),辅助电极(铂电极)及工作电极(低碳钢)的三电极体系. 所用低碳钢的牌号为Q235. 电解液选用的是1 mol/L HCl和体积分数75%乙醇水溶液,缓蚀剂MMT和DNS的添加量分别为1.0、1.5、3.0和5.0 mmol/L. 在测试之前,首先在开路电位下测试1 h,使电极表面处于稳定状态. 然后在开路电位下开始电化学阻抗谱图的测试,其中,正弦波幅值设置为10 mV,从高频105 Hz到低频10−1 Hz 完成扫描. 动电位极化曲线测试是从工作电极开路电位的−350 mV扫描到350 mV,扫描速率为0.5 mV/s. 工作电极与电解液的接触面积为1 cm2,试验温度为室温.从电化学工作站配套的Gamry Echem,Analyst软件中得到相关的电化学阻抗谱图和动电位极化曲线的电化学参数. 采用扫描电子显微镜(SEM-EDS)观察工作电极表面的表面腐蚀形貌和元素含量.1.3 摩擦学试验将2种功能分子MMT和DNS作为基础油聚乙二醇(PEG200)添加剂进行摩擦学试验,所用的试验机是Optimol公司的SRV-V微动摩擦磨损试验机. MMT和DNS的质量分数为0.1%、0.5%和1.0%. 测试试验条件是载荷100 N,室温,频率25 Hz,振幅1 mm,测试时间30 min. 所用上试球为GCr15轴承钢球(Φ10 mm),下试样为GCr15轴承钢块(Φ24 mm×7.9 mm). 此外利用SRV-V试验机,对比研究了MMT和DNS的极压性能,在室温,频率25 Hz,振幅1 mm的条件下,测试的载荷范围为100~700 N,每次增加100 N,每个载荷等级持续时间为5 min.摩擦试验结束后,利用表面分析仪器—非接触式三维轮廓仪观察测试各磨损表面的磨损量. 采用JSM-5600LV扫描电子显微镜(SEM)对各磨损表面进行拍摄,通过X射线能谱仪(EDS)测试磨斑中的各元素含量. 利用Thermo Scientific K-Alpha+型多功能X射线光电子能谱仪(XPS)表征金属磨损表面元素的化学组分,选用Al-Ka激发源,束斑大小400 μm,通过能量为100 eV,结合能测量精度为0.5%,将污染碳中的C 1s (284.80 eV)作为内标.1.4 理论计算采用高斯16软件包对上述2个分子结构进行优化,采用的是B3LYP泛函和6-311G (d)基组[15-16],所讨论的优化结构具有无虚频率的局部极小值特征. 用Grimme提出的DFT-D3BJ方法校正色散作用[17].2 结果与讨论2.1 动电位极化曲线通过分析动电位极化曲线(Tafel)可以获得阴阳极第 4 期俎鹏姣, 等: S-N型功能分子用作多功能添加剂的缓蚀及摩擦学行为研究575反应的动力学特征,由电化学工作站记录的动电位极化曲线如图2所示. 从图2(a)阴极分支的极化曲线来看,加入MMT 缓蚀剂后,电流密度明显降低,这可能与缓蚀剂分子吸附在低碳钢表面所形成的吸附膜有关;且几乎与空白溶液的阴极分支平行,说明加入缓蚀剂后没有改变阴极的还原反应机制[18]. 极化曲线阳极分支的电流密度随着正电位的增加而增大,这表明工作电极的阳极发生溶解导致缓蚀剂分子的脱附,致使腐蚀溶液攻击低碳钢表面,从而使电流密度增大[19].在腐蚀电位E corr 为300 mV 左右时,电流密度增加缓慢,曲线出现了近似平台的趋势,可能是因为缓蚀剂分子的吸附或腐蚀产物覆盖在电极表面. 腐蚀电位的位移大约为39.1 mV ,小于85 mV ,说明MMT 缓蚀剂是1种混合类型的缓蚀剂[20]. 从图2(b)中可以看出加入DNS 缓蚀剂后阴阳极电流密度均略有下降,阴极分支与空白溶液互相平行,腐蚀电位位移小于85 mV ,表明DNS 缓蚀剂同样没有改变阴极的还原反应机制且是混合类型的缓蚀剂.−0.8i /(A /c m 2)10−110−2E /V10−310−410−510−610−7−0.6−0.4−0.20.0−0.8i /(A /c m 2)10−110−2E /V10−310−410−510−610−7−0.6−0.4−0.20.0Blank1.0 mmol/L MMT 1.5 mmol/L MMT 3.0 mmol/L MMT 5.0 mmol/L MMTBlank1.0 mmol/L DNS 1.5 mmol/L DNS 3.0 mmol/L DNS 5.0 mmol/L DNS (a)(b)Fig. 2 Potentiodynamic polarization curves for mild steel in dilute hydrochloric acid corrosion system图 2 低碳钢在稀盐酸腐蚀体系下的动电位极化曲线图利用分析软件得到的电化学参数如腐蚀电位E corr ,腐蚀电流密度i corr ,阴极斜率−βc ,阳极斜率βa ,表面覆盖率θ,缓蚀效率η列于表2中. 从表2中可以看出加入MMT 缓蚀剂后,腐蚀电流密度显著降低,由腐蚀电流密度可计算出加入缓蚀剂后的缓蚀效率和表面覆盖率,如公式(1)所示.ηTafel =i0corr−i corri0corr×100%θTafel =ηTafel 100%(1)i 0corr 其中,是未加入缓蚀剂的电流密度,i corr 是添加缓蚀剂后的电解液的电流密度. 经计算,MMT 缓蚀剂的最高缓蚀效率可达93.3%,表面覆盖率为0.933. DNS 缓蚀剂的最高缓蚀效率为58.6%,表面覆盖率为0.586.说明MMT 缓蚀剂在电极表面形成了更加致密完整的吸附膜,可以更好地减缓腐蚀. 据文献报道,无规律的阴阳极斜率表明工作电极表面的缓蚀机理不止1种,可能是缓蚀剂分子的吸附,阴离子的参与或者两者的协同作用[21].2.2 电化学阻抗谱图图3所示为不同浓度MMT 和DNS 缓蚀剂的电化表 2 由动电位极化曲线获到的电化学参数Table 2 Several electrochemical parameters acquired from Tafel curvesMedium C /(mmol/L)E corr /mV I corr /(μA/cm 2)−βc /(mV/dec)βa /(mV/dec)θηTafel /%HCl−−441.51 444.0401.6404.0−−DNS1.0−449.01 288.0348.8269.20.10810.8%1.5−454.91 126.0364.1272.50.22022.0%3.0−443.8893.4341.0296.50.38138.1%5.0−402.4596.4285.9280.50.58658.6%MMT1.0−482.1287.9246.1333.90.80080.0%1.5−472.3178.1216.3389.70.87787.7%3.0−477.6106.7195.5359.90.92692.6%5.0−452.795.8202.6349.90.93393.3%576摩擦学学报(中英文)第 44 卷学阻抗图(EIS),从图3中可以获得工作电极的表面性质和缓蚀剂分子的吸附行为以及腐蚀过程的相关信息. 图3中不完整的容抗弧是由于电极表面的粗糙度和不均一性造成的,电极表面的腐蚀过程主要是由电荷转移过程所主导[22]. 图3(a)表明加入MMT 缓蚀剂后的容抗弧半径与空白溶液的相比明显增大,且随着缓蚀剂浓度的增加而增大,这表明该缓蚀剂吸附在金属表面形成较为完整稳定的保护膜,有效地阻挡了腐蚀溶液与金属表面的直接接触. 从图3(b)中可以看出加入DNS 缓蚀剂后,低浓度下的容抗弧半径无明显改变,高浓度5 mmol/L 下有所增大,且出现了Warburg 扩散阻抗.50−Z i m a g /(Ω·c m 2)400350Z real /(Ω·cm 2)3002502001501000501001502002503003504000−Z i m a g /(Ω·c m 2)100Z real /(Ω·cm 2)−Z /(Ω·cm )80604002020406080100(a)(b)Blank1.0 mmol/L MMT 1.5 mmol/L MMT 3.0 mmol/L MMT 5.0 mmol/L MMT Fitted curves5040302010010203040500−Z /(Ω·c m )Blank1.0 mmol/L DNS 1.5 mmol/L DNS 3.0 mmol/L DNS 5.0 mmol/L DNS Fitted curvesBlank1.0 mmol/L DNS 1.5 mmol/L DNS Fitted curvesFig. 3 Electrochemical impedance spectroscopy for mild steel in dilute hydrochloric acid corrosion system图 3 低碳钢在稀盐酸腐蚀体系下的电化学阻抗谱图利用等效电路对腐蚀过程进行模拟,所用的电路模型如图4所示,R s 为溶液电阻,CPE 1代表常相位角元件,常常用CPE 1代替双电层电容(C dl ),CPE 1的阻抗可以通过式(2)求得[23]:Z CPE 1=1Y 0(j ω)n(2)其中,Y 0是CPE 常数,j 是虚数单位,ω是角频率,n 是与表面粗造度有关的相位移. C dl 可由公式(3)计算得出:C dl =Y 01n R ct 1n −1(3)其中,R ct 代表电荷转移电阻,θ是表面覆盖率. 由电荷转移电阻可计算出缓蚀效率,如下式(4)所示:ηEIS =R ct −R 0ctR ct ×100%θEIS =ηEIS100%(4)R 0ct 其中,R ct 是加入缓蚀剂后的电荷转移电阻,代表的是空白溶液的电荷转移电阻. CPE 2代表膜电容,R f 为膜电阻,w 为扩散阻抗. 将所得的电化学参数列于表3中. 由表3可以看出,加入MMT 缓蚀剂后,电荷转移电阻的大小显著增加,表面覆盖率θ可达0.934,说明该分子在金属表面形成的是1层较为完整致密的吸附膜,其缓蚀效率高达93.4%. 加入DNS 缓蚀剂后电荷转移电阻并无明显增加,表面覆盖率θ为0.626,缓蚀效率为62.6%. MMT 缓蚀剂的缓蚀效率远远大于DNS 的缓蚀效率,与动电位极化曲线的结果一致,因此MMT 分子是1种更为高效的缓蚀剂.2.3 腐蚀表面分析电化学试验结束之后,对添加量为5 mmol/L 的MMT 和DNS 缓蚀剂的工作电极的表面形貌拍摄SEM照片,如图5所示. 从图5中可以看到,在空白溶液中测试的低碳钢表面存在较多较大的腐蚀孔,其腐蚀形式是以孔蚀为主. 加入MMT 缓蚀剂后的低碳钢表面孔蚀现象明显减少,表面更加平整. 这是由于MMT 分子中的杂环原子在金属表面有较强的吸附能力,形成结构致密的保护膜,在一定程度上阻碍了腐蚀溶液ctfEquivalent analog circuits for blank solution, MMT andlow concentration of DNSEquivalent analog circuits for high concentration of DNS(a)Fig. 4 Equivalent circuit model图 4 等效电路模型第 4 期俎鹏姣, 等: S-N 型功能分子用作多功能添加剂的缓蚀及摩擦学行为研究577对低碳钢的攻击. 而加入DNS缓蚀剂之后,从宏观的腐蚀形貌上来看,低碳钢表面更加粗糙,大量的腐蚀产物覆盖在表面. 另一方面,量子化学模拟的结果显示DNS分子的反应活性更高,加之腐蚀表面的Fe元素含量明显降低(表4),因此推断该分子与金属基底发生较为强烈的反应后,金属基底更容易遭到腐蚀溶液的侵蚀与攻击.表 4 低碳钢腐蚀表面的几种元素含量Table 4 Contents of several elements on the corrodedsurface of mild steelSamplesAtom fraction/%Fe C N SHCl solution51.1327.04−−5.0 mmol/L MMT78.1020.20 1.400.305.0 mmol/L DNS47.6927.07−0.18腐蚀表面检测到的元素含量列于表4中,加入MMT缓蚀剂的金属表面检测到N元素和S元素,Fe元素含量明显增加,这一结果表明MMT分子在金属表面形成的分子吸附层对金属基底起到了较好的保护作用. 加入DNS缓蚀剂的金属表面Fe元素含量减少,检测到少量S元素,说明金属表面可能有较少的DNS 缓蚀剂分子吸附,大部分金属基底被腐蚀溶液进攻.DNS分子结构式中的萘磺酸基团与钢基底表现出更强的反应活性,对金属基底也产生了一定的腐蚀作用.为了揭示MMT分子的吸附机理,基于以上试验结果所得到数据,采用Langmuir吸附等温曲线进行拟合,吸附等温式如式(5)所示:Cθ=1K ads+C(5)K ads其中,C是添加缓蚀剂的浓度. θ是根据动电位极化曲线和电化学阻抗谱图计算得到的表面覆盖率,是吸附平衡常数.∆G0ads=−RT ln(55.5K ads)∆G0ads根据电化学试验的结果,拟合曲线如图6所示,图6(a)中所用的数据点是动电位极化曲线中所列举的参数,图6(b)中采取的是电化学阻抗谱图中的参数,两者拟合后的线性回归系数R2均近似为1,表明Langmuir 吸附等温曲线的拟合度较好. 由此,金属表面形成的是MMT分子的单层吸附膜[24]. 吉布斯自由能,55.5是水溶液中的浓度,单位是mol/L,R是气体常数,取8.314 J/(mol·L),T是绝对温度,取298 K. 计算得到的为−31.27和−32.18 kJ/mol,由此可以推断MMT分子的吸附方式为物理吸附和化学吸附同时存在的混合吸附.表 3 由电化学阻抗谱图获得的各电化学参数Table 3 Electrochemical parameters obtained from electrochemical impedance spectroscopyMedium C/(mmol/L)R s/(Ω·cm2)Y0/(106 S·s n/cm2)n R ct/(Ω·cm2)C dl/(μF/cm2)R f/(Ω·cm2)w/(10−3 S·s n/cm2)θηEIS/% HCl−23.1428.50.8023.2135.0−−−−DNS 1.019.5415.90.7823.5112.7−−0.013 1.3 1.520.3246.60.8227.281.9−−0.14714.7 3.033.1162.60.8637.870.9−−0.38638.6 5.024.5297.80.8862.1172.820.1302.30.62662.6MMT 1.021.359.80.89137.933.1−0.83183.1 1.518.247.10.89238.927.1−0.90390.3 3.025.546.90.88307.726.3−0.92492.4 5.021.951.60.88353.929.8−0.93493.4Blank MMT DNS10 μm10 μm10 μmFig. 5 SEM micrographs of corroded surface of mild steel图 5 低碳钢腐蚀表面的SEM照片578摩擦学学报(中英文)第 44 卷2.4 减摩抗磨与极压性能图7(a)所示为润滑油样的实时摩擦系数曲线,图7(b)所示为磨损量和平均摩擦系数. 从图7(a)中可以看出,与基础油的摩擦系数曲线相比,含不同添加量的MMT 分子油样的摩擦系数曲线均在其之下,质量分数为0.5%时的摩擦系数曲线处于最低. 从图7(b)可以观察到,该添加量下的磨损量最小,为0.66×106 μm 3,而基础油润滑下的磨损量为1.54×106 μm 3,对比而言,磨损量下降了57%,MMT 分子表现出优异的抗磨性能. 这是因为在摩擦过程中部分MMT 分子吸附在金属表面或与金属基底发生复杂的摩擦化学反应,形成了较为致密且有良好减摩抗磨作用的摩擦化学反应膜. 在图7(a)中,对于3个添加量下的DNS 分子而言,低浓度下的摩擦系数与基础油的摩擦系数相当或略有增大,高浓度下的摩擦系数有所减小,但与基础油的摩擦系数相比,变化不大. 图7(b)中,3个添加量下的磨损量均有所增大. 这可能是因为DNS 分子与基底间的摩擦化学反应更为剧烈,在摩擦力的作用下造成的磨损更为严重.图8所示为变载过程中摩擦系数曲线的变化情况.从图8中可以看出,PEG 润滑下的摩擦系数在刚开始的65 s 处于上升趋势,载荷从100 N 升高到200 N 的过程中,摩擦系数骤然升高,出现瞬态高摩擦,说明在加载过程中润滑油膜被磨穿,造成润滑失效. 加入1%DNS 后,从100 N 加载到200 N 的过程中,同样出现了摩擦系数突然上升的情况,在载荷200 N 时出现润滑失效. 说明DNS 分子形成的润滑膜的承载能力较差,金属表面形成的润滑膜不够致密而导致润滑失效[25].加入1% MMT 后,摩擦系数在刚开始有轻微波动,随后一直处于平稳状态,且在每次加载时也未出现摩擦系数骤增的情况,直到700 N 时摩擦系数明显增大,从试验结果来看MMT 作为添加剂对基础油的承载能力有较大的提高.2.5 磨损表面分析图9所示为摩擦试验后下试样磨斑表面的SEM 照片和EDS 图,由图9(a)可以看出,PEG 润滑下的磨损表面犁沟分布密集,存在轻微的磨粒磨损,磨损表面粗糙. 从图9(b)看到加入MMT 后,犁沟变浅,犁沟的数量1C /θ/(m m o l /L )65C /(mmol/L)4321023456(a)(b)1C /θ/(m m o l /L )65C /(mmol/L)4321023456Fig. 6 Fitted Langmuir adsorption isotherm 图 6 拟合的Langmuir 吸附等温曲线400Time/sF r i c t i o n c o e f f i c i e n t 08000.200.160.120.080.040.001 200 1 600W e a r v o l u m e /106 μm 3A v e r a g e f r i c t i o n c o e f f i c i e n tP E GP E G +0.1% M M T P E G +0.1% D N S P E G +0.5% M M T P E G +0.5% D N S PE G +1.0% M M T P E G +1.0%DN S2.01.61.20.80.40.00.200.160.120.080.040.00PEGPEG+0.1% MMT PEG+0.1% DNS PEG+0.5% MMT PEG+0.5% DNS PEG+1.0% MMT PEG+1.0% DNSWear volumeAverage friction coefficient(a)(b)Fig. 7 (a) The friction coefficient curves and (b) wear volume and average friction coefficient gotten from different oil samples图 7 不同油样的(a)摩擦系数曲线和(b)磨损量和平均摩擦系数第 4 期俎鹏姣, 等: S-N 型功能分子用作多功能添加剂的缓蚀及摩擦学行为研究579减少,表面更加平整光滑,且磨痕表面出现较多深色区域,推测这可能是摩擦过程中吸附的分子或与基底发生摩擦化学反应形成的摩擦膜覆盖在基底表面[26].从图9(c)可以看出,加入DNS 后,磨斑大小与PEG 润滑的磨斑大小相当,表面擦伤现象有所减轻,但依然存在较多较深的犁沟.检测到磨斑内部的元素含量占比情况列于表5中.含MMT 油样润滑下的金属表面存在一定量的S 元素,并且从面分布照片上可看到S 元素的富集,与基础油相比,表面O 元素含量有所降低. 由此推测,部分MMT分子吸附在表面或者含硫元素的摩擦产物形成的摩擦膜覆盖在磨损表面. 添加DNS 的磨损表面未检测到S 元素,原因是在EDS 检测的深度下,DNS 形成的润滑膜中的S 元素较少,在接近金属基底的深度下其组分中更多的是铁的氧化物等.为了进一步研究2种杂环分子的润滑机理,对磨损表面特征化学元素的组成成分进行讨论分析,如图10和图11所示. 由图10可知,磨斑表面检测到Fe 、O 、C 和S 元素. Fe 2p 的峰位出现在711.5和710.4 eV 的位置,O 1s 的分峰位于531.95和530.7 eV. 结合Fe 元素和O 元素的结合能峰位,可以推断该磨斑表面生成了Fe 2O 3、Fe 3O 4和FeOOH 等[27]. S 2p 的分峰位于168.8和167.4 eV ,分别归属于FeSO 4和磺酰基[28]. 从XPS 结果来看,DNS 作为添加剂的磨斑表面包含铁的氧化物,FeSO 4和含磺酰基的降解产物等. 由图11可知,磨斑表面检测到Fe 、O 、N 、C 和S 元素. O 1s 的分峰位于532.2和531.2 eV ,结合Fe 和O 元素的结合能,摩擦产物可能是Fe(OH)O 和Fe 2(SO 4)3[29]. 大部分S 2p 峰可以用1个双峰拟合,反映的是S 2p 3/2和S 2p 1/2这2个组分的贡献,S 2p 1/2峰结合能位置比S 2p 3/2大1.18 eV ,峰强度是S 2p 3/2峰强度的一半[30]. S 元素的2个峰位于163.4和162.2 eV 归属于FeS 2中的S 2p 1/2和S 2p 3/2. N 1s 的结合能位于399.6 eV ,300Time/sPEGPEG+1% DNS PEG+1% MMTLoad0.60.50.40.30.2F r i c t i o n c o e f f i c i e n t600900 1 2001 500 1 800 2 100L o a d /N1002003004005006007000.10.0Fig. 8 Real-time friction coefficient curves ofvariable load friction test 图 8 变载摩擦试验的实时摩擦系数曲线(a) PEG (b) PEG+0.5% MMT(c) PEG+0.5% DNSFig. 9 SEM-Mapping micrographs of worn surfaces图 9 磨斑表面的SEM 照片和面分布图580摩擦学学报(中英文)第 44 卷归属于含氮有机物[31]. 因此,结合以上特征元素的XPS 结果分析,可以得知该磨斑表面形成的氧化物以及摩擦产物覆盖在金属表面起到良好的减摩抗磨效果.2.6 量子化学模拟利用Multiwfn 3.8 (dev)软件对电子结构进行分析[32],基于Multiwfn 导出的文件,利用可视化分子动力学(VMD)软件绘制了各轨道和实空间函数的等值面图,如图12所示.由此获得的最高占据分子轨道(HOMO)、最低未占据分子轨道(LUMO)以及相关联的各量子化学参数如下所示[33]:∆E gap =E LUMO −E HOMO (6)η=E LUMO −E HOMO 2(7)σ=1/η(8)χ=E HOMO +E LUMO2(9)量子化学参数的数值列于表6中,一般认为,HOMO 和LUMO 这2个轨道代表化合物给予电子和接受电子的能力[34],E HOMO 值越高,分子越容易向金属的空轨道贡献电子,而分子的E LUMO 值越低,分子从金属表面获取电子的倾向越大. 能隙(ΔE gap )被认为是表征所研究分子反应活性的1个更具决定性的参数,ΔE gap 值越小,分子的反应活性越高[35]. 此外,化学硬度(η)的大小代表分子对电子云极化或变形的抵抗能力,如果分子的硬度值较小,而柔软度值(σ)较高,则分子处于更活跃的状态. 结合以上分析可以看出,与MMT 相比,DNS 分子与钢表面表现出更高的反应活性. 因此,DNS 作为PEG 润滑油的极压抗磨添加剂,在所施加载荷的作用力下,反应活性更高的DNS 分子与金属基底的剧烈反应加剧了摩擦副的磨损行为;作为盐酸溶液的缓蚀添加剂,与金属基底有更高反应活性的DNS 分子,在加速腐蚀的电化学试验条件下,金属基底更容易被酸性溶液腐蚀.表 5 磨斑表面的几种元素含量Table 5 Contents of several elements on worn surfacesLubricants Mass fraction/%C O Fe N S PEG 4.7 1.394.000.0PEG+0.5% MMT 4.6 1.094.200.2PEG+0.5% DNS4.91.293.80.0(a) PEG+0.5% DNS(b) Fe 2p(c) O 1s(d) S 2p1 0001 200I n t e n s i t yBinding energy/eV8006004002000Fe 2pO 1sC 1sS 2p735I n t e n s i t yBinding energy/eV730725720715710705711.5 eV710.4 eV174I n t e n s i t yBinding energy/eV172170168166164162160158168.8 eV167.4 eV 542I n t e n s i t yBinding energy/eV540538536534532530528526524531.95 eV530.7 eVFig. 10 XPS spectra on worn surface lubricated by PEG+0.5% DNS图 10 PEG+0.5% DNS 油样润滑下磨斑表面的XPS 谱图第 4 期俎鹏姣, 等: S-N 型功能分子用作多功能添加剂的缓蚀及摩擦学行为研究581。
CHEMICAL INDUSTRY AND ENGINEERING PROGRESS 2016年第35卷第6期·1820·化 工 进 展水合无机盐及其复合相变储热材料的研究进展苑坤杰,张正国,方晓明,高学农,方玉堂(华南理工大学传热强化与过程节能教育部重点实验室,广东 广州510640)摘要:水合无机盐具有适宜的相变温度、较大的相变潜热、原料廉价以及热导率较高(相对有机相变材料而言)等优势而有望成为中低温热利用领域理想的储热材料。
然而,水合盐具有过冷、相分离和液漏等缺陷,一直以来成为限制其应用的瓶颈缺陷。
水合无机盐作为相变储热材料的传统研究主要集中在成核剂和增稠剂的选择上,近几年一些研究者开始研究水合无机盐复合或封装工艺,极大地促进了水合盐性能提升方面的工作。
本文综述了常见的几种低温类水合无机盐过冷和相分离现象的解决方法以及基于这几种低温水合无机盐的复合相变储热材料的研究,复合相变材料较单一纯相变材料具有诸多优越的性能,预测采用多孔材料吸附封装技术或微胶囊封装技术来制备水合无机盐复合相变材料可能成为未来解决水合盐液漏问题的研究热点。
关键词:水合无机盐;储热;复合相变材料中图分类号:TK 02 文献标志码:A 文章编号:1000–6613(2016)06–1820–07 DOI :10.16085/j.issn.1000-6613.2016.06.023Research progress of inorganic hydrated salts and their phase change heatstorage compositesYUAN Kunjie ,ZHANG Zhengguo ,F ANG Xiaoming ,GAO Xuenong ,F ANG Yutang (Key Lab of Enhanced Heat Transfer and Energy Conservation ,Ministry of Education ,School of Chemistry andChemical Engineering ,South China University of Technology ,Guangzhou 510640,Guangdong ,China )Abstract :With the advantages of proper phase change temperature ,high latent heat ,cheap raw materials and high thermal conductivity (compared with organic phase change materials),the inorganic hydrated salts are considered as ideal heat storage materials in the field of middle and low temperature heat utilization. However ,the hydrated salts have also defects of supercooling ,phase separation and leakage ,which have significantly limited their applications. The traditional researches on hydrated salts focused on the choice of nucleating agents and thickening agents. Recently ,some researchers on the composite or encapsulation of inorganic hydrous salt showed up ,greatly promoting the work of improving the performance of hydrated salts. In this paper ,the solutions for supercooling and phase separation and the researches on phase change composites of several common inorganic hydrated salts are summarized. Compared with single phase change materials ,the phase change composites have many superior properties. Preparing inorganic hydrated salts phase change composites with porous materials package and micro encapsulation technology may become the research hotspots for solving the problem of inorganic hydrated salts leakage in the future.Key words :inorganic hydrated salt ;heat storage ;phase change composites第一作者:苑坤杰(1990—),女,博士研究生。
第25卷第4期 2010年8月 天津科技大学学报
Journal of Tianjln University of Science&Technology 、,o1-25 NO.4
Aug 2010
一种新型茈衍生物的凝胶行为 任翔宇,卢秀萍 (天津科技大学材料科学与化学工程学院,天津300457)
摘要:采用离子自组装方法,以花酐的羧酸盐及阳离子表面活性剂二甲基二十八烷基溴化铵(DOAB)为原料,室温 下合成一种新型蔸衍生物.借用核磁共振仪(NMR)和傅里叶变换红外光谱仅(FTIR)确定目标产物的化学组成和结 构利用透射电镜(TEM)、X射线衍射仪(XRD)、小角x射线散射仪(SAXS)等表征衍生物的凝胶聚集体形貌及排列 结构.结果表明:这种花衍生物能够在芳香环问的 相互作用下,通过自组装过程形成有序排列的聚集体,其在甲苯 中的凝胶呈现典型的层状结构,花环之间的7【 相互作用是其形成凝胶的主要驱动力,相互缠结的烷基链与溶剂之间 范德华力促使凝胶结构更加稳定. 关键词:茈衍生物;凝胶;7[_Ⅱ相互作用 中图分类号:0625.15 文献标志码:A 文章编号:1672.65l0(2010)04.0037—04
Gelation Behavior of a New Perylene Derivative REN Xiang—yu,LU Xiu—ping (College ofMaterial Science and Chemical Engineering,Tianjin University ofScience&Technology, Tianjin 300457,China)
Abstract:Carboxylate of perylene anhydride and cationic surfactants(DOAB)were selected as raw materials to synthesize a new type of perylene derivative at room temperature by a ionic self-assembly method.NMR and FTIR were used to deter— mine the composition and structure of the target products.TEM,XRD and SAXS were also used to characterize the self- assembled morphology of gelation aggregates and the arrangement of structure.It was found that this perylene derivative was able to self-assemble into ordered aggregates through the 7c一7【stacking of the aromatic ring.and it could form gel in toluene. The 一7【stacking between perylene cores was the main driving force of the gel,and Van der Waals force between twisted alkyl chains and solvent made the gel stable. Keywords:perylene derivative;gel; 一7c stacking
RheologicalpropertiesofSalecanasanewsourceofthickeningagentAihuiXiu,MengyiZhou,BinZhu,ShimingWang,JianfaZhang*CenterforMolecularMetabolism,NanjingUniversityofScience&Technology,Nanjing210094,China
articleinfoArticlehistory:Received25December2010Accepted15March2011Keywords:SalecanRheologicalpropertiesViscosityThickeningagentabstractSalecanisanovelsolubleglucanproducedbyAgrobacteriumsp.ZX09,displayingtheabilitytoinhibitpancreaticamylaseandreducepostprandialglucose.TheresearchhereprovidesaninvestigationoftherheologicalpropertiesofSalecansolutionoverawiderangeofshearrate(0.001e1000sÀ1),frequency
(0.1e100rad/s),concentrations(0.3%,0.5%,1.0%and1.5%),temperature(5e95C)andpH(1.0e13.0).The
powerlawmodelwelldescribedtherheologicalbehaviorofthesolutions,intheshear-thinningregion,withhighdeterminationcoefficients,R2.Salecansolutionsshowedanon-Newtonianviscositybehavior
atallconcentrationsandtemperatures.Thesolutionsexhibitedexcellentstabilitybelow55C.Viscos-
itieswerenotaffectedafterbeingfrozen(À20C).OverawidepHrangefrom6.0to12.0,theviscosity
almostkeptinvariant.Withincreasingfrequency,thestorageandlossmoduliG0andG00ofSalecan
solutionincreasedandcomplexviscositiesdecreasedcontinuously,whichshowedanelasticbehaviour.AlldataindicatedthatSalecanhasexcellentrheologicalpropertiesandcouldbeutilizedinfoodindustryasanewsourceofthickeningagent.Ó2011ElsevierLtd.Allrightsreserved.
1.IntroductionManypolysaccharidesarehydrocolloids.Becauseoftheirabilitytomodifytherheologicalandfunctionalpropertiesoffoodsystems,polysaccharidesarewildlyusedinthefoodindustryforgelformation,waterretention,emulsificationandaromaretention.Foodproducts,suchasbread,sauces,syrup,icecream,instantfood,beveragesandketchup,mighthavehydrocolloidsintheirformu-lations(Koocheki,Mortazavi,Shahidi,Razavi,&Taherian,2009).Starch,oneofthemostimportantfunctionalfoodbiopolymers,isaddedtomanyproductsincludingavarietyoflow-fatproductsasafunctionalingredienttoimprovetheirrheologicalcharacters(Gouvêaetal.,2009;Hermansson&Svegmark,1996).Avarietyofmicroorganismsincludinglacticacidbacteria,algae,fungiandplantshaveanabilitytoproduceextracellularpoly-saccharidesandexcretethemoutofcelleitherassolubleorinsolublepolymers(Wang,Ahmed,Feng,Li,&Song,2008).Poly-saccharidesofmicrobialoriginhavebeendevelopedassourceofadditivesforseveralindustriesincludingxanthanfromXantho-monascampestris(Viturawong,Achayuthakan,&Suphantharika,2008),SuccinoglycanfromSinorhizobiumorAgrobacterium(Simsek,Mert,Campanella,&Reuhs,2009)andgellanfromPseu-domonaelodea(Tako,Sakae,&Nakamura,1989).Polysaccharides
frommicrobialsourcesareinparticularusedasthefoodadditivebecausetheyalsohavetheadvantageofbeingregardedastotallynaturalformanyconsumers(Lai,Tung,&Lin,2000).Intheaspectsofanaturalbacterialpolysaccharidehydrocolloid,theb-glucanhas
outstandingfunctionalandnutritionalproperties.Otherwise,itisattractingtheincreasingattentionofpharmaceuticalandfunc-tionalfoodindustry,notonlybecauseofitsthickeningorgellingpropertiesbutalsoitsmultiplebeneficialeffectsonhumanandanimalhealth,suchasimmune-stimulation(Weintraub,2003),anti-inflammatory(Doreetal.,2007),antimicrobial(Smiderleetal.,2008),antitumoural(Leung,Liu,Koon,&Fung,2006),antioxidation(Tokluetal.,2006),cholesterollowering(Kalra&Jood,2000)andantidiabetic(Jenkins,Jenkins,Zdravkovic,Würsch,&Vuksan,2002).Itisalsoreportedthatb-glucanisnutritionallynon-func-
tionalinthehumandigestivetract,andhencehasnocaloricvalue(Charalampopoulos,Wang,Pandiella,&Webb,2002;Morgan,2000).Viscosityofb-glucanwasstableoverawiderangeofpH
anddecreasedwithincreasingtemperature(Dawkins&Nnanna,1995).Peoplefoundthat1.0%(w/w)b-glucansolutionshave
alowflowbehaviourindexandahighconsistencycoefficientinthepowerlawmodel(Autio,Myllymäki,&Mälkki,1987).Themolecularweight,structuralfeaturesandconcentrationofb-glucansareimportantdeterminantsoftheirphysicalproperties,
suchaswatersolubilityandrheologicalbehaviour,andtherebyaffectthefunctionalityoffoodsystems.Curdlanisanessentiallylinear(1/3)-b-glucan,whichmayhaveafewintra-orinter-chain
(1/6)-linkages,producedfrombacterialfermentation.Itsaqueous*Correspondingauthor.Tel./fax:þ862584318533.
E-mailaddress:jfzhang@mail.njust.edu.cn(J.Zhang).
ContentslistsavailableatScienceDirectFoodHydrocolloids
journalhomepage:www.elsevier.com/locate/foodhyd
0268-005X/$eseefrontmatterÓ2011ElsevierLtd.Allrightsreserved.doi:10.1016/j.foodhyd.2011.03.013
FoodHydrocolloids25(2011)1719e1725