a r
X
i
v
:a
s t
r o
-
p
h
/
4
8
3
8v
1
1
7
A
u
g
2
4
The V1647Ori (IRAS 05436-0007)Protostar And Its Environment Peregrine M.McGehee 1,2,J.Allyn Smith 3,4,Arne A.Henden 5,Michael W.Richmond 6,Gillian R.Knapp 7,Douglas P.Finkbeiner 7,ˇZeljko Ivezi′c 7,J.Brinkmann 8peregrin@https://www.doczj.com/doc/d73313228.html, ABSTRACT We present Sloan Digital Sky Survey and United States Naval Observatory observations of the V1647Ori protostar and surrounding ?eld near NGC 2068.V1647Ori,the likely driving source for HH 23,brightened signi?cantly in Novem-ber 2003.Analysis of SDSS imaging acquired in November 1998and February 2002during the quiescent state,recent USNO photometry,and published 2MASS and Gemini data shows that the color changes associated with brightening sug-gest an EXor outburst rather than a simple dust clearing event.Subject headings:stars:formation -stars:pre-main-sequence -stars:circumstel-lar matter -stars:individual (V1647Ori,IRAS 05436-0007)
1.Introduction
In January2004,J.W.McNeil discovered a new re?ection nebula in the dark cloud Lynds 1630near M78(McNeil2004)This object,now known as McNeil’s Nebula,is apparently associated with an EXor-type eruption(Reipurth&Aspin2004)of the embedded protostar V1647Ori.
EXors belong to the class of pre-main-sequence optical variables(Herbig1977).They are classical T Tau stars which undergo irregular outbursts in the optical/UV of several magnitudes,named for the prototype EX Lup(Herbig et al.2001).These outbursts are in-terpreted as episodes of substantial mass transfer resulting from instabilities in the accretion disk;they are present very early in the evolution of a protostar,as shown by the detection of EXor outbursts from deeply embedded Class1protostars in the Serpens star formation region(Hodapp et al.1996).
Clark(1991)?rst identi?ed V1647Ori as the young stellar object IRAS05436-0007on the basis of its IRAS colors.I-band and[SII]narrow-band imaging of the region by Eisl¨o?el &Mundt(1997)revealed a faint I band source at the position of the IRAS object and re?ection nebulosity extending to the north,identifying V1647Ori as the likely driver for HH23,located170arcsec north of the star.The bolometric?ux of the source derived from IRAS and sub-millimeter photometry by Lis,Menten,&Zylka(1999)yields a luminosity of 2.7L⊙and an inferred molecular gas mass of0.4M⊙assuming a distance of400pc to the Orion star-forming complex(Anthony-Twarog1982).
Estimates of the extinction towards V1647Ori,A V=11m-15m,are found to be similar from photometry taken during the quiescent phase(Abraham et al.2004)and during the eruptive phase(Reipurth&Aspin2004;Vacca et al.2004;Brice?n o et al.2004;Andrews, Rothberg&Simon2004).Thus,it is not clear whether the appearance of McNeil’s Nebula is due only to the eruption of V1647Ori or to the eruption plus additional clearing of obscuring circumstellar dust.In this paper,we examine this question using pre-eruption multiband optical and near infrared data from the Sloan Digital Sky Survey(SDSS)and the Two Micron All Sky Survey(2MASS)compared with post-eruption data in the SDSS and2MASS bands observed at the United States Naval Observatory.
2.Observations
We detect the protostar at four epochs of Sloan Digital Sky Survey(SDSS)imaging as a point source(SDSS J054613.14-000604.1)coincident with the2MASS K-band position (α2000=05h46m13.1s,δ2000=-00o06′05′′).The SDSS observations consist of two pairs of scans
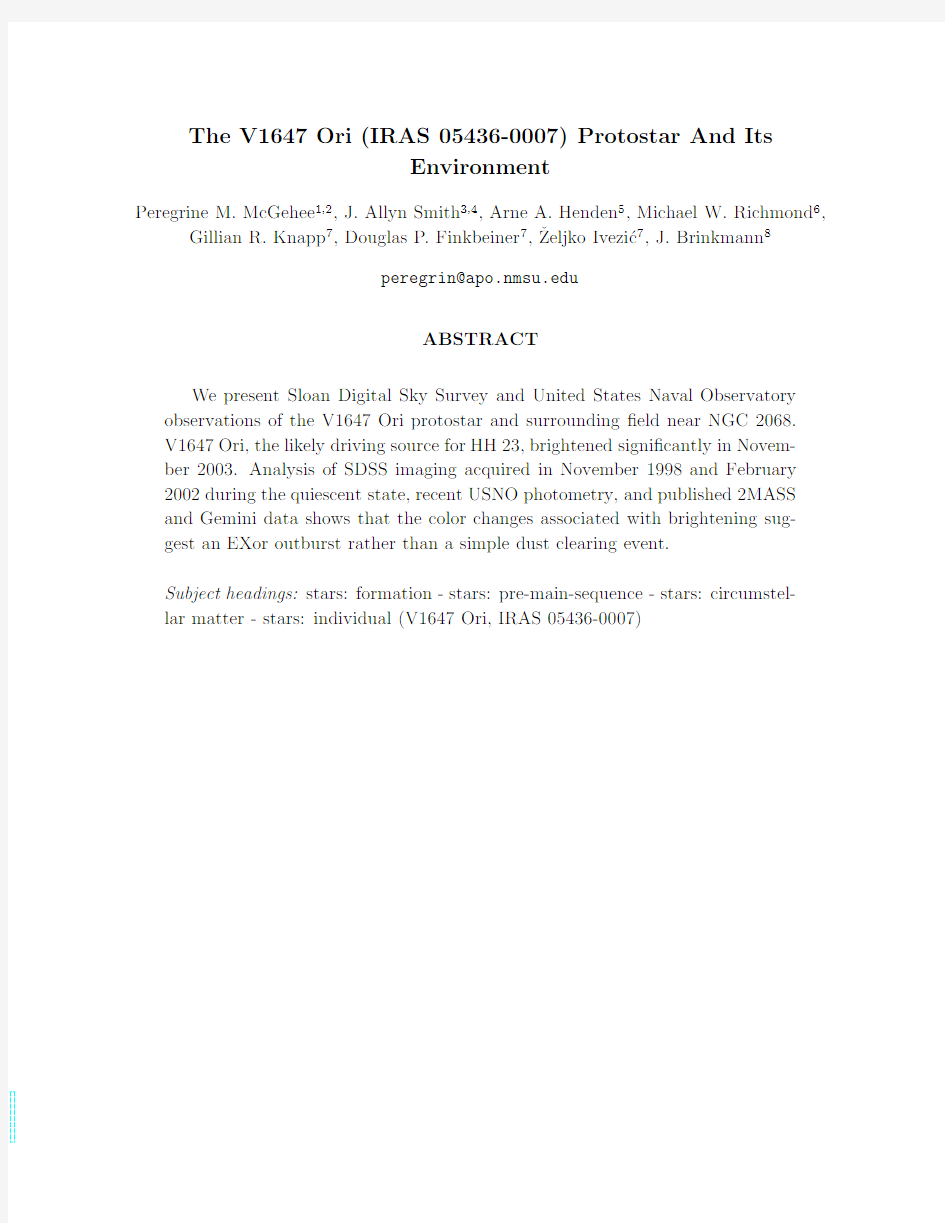
acquired in November1998and February2002.Figure1shows an SDSS composite image made with the riz?lters in which the protostar and the faint nebulosity to the north can be seen.
A technical summary of the SDSS is given by York et al.(2000).The SDSS imaging camera is described by Gunn et al.(1998).The Early Data Release and the Data Release One are described by Stoughton et al.(2002)and Abazajian et al.(2003).The former includes an extensive discussion of the data outputs and software.Pier et al.(2003)describe the astrometric calibration of the survey and the network of primary photometric standard stars is described by Smith et al.(2002).The photometric system itself is de?ned by Fukugita et al(1996),and the system which monitors the site photometricity by Hogg et al.(2001). Abazajian et al.(2003)discuss the di?erences between the native SDSS2.5m ugriz system and the u′g′r′i′z′standard star system de?ned on the USNO1.0m(Smith et al.2002).
The SDSS low Galactic latitude data which includes the Orion equatorial imaging used in this work are described by Finkbeiner et al.(2004).
The U.S.Naval Observatory Flagsta?Station1.0m and1.55m telescopes were used to obtain eruptive phase BV RIz′and JHK photometry of V1647Ori.For BV RIz′,frames were taken and?at?elded using twilight sky?ats.DAOPHOT PSF?tting as implemented in IRAF was used to obtain photometric measures of the target since there is a bright part of the nebula only a few arcsec distant.For each dataset,ensemble di?erential photometry was performed using a set of secondary standard stars calibrated on two photometric nights with the USNO1.0m telescope.The z′measures were relative to z′secondary standard stars calibrated by the SDSS PT telescope(Hogg et al.2001).For JHK,we used2MASS stars in the?eld,eliminating obvious variables,to calibrate the data.We used a standard K?lter for2004February11,but used a K′?lter for2004April12.
3.Results
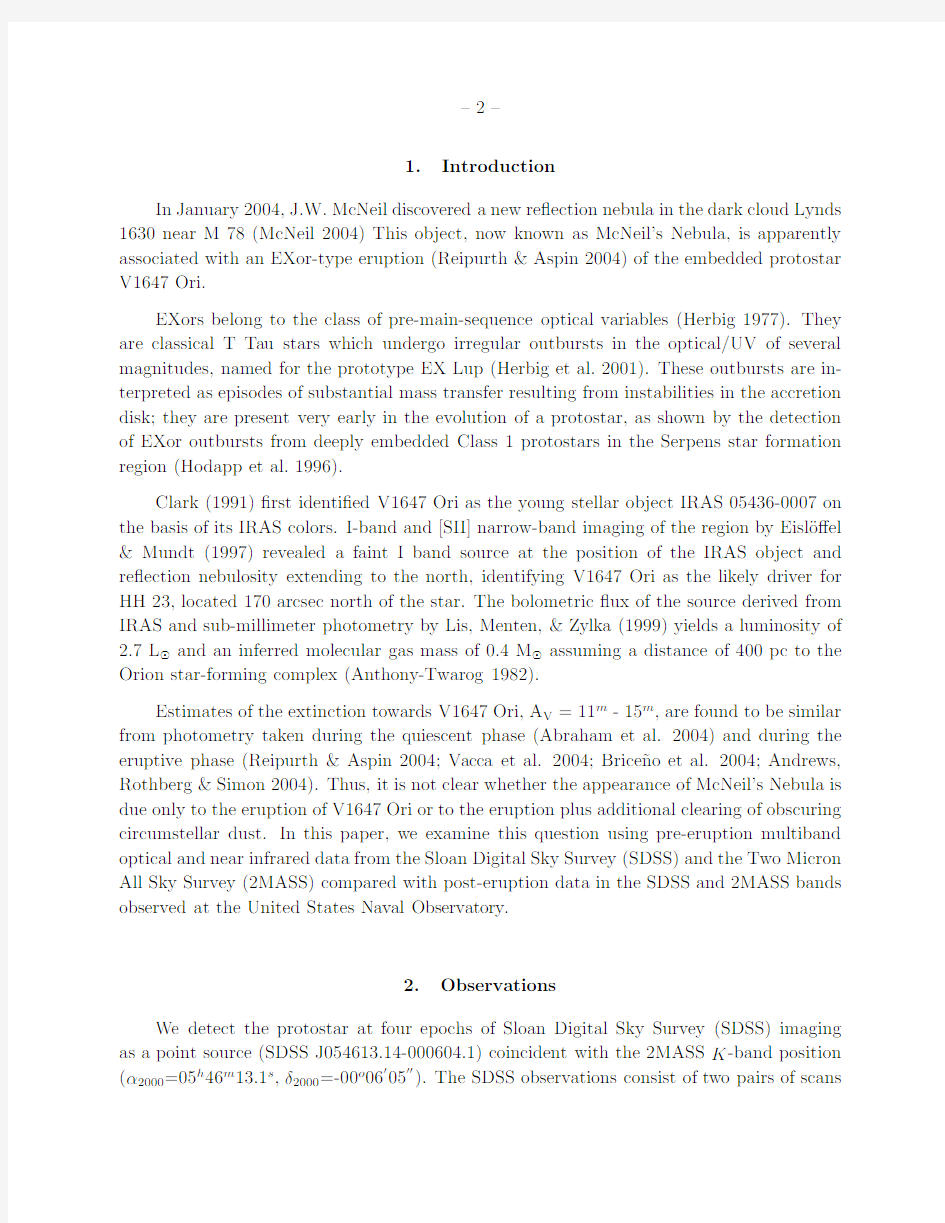
The pre-eruptive and recent optical and near-infrared photometry of V1647Ori are sum-marized in Tables1,2,and3.The quiescent and eruptive phase spectral energy distributions are shown asνFνin Figure2.
We examine the evolution of reddening invariant colors from the quiescent to the eruptive states to constrain the underlying physical processes.These colors take the generic form C xyz=(x?y)?(y?z)?E(x?y)/E(y?z)where x,y,and z are the observed magnitudes in each passband.A color change is computed as?C xyz,where color changes having?C xyz statistically distinct from0indicate changes in the spectral energy distribution(SED)not
consistent with pure dust clearing.The conversion from E(B?V)to extinction in each band follows Schlegel,Finkbeiner,&Davis(1998)and Finkbeiner et al.(2004),in preparation
The reddening invariant colors measured before and during the eruption are listed in Table4for both R V=3.1and R V=5.5,the latter appropriate for the larger dust grains found in star formation regions.R V,de?ned as A V/E(B?V),is the ratio of the general to selective extinction.
Characteristic grain sizes are inferred to increase from0.17μm to0.21μm as R V ranges from3.1to5.5assuming a mix of silicate and carbonaceous populations(Weingartner& Draine2001).In the coldest portions of the molecular clouds additional grain species such as refractory and volatile organics,olivine,water ice,orthopyroxene,trolite,and metallic iron are expected to contribute to the opacity(Pollack et al.1994).Vacca et al.(2004) detect absorption due to water ice at3.1μm in the near-IR outburst spectrum.
Study of the selective extinction in background stars has revealed that R V is not con-stant within the interiors of dark molecular clouds.Strafella et al.(2001)?nd that for the Bok globule CB107R V increases inwards reaching a value of6.5at the core.Given the complex nature of the V1647Ori environment including outburst cavities,accretion disks, and remnant envelopes it is likely that R V can vary on small spatial scales.
3.1.Determination of Extinction
In the foregoing analysis we choose to characterize the intervening dust in terms of the SDSS z band extinction and R V.Since the shape of the extinction curve is dependent upon the grain size distribution forλ<0.9μm(Cardelli,Clayton&Mathis1989)the traditional A V and E(B?V)quantities are sensitive to both the dust column density and R V.By adopting reference passbands longward of0.9μm we remove the dependency on the form of the dust law although R V must still be considered in the optical and UV.Alternate passbands that are free of R V e?ects include the near-IR J and Johnson-Cousins I,the latter used by Weingartner&Draine(2001)who adopted A I/N(HI)=2.5×10?22cm2for a standard gas-to-dust ratio.
Following Abraham et al.(2004)and Reipurth&Aspin(2004)we assume that the quiescent phase near-IR colors are that of an embedded low-mass Classical T Tauri and obtain E(J?H)=1.43m by dereddening onto the Classical T Tauri locus of Meyer,Calvet, &Hillenbrand(1997).This value of E(J?H)corresponds to A J=3.39m(A z=6.40m)given λe?(J)=1.25μm andλe?(H)=1.65μm and application of the Cardelli,Clayton&Mathis (1989)methodology.
3.2.Changes in the Spectral Energy Distribution
In order to analyze the general di?erences between the quiescent and eruptive appear-ance we combine sets of observations to form representative values.The quiescent state is taken as the October7(2MASS J,H,K)and the1998November17(SDSS r,i,z)obser-vations.The optical photometry for the eruptive state is obtained from the2004February 14Gemini r and i data(Reipurth&Aspin2004),and the2004February26USNO z band observations.The J,H,and K data for the eruptive state are from the2004February11 USNO observations.
Table5presents the reddening invariant colors in the quiescent and eruptive states for R V=3.1and R V=5.5.As evidenced by the greater than5σchange in all colors except for C riz,which has a marginal r band detection in the quiescent state,it is clear that the increase in emission is not consistent with a dust clearing event and thus we conclude that an intrinsic change occurred to the SED of V1647Ori.
In Figure3we compare the observed magnitude variations against?A z=?2m and ?4m dust clearing events and,as concluded above based on reddening invariant colors,?nd they are not explainable in terms of a simple diminishing of the line of sight extinction.
3.3.The Quiescent Phase
From observations of Class II protostars(Classical T Tauris)we would expect that the veiling continuum due to magnetospheric accretion will be present in the SDSS u and g bands but weakening into the redder r,i and z bands(Calvet&Gullbring1998).In a similar fashion,the thermal emission from the inner portion of the circumstellar disk should be bright in the H and K bands but diminishing into the bluer J band(Meyer,Calvet,& Hillenbrand1997).For all but the mostly heavily veiled stars the i and z bands will only be a?ected by extinction.None of the reddening invariant colors can be used to give the intrinsic spectral type.
Young(1Myr)T Tauri stars exhibit spectral types between M0and M4for masses of 0.1to1.0M⊙(Bara?e et al.1998).The use of the Meyer,Calvet,&Hillenbrand(1997) near-IR Classical T Tauri locus by Abraham et al.(2004)and Reipurth&Aspin(2004) implicitly assumes a similar spectral type as this locus is based on observations of K7/M0 stars in the Taurus star formation region.The i?z colors for these early to mid M spectral types range from0.38to0.80with considerable scatter on the order of several tenths of magnitudes(West et al.2004).Given the observed i?z(2.01±0.06),dereddening to these intrinsic colors requires A z=3.1m to4.2m for R V=3.1and4.3m to5.7m for R V=5.5.
Dereddening using the estimated A z~6.4and R V=3.1results in an intrinsic i?z of -0.47,which is too blue for the stellar locus.Assumption of R V=5.5yields an i?z of0.20, corresponding to a late K spectral type(Finlator et al.2000).If V1647Ori is indeed a low mass protostar with a late K or M spectral type than either R V is high or signi?cant i band veiling is present in the quiescent state.
In Figure4we compare the observed quiescent phase SED against an M0photosphere seen under an extinction of A z=6.4magnitudes.Excess emission is seen in the J,H,and K bands that could indicate the presence of a circumstellar disk.
3.4.The Eruptive Phase
The optical spectra acquired during the outburst by Walter et al.(2004)lack the TiO molecular absorption bands characteristic of late K and M stars.Walter et al.(2004)at-tribute this to either an early photospheric spectral type or overwhelming veiling.We adopt the latter interpretation given the apparent change to the intrinsic SED and the large bright-ness increase in the optical(Figure3).
If the new component to the SED is due to an EXor outburst then we expect to see emission from the high temperature(6000-8000K)inner disk(Bell et al.1995).In Figure5 we show the observed?ux(νFν)increase in comparison with a7000K blackbody reddened by A z=3.2m and6.4m for R V=3.1and5.5.In common with Walter et al.(2004)we see that a single EXor-like high temperature component can not reproduce the observed excess in both the optical and the near-IR.
For the partial dust clearing events suggested by Reipurth&Aspin(2004)and Walter et al.(2004)we?nd that due to the increase in optical depth towards the blue the additional ?ux due to a new source must fall more rapidly at the shorter wavelengths.The observed change in J?H is-0.61m,which if entirely due to dust clearing requires?A z=-3.2m.The intrinsic?ux increase required in this case is shown in Figure5and would require either a lower temperature for the new source or a signi?cantly higher extinction than anticipated.
Spectral indices are commonly de?ned by the ratio of the?ux of the feature(F s)and that of the nearby pseudo-continuum(F c),so the intrinsic measure of the feature strength is I0=F s/F c(Gizis1997).If a veiling continuum is present,de?ned by F v=rF c,then the measured spectral index,I,is
I=
F s+rF c
1+r +
r
Funding for the creation and distribution of the SDSS Archive has been provided by the Alfred P.Sloan Foundation,the Participating Institutions,the National Aeronautics and Space Administration,the National Science Foundation,the U.S.Department of En-ergy,the Japanese Monbukagakusho,and the Max Planck Society.The SDSS Web site is https://www.doczj.com/doc/d73313228.html,/.
The SDSS is managed by the Astrophysical Research Consortium(ARC)for the Partic-ipating Institutions.The Participating Institutions are The University of Chicago,Fermilab, the Institute for Advanced Study,the Japan Participation Group,The Johns Hopkins Uni-versity,Los Alamos National Laboratory,the Max-Planck-Institute for Astronomy(MPIA), the Max-Planck-Institute for Astrophysics(MPA),New Mexico State University,University of Pittsburgh,Princeton University,the United States Naval Observatory,and the University of Washington.
This publication makes use of data products from the Two Micron All Sky Survey, which is a joint project of the University of Massachusetts and the Infrared Processing and Analysis Center/California Institute of Technology,funded by the National Aeronautics and Space Administration and the National Science Foundation.
Finally we thank the referee,Colin Aspin,for his helpful comments.
Facilities:SDSS,USNO,Gemini-N,2MASS.
REFERENCES
Abazajian,K.,et al.2003,AJ,126,2081
Abraham,P.et al.2004,A&A,419L,39
Andrews,S.M.,Rothberg,B.,&Simon,T.2004,ApJ,610,45
Anthony-Twarog,B.J.1982,AJ,87,1213
Bara?e,I.et al.1998,A&A,337,403
Bell,K.R.et al.1995,ApJ,444,376
Brice?n o,C.et al.2004,ApJ,606,123
Calvet,N.&Gullbring,E.1998,ApJ,509,802
Cardelli,J.A.,Clayton,G.C.,&Mathis,J.S.1989,ApJ,345,245
Clark,F.O.1991,ApJS,75,611
Eisl¨o?el,J.&Mundt,R.1997,AJ,114,280
Finkbeiner,D.et al.2004,AJ,submitted
Finlator,K.et al.2000,AJ,120,2615
Fukugita,M.,Ichikawa,T.,Gunn,J.E.,Doi,M.,Shimasaku,K.,&Schneider,D.P.1996, AJ,111,1748
Gizis,J.E.1997,AJ,113,806
Gunn,J.E.et al1998,AJ,116,3040
Herbig,G.H.1977,ApJ,217.693
Herbig,G.H.et al.2001,PASP,113,1547
Hodapp,K-W.et al.ApJ,468,861
Hogg,D.W.,Finkbeiner,D.P.,Schlegel,D.J.,&Gunn,J.E.2001,AJ,122,2129
Lis,D.C.,Menten,K.M.,&Zylka,R.1999,ApJ,527,856
McNeil,J.W.2004,IAUC8284,9February2004.
Meyer,M.R.,Calvet,N,&Hillenbrand,L.A.1997,AJ,114,288ApJ,266,713
Pier,J.R.,Munn,J.A.,Hindsley,R.B.,Hennessy,G.S.,Kent,S.M.,Lupton,R.H.,&Ivezi′c,ˇZ.2003,AJ,125,1559
Pollack,J.B.et al.199),ApJ,421,615
Reipurth,B.&Aspin,C.2004,ApJ,606,119
Schlegel,D.,Finkbeiner,D.&Davis,M.1998,ApJ,500,525
Smith,J.A.,et al2002,AJ,123,2121
Stoughton,C.,et al2002,AJ,123,485
Strafella,F.et al.2001,ApJ,558,717
Vacca,W.D.et al.2004,ApJ,609,29
Walter,F.M et al.2004,astro-ph/0406618
Weingartner,J.C.&Draine,B.T.2001,ApJ,548,296
West,A.et al2004,AJ,128,426
York,D.et al.2000,AJ,120,1579
Table1.riz Photometry of V1647Ori Date r i z Telescope
a From Reipurth&Aspin(2004).
Table2.Johnson-Cousins Photometry of V1647Ori
Date B V R c I c Telescope
Table3.Near-IR Photometry of V1647Ori
Date J H K Telescope
a From Reipurth&Aspin(2004).
b The USNO1.55m observations used standard K on2004February11and K′on2004 April12,both placed on the2MASS zeropoint system,but probably with transformation di?erences.
Table4.Reddening Invariant Colors Color R V=3.1R V=5.5
Table5.Reddening Invariant Color Changes
R V=3.1R V=5.5
Color Quiescent a Eruptive b Nσc Quiescent a Eruptive b Nσc
a The quiescent state is de?ned by the1998October72MASS and1998November17 SDSS data.
b The eruptive phase data are from the2004February14Gemini r and i,the2004February 26USNO z,and the2004February11USNO J,H,and K measurements.
c Nσis the ratio of color change to the quadrature sum of measurement errors.
Fig.1.—SDSS pre-eruption riz band mosaic image of V1647Ori.The location of V1647Ori is marked on this2x2binned mosaic which maps the SDSS r,i,and z bands onto blue,green,and red.Herbig-Haro objects,such as the large HH24complex(bottom center), are seen in blue due to the Hαemission appearing in the r band.The image is roughly10 arcminutes on a side and is displayed using a negated grayscale.North is up and east is to the left.The faint emission immediately north of V1647Ori signi?cantly brightens during the eruptive phase where it is seen as McNeil’s Nebula.The di?use r band emission due to HH23,which may be driven by V1647Ori,is highlighted by the box in the upper center.
A color rendition of this image is available in the electronic version of the journal.
10101010μm νF ν (W /m 2)Fig. 2.—Quiescent and Eruptive Spectral Energy Distributions.The optical and near-IR SEDs are shown for the quiescent state (squares )and during eruption (circles ).Data acquired by the SDSS and at the USNO are indicated by ?lled symbols.The open squares are the 2MASS JHK observations and the open circles are the r and i band eruptive phase measurements of Reipurth &Aspin (2004).
μm ?m Fig.3.—Changes in Spectral Energy Distributions.The observed magnitude di?er-ences (squares )are compared against pure dust clearing events for ?A z =-2m (circles )and ?A z =-4m (triangles )and for R V =3.1(solid )or R V =5.5(open )dust laws.
10101010μm νF ν (W /m 2)Fig. 4.—Modeling the Quiescent Spectral Energy Distribution.Observed pre-eruption SED compared with an M0photosphere (3800K)seen under a line of sight red-dening of A z =6.4m for R V =3.1(solid line )and R V =5.5(dotted line ).Excess emission is evident longward of 1.2μm (J ).
1010101010μm νF ν (W /m 2)Fig. 5.—Modeling the Eruptive Component.This ?gure compares the observed ?ux increase (?lled squares )against a 7000K blackbody viewed under (R V =3.1(solid ),
5.5(dotted ))extinctions of A z =3.2m and
6.4m ,scaled to match the observed change in the z band ?ux.The triangles show the required intrinsic ?ux increase in the case of a ?A z =?3.2m partial dust clearing for R V =3.1(?lled )and 5.5(open ).