Massoud Pedram 1, Chi-Ying Tsui 2 and Qing Wu 1
1 Department of EE-Systems University of Southern California Los Angeles, CA 90089, USA
2 Department of Electrical Engineering HK University of Science and Technology Clear Water Bay, Kowloon, Hong Kong
Abstract - We describe an integrated model of the
hardware and the battery sub-systems in battery-powered VLSI systems. We demonstrate that,under this model and for a fixed operating voltage, the battery life decreases super-linearly as the average current dissipation increases. With the aid of analyses and empirical studies, we then show that the implications of this phenomenon are far-reaching and change our perceptions about low power design techniques targeted toward battery-powered VLSI circuits.
1. Integrated battery-hardware model
With the rapid progress in the semiconductor technology, the chip density and clock frequency have increased significantly, making power consumption in digital CMOS circuits a major concern for VLSI designers. High power consumption reduces the battery service life in portable microelectronic devices. Minimizing the power consumption and maximizing the battery life are however not the same. This is mainly because the battery capacity changes as a function of the average discharge current.
Low power design techniques can be divided into two categories:
1. Techniques that minimize the switched
capacitance under a fixed voltage level and circuit speed requirement. In digital circuits,this is equivalent to minimizing the average current per clock cycle [1].2. Techniques that lower the supply voltage
level to reduce the energy dissipation, but make up for loss in the circuit speed by a combination of architectural transformations
and circuit optimizations. These techniques can be divided into static voltage scaling [1]and dynamic voltage scaling [2].
The effectiveness of these techniques can be evaluated by using appropriate metrics, such as power, energy, and delay. These metrics have been used in different applications to guide optimization toward the best solution. It has been recently shown in [2] that the energy-delay product is an effective criterion for comparing various low power design methodologies and techniques.
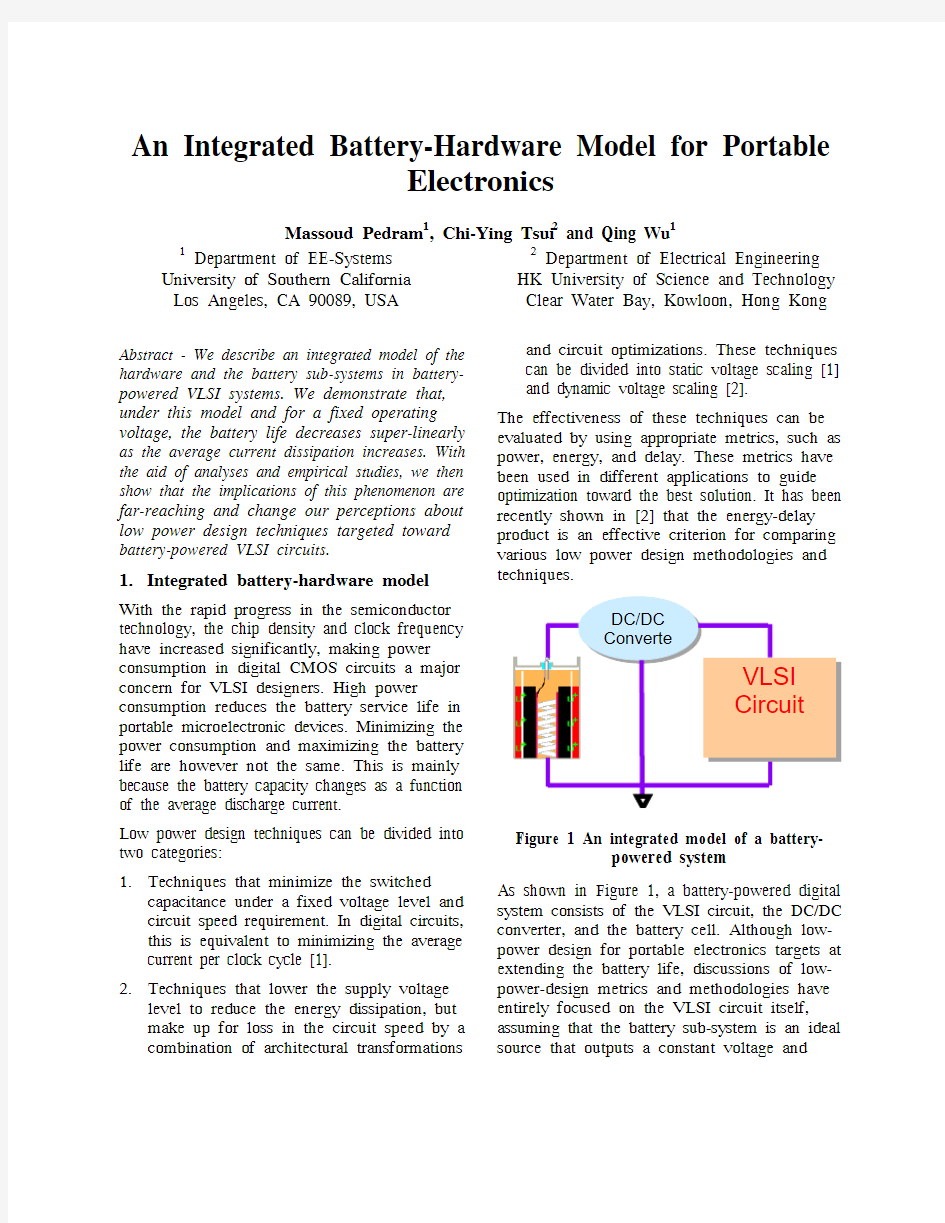
Figure 1 An integrated model of a battery-powered system As shown in Figure 1, a battery-powered digital system consists of the VLSI circuit, the DC/DC converter, and the battery cell. Although low-power design for portable electronics targets at extending the battery life, discussions of low-power-design metrics and methodologies have entirely focused on the VLSI circuit itself,assuming that the battery sub-system is an ideal source that outputs a constant voltage and
An Integrated Battery-Hardware Model for Portable
Electronics
DC/DC Converte
VLSI Circuit
stores/delivers a fixed amount of energy. In reality however, the energy stored in a battery cannot be extracted/used to the full extent. In some situations, even 50% energy delivery is not possible. This phenomenon is caused by the fact that the “actual capacity” of the battery depends strongly on the mean value and the profile (i.e. the density function) of the current discharged from the battery. More precisely, a higher portion of the battery capacity is wasted at a higher discharge current. Furthermore, even for the same mean value of discharge current, the battery efficiency may change by as much as 25% as a result of different probability density functions for the discharge current. Notice that some energy is also wasted in the DC/DC converter. This is relatively small and independent of the output current demand for a well-designed DC/DC converter. For battery-powered devices, low-power design methodologies and techniques should thus target to extend the battery lifetime (and not necessarily minimize the power dissipation) while meeting the performance requirements.
2. Background on battery technologies Many types of batteries are being used in a wide range of applications [4]-[8]. They can be divided into the primary batteries (non-rechargeable) and the secondary batteries (rechargeable). Batteries can also be classified based on the electrochemical material used for their positive and negative electrodes or the type of their electrolytes. Examples include NiCd, NiZn, AgZn, Zn-Air, NiMH, Lithium-Ion Liquid, Lithium-Ion Polymer, and Lithium-Alloy Polymer. The volumetric energy density of these batteries range from 100 Wh/l for NiCd batteries to 350 Wh/l for Lithium Alloy Polymer batteries. Similarly, the gravimetric energy density of these batteries range from 30-40 Wh/kg for NiCd batteries to 220-230 Wh/kg for the Lithium Alloy Polymer battery [8]. Batteries come in many different operating voltages, maximum continuous (or pulsed) current discharge rates, operating temperature range, weights and form factors and vary widely in terms of their environmental safety factors. Among these, NiMH and Lithium-Ion batteries are currently the most widely used batteries for a range of applications, from mobile phones to notebook and smaller handheld computers and terminals.
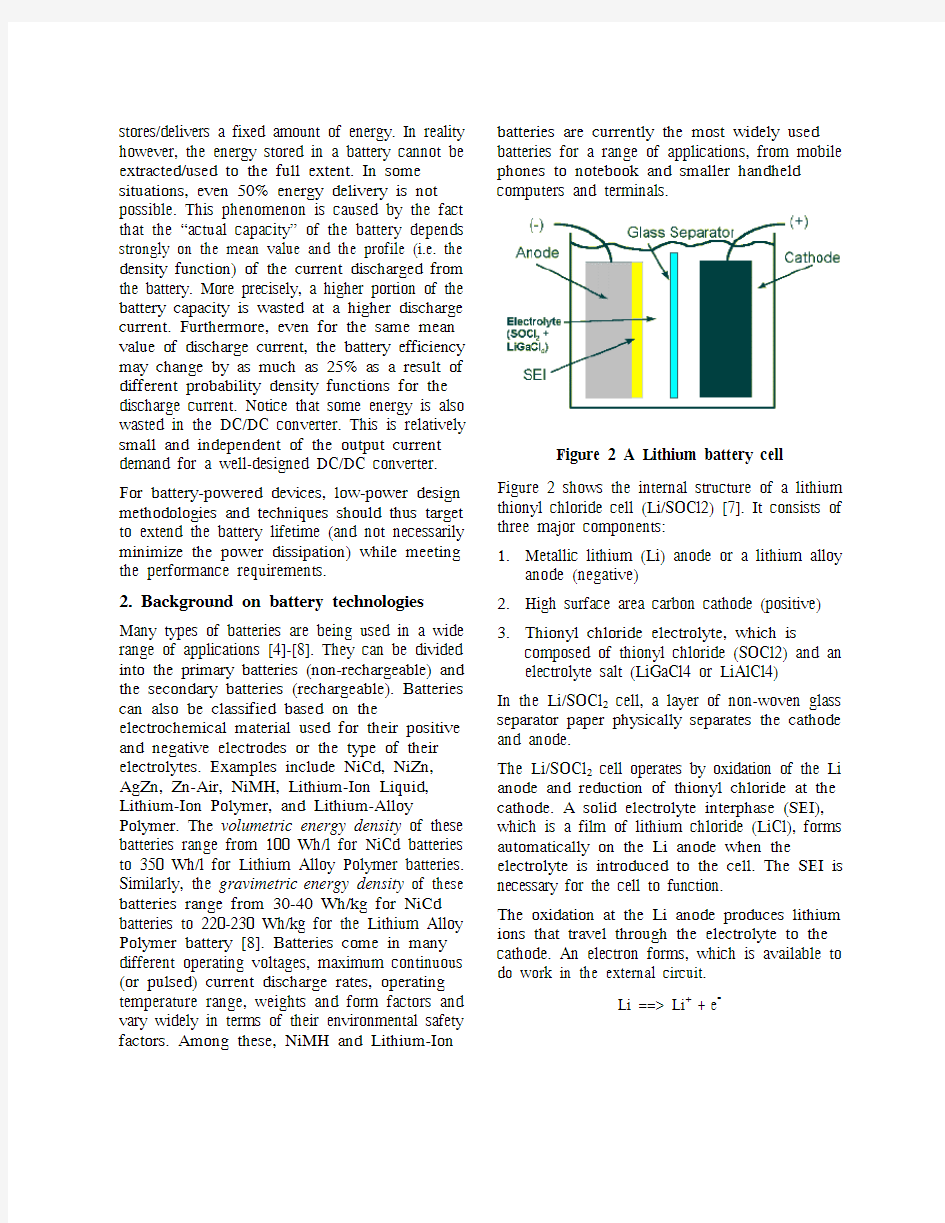
Figure 2 A Lithium battery cell Figure 2 shows the internal structure of a lithium thionyl chloride cell (Li/SOCl2) [7]. It consists of three major components:
1.Metallic lithium (Li) anode or a lithium alloy
anode (negative)
2.High surface area carbon cathode (positive)
3.Thionyl chloride electrolyte, which is
composed of thionyl chloride (SOCl2) and an electrolyte salt (LiGaCl4 or LiAlCl4)
In the Li/SOCl2 cell, a layer of non-woven glass separator paper physically separates the cathode and anode.
The Li/SOCl2 cell operates by oxidation of the Li anode and reduction of thionyl chloride at the cathode. A solid electrolyte interphase (SEI), which is a film of lithium chloride (LiCl), forms automatically on the Li anode when the electrolyte is introduced to the cell. The SEI is necessary for the cell to function.
The oxidation at the Li anode produces lithium ions that travel through the electrolyte to the cathode. An electron forms, which is available to do work in the external circuit.
Li ==> Li+ + e
-
At the cathode, thionyl chloride is reduced on the surface of the carbon producing chloride ions, sulfur dioxide, and sulfur.
2 SOCl2 + 4e- ==> 4 Cl - + SO2 + S
The lithium ions, from the anode, combine with the chloride ions, from the cathode, to form insoluble solid lithium chloride (LiCl) which is deposited in the carbon cathode at the reaction site. The sites where the LiCl is deposited in the cathode become inactive and they are no longer available for further reaction.
It is important to understand that the carbon cathode does not take part in the cell reaction. The carbon cathode only provides active sites where reactions take place. When all the sites become blocked with LiCl or become inaccessible, the cell
stops functioning.
3. Battery characteristics
The capacity CAP0 of a battery cell depends on the masses of the anode, cathode, and electrolyte. Optimum capacity can be achieved by correctly balancing the amounts of these materials relative to each other.
The circuit that battery powers cannot use all the capacity of the battery. This phenomenon is reflected in the so-called rate-capacity of the battery. The rate-capacity is the actual percentage of the battery capacity that can be used by the circuit. It is a function of the discharge current of the battery. Figure 3 shows a typical relationship between rate-capacity and discharge current for the battery in Figure 2.
We can see that, at very low current discharge rate, the battery loses about 15% of its capacity due to self-discharge. However, we are mostly interested in the capacity loss when the discharge current is high.
We still use the example of the Li/SOCl2 Cell in Figure 2, the discharge of Li/SOCl2 cells results in the formation of LiCl in the cathode. If the cell is discharged at low rates (< 2.0 mA/cm2), the LiCl is evenly distributed throughout the carbon cathode which results in the efficient use of the active sites available for the reduction of SOCl2.
Figure 3 The rate-capacity of the battery
At rates above 2.0 mA/cm2, the reduction of SOCl2 occurs predominantly on the outer surfaces of the carbon cathode. The outer surface of the cathode effectively "freezes over" with LiCl (see Figure 4), and the inner active surfaces become inaccessible. Figure 5 shows a cross-sectional view of undischarged cathodes, high rate discharged cathodes (>2 mA/cm2), and low rate discharged cathodes (<2 mA/cm2). The “cathode freeze over” problem of the battery results in the loss of battery capacity we mentioned earlier.
Figure 4 The “cathode freeze over”
phenomenon of the Li/SOCl2 battery
The capacity loss due to high current discharge also exists for other batteries. Figure 5 shows this
characteristics for some NiMH batteries [5].
Discharge Current (mA/cm2
)
Rate-capacity (%)
Figure 5 The rate-capacity for commercial
NiMH batteries For convenience of modeling the rate-capacity behavior, we can interpret it in an equivalent way.Assume that the battery capacity is a constant CAP 0 and does not change as a function of the discharge current. Instead, we define the concept of battery discharge current as a function of the discharge current by the circuit: battery-discharge-current equals the circuit-current divided by the rate-capacity . Decreasing the capacity by a factor x is equivalent to increasing the battery discharge current by the same factor x .
4. Summary of research results
By analyzing the integrated battery-hardware model, we have derived the following results:1. Common perception is that the battery
discharge rate (i.e., the inverse of the battery service life) is linearly related to the average power consumption in the VLSI circuit.However, in reality, the battery discharge rate is super-linearly related to the average power consumption in the VLSI circuit, as illustrated in Figure 6.2. Even with identical mean value, different
current profiles (i.e., current density functions) may result in very different actual power dissipations . The actual power dissipation is defined as the product of battery
output voltage and actual discharge current (which is defined in previous section).
3. When using an integrated battery-hardware
model, the optimal supply voltage (i.e. one that minimizes the actual Energy-Delay Product) is lower than that obtained by assuming an ideal battery system.
Figure 6 The battery discharge rate versus
circuit power consumption
REFERENCES
[1]
J. Rabaey and M. Pedram, Low Power Design Methodologies , Kluwer Academic Publishers, 1996
[1] A. Chandrakasan, R. Brodersen, Low Power Digital
CMOS Design , Kluwer Academic Publishers, July 1995.[2] A. Chandrakasan, V. Gutnik, and T. Xanthopoulos,
“Data Driven Signal Processing: An Approach for Energy Efficient Computing”, Int’l Symposium on. Low Power Electronics and Design”, pp. 347-352, Aug.1996.[3] M. Horowitz, T. Indermaur, and R. Gonzalez, “Low-Power Digital Design”, IEEE Symposium on Low Power Electronics , pp.8-11, 1994.[4] M. Doyle, T. F. Fuller, and J. Newman, “Modeling of
Galvanostatic Charge and Discharge of the Lithium/Polymer/Insertion Cell”, J. Electrochem. Soc.,Vol. 140, No. 6, pp.1526-1533, Jun. 1993.[5] J. K. Erbacher and S. P. Vukson, “Commercial Nickel-Metal Hydride (Ni-MH) Technology Evaluation”, The Battery Conference , pp. 9-15, 1997[6] B. Nelson, “TMP Ultra-High Rate Discharge
Performance”, Battery Conference , pp. 139-143, 1997.[7] URL: https://www.doczj.com/doc/d11311665.html,
[8] URL: https://www.doczj.com/doc/d11311665.html,/technology.html
Normalized Discharge Current
R a t e -C a p a c i t y (%)
Average Circuit Power (W)
Battery Discharge Rate (1/sec)
Ideal case
Real case