JFreeChart使用教程(含下载、安装)
- 格式:doc
- 大小:546.00 KB
- 文档页数:22
required libraries can be linked into your Java program. The following image shows the structure of the directories and files :Add complete path of jfreechart-1.0.18.jar and jcommon-1.0.22.jar files to the CLASSPATH as shown below :OS DescriptionWindows Append the Strings “C:\ jfreechart-1.0.18\lib\ jfreechart-1.0.18.jar” and “C:\ jfreechart-1.0.18\lib\ jcommon-1.0.22.jar” to the end of the user variable CLASSPATH Linux Export CLASSPATH=$CLASSPATH: /usr/share/jfreechart-1.0.18/lib/jfreechart-1.0.18.jar: /usr/share/jfreechart-1.0.18/lib/jcommon-1.0.22.jarJFREECHART ARCHITECTUREThis chapter explains basic class level and application level architectures of JFreeChart to give you an idea about how JFreeChart interacts with different classes and how it fits in your Java based application.Class Level ArchitectureThe class level architecture explains how various classes from the library interacts with each other to create various types of charts.Following is the detail of the units used in the above block diagram :Units DescriptionFile The source having user input to be used for creating a dataset inthe file.Database The source having user input to be used for creating a dataset inthe database.Create Dataset Accepts the dataset and stores the dataset into dataset object. General Dataset This type of dataset is mainly used for pie charts.Category Dataset This type of dataset is used for bar chart, line chart,etc.Series Dataset This type of dataset is used for storing series of data and constructline charts.Series Collection Dataset The different categories of series datasets are added to seriescollection dataset. This type of dataset is used for XYLine Charts. Create Chart This is the method which is executed to create final chart.Frame/Image The chart is displayed on a Swing Frame or an image is created. Application Level ArchitectureThe application level architecture explains where JFreeChart library sits inside a Java Application.The client program receives user data and then it make use standard Java and JFreeChart APIs based on requirements to generate the output in the form of either a frame, which can be displayed directly inside the application or independently in the image formats such as JPEG or PNG.JFREECHART - PIE CHARTIn a pie chart, the arc length of each sector is proportional to the quantity it represents. This chapter demonstrates how we can use JFreeChart to create Pie Chart from a given set of business data.Business dataThe following example depicts mobile sale with the help of a pie chart. Following is a list of different mobile brands and their sale unitsperday.S.N.Mobile Brands Sales UNITSperday1Iphone 5S202Samsung Grand203MOTO G404Nokia Lumia10AWT Based ApplicationFollowing is the code to create Pie Chart from the above given information. This code helps you embed a pie chart in any AWT based application.import javax.swing.JPanel;import org.jfree.chart.ChartFactory;import org.jfree.chart.ChartPanel;import org.jfree.chart.JFreeChart;import org.jfree.data.general.DefaultPieDataset;import org.jfree.data.general.PieDataset;import org.jfree.ui.ApplicationFrame;import org.jfree.ui.RefineryUtilities;public class PieChart_AWT extends ApplicationFrame{public PieChart_AWT(String title ){super( title );setContentPane(createDemoPanel());}private static PieDataset createDataset(){DefaultPieDataset dataset =new DefaultPieDataset();dataset.setValue("IPhone 5s",new Double(20));dataset.setValue("SamSung Grand",new Double(20));dataset.setValue("MotoG",new Double(40));dataset.setValue("Nokia Lumia",new Double(10));return dataset;}private static JFreeChart createChart(PieDataset dataset ){JFreeChart chart =ChartFactory.createPieChart("Mobile Sales",// chart titledataset,// datatrue,// include legendtrue,false);return chart;}public static JPanel createDemoPanel(){JFreeChart chart = createChart(createDataset());return new ChartPanel( chart );}public static void main(String[] args ){PieChart_AWT demo =new PieChart_AWT("Mobile Sales");demo.setSize(560,367);RefineryUtilities.centerFrameOnScreen( demo );demo.setVisible(true);}}dataset,// datatrue,// include legendtrue,false);int width =640;/* Width of the image */int height =480;/* Height of the image */File pieChart =new File("PieChart.jpeg");ChartUtilities.saveChartAsJPEG( pieChart , chart , width , height );}}Let us keep the above Java code in PieChart.java file, and then compile and run it from command prompt as follows :$javac PieChart.java$java PieChartIf everything is fine , it will compile and run to create JPEG image file named PieChart.jpeg in your current directory.JFREECHART - BAR CHARTThis chapter demonstrates how we can use JFreeChart to create Bar Chart from a given set of business data.A bar chart uses different orientation horizontalorvertical bars to show comparisons in various categories. One axis domainaxis of the chart shows the specific domain being compared, and the other axis rangeaxis represents discrete values.Business DataThe following example depicts various car statistics with the help of a bar chart. Following is a list of car brands along with their different characteristics, which we will show using a bar chart :Car Speed User Rating Millage SafetyFiat 1.0 3.0 5.0 5.oAudi 5.0 6.010.0 4.0Ford 4.0 2.0 3.0 6.0AWT Based ApplicationFollowing is the code to create Bar Chart from the above given information. This code helps you embed a bar chart in any AWT based application.import org.jfree.chart.ChartFactory;import org.jfree.chart.ChartPanel;import org.jfree.chart.JFreeChart;import org.jfree.chart.plot.PlotOrientation;import org.jfree.data.category.CategoryDataset;import org.jfree.data.category.DefaultCategoryDataset;import org.jfree.ui.ApplicationFrame;import org.jfree.ui.RefineryUtilities;public class BarChart_AWT extends ApplicationFrame{public BarChart_AWT(String applicationTitle ,String chartTitle ){super( applicationTitle );JFreeChart barChart =ChartFactory.createBarChart(chartTitle,"Category","Score",createDataset(),PlotOrientation.VERTICAL,true,true,false);ChartPanel chartPanel =new ChartPanel( barChart );chartPanel.setPreferredSize(new java.awt.Dimension(560,367));setContentPane( chartPanel );}private CategoryDataset createDataset(){final String fiat ="FIAT";final String audi ="AUDI";final String ford ="FORD";final String speed ="Speed";final String millage ="Millage";final String userrating ="User Rating";final String safety ="safety";final DefaultCategoryDataset dataset =new DefaultCategoryDataset();dataset.addValue(1.0, fiat , speed );dataset.addValue(3.0, fiat , userrating );dataset.addValue(5.0, fiat , millage );dataset.addValue(5.0, fiat , safety );dataset.addValue(5.0, audi , speed );dataset.addValue(6.0, audi , userrating );dataset.addValue(10.0, audi , millage );dataset.addValue(4.0, audi , safety );dataset.addValue(4.0, ford , speed );dataset.addValue(2.0, ford , userrating );dataset.addValue(3.0, ford , millage );dataset.addValue(6.0, ford , safety );return dataset;}public static void main(String[] args ){BarChart_AWT chart =new BarChart_AWT("Car Usage Statistics","Which car do you like?);chart.pack( );RefineryUtilities.centerFrameOnScreen( chart );chart.setVisible( true );}}Let us keep the above Java code in BarChart_AWT.java file, and then compile and run it from command prompt as follows :$javac BarChar_AWT.java$java BarChart_AWTIf everything is fine , it will compile and run to generate the following Bar Graph :JPEG Image CreationLet us re-write above example to generate a JPEG image from command line. import java.io.*;import org.jfree.chart.ChartFactory;import org.jfree.chart.JFreeChart;import org.jfree.chart.plot.PlotOrientation;import org.jfree.data.category.DefaultCategoryDataset;import org.jfree.chart.ChartUtilities;public class BarChart{public static void main(String[] args )throws Exception{final String fiat ="FIAT";final String audi ="AUDI";final String ford ="FORD";final String speed ="Speed";final String millage ="Millage";final String userrating ="User Rating";final String safety ="safety";final DefaultCategoryDataset dataset =new DefaultCategoryDataset();dataset.addValue(1.0, fiat , speed );dataset.addValue(3.0, fiat , userrating );dataset.addValue(5.0, fiat , millage );dataset.addValue(5.0, fiat , safety );dataset.addValue(5.0, audi , speed );dataset.addValue(6.0, audi , userrating );dataset.addValue(10.0, audi , millage );dataset.addValue(4.0, audi , safety );dataset.addValue(4.0, ford , speed );dataset.addValue(2.0, ford , userrating );dataset.addValue(3.0, ford , millage );dataset.addValue(6.0, ford , safety );JFreeChart barChart =ChartFactory.createBarChart("CAR USAGE STATIStICS","Category","Score",dataset,PlotOrientation.VERTICAL,true,true,false);int width =640;/* Width of the image */int height =480;/* Height of the image */File BarChart=new File("BarChart.jpeg");ChartUtilities.saveChartAsJPEG(BarChart, barChart , width , height );}}Let us keep the above Java code in BarChart.java file, and then compile and run it from command prompt as follows:$javac BarChart.java$java BarChartIf everything is fine , it will compile and run to create JPEG image file named BarChart.jpeg in your current directoryLoading [MathJax]/jax/output/HTML-CSS/jax.js。


Jfreechart图形开发指南廊坊市大华夏神农信息技术有限公司2010年05月修订历史记录目录目录1.引言 (3)2.JFREECHART开发 (3)2.1绘制曲线图 (3)2.2绘制柱状图 (5)2.3绘制三维柱状图 (6)2.4绘制平面饼状图 (7)2.5绘制3D饼状图 (8)2.6绘制时序图 (9)2.7绘制甘特图 (11)3.依赖的JAR包 (13)1.引言JFreeChart是JAVA平台上的一个开放的图表绘制类库。
它完全使用JAVA语言编写,是为applications, applets, servlets 以及JSP等使用所设计。
JFreeChart可生成饼图(pie chart s)、柱状图(bar charts)、散点图(scatter plots)、时序图(time series)、甘特图(G antt charts)等等多种图表,并且可以产生PNG和JPEG格式的输出,还可以与PDF和EX CEL关联。
JFreeChart目前是最好的java图形解决方案,基本能够解决目前的图形方面的需求。
2.jfreechart开发2.1绘制曲线图工具类< LineChart >示例代码:图样:2.2绘制柱状图工具类<BarChart>示例代码:图样:2.3绘制三维柱状图工具类<BarChart>示例代码:图样:2.4绘制平面饼状图工具类<PieChart>示例代码:图样:2.5绘制3D饼状图工具类<PieChart3D>示例代码:图样:2.6绘制时序图工具类< TimeSeriesChart> 示例代码:图样:2.7绘制甘特图工具类< TimeSeriesChart> 示例代码:图样:3.依赖的jar包。
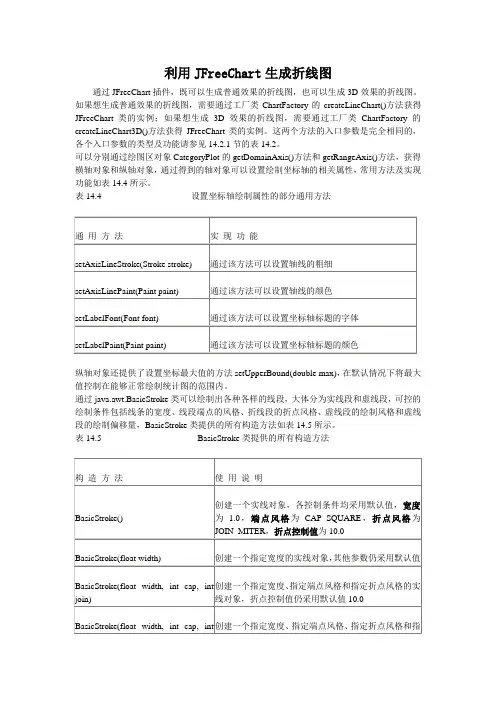
利用JFreeChart生成折线图通过JFreeChart插件,既可以生成普通效果的折线图,也可以生成3D效果的折线图。
如果想生成普通效果的折线图,需要通过工厂类ChartFactory的createLineChart()方法获得JFreeChart类的实例;如果想生成3D效果的折线图,需要通过工厂类ChartFactory的createLineChart3D()方法获得JFreeChart类的实例。
这两个方法的入口参数是完全相同的,各个入口参数的类型及功能请参见14.2.1节的表14.2。
可以分别通过绘图区对象CategoryPlot的getDomainAxis()方法和getRangeAxis()方法,获得横轴对象和纵轴对象,通过得到的轴对象可以设置绘制坐标轴的相关属性,常用方法及实现功能如表14.4所示。
表14.4 设置坐标轴绘制属性的部分通用方法纵轴对象还提供了设置坐标最大值的方法setUpperBound(double max),在默认情况下将最大值控制在能够正常绘制统计图的范围内。
通过java.awt.BasicStroke类可以绘制出各种各样的线段,大体分为实线段和虚线段,可控的绘制条件包括线条的宽度、线段端点的风格、折线段的折点风格、虚线段的绘制风格和虚线段的绘制偏移量,BasicStroke类提供的所有构造方法如表14.5所示。
表14.5 BasicStroke类提供的所有构造方法线段端点的修饰风格有3种,分别由3个常量表示,具体信息如表14.6所示。
表14.6 线段端点修饰风格简介线段折点的修饰风格同样有3种,也由3个常量表示,具体信息如表14.7所示。
表14.7 线段折点修饰风格简介入口参数dash 用来定义虚线,为float 型数组,当dash 数组由偶数个元素组成时,索引值为偶数的元素值代表虚线段的长度,索引值为奇数的元素值代表两个虚线段之间的空白部分的长度,需要注意的是,数组的索引值是从0开始的;当数组中只有一个元素时,例如dash={6},等同于dash={6,6}。
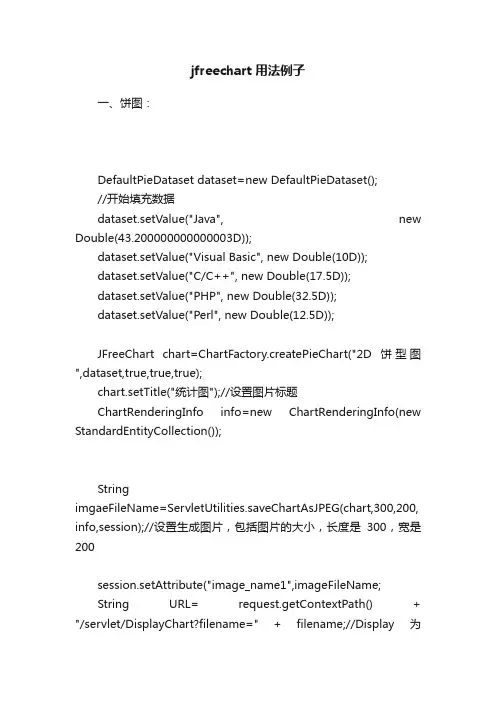
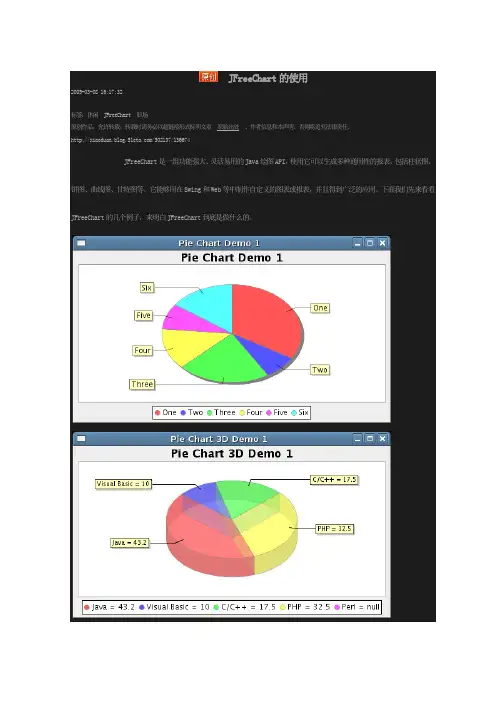
jfreechart用法例子一、饼图:DefaultPieDataset dataset=new DefaultPieDataset();//开始填充数据dataset.setValue("Java", new Double(43.200000000000003D));dataset.setValue("Visual Basic", new Double(10D));dataset.setValue("C/C++", new Double(17.5D));dataset.setValue("PHP", new Double(32.5D));dataset.setValue("Perl", new Double(12.5D));JFreeChart chart=ChartFactory.createPieChart("2D饼型图",dataset,true,true,true);chart.setTitle("统计图");//设置图片标题ChartRenderingInfo info=new ChartRenderingInfo(new StandardEntityCollection());StringimgaeFileName=ServletUtilities.saveChartAsJPEG(chart,300,200, info,session);//设置生成图片,包括图片的大小,长度是300,宽是200session.setAttribute("image_name1",imageFileName;String URL= request.getContextPath() + "/servlet/DisplayChart?filename=" + filename;//Display为org.jfree.chart.servlet.DisplayChartsession.setAttribute("image_url1",URL);显示代码:(以下显示代码不注明了,是一样的,只是session中的属性名不同而已,大家注意区别)" width=300 height=200 border=0 usemap="#<%=session.getAttribute("image_name1") %>">二、3D饼图DefaultPieDataset defaultpiedataset = new DefaultPieDataset();defaultpiedataset.setValue("Java", new Double(43.200000000000003D));defaultpiedataset.setValue("Visual Basic", new Double(10D));defaultpiedataset.setValue("C/C++", new Double(17.5D));defaultpiedataset.setValue("PHP", new Double(32.5D));defaultpiedataset.setValue("Perl", new Double(12.5D));JFreeChart jfreechart = ChartFactory.createPieChart3D("3D 饼图", defaultpiedataset, true, false, false);PiePlot3D pieplot3d = (PiePlot3D)jfreechart.getPlot();String imageFileName2= ServletUtilities.saveChartAsJPEG(jfreechart,300,200,session);session.setAttribute("image_name2",imageFileName2);StringURL=request.getContextPath()+"/servlet/DisplayChart?filename ="+imageFileName2;session.setAttribute("image_url2",URL);三、柱图DefaultCategoryDataset dataset=new DefaultCategoryDataset();//设置数据源dataset.setValue(new Double(43.200000000000003D),"图解","Java" );dataset.setValue( new Double(10D),"图解","Visual Basic");dataset.setValue(new Double(17.5D), "图解","C/C++");dataset.setValue(new Double(32.5D), "图解","PHP");dataset.setValue(new Double(12.5D), "图解","Perl");//添加数据,参数包括名称和数值JFreeChart chart1=ChartFactory.createBarChart3D("柱图","大人物","地盘", dataset,PlotOrientation.VERTICAL,false,false,false);CategoryPlot plot=chart1.getCategoryPlot();//BarRenderer3D renderer1=new BarRenderer3D();final BarRenderer renderer1 = (BarRenderer)plot.getRenderer();renderer1.setItemLabelGenerator(new StandardCategoryItemLabelGenerator());renderer1.setItemLabelsVisible(true);//显示每个柱子上的数据renderer1.setItemMargin(0.1);//设置每个柱子之间的距离plot.setRenderer(renderer1);//让上面对柱子的设置生效StringimageFileName=ServletUtilities.saveChartAsJPEG(chart1,300,20 0,session);//生成图片,包括图片的大小session.setAttribute("image_name3",imageFileName);StringURL=request.getContextPath()+"/servlet/DisplayChart?filename ="+imageFileName;session.setAttribute("image_url3",URL);四、线图DefaultCategoryDataset defaultcategorydataset = new DefaultCategoryDataset();defaultcategorydataset.addValue(212D, "Classes", "JDK 1.0");defaultcategorydataset.addValue(504D, "Classes", "JDK 1.1");defaultcategorydataset.addValue(1520D, "Classes", "SDK 1.2");defaultcategorydataset.addValue(1842D, "Classes", "SDK 1.3");defaultcategorydataset.addValue(2991D, "Classes", "SDK 1.4");JFreeChart jfreechart = ChartFactory.createLineChart("Java Standard Class Library", "线图", "Class Count", defaultcategorydataset, PlotOrientation.VERTICAL, false, true, false);jfreechart.addSubtitle(new TextTitle("Number of Classes By Release"));TextTitle texttitle = new TextTitle("线图");texttitle.setFont(new Font("SansSerif", 0, 10));texttitle.setPosition(RectangleEdge.BOTTOM);texttitle.setHorizontalAlignment(HorizontalAlignment.RIGH T);jfreechart.addSubtitle(texttitle);jfreechart.setBackgroundPaint(Color.white);CategoryPlot categoryplot = (CategoryPlot)jfreechart.getPlot();categoryplot.setBackgroundPaint(Color.lightGray);categoryplot.setRangeGridlinePaint(Color.white);NumberAxis numberaxis = (NumberAxis)categoryplot.getRangeAxis();numberaxis.setStandardTickUnits(NumberAxis.createInteger TickUnits());LineAndShapeRenderer lineandshaperenderer = (LineAndShapeRenderer)categoryplot.getRenderer();lineandshaperenderer.setShapesVisible(true);lineandshaperenderer.setDrawOutlines(true);lineandshaperenderer.setUseFillPaint(true);lineandshaperenderer.setFillPaint(Color.white);String imageFileName4 = ServletUtilities.saveChartAsJPEG(jfreechart,500,500,session);session.setAttribute("image_name4",imageFileName4);StringURL=request.getContextPath()+"/servlet/DisplayChart?filename ="+imageFileName4;session.setAttribute("image_url4",URL);五、时序图TimeSeries timeseries = new TimeSeries("Random Data");Dayday = new Day(1, 1, 1990);double d = 100D;for(int j = 0; j < 4000; j++)try{d = (d + Math.random()) - 0.5D;timeseries.add(day, new Double(d));day = (Day)day.next();}catch(SeriesException seriesexception){System.err.println("Error adding to series");}XYDataset xydataset = new TimeSeriesCollection(timeseries);JFreeChart jfreechart = ChartFactory.createTimeSeriesChart("时序图", "Day", "Value", xydataset, false, false, false);XYPlot xyplot = (XYPlot)jfreechart.getPlot();XYLineAndShapeRenderer xylineandshaperenderer = new XYLineAndShapeRenderer();xylineandshaperenderer.setDefaultShapesVisible(false);xylineandshaperenderer.setSeriesStroke(0, new BasicStroke(0.5F, 1, 1, 5F, new float[] {5F, 10F}, 0.0F));xyplot.setRenderer(xylineandshaperenderer);String imageFileName5 = ServletUtilities.saveChartAsJPEG(jfreechart,500,500,session);session.setAttribute("image_name5",imageFileName5);StringURL=request.getContextPath()+"/servlet/DisplayChart?filename ="+imageFileName5;session.setAttribute("image_url5",URL);。
代码大概三百行吧,不多。
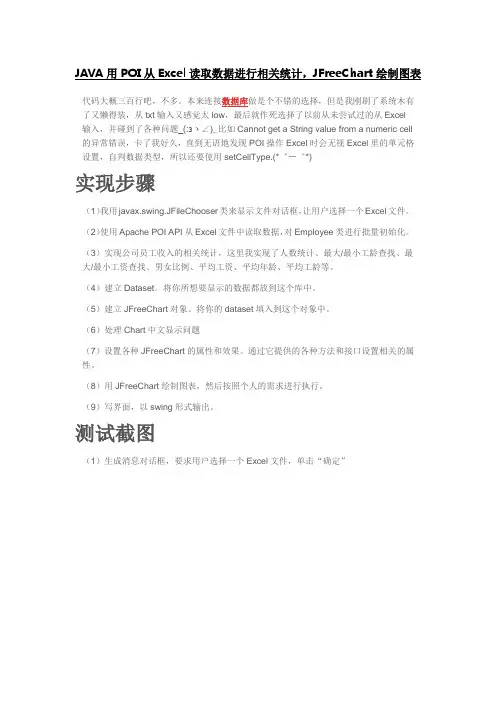
本来连接数据库做是个不错的选择,但是我刚刷了系统木有了又懒得装,从txt输入又感觉太low,最后就作死选择了以前从未尝试过的从Excel 输入,并碰到了各种问题_(:зゝ∠)_比如Cannot get a String value from a numeric cell 的异常错误,卡了我好久,直到无语地发现POI操作Excel时会无视Excel里的单元格设置,自判数据类型,所以还要使用setCellType.(*゜ー゜*)实现步骤(1)我用javax.swing.JFileChooser类来显示文件对话框,让用户选择一个Excel文件。
(2)使用Apache POI API从Excel文件中读取数据,对Employee类进行批量初始化。
(3)实现公司员工收入的相关统计,这里我实现了人数统计、最大/最小工龄查找、最大/最小工资查找、男女比例、平均工资、平均年龄、平均工龄等。
(4)建立Dataset。
将你所想要显示的数据都放到这个库中。
(5)建立JFreeChart对象。
将你的dataset填入到这个对象中。
(6)处理Chart中文显示问题(7)设置各种JFreeChart的属性和效果。
通过它提供的各种方法和接口设置相关的属性。
(8)用JFreeChart绘制图表,然后按照个人的需求进行执行。
(9)写界面,以swing形式输出。
测试截图(1)生成消息对话框,要求用户选择一个Excel文件,单击“确定”(2)生成文件选择器,我打开了存放在D盘BUAA文件夹里的Employee.xls补充说明:这是文件Employee.xls的内容(3)进行相关统计,并通过消息对话框显示统计结果(4)询问用户是否生成统计图,如果点“取消”或“否”,运行完毕;如果点是,系统将生成统计图,以员工为横轴,以年龄、工龄、工资三项数值为纵轴。
图表的显示效果会根据窗口大小自适应,改变横纵轴的比例尺。
下面是窗口最大化的效果程序清单1 2 3 4 5 6 7 8public class Employee {String ID;String name;String sex;double age;double workAge;double sal;9 10 11 12 13 14 15 16 17 18 19 20 21 22 23 24 25 26 27 28 29 30 31 32public void setID(String ID) {this.ID = ID;}public void setName(String name) { = name;}public void setSex(String sex) {this.sex = sex;}public void setAge(double age) {this.age = age;}public void setWorkAge(double workAge) {this.workAge = workAge;}public void setSal(double sal) {this.sal = sal;}}一共有两个:Employee.Java和EmployeeStatic.javaEmployeeStatic.javaimport java.awt.RenderingHints;import java.io.FileInputStream;import java.util.ArrayList;import java.util.List;import javax.swing.JFileChooser;import javax.swing.JOptionPane;//org.apache.poiimport ermodel.HSSFSheet;import ermodel.HSSFWorkbook;import ermodel.Cell;import ermodel.Row;import ermodel.XSSFSheet;import ermodel.XSSFWorkbook;//org.jfreeimport org.jfree.chart.ChartFactory;import org.jfree.chart.ChartFrame;import org.jfree.chart.JFreeChart;import org.jfree.chart.axis.CategoryAxis;import org.jfree.chart.axis.ValueAxis;import org.jfree.chart.plot.CategoryPlot;import org.jfree.chart.plot.PlotOrientation;import org.jfree.chart.title.TextTitle;import org.jfree.data.category.CategoryDataset;import org.jfree.data.category.DefaultCategoryDataset;import java.awt.Font;public class EmployeeStatics {public static void main(String[] args) {// TODO Auto-generated method stubJOptionPane.showMessageDialog(null,"\n您好,我是智能机器人小紫\n\n" + "很高兴为您提供员工数据统计分析服务\n\n"+ "请选择一个Excel文件 ^_^\n\n","选择Excel文件",RMATION_MESSAGE); ArrayList<Employee> Employees = null;//从Excel文件读取数据try {Employees = ReadFileUsingFileChooser();} catch (Exception e) {// TODO Auto-generated catch blocke.printStackTrace();}//人数统计int n = Employees.size();//最大最小工资、工龄、工资初始化int maxA = 0;int minA = Integer.MAX_VALUE;int maxWA = 0;int minWA = Integer.MAX_VALUE;int maxS = 0;int minS = Integer.MAX_VALUE;//男女性别人数int M = 0;int FM = 0;double sumS, sumA, sumWA, avgS, avgA, avgWA, MFM; sumS = sumA = sumWA = 0;//遍历实现相关统计for (Employee e : Employees) {if(e.age > maxA)maxA = (int) e.age;if(e.age < minA)minA = (int) e.age;if(e.workAge > maxWA)maxWA = (int) e.workAge;if(e.workAge < minWA)minWA = (int) e.workAge;if(e.sal > maxS)maxS = (int) e.sal;if(e.sal < minS)minS = (int) e.sal;sumS += e.sal;sumA += e.age;sumWA += e.workAge;if (e.sex.equals("男"))M++;if (e.sex.equals("女"))FM++;}//计算平均值avgS = sumS / n;avgA = sumA / n;avgWA = sumWA / n;//计算男女比例MFM = (double) M / FM;JOptionPane.showMessageDialog(null,"员工人数为" + n + ",男女比例为" + MFM + "(男/女)\n"+ "平均年龄为" + avgA + ",平均工龄为" + avgWA + ",平均工资为" + avgS + "\n"+ "最高年龄为" + maxA + ",最低年龄为" + minA + ",最高工龄为" + maxWA + ",最低工龄为" + minWA + "\n"+ "最高工资为" + maxS + "K,最低工资为" + minS + "K\n");int option=JOptionPane.YES_OPTION;option=JOptionPane.showConfirmDialog(null, "是否显示员工数据统计图?");if (option==JOptionPane.YES_OPTION) {CategoryDataset dataset = getDataSet(Employees);//构造chartJFreeChart chart = ChartFactory.createBarChart3D("员工数据统计图", // 图表标题"员工属性", // 目录轴的显示标签--横轴"数值", // 数值轴的显示标签--纵轴dataset, // 数据集PlotOrientation.VERTICAL, // 图表方向:水平、true, // 是否显示图例(对于简单的柱状图必须false, // 是否生成工具false// 是否生成URL链接);//处理chart中文显示问题processChart(chart);//chart 以swing形式输出ChartFrame pieFrame = new ChartFrame("员工数据统计图", chart);pieFrame.pack();pieFrame.setVisible(true);}}public static ArrayList<Employee>ReadFileUsingFileChooser()throws Ex ception {// TODO Auto-generated method stubJFileChooser fileChooser = new JFileChooser();ArrayList temp = new ArrayList();if (fileChooser.showOpenDialog(null)==JFileChooser.APPROVE_OPTION) {java.io.File file = fileChooser.getSelectedFile();FileInputStream fileIn = new FileInputStream(file);//根据指定的文件输入流导入Excel从而产生Workbook对象HSSFWorkbook wb0 = new HSSFWorkbook(fileIn);//获取Excel文档中的第一个表单HSSFSheet sht0 = wb0.getSheetAt(0);//对Sheet中的每一行进行迭代int r;int rowNum = sht0.getPhysicalNumberOfRows();for (r = 1; r <= rowNum; r++) {Row row = sht0.getRow(r);if (row == null) {break;}//创建实体类Employee info=new Employee();//取出当前行第1个单元格数据,并封装在info实体stuName属性上row.getCell(0).(Cell.);info.setID(row.getCell(0).getStringCellValue());info.setName(row.getCell(1).getStringCellValue());info.setSex(row.getCell(2).getStringCellValue());info.setAge(row.getCell(3).getNumericCellValue());info.setWorkAge(row.getCell(4).getNumericCellValue());info.setSal(row.getCell(5).getNumericCellValue());temp.add(info);}fileIn.close();}else {System.out.println("No file selected");}return temp;}//获取一个演示用的组合数据集对象private static CategoryDatasetgetDataSet(ArrayList<Employee> Employe es) {DefaultCategoryDataset dataset = new DefaultCategoryDataset();for (Employee e : Employees){dataset.addValue(e.workAge, "工龄", );dataset.addValue(e.sal, "工资", );dataset.addValue(e.age, "年龄", );}return dataset;}//解决图表汉字显示问题private static void processChart(JFreeChart chart) {CategoryPlot plot = chart.getCategoryPlot();CategoryAxis domainAxis = plot.getDomainAxis();ValueAxis rAxis = plot.getRangeAxis();chart.getRenderingHints().put(RenderingHints.KEY_TEXT_ANTIALIASI NG,RenderingHints.VALUE_TEXT_ANTIALIAS_OFF);TextTitle textTitle = chart.getTitle();textTitle.setFont(new Font("宋体", Font.PLAIN, 20));domainAxis.setTickLabelFont(new Font("sans-serif", Font.PLAIN, 11));domainAxis.setLabelFont(new Font("宋体", Font.PLAIN, 12));rAxis.setTickLabelFont(new Font("sans-serif", Font.PLAIN, 12));rAxis.setLabelFont(new Font("宋体", Font.PLAIN, 12));chart.getLegend().setItemFont(new Font("宋体", Font.PLAIN, 12));// renderer.setItemLabelGenerator(newLabelGenerator(0.0));// renderer.setItemLabelFont(newFont("宋体", Font.PLAIN, 12));//renderer.setItemLabelsVisible(true);}}Employee.javapublic class Employee {String ID;String name;String sex;double age;double workAge;double sal;public void setID(String ID) {this.ID = ID;}public void setName(String name) { = name;}public void setSex(String sex) {this.sex = sex;}public void setAge(double age) {this.age = age;}public void setWorkAge(double workAge) { this.workAge = workAge;}public void setSal(double sal) {this.sal = sal;}}。
最近公司使用jfreechart来生成统计图,使用了折线图,饼图等,因为用的1.0.8a版的jfreechart,与1.0.0版本的地方有很多不同,而且图片生成清晰度比老版的高,如下是我做的demo.1.所需包(1) jfreechart-1.0.8a.jar(2) jcommon-1.0.12.jar2.运行环境JDK 1.53.源代码import java.awt.Color;import java.awt.Font;import java.io.File;import java.io.FileOutputStream;import java.text.DecimalFormat;import java.text.NumberFormat;import org.jfree.chart.ChartFactory;import org.jfree.chart.ChartUtilities;import org.jfree.chart.JFreeChart;import org.jfree.chart.axis.CategoryAxis;import org.jfree.chart.axis.CategoryLabelPositions;import org.jfree.chart.axis.NumberAxis;import org.jfree.chart.axis.V alueAxis;import bels.StandardCategoryItemLabelGenerator;import bels.StandardPieSectionLabelGenerator;import org.jfree.chart.plot.CategoryPlot;import org.jfree.chart.plot.PiePlot3D;import org.jfree.chart.plot.PlotOrientation;import org.jfree.chart.renderer.category.BarRenderer;import org.jfree.chart.renderer.category.LineAndShapeRenderer;import org.jfree.chart.renderer.category.StackedBarRenderer;import org.jfree.chart.title.TextTitle;import org.jfree.data.category.CategoryDataset;import org.jfree.data.general.DatasetUtilities;import org.jfree.data.general.DefaultPieDataset;import org.jfree.data.general.PieDataset;/*** 实际取色的时候一定要16位的,这样比较准确** @author new*/public class CreateChartServiceImpl{private static final String CHART_PA TH = "E:/test/";public static void main(String[] args){// TODO Auto-generated method stubCreateChartServiceImpl pm = new CreateChartServiceImpl();// 生成饼状图pm.makePieChart();// 生成单组柱状图pm.makeBarChart();// 生成多组柱状图pm.makeBarGroupChart();// 生成堆积柱状图pm.makeStackedBarChart();// 生成折线图pm.makeLineAndShapeChart();}/*** 生成折线图*/public void makeLineAndShapeChart(){double[][] data = new double[][]{{ 672, 766, 223, 540, 126 },{ 325, 521, 210, 340, 106 },{ 332, 256, 523, 240, 526 } };String[] rowKeys ={ "苹果", "梨子", "葡萄" };String[] columnKeys ={ "北京", "上海", "广州", "成都", "深圳" };CategoryDataset dataset = getBarData(data, rowKeys, columnKeys); createTimeXYChar("折线图", "x轴", "y轴", dataset, "lineAndShap.png"); }/*** 生成分组的柱状图*/public void makeBarGroupChart(){double[][] data = new double[][]{ 672, 766, 223, 540, 126 },{ 325, 521, 210, 340, 106 },{ 332, 256, 523, 240, 526 } };String[] rowKeys ={ "苹果", "梨子", "葡萄" };String[] columnKeys ={ "北京", "上海", "广州", "成都", "深圳" };CategoryDataset dataset = getBarData(data, rowKeys, columnKeys); createBarChart(dataset, "x坐标", "y坐标", "柱状图", "barGroup.png");}/*** 生成柱状图*/public void makeBarChart(){double[][] data = new double[][]{{ 672, 766, 223, 540, 126 } };String[] rowKeys ={ "苹果" };String[] columnKeys ={ "北京", "上海", "广州", "成都", "深圳" };CategoryDataset dataset = getBarData(data, rowKeys, columnKeys); createBarChart(dataset, "x坐标", "y坐标", "柱状图", "bar.png");}/*** 生成堆栈柱状图*/public void makeStackedBarChart(){double[][] data = new double[][]{{ 0.21, 0.66, 0.23, 0.40, 0.26 },{ 0.25, 0.21, 0.10, 0.40, 0.16 } };String[] rowKeys ={ "苹果", "梨子" };String[] columnKeys ={ "北京", "上海", "广州", "成都", "深圳" };CategoryDataset dataset = getBarData(data, rowKeys, columnKeys); createStackedBarChart(dataset, "x坐标", "y坐标", "柱状图", "stsckedBar.png"); }/*** 生成饼状图*/public void makePieChart(){double[] data ={ 9, 91 };String[] keys ={ "失败率", "成功率" };createValidityComparePimChar(getDataPieSetByUtil(data, keys), "饼状图", "pie2.png", keys);}// 柱状图,折线图数据集public CategoryDataset getBarData(double[][] data, String[] rowKeys, String[] columnKeys){return DatasetUtilities.createCategoryDataset(rowKeys, columnKeys, data);}// 饼状图数据集public PieDataset getDataPieSetByUtil(double[] data,String[] datadescription){if (data != null && datadescription != null){if (data.length == datadescription.length){DefaultPieDataset dataset = new DefaultPieDataset();for (int i = 0; i < data.length; i++){dataset.setValue(datadescription[i], data[i]);}return dataset;}}return null;/*** 柱状图**@param dataset 数据集* @param xName x轴的说明(如种类,时间等)* @param yName y轴的说明(如速度,时间等)* @param chartTitle 图标题* @param charName 生成图片的名字* @return*/public String createBarChart(CategoryDataset dataset, String xName,String yName, String chartTitle, String charName){JFreeChart chart = ChartFactory.createBarChart(chartTitle, // 图表标题xName, // 目录轴的显示标签yName, // 数值轴的显示标签dataset, // 数据集PlotOrientation.VERTICAL, // 图表方向:水平、垂直true, // 是否显示图例(对于简单的柱状图必须是false)false, // 是否生成工具false // 是否生成URL链接);Font labelFont = new Font("SansSerif", Font.TRUETYPE_FONT, 12);/** V ALUE_TEXT_ANTIALIAS_OFF表示将文字的抗锯齿关闭,* 使用的关闭抗锯齿后,字体尽量选择12到14号的宋体字,这样文字最清晰好看*///chart.getRenderingHints().put(RenderingHints.KEY_TEXT_ANTIALIASING,RenderingHints.V ALUE_TEXT_ANTIALIAS_OFF);chart.setTextAntiAlias(false);chart.setBackgroundPaint(Color.white);// create plotCategoryPlot plot = chart.getCategoryPlot();// 设置横虚线可见plot.setRangeGridlinesVisible(true);// 虚线色彩plot.setRangeGridlinePaint(Color.gray);// 数据轴精度NumberAxis vn = (NumberAxis) plot.getRangeAxis();// vn.setAutoRangeIncludesZero(true);DecimalFormat df = new DecimalFormat("#0.00");vn.setNumberFormatOverride(df); // 数据轴数据标签的显示格式// x轴设置CategoryAxis domainAxis = plot.getDomainAxis();domainAxis.setLabelFont(labelFont);// 轴标题domainAxis.setTickLabelFont(labelFont);// 轴数值// Lable(Math.PI/3.0)度倾斜// domainAxis.setCategoryLabelPositions(CategoryLabelPositions// .createUpRotationLabelPositions(Math.PI / 3.0));domainAxis.setMaximumCategoryLabelWidthRatio(0.6f);// 横轴上的Lable 是否完整显示// 设置距离图片左端距离domainAxis.setLowerMargin(0.1);// 设置距离图片右端距离domainAxis.setUpperMargin(0.1);// 设置columnKey 是否间隔显示// domainAxis.setSkipCategoryLabelsToFit(true);plot.setDomainAxis(domainAxis);// 设置柱图背景色(注意,系统取色的时候要使用16位的模式来查看颜色编码,这样比较准确)plot.setBackgroundPaint(new Color(255, 255, 204));// y轴设置ValueAxis rangeAxis = plot.getRangeAxis();rangeAxis.setLabelFont(labelFont);rangeAxis.setTickLabelFont(labelFont);// 设置最高的一个Item 与图片顶端的距离rangeAxis.setUpperMargin(0.15);// 设置最低的一个Item 与图片底端的距离rangeAxis.setLowerMargin(0.15);plot.setRangeAxis(rangeAxis);BarRenderer renderer = new BarRenderer();// 设置柱子宽度renderer.setMaximumBarWidth(0.05);// 设置柱子高度renderer.setMinimumBarLength(0.2);// 设置柱子边框颜色renderer.setBaseOutlinePaint(Color.BLACK);// 设置柱子边框可见renderer.setDrawBarOutline(true);// // 设置柱的颜色renderer.setSeriesPaint(0, new Color(204, 255, 255));renderer.setSeriesPaint(1, new Color(153, 204, 255));renderer.setSeriesPaint(2, new Color(51, 204, 204));// 设置每个地区所包含的平行柱的之间距离renderer.setItemMargin(0.0);// 显示每个柱的数值,并修改该数值的字体属性renderer.setIncludeBaseInRange(true);renderer.setBaseItemLabelGenerator(new StandardCategoryItemLabelGenerator()); renderer.setBaseItemLabelsVisible(true);plot.setRenderer(renderer);// 设置柱的透明度plot.setForegroundAlpha(1.0f);FileOutputStream fos_jpg = null;try{isChartPathExist(CHART_PATH);String chartName = CHART_PA TH + charName;fos_jpg = new FileOutputStream(chartName);ChartUtilities.writeChartAsPNG(fos_jpg, chart, 500, 500, true, 10);return chartName;}catch (Exception e){e.printStackTrace();return null;}finally{try{fos_jpg.close();}catch (Exception e){e.printStackTrace();}}/*** 横向图** @param dataset 数据集* @param xName x轴的说明(如种类,时间等)* @param yName y轴的说明(如速度,时间等)* @param chartTitle 图标题* @param charName 生成图片的名字* @return*/public String createHorizontalBarChart(CategoryDataset dataset,String xName, String yName, String chartTitle, String charName){JFreeChart chart = ChartFactory.createBarChart(chartTitle, // 图表标题xName, // 目录轴的显示标签yName, // 数值轴的显示标签dataset, // 数据集PlotOrientation.VERTICAL, // 图表方向:水平、垂直true, // 是否显示图例(对于简单的柱状图必须是false)false, // 是否生成工具false // 是否生成URL链接);CategoryPlot plot = chart.getCategoryPlot();// 数据轴精度NumberAxis vn = (NumberAxis) plot.getRangeAxis();//设置刻度必须从0开始// vn.setAutoRangeIncludesZero(true);DecimalFormat df = new DecimalFormat("#0.00");vn.setNumberFormatOverride(df); // 数据轴数据标签的显示格式CategoryAxis domainAxis = plot.getDomainAxis();domainAxis.setCategoryLabelPositions(CategoryLabelPositions.UP_45); // 横轴上的// LableFont labelFont = new Font("SansSerif", Font.TRUETYPE_FONT, 12);domainAxis.setLabelFont(labelFont);// 轴标题domainAxis.setTickLabelFont(labelFont);// 轴数值domainAxis.setMaximumCategoryLabelWidthRatio(0.8f);// 横轴上的Lable 是否完整显示// domainAxis.setVerticalCategoryLabels(false);plot.setDomainAxis(domainAxis);ValueAxis rangeAxis = plot.getRangeAxis();// 设置最高的一个Item 与图片顶端的距离rangeAxis.setUpperMargin(0.15);// 设置最低的一个Item 与图片底端的距离rangeAxis.setLowerMargin(0.15);plot.setRangeAxis(rangeAxis);BarRenderer renderer = new BarRenderer();// 设置柱子宽度renderer.setMaximumBarWidth(0.03);// 设置柱子高度renderer.setMinimumBarLength(30);renderer.setBaseOutlinePaint(Color.BLACK);// 设置柱的颜色renderer.setSeriesPaint(0, Color.GREEN);renderer.setSeriesPaint(1, new Color(0, 0, 255));// 设置每个地区所包含的平行柱的之间距离renderer.setItemMargin(0.5);// 显示每个柱的数值,并修改该数值的字体属性renderer.setBaseItemLabelGenerator(new StandardCategoryItemLabelGenerator()); // 设置柱的数值可见renderer.setBaseItemLabelsVisible(true);plot.setRenderer(renderer);// 设置柱的透明度plot.setForegroundAlpha(0.6f);FileOutputStream fos_jpg = null;try{isChartPathExist(CHART_PATH);String chartName = CHART_PA TH + charName;fos_jpg = new FileOutputStream(chartName);ChartUtilities.writeChartAsPNG(fos_jpg, chart, 500, 500, true, 10);return chartName;}catch (Exception e){e.printStackTrace();return null;}finally{try{fos_jpg.close();}catch (Exception e){e.printStackTrace();}}}/*** 饼状图** @param dataset 数据集* @param chartTitle 图标题* @param charName 生成图的名字* @param pieKeys 分饼的名字集* @return*/public String createValidityComparePimChar(PieDataset dataset,String chartTitle, String charName, String[] pieKeys){JFreeChart chart = ChartFactory.createPieChart3D(chartTitle, // chart// titledataset,// datatrue,// include legendtrue, false);// 使下说明标签字体清晰,去锯齿类似于//chart.getRenderingHints().put(RenderingHints.KEY_TEXT_ANTIALIASING,RenderingHints.V ALUE_TEXT_ANTIALIAS_OFF);的效果chart.setTextAntiAlias(false);// 图片背景色chart.setBackgroundPaint(Color.white);// 设置图标题的字体重新设置titleFont font = new Font("隶书", Font.BOLD, 25);TextTitle title = new TextTitle(chartTitle);title.setFont(font);chart.setTitle(title);PiePlot3D plot = (PiePlot3D) chart.getPlot();// 图片中显示百分比:默认方式// 指定饼图轮廓线的颜色// plot.setBaseSectionOutlinePaint(Color.BLACK);// plot.setBaseSectionPaint(Color.BLACK);// 设置无数据时的信息plot.setNoDataMessage("无对应的数据,请重新查询。
jfreechart画折线图的⽅法JFreeChart 是开放源代码站点 上的⼀个 JAVA 项⽬,它主要⽤来各种各样的图表,这些图表包括:饼图、柱状图 ( 普通柱状图以及堆栈柱状图 )、线图、区域图、分布图、混合图、⽢特图以及⼀些仪表盘等等。
应⽤jfreechart来画图需要两个jar包:jfreechart.jar和jcommon.jar,。
下⾯是⼀个画折线图的例⼦:package yuth.jfree.demo;/*** 使⽤ categoryDataset 数据集创建折线图* 当数据多时,在JPanel中⽆法完全看到横坐标的值,显⽰为省略号。
* 解决⽅法:* ⽅法1、将报表保存为图⽚时,设置图⽚的宽度⾜够⼤(2000或3000),图⽚可以显⽰横坐标值。
* 这种⽅法治标不治本,所以有了第2种⽅法* ⽅法2、设置X轴上的Lable让其45度倾斜。
*/import java.awt.BasicStroke;import java.awt.Color;import java.awt.Dimension;import java.awt.Font;import java.awt.geom.Ellipse2D;import java.io.File;import java.io.IOException;import .URL;import java.text.DecimalFormat;import java.util.Random;import javax.swing.ImageIcon;import javax.swing.JPanel;import org.jfree.chart.ChartFactory;import org.jfree.chart.ChartPanel;import org.jfree.chart.ChartUtilities;import org.jfree.chart.JFreeChart;import org.jfree.chart.axis.CategoryAxis;import org.jfree.chart.axis.CategoryLabelPositions;import org.jfree.chart.axis.NumberAxis;import bels.StandardCategoryItemLabelGenerator;import org.jfree.chart.plot.CategoryPlot;import org.jfree.chart.plot.PlotOrientation;import org.jfree.chart.renderer.category.LineAndShapeRenderer;import org.jfree.chart.title.TextTitle;import org.jfree.data.category.CategoryDataset;import org.jfree.data.category.DefaultCategoryDataset;import org.jfree.ui.ApplicationFrame;import org.jfree.ui.HorizontalAlignment;import org.jfree.ui.RectangleEdge;import org.jfree.ui.RectangleInsets;import org.jfree.ui.RefineryUtilities;public class LineChartDemo1 extends ApplicationFrame {private static final long serialVersionUID = -6354350604313079793L;/* synthetic */static Class class$demo$LineChartDemo1;public LineChartDemo1(String string) {super(string);JPanel jpanel = createDemoPanel();jpanel.setPreferredSize(new Dimension(500, 270));setContentPane(jpanel);}/*** 如何区分不同的图例:根据DefaultCategoryDataset.addValue()的第⼆个参数是否相同来区分。

About the T utorialThis tutorial describes various ways to incorporate JFreeChart in Java-based standalone and web-based applications. The tutorial is categorized into various chapters to provide a comprehensive and easy understanding of JFreeChart programming with Java applications.AudienceThis reference has been prepared for beginners to help them understand the basic-to-advanced concepts related to JFreeChart library.PrerequisitesBefore you start practicing the examples given in the tutorial, it is expected that you have a basic understanding of Java programming with JDK1.6 or later versions, Swing, file management and database management in Java.Copyright & Disclaimer© Copyright 2017 by Tutorials Point (I) Pvt. Ltd.All the content and graphics published in this e-book are the property of Tutorials Point (I) Pvt. Ltd. The user of this e-book is prohibited to reuse, retain, copy, distribute or republish any contents or a part of the contents of this e-book in any manner without written consent of the publisher.We strive to update the contents of our website and tutorials as timely and as precisely as possibly; however, the contents may contain inaccuracies or errors. Tutorials Point (I) provides no guarantee regarding the accuracy, timeliness, or completeness of our website or its contents including this tutorial. If you discover any errors on our website or in this tutorial, please notify us at **************************T able of ContentsAbout the Tutorial (i)Audience (i)Prerequisites (i)Copyright & Disclaimer (i)Table of Contents .................................................................................................................................... i i 1.JFREECHART ─ OVERVIE W (1)What is JFreeChart? (1)Why JFreeChart? (1)2.JFREECHART ─ INSTALL ATION (2)System Requirements (2)Installing JFreeChart (2)3.JFREECHART ─ ARCHITE CTURE (6)Class Level Architecture (6)Application Level Architecture (7)4.JFREECHART ─ REFEREN CED APIS (8)ChartFactory Class (8)ChartFrame Class (9)ChartPanel Class (10)ChartUtilities Class (10)JFreeChart Class (11)PiePlot Class (12)PiePlot3D Class (12)PlotOrientation Class (13)XYPlot Class (14)XYLineAndShapeRenderer Class (15)XYItemRenderer general datasets (16)PieDataset (16)DefaultPieDataset Class (16)SeriesException Class (17)DefaultCategoryDataset (17)Series Datasets (18)XYDataset (18)XYZDataset (18)XYSeries (18)XYSeriesCollection (19)Default XYZDataset (20)Time Series in JFreeCharts (20)TimeSeriesCollection (21)Second (22)Frames in JFreeCharts (22)ApplicationFrame (23)RefineryUtilities (23)5.JFREECHART ─ PIE CHA RT (24)Business data (24)AWT Based Application (24)JPEG Image Creation (26)6.JFREECHART ─ BAR CHA RT (28)Business Data (28)AWT Based Application (28)7.JFREECHART ─ LINE CH ART (33)Business Data (33)AWT Based Application (33)JPEG Image Creation (35)8.JFREECHART ─ XY CHAR T (37)Business Data (37)AWT Based Application (38)JPEG Image Creation (40)9.JFREECHART ─ 3D PIE/BAR CHART (43)3D Pie chart (43)3D Bar Chart (45)10.JFREECHART ─ BUBBLE CHART (48)Business Data (48)AWT Based Application (48)JPEG Image Creation (51)11.JFREECHART ─ TIMESER IES CHART (54)Business Data (54)AWT Based Application (54)JPEG Image Creation (56)12.JFREECHART ─ FILE IN TERFACE (59)Business Data (59)Chart Generation Based on File (59)13.JFREECHART ─ DATABAS E INTERFACE (62)Business Data (62)Chart Generation Using Database (62)JFreeChart6A chart is a graphical representation of information. There are various tools available, which can be used to create different types of charts. The JFreeChart project was founded in February 2000, by David Gilbert. Today, it is the most widely used charting library among Java developers.This tutorial will help you understand what exactly JFreeChart is, why is it required, and the various ways to create different types of charts within a Java-based application or independently.What is JFreeChart?JfreeChart is an open source library developed in Java. It can be used within Java based applications to create a wide range of charts. By using JFreeChart, we can create all the major type of 2D and 3D charts such as pie chart, bar chart, line chart, XY chart and 3D charts. Why JFreeChart?JFreeChart is open source and 100% free, which permits usage in the commercial applications without any cost. We have enlisted here some more points in favor of why you should use JFreeChart:∙It comes with well documented APIs, which makes it quite easy to understand. ∙ It supports a wide range of chart types such as Pie Chart, Line Chart, Bar Chart, Area Chart and 3D charts.∙ JFreeChart is easy to extend and can be used in both, the client-side, as well as the server-side applications.∙ It supports multiple output formats like PNG, JPEG, PDF, SVG etc.∙It allows extensive customizations of charts. Consider a situation where you are developing an application and you need to show the data in the form of charts, and the data itself is populated dynamically. In such case, displaying the data in the form of charts using JFreeChart programming is very simple.1.JFreeChart 7JFreeChart is popular for its efficient chart creation and user-friendly installation setup. This chapter describes the process of setting up JFreeChart on Windows and Linux. User administration is needed while installing JFreeChart.System RequirementsInstalling JFreeChartTo install JFreeChart, there are three following steps viz …Step 1: Verifying Java InstallationTo verify Java installation, open the console and execute the following java command:2.Once Java installation is done properly, then you should get the following output for both the operating systems:If you do not have Java installed, then install the Java Software Development Kit (SDK) from the link:/technetwork/java/javase/downloads/index.htmlWe assume that you have installed Java 1.7.0_60 version before proceeding for this tutorial.Step 2: Setting JAVA EnvironmentSet the JAVA_HOME environment variable to point to the base directory location where Java is installed on your machine. For example,Append Java compiler location to System Path.Verify the command java -version from the command prompted as explained above.Step 3: Installing JFreeChart8Download the latest version of JFreeChart.zip from the link /jfreechart/download/. Unzip the downloaded file at any location from where required libraries can be linked into your Java program. The following image shows the structure of the directories and files:Add complete path of jfreechart-1.0.18.jar and jcommon-1.0.22.jar files to the CLASSPATH as shown below:9JFreeChart10This chapter explains basic class level and application level architectures of JFreeChart to give you an idea about how JFreeChart interacts with different classes and how it fits in your Java based application.Class Level ArchitectureThe class level architecture explains how various classes from the library interact with each other to create various types of charts.Following is the detail of the units used in the above block diagram:3.JFreeChartApplication Level ArchitectureThe application level architecture explains where JFreeChart library sits inside a Java Application.The client program receives user data and then it uses standard Java and JFreeChart APIs based on requirements to generate the output in the form of either a frame, which can be displayed directly inside the application or independently in the image formats such as JPEG or PNG.11JFreeChart12In this chapter, we will discuss about some of the important packages, classes, and methods from JFreeChart library. These packages, classes, and methods are the most frequently used while creating a variety of charts using JFreeChart library.ChartFactory ClassChartFactory is an abstract class under the org.jfree.chart package. It provides a collection of utility methods for generating standard charts. Following is a list of few of the important methods:Class ConstructorClass Methods4.ChartFrame ClassChartFrame class under the org.jfree.chart package, provides all frame related functions and utilities. ChartFrame class inherits functionalities from parent classes such as Frame, Window, Container, and Component classes.13Class ConstructorClass MethodChartPanel ClassChartPanel class from the org.jfree.chart package is used as a swing GUI component for displaying JfreeChart object.Class Constructor14Class MethodChartUtilities ClassCharUtilites class from the org.jfree.chart package provides a collection of utility methods of JFreeCharts including methods for converting charts into image file format such as PNG, JPEG, and creating HTML image maps.Class ConstructorClass Method15JFreeChart ClassJFreeChart class is the core class under the org.jfree.chart package. This class provides JFreeChart method to create bar charts, line charts, pie charts, and xy plots including time series data.Class ConstructorClass MethodPiePlot ClassThis class is a part of org.jfree.chart.plot package and extends Plot class from the same package. This class provides methods to create Pie Plots.Class Constructor16Class MethodPiePlot3D ClassPiePlot3D class is a subclass of PiePlot class under the same package. Hence, this class has the same features as PiePlot class, except it is used to create 3D plots.Class ConstructorClass Method17PlotOrientation ClassThis is a serialized class available in org.jfree.chart.plot package and it is used to show the orientation of a 2D plot. The orientation can either be vertical or horizontal. It sets the orientation of Y-axis. A conventional plot has a vertical Y- axis.Field summaryClass MethodXYPlot ClassThis is a general class available in org.jfree.chart.plot package and it is used for the plotting data in the form of (x,y) pairs. This plot can use data from any other class that implements the XYDataSet Interface. XYPlot makes use of a XYItemRenderer to draw each point on the plot.1819Class ConstructorClass MethodNumberAxis ClassThis class is available in org.jfree.chart.axispackage and it can access the numerical data of any axis. When we set the range of any axis to default, it fits according to the range of the data. But using NumberAxis, class we can set the lower margin and upper margin of domain and range axes.Class ConstructorClass MethodXYLineAndShapeRenderer ClassThis is the class, available under org.jfree.chart.renderer.xy package, which takes care of connecting data points with lines and draws shapes at each data point. This renderer class is designed for use with the XYPlot class.Class ConstructorClass Method20XYItemRenderer general datasetsThis is an interface for rendering the format of a single (x, y) item on a XYPlot. The package is org.Jfree.data.general, which has classes and interfaces to define different types of datasets to construct charts.PieDatasetThis is an interface used as a general purpose dataset, where values are associated with keys. As the name suggests, you can use this dataset to supply data for pie charts. This interface extends KeyedValues and DataSet interfaces. All the methods used for this interface are taken from KeyedValues, Values, and Dataset interfaces.DefaultPieDataset ClassThis is a Default implementation class of a PieDataset interface.Class ConstructorClass Method21SeriesException ClassThis is an exception class. It raises an exception occurred in the time series of data in the dataset. Exceptions are raised on the occurrence of duplicate or invalid data. The time series must not be applied with duplicates and the format must be valid. DefaultCategoryDatasetThis is a default implementation class of CategoryDataset interface.Class ConstructorClass Method22Refer JFreeChart API for more information on various other methods and fields.Series DatasetsThe series dataset is used by XY charts. The package is org.Jfree.data.xy, which contains classes and interfaces belonging to xy charts. The core interface is XYDataset. XYDatasetThis is an interface through which data in the form of (x,y) items can be accessed. As the name suggests, you can use this dataset to serve XY chart. Some of the methods in this interface are taken from SeriesDateset interface.XYZDatasetThis is an interface through which data in the form of (x,y,z) items can be accessed. As the name suggests, you can use this dataset to serve XYZ chart. Some of the methods in this interface are taken from SeriesDateset.XYSeriesThis is a class, which represents a sequence of zero or more data items in the form (x, y). By default, the items in the series are sorted into ascending order by x-value, and duplicate x-values are permitted. Both the sorting and duplicate defaults can be changed in the constructor. Y-values can be denoted as null to represent missing values.Class Constructor23Class MethodThe above method is used in the tutorial example. If you want to learn the remaining methods and fields, please refer JFreeChart API.XYSeriesCollectionXYSeriesCollection class has parent classes like AbstractIntervelDataset, AbstractXYDatset, AbstractSeriesDataset and AbstractDataset. Some of the methods in this class belong to parent classes of this class.Class ConstructorClass Method2425Refer JFreeChart API for the remaining methods and fields.Default XYZDatasetDefaultXYZDataset class have parent classes like AbstractIntervelDataset, AbstractXYDatset, AbstractSeriesDataset, AbstractDataset and AbstractXYZDataset. Some of the methods in this class belong to parent classes of this class.Class ConstructorClass MethodPlease refer JFreeChart API for the remaining methods and fields.Time Series in JFreeChartsThe package is org.jfree.data.time . This package contains classes and interfaces, which are used for the time related data.TimeSeriesThis class represents a sequence of data items in the form of period values, where period is some instance ofRegularTimePeriod abstract class such as Time, Day, Hour, Minute, and Second classes.Class ConstructorClass MethodRefer JFreeChart API for the remaining methods and fields.TimeSeriesCollectionThis is a class used as a collection of time series objects. This class implements the XYDataset interface, as well as it extends IntervelXYDataset interface. This makes it convenient to collect series data objects.Class ConstructorClass Method26Please refer JFreeChart API for the remaining methods and fields.SecondThis class represents a second in a particular day. This class is immutable, which is a requirement for all RegularTimePeriod subclass.Class ConstructorClass Method27Please refer JFreeChart API for the remaining methods and fields.Frames in JFreeChartsThe package is org.jfree.ui. This is the package belongs to JCommons API of JFreeChart. It contains utility classes used for creating frames for pre-configured charts. ApplicationFrameThis is a base class for creating the main frame for simple applications. The frame listens for window closing events, and responds by shutting down the JVM. This is fine for small demo applications. For enterprise applications, you need to use something more robust. The main core methods in this class are taken from Component, Container, Window, Frame, and Jframe classes.Class ConstructorThis class helps to create AWT Frames. This is the reason for why we use this class as super class in this tutorial examples.The methods, which are taken form the parent classes are used for opening a frame, closinga frame, changing the size, changing the background or foreground color, and listeners.28RefineryUtilitiesThis is a class collection of utility methods relating to user interface.Class MethodThe above method is used in the tutorial example. Refer JFreeChart API for remaining methods and fields.29JFreeChartEnd of ebook previewIf you liked what you saw…Buy it from our store @ https://30。
JFreeChart的使用2009-03-08 16:17:32标签:休闲 JFreeChart 职场原创作品,允许转载,转载时请务必以超链接形式标明文章原始出处、作者信息和本声明。
否则将追究法律责任。
/502137/136674JFreeChart是一组功能强大、灵活易用的Java绘图API,使用它可以生成多种通用性的报表,包括柱状图、饼图、曲线图、甘特图等。
它能够用在Swing和Web等中制作自定义的图表或报表,并且得到广泛的应用。
下面我们先来看看JFreeChart 的几个例子,来明白JFreeChart到底是做什么的。
相信大家对JFreeChart有了简单的了解吧?先来看看JFreeChart的下载和环境配置。
JFreeChart是开放源代码的免费软件,下载链接为/sourceforge/jfreechart/jfreechart-1.0.12.zip,当前最新版本为1.0.12。
说明:1)source目录:为jfreechart的源码目录;2)lib目录:为包目录,我们需要关注的包为jfreechart-1.0.12.jar、gnujaxp.jar和jcommon-1.0.15.jar这三个包;3)根目录下的jfreechart-1.0.12-demo.jar是例子程序,大家双击后可看到其中有很多例子的运行结果。
这是我的开发环境:JDK:1.6MyEclipse:7.0 Milestone-1Tomcat:5.5.27在MyEclipse中新建一个项目JFreeChart,将以上三个jar包都放到该项目的类库中,或者干脆把lib目录下所有jar包都导入,这样更直接一些。
并且在WebRoot\WEB-INF\web.xml文件中增加如下配置:<servlet><servlet-name>DisplayChart</servlet-name><servlet-class>org.jfree.chart.servlet.DisplayChart</servlet-class> </servlet><servlet-mapping><servlet-name>DisplayChart</servlet-name><url-pattern>/DisplayChart</url-pattern></servlet-mapping>接下来先做一个例子,来测试该项目内JFreeChart是否可用。

最近公司使用jfreechart来生成统计图,使用了折线图,饼图等,因为用的1.0.8a版的jfreechart,与1.0.0版本的地方有很多不同,而且图片生成清晰度比老版的高,如下是我做的demo.1.所需包(1) jfreechart-1.0.8a.jar(2) jcommon-1.0.12.jar2.运行环境JDK 1.53.源代码import java.awt.Color;import java.awt.Font;import java.io.File;import java.io.FileOutputStream;import java.text.DecimalFormat;import java.text.NumberFormat;import org.jfree.chart.ChartFactory;import org.jfree.chart.ChartUtilities;import org.jfree.chart.JFreeChart;import org.jfree.chart.axis.CategoryAxis;import org.jfree.chart.axis.CategoryLabelPositions;import org.jfree.chart.axis.NumberAxis;import org.jfree.chart.axis.V alueAxis;import bels.StandardCategoryItemLabelGenerator;import bels.StandardPieSectionLabelGenerator;import org.jfree.chart.plot.CategoryPlot;import org.jfree.chart.plot.PiePlot3D;import org.jfree.chart.plot.PlotOrientation;import org.jfree.chart.renderer.category.BarRenderer;import org.jfree.chart.renderer.category.LineAndShapeRenderer;import org.jfree.chart.renderer.category.StackedBarRenderer;import org.jfree.chart.title.TextTitle;import org.jfree.data.category.CategoryDataset;import org.jfree.data.general.DatasetUtilities;import org.jfree.data.general.DefaultPieDataset;import org.jfree.data.general.PieDataset;/*** 实际取色的时候一定要16位的,这样比较准确** @author new*/public class CreateChartServiceImpl{private static final String CHART_PA TH = "E:/test/";public static void main(String[] args){// TODO Auto-generated method stubCreateChartServiceImpl pm = new CreateChartServiceImpl();// 生成饼状图pm.makePieChart();// 生成单组柱状图pm.makeBarChart();// 生成多组柱状图pm.makeBarGroupChart();// 生成堆积柱状图pm.makeStackedBarChart();// 生成折线图pm.makeLineAndShapeChart();}/*** 生成折线图*/public void makeLineAndShapeChart(){double[][] data = new double[][]{{ 672, 766, 223, 540, 126 },{ 325, 521, 210, 340, 106 },{ 332, 256, 523, 240, 526 } };String[] rowKeys ={ "苹果", "梨子", "葡萄" };String[] columnKeys ={ "北京", "上海", "广州", "成都", "深圳" };CategoryDataset dataset = getBarData(data, rowKeys, columnKeys); createTimeXYChar("折线图", "x轴", "y轴", dataset, "lineAndShap.png"); }/*** 生成分组的柱状图*/public void makeBarGroupChart(){double[][] data = new double[][]{ 672, 766, 223, 540, 126 },{ 325, 521, 210, 340, 106 },{ 332, 256, 523, 240, 526 } };String[] rowKeys ={ "苹果", "梨子", "葡萄" };String[] columnKeys ={ "北京", "上海", "广州", "成都", "深圳" };CategoryDataset dataset = getBarData(data, rowKeys, columnKeys); createBarChart(dataset, "x坐标", "y坐标", "柱状图", "barGroup.png");}/*** 生成柱状图*/public void makeBarChart(){double[][] data = new double[][]{{ 672, 766, 223, 540, 126 } };String[] rowKeys ={ "苹果" };String[] columnKeys ={ "北京", "上海", "广州", "成都", "深圳" };CategoryDataset dataset = getBarData(data, rowKeys, columnKeys); createBarChart(dataset, "x坐标", "y坐标", "柱状图", "bar.png");}/*** 生成堆栈柱状图*/public void makeStackedBarChart(){double[][] data = new double[][]{{ 0.21, 0.66, 0.23, 0.40, 0.26 },{ 0.25, 0.21, 0.10, 0.40, 0.16 } };String[] rowKeys ={ "苹果", "梨子" };String[] columnKeys ={ "北京", "上海", "广州", "成都", "深圳" };CategoryDataset dataset = getBarData(data, rowKeys, columnKeys); createStackedBarChart(dataset, "x坐标", "y坐标", "柱状图", "stsckedBar.png"); }/*** 生成饼状图*/public void makePieChart(){double[] data ={ 9, 91 };String[] keys ={ "失败率", "成功率" };createV alidityComparePimChar(getDataPieSetByUtil(data, keys), "饼状图", "pie2.png", keys);}// 柱状图,折线图数据集public CategoryDataset getBarData(double[][] data, String[] rowKeys, String[] columnKeys){return DatasetUtilities.createCategoryDataset(rowKeys, columnKeys, data);}// 饼状图数据集public PieDataset getDataPieSetByUtil(double[] data,String[] datadescription){if (data != null && datadescription != null){if (data.length == datadescription.length){DefaultPieDataset dataset = new DefaultPieDataset();for (int i = 0; i < data.length; i++){dataset.setV alue(datadescription[i], data[i]);}return dataset;}}return null;/*** 柱状图**@param dataset 数据集* @param xName x轴的说明(如种类,时间等)* @param yName y轴的说明(如速度,时间等)* @param chartTitle 图标题* @param charName 生成图片的名字* @return*/public String createBarChart(CategoryDataset dataset, String xName,String yName, String chartTitle, String charName){JFreeChart chart = ChartFactory.createBarChart(chartTitle, // 图表标题xName, // 目录轴的显示标签yName, // 数值轴的显示标签dataset, // 数据集PlotOrientation.VERTICAL, // 图表方向:水平、垂直true, // 是否显示图例(对于简单的柱状图必须是false)false, // 是否生成工具false // 是否生成URL链接);Font labelFont = new Font("SansSerif", Font.TRUETYPE_FONT, 12);/** V ALUE_TEXT_ANTIALIAS_OFF表示将文字的抗锯齿关闭,* 使用的关闭抗锯齿后,字体尽量选择12到14号的宋体字,这样文字最清晰好看*///chart.getRenderingHints().put(RenderingHints.KEY_TEXT_ANTIALIASING,RenderingHints.V ALUE_TEXT_ANTIALIAS_OFF);chart.setTextAntiAlias(false);chart.setBackgroundPaint(Color.white);// create plotCategoryPlot plot = chart.getCategoryPlot();// 设置横虚线可见plot.setRangeGridlinesVisible(true);// 虚线色彩plot.setRangeGridlinePaint(Color.gray);// 数据轴精度NumberAxis vn = (NumberAxis) plot.getRangeAxis();// vn.setAutoRangeIncludesZero(true);DecimalFormat df = new DecimalFormat("#0.00");vn.setNumberFormatOverride(df); // 数据轴数据标签的显示格式// x轴设置CategoryAxis domainAxis = plot.getDomainAxis();domainAxis.setLabelFont(labelFont);// 轴标题domainAxis.setTickLabelFont(labelFont);// 轴数值// Lable(Math.PI/3.0)度倾斜// domainAxis.setCategoryLabelPositions(CategoryLabelPositions// .createUpRotationLabelPositions(Math.PI / 3.0));domainAxis.setMaximumCategoryLabelWidthRatio(0.6f);// 横轴上的Lable 是否完整显示// 设置距离图片左端距离domainAxis.setLowerMargin(0.1);// 设置距离图片右端距离domainAxis.setUpperMargin(0.1);// 设置columnKey 是否间隔显示// domainAxis.setSkipCategoryLabelsToFit(true);plot.setDomainAxis(domainAxis);// 设置柱图背景色(注意,系统取色的时候要使用16位的模式来查看颜色编码,这样比较准确)plot.setBackgroundPaint(new Color(255, 255, 204));// y轴设置V alueAxis rangeAxis = plot.getRangeAxis();rangeAxis.setLabelFont(labelFont);rangeAxis.setTickLabelFont(labelFont);// 设置最高的一个Item 与图片顶端的距离rangeAxis.setUpperMargin(0.15);// 设置最低的一个Item 与图片底端的距离rangeAxis.setLowerMargin(0.15);plot.setRangeAxis(rangeAxis);BarRenderer renderer = new BarRenderer();// 设置柱子宽度renderer.setMaximumBarWidth(0.05);// 设置柱子高度renderer.setMinimumBarLength(0.2);// 设置柱子边框颜色renderer.setBaseOutlinePaint(Color.BLACK);// 设置柱子边框可见renderer.setDrawBarOutline(true);// // 设置柱的颜色renderer.setSeriesPaint(0, new Color(204, 255, 255));renderer.setSeriesPaint(1, new Color(153, 204, 255));renderer.setSeriesPaint(2, new Color(51, 204, 204));// 设置每个地区所包含的平行柱的之间距离renderer.setItemMargin(0.0);// 显示每个柱的数值,并修改该数值的字体属性renderer.setIncludeBaseInRange(true);renderer.setBaseItemLabelGenerator(new StandardCategoryItemLabelGenerator()); renderer.setBaseItemLabelsVisible(true);plot.setRenderer(renderer);// 设置柱的透明度plot.setForegroundAlpha(1.0f);FileOutputStream fos_jpg = null;try{isChartPathExist(CHART_PA TH);String chartName = CHART_PA TH + charName;fos_jpg = new FileOutputStream(chartName);ChartUtilities.writeChartAsPNG(fos_jpg, chart, 500, 500, true, 10);return chartName;}catch (Exception e){e.printStackTrace();return null;}finally{try{fos_jpg.close();}catch (Exception e){e.printStackTrace();}}/*** 横向图** @param dataset 数据集* @param xName x轴的说明(如种类,时间等)* @param yName y轴的说明(如速度,时间等)* @param chartTitle 图标题* @param charName 生成图片的名字* @return*/public String createHorizontalBarChart(CategoryDataset dataset,String xName, String yName, String chartTitle, String charName){JFreeChart chart = ChartFactory.createBarChart(chartTitle, // 图表标题xName, // 目录轴的显示标签yName, // 数值轴的显示标签dataset, // 数据集PlotOrientation.VERTICAL, // 图表方向:水平、垂直true, // 是否显示图例(对于简单的柱状图必须是false)false, // 是否生成工具false // 是否生成URL链接);CategoryPlot plot = chart.getCategoryPlot();// 数据轴精度NumberAxis vn = (NumberAxis) plot.getRangeAxis();//设置刻度必须从0开始// vn.setAutoRangeIncludesZero(true);DecimalFormat df = new DecimalFormat("#0.00");vn.setNumberFormatOverride(df); // 数据轴数据标签的显示格式CategoryAxis domainAxis = plot.getDomainAxis();domainAxis.setCategoryLabelPositions(CategoryLabelPositions.UP_45); // 横轴上的// LableFont labelFont = new Font("SansSerif", Font.TRUETYPE_FONT, 12);domainAxis.setLabelFont(labelFont);// 轴标题domainAxis.setTickLabelFont(labelFont);// 轴数值domainAxis.setMaximumCategoryLabelWidthRatio(0.8f);// 横轴上的Lable 是否完整显示// domainAxis.setV erticalCategoryLabels(false);plot.setDomainAxis(domainAxis);V alueAxis rangeAxis = plot.getRangeAxis();// 设置最高的一个Item 与图片顶端的距离rangeAxis.setUpperMargin(0.15);// 设置最低的一个Item 与图片底端的距离rangeAxis.setLowerMargin(0.15);plot.setRangeAxis(rangeAxis);BarRenderer renderer = new BarRenderer();// 设置柱子宽度renderer.setMaximumBarWidth(0.03);// 设置柱子高度renderer.setMinimumBarLength(30);renderer.setBaseOutlinePaint(Color.BLACK);// 设置柱的颜色renderer.setSeriesPaint(0, Color.GREEN);renderer.setSeriesPaint(1, new Color(0, 0, 255));// 设置每个地区所包含的平行柱的之间距离renderer.setItemMargin(0.5);// 显示每个柱的数值,并修改该数值的字体属性renderer.setBaseItemLabelGenerator(new StandardCategoryItemLabelGenerator()); // 设置柱的数值可见renderer.setBaseItemLabelsVisible(true);plot.setRenderer(renderer);// 设置柱的透明度plot.setForegroundAlpha(0.6f);FileOutputStream fos_jpg = null;try{isChartPathExist(CHART_PA TH);String chartName = CHART_PA TH + charName;fos_jpg = new FileOutputStream(chartName);ChartUtilities.writeChartAsPNG(fos_jpg, chart, 500, 500, true, 10);return chartName;}catch (Exception e){e.printStackTrace();return null;}finally{try{fos_jpg.close();}catch (Exception e){e.printStackTrace();}}}/*** 饼状图** @param dataset 数据集* @param chartTitle 图标题* @param charName 生成图的名字* @param pieKeys 分饼的名字集* @return*/public String createV alidityComparePimChar(PieDataset dataset,String chartTitle, String charName, String[] pieKeys){JFreeChart chart = ChartFactory.createPieChart3D(chartTitle, // chart// titledataset,// datatrue,// include legendtrue, false);// 使下说明标签字体清晰,去锯齿类似于//chart.getRenderingHints().put(RenderingHints.KEY_TEXT_ANTIALIASING,RenderingHints.V ALUE_TEXT_ANTIALIAS_OFF);的效果chart.setTextAntiAlias(false);// 图片背景色chart.setBackgroundPaint(Color.white);// 设置图标题的字体重新设置titleFont font = new Font("隶书", Font.BOLD, 25);TextTitle title = new TextTitle(chartTitle);title.setFont(font);chart.setTitle(title);PiePlot3D plot = (PiePlot3D) chart.getPlot();// 图片中显示百分比:默认方式// 指定饼图轮廓线的颜色// plot.setBaseSectionOutlinePaint(Color.BLACK);// plot.setBaseSectionPaint(Color.BLACK);// 设置无数据时的信息plot.setNoDataMessage("无对应的数据,请重新查询。
JfreeChart的柱状图的画法1:前提:需要导入Jfreechart的相关jar包主要的步骤:1.首先是类需要继承ApplicationFrame类,保证整个类可以成为一个容器;2.创建CategoryDataset数据集,为jfreechart提供数据支持;创建CategoryDataset的方法如下:DefaultCategoryDataset defaultDataset=new DefaultDataset();//添加数据defaultDataset.addValue(double realNumber,String chartName,String categoryType);参数说明:realNumber--------表示的是该种类型的真实数据是多少,也就是一个柱子上显示出来的数据chartName---------我理解的意思是任意复制的柱的名称,如果有多个数据的话(也就是多个addValue)chartName不一致的话会导致柱子间的空隙的宽度的变化,猜想是一个类型里组的性质(也就是一个type对应多个柱子,类似于统计一年里每个月几个人的信息)categoryType-------也就是具体的某个类型的标签,在上图中的体现就是Apple,banana,grape这些3.根据CategoryDataset数据集创建一个JFreeChart;创建JFreeChart的方法如下:JFreeChart jfreechart=ChartFactory.createBarChart(String desc,String leftDesc,String topDesc,CategoryDataset dataset,String direction,boolean seriesFlag,booleantooltipFlag ,boolean urlFlag);参数说明:desc---------------也就是整个图表的说明,如图中所示为“Ali’s Fruits”那一部分的描述leftDesc----------即是图表中type的说明文字topDesc----------即是图中Number的说明文字dataset-----------即是所创建的CategoryDataset数据集direction---------表示图表生成的方向,使用seriesFlag--------表示是否显示显示下面的种类如箭头所指,这里也可以理解在addValue的时候设这的CategoryName的名字的用处了,用于多个颜色的区分toolTipFlag----------表示是否启用鼠标放到柱子上的提示信息urlFlag---------------表示是否启用url网址,但没用过4.根据JFreeChart构建一个ChartPanel容器用于盛放JFreeChart;创建ChartPanel的步骤如下:ChartPanel chartPanel=new ChartPanel(JFreeChart jfreechart);5.最后,把包含有JFreeChart的ChartPanel放入到ApplicationFrame中去把ChartPanel放入到ApplicationFrame中去也就是把组件放入到容器中去,值得一提的是向Jframe或者这里的ApplicationFrame中添加组件的方式有两种:(1)用getContentPane()方法获取Frame的内容面板,再加入组件(2)建立一个Jpanel或者是JdesktopPane之类的中间容器,把组件添加到这个中间容器中去,用setContentPane()方法把容器放入到Frame中Eg: JPanel contentPanel=new Jpanel(jfreechart);frame.setCotentPane(contentPane);//如果类继承了ApplicationFrame 等父类,那么可以直接使用setContentPane(contentPane)而省略掉frame6.测试运行详细的例子见下一篇文章。
写在前面的话今年北京的夏天格外的热,工作之余竟然不想出去看风景了。
蜷缩在没有空调的房子里才开始怀念冷气的味道,为了降温只能拿块湿毛巾搭在肩膀上。
古老的方式却也带来一丝惬意,打开笔记本想想还是写个总结吧,给自己找点事做,总比闲的好……用这样的字体开始写这段话我只想说明的是这段话无关紧要,权当是我对着自己电脑自言自语吧,你完全可以跳过这里查找你需要的地方。
不过我还是要感谢前辈们的“前人栽树,后人乘凉”的精神,没有他们的无私也没有这篇个人总结的出现。
所以你可以任意分割和转载,同样如果你认为毫无价值可以拉到回收站以免占用您宝贵的硬盘……同样希望得到您的批评和指正,谢谢!目录所谓的介绍 (3)1.JasperReport 简介 (3)2.jFreeChart简介 (3)3.iReport简介 (4)开始愉快的旅程 (6)1.必要条件 (6)2.下载与安装 (6)3.添加一个JDBC连接 (7)4.开始一个简单的报表 (9)5.认识进阶 (14)6.报表中的组件 (16)7.输出报表 (41)8.Web工程中的配置和导出 (44)该结束了 (47)所谓的介绍如果您总是很喜欢看一本书前几页的介绍,很遗憾这里显然无法满足您的需求,不过简要的介绍还是少不了的!1.JasperReport 简介JasperReport 是一款报表打印组件,是开放源代码和免费的,在我写这篇总结的时候,JasperReport 的最新版本是3.7.3版,JasperReport 的最新版本可以从/projects/jasperreports下载得到。
JasperReport 适合用来做WEB应用程序与Java Application的报表打印组件!注:目前已经升级到3.7.4版本,截图是最新官网页面2.jFreeChart简介JFreeChart主要用来各种各样的图表,这些图表包括:饼图、柱状图(普通柱状图以及堆栈柱状图)、线图、区域图、分布图、混合图、甘特图以及一些仪表盘等等。
jFreeChart图形显示设置(柱状图)说明表源代码://BarRenderer3Dprivate JFreeChart createChartPole(CategoryDataset dcd) { // 构造基本的JFreeChartsetTitle(Title);setXAxisTitle(x);setYAxisTitle(y);JFreeChart chart = ChartFactory.createBarChart3D(getTitle(), getXAxisTitle(), getYAxisTitle(), dcd,PlotOrientation.VERTICAL, true, true, false);CategoryPlot plot = (CategoryPlot)chart.getPlot();BarRenderer3D custombarrenderer3d = new BarRenderer3D();//设置图例LegendTitle legtitle = chart.getLegend();//设置图例字体legtitle.setItemFont(new Font("黑体", Font.ROMAN_BASELINE, 15));//取得chart图的标题TextTitle title = chart.getTitle();//设置chart图标题的字体title.setFont(new Font("黑体", Font.CENTER_BASELINE, 24));//X轴字体CategoryAxis domainAxisTemp = plot.getDomainAxis();domainAxisTemp.setLabelFont(new Font("黑体", Font.ROMAN_BASELINE, 12));//设置x轴各项标题的字体domainAxisTemp.setTickLabelFont(new Font("黑体",Font.ROMAN_BASELINE, 12));domainAxisTemp.setTickLabelPaint(Color.BLUE);//Y轴字体ValueAxis rangeAxis = plot.getRangeAxis();rangeAxis.setLabelFont(new Font("黑体", Font.ROMAN_BASELINE, 12));//custombarrenderer3d.setBaseOutlinePaint(Color.blue);custombarrenderer3d.setWallPaint(Color.lightGray);// 3D坐标轴的墙体颜色custombarrenderer3d.setMinimumBarLength(0.01);custombarrenderer3d.setMaximumBarWidth(0.05);//控制X轴坐标点文字角度当X轴的坐标点超过15个时,文字角度调整为45度向上if(dcd.getColumnCount() > 8){chart.getCategoryPlot().getDomainAxis().setCategoryLabelPositions (CategoryLabelPositions.DOWN_45);// 设置坐标点标记与坐标轴之间的距离//jfreechart.getCategoryPlot().getDomainAxis().setCategoryLabelPosi tionOffset(50);//jf.getCategoryPlot().getDomainAxis().setCategoryLabelPositions(Ca tegoryLabelPositions.createUpRotationLabelPositions(Math.PI/6));}// 显示每个柱的数值,并修改该数值的字体属性<BR>custombarrenderer3d.setBaseItemLabelGenerator(new StandardCategoryItemLabelGenerator());// custombarrenderer3d.setBaseItemLabelFont(new Font("黑体", Font.ROMAN_BASELINE, 12));custombarrenderer3d.setBaseItemLabelFont(new Font("黑体", Font.CENTER_BASELINE, 15));//是否显示柱的数值标签custombarrenderer3d.setBaseItemLabelsVisible(true);// 每个柱的数值,标签显示的方式及位置custombarrenderer3d.setBasePositiveItemLabelPosition(new ItemLabelPosition(ItemLabelAnchor.OUTSIDE12,TextAnchor.BASELINE_CENTER));// 标签显示与设定位置的距离custombarrenderer3d.setItemLabelAnchorOffset(10D);// 设置每个基站所包含的平行柱的之间距离custombarrenderer3d.setItemMargin(0.05D);// 设置柱的颜色custombarrenderer3d.setSeriesPaint(0,Color.getHSBColor(3.5f, 2.3f, 4.5f));// 设置柱的 Outline 颜色custombarrenderer3d.setSeriesOutlinePaint(0, Color.BLACK);//为单个柱体设置字体,"1"为柱体的序号// custombarrenderer3d.setSeriesItemLabelFont(1, new Font("宋体", Font.CENTER_BASELINE, 72));// 各柱体的宽度custombarrenderer3d.setMaximumBarWidth(0.050000000000000003D);plot.setRenderer(custombarrenderer3d);return chart;}。
1.1通过代码实例跟我学JFreeChart 图表组件——在J2SE Java应用系统中应用JFreeChart的实例(JBuilder开发工具版本)1、在JBuilder开发工具中编程JFreeChart 的API的程序首先要引入JFreeChart 的API所在的*.jar 包文件——由于jfreechart-1.0.5.jar 和jcommon-1.0.9.jar、gnujaxp.jar文件不是在JBuilder的JDK中所内带的,因此,应该将该三个文件包含到JBuilder的库环境变量中。
2、配置JFreeChart系统库文件的主要步骤(1)选择Tools菜单下的Configure Libraries菜单(2)在对话框内点击“New”按钮,然后在新的对话框内的名称栏:JFreeChartJar,在Location 中:User Home;然后点击“Add”按钮将JFreeChart的两个主要的jar包文件jfreechart-1.0.0-pre2.jar和jcommon-1.0.0-pre2.jar包含到本库中。
(3)点击“OK”按纽以添加。
3、创建PieChartDemo.java程序类(1)在JBuilder中创建一个使用JFreeChart的Java程序程序类名称为PieChartDemo.java,程序包名称为com.px1987.j2sejfreechart.demo。
(2)编程PieChartDemo.java的功能实现程序代码package com.px1987.j2sejfreechart.demo;import java.io.File;import java.io.FileOutputStream;import java.io.IOException;import org.jfree.chart.ChartFactory;import org.jfree.chart.ChartUtilities;import org.jfree.chart.JFreeChart;import org.jfree.data.general.DefaultPieDataset;public class PieChartDemo {public PieChartDemo() {}public static void main(String[] args) {PieChartDemo one=new PieChartDemo();JFreeChart oneJFreeChart=one.createOneChart();String chartFileName="myPie.jpeg";one.outPutOneChart(chartFileName, oneJFreeChart);}private DefaultPieDataset getDataSet(){DefaultPieDataset dataset = new DefaultPieDataset();dataset.setValue("Java",100);dataset.setValue("C++",200);dataset.setValue("Basica",300);dataset.setValue("J2EE",400);dataset.setValue("",500);return dataset;}private JFreeChart createOneChart(){/*JFreeChart oneJFreeChart=ChartFactory.createPieChart3D("创建饼图的示例", // 图表标题getDataSet(), true, // 是否显示图例false, // 是否显示tooltipsfalse); //是否显示URLs*/JFreeChart oneJFreeChart=ChartFactory.createPieChart("XXX学校的选课结果", // 图表标题getDataSet(), true, // 是否显示图例true, // 是否显示tooltipstrue); //是否显示URLs/* PiePlot pieplot = (PiePlot)oneJFreeChart.getPlot(); //通过JFreeChart 对象获得PiePlot,然后对它进行修改和定制pieplot.setNoDataMessage("没有合适的图表的数据"); // 没有数据的时候显示的内容*/return oneJFreeChart;}private boolean outPutOneChart(String chartFileName,JFreeChart oneJFreeChart){FileOutputStream fos_jpg = null;File tempDir =null;try {tempDir = new File(System.getProperty("java.io.tmpdir"));String tempDirName = tempDir.getAbsolutePath();String picFileName=tempDirName+"/"+chartFileName;fos_jpg = new FileOutputStream(picFileName);ChartUtilities.writeChartAsJPEG(fos_jpg, oneJFreeChart, 500,400);}catch(IOException e){System.out.println(" 在保存图时出现了错误,并且错误内容为"+e.getMessage());return false;}return true;}}4、编译和执行本示例程序5、将产生出下面的结果或者2D。
1.1通过代码实例跟我学JFreeChart 图表组件——在J2EE Web应用系统中采用JSP+JavaBean方式应用JFreeChart的实例(第3部分)1.1.1JSP+JavaBean的方式来生成Web图表,从而实现表示与业务分离下面提供一个命令模式构造的实现画图表的业务功能JavaBean程序。
1、设计命令模式的命令接口(1)接口名称为WebChartCommandInterface,包名称为com.px1987.jfreechart.model(2)设计该接口package com.px1987.jfreechart.model;import javax.servlet.http.HttpSession;import javax.servlet.jsp.*;public interface WebChartCommandInterface{public String generateSomeChart(String chartTitleString,String categoryName,String numberString, HttpSession session,JspWriter out) throws java.io.IOException;}2、设计命令模式的命令接口WebChartCommandInterface的各个实现类-----也就是我们的具体画出各种不同图形的JavaBean(1)实现平面饼图的PieChartBean类,包名称为com.px1987.jfreechart.model(2)编程PieChartBean 程序类中的相关功能方法package com.px1987.jfreechart.model;import javax.servlet.http.HttpSession;import org.jfree.data.general.DefaultPieDataset;import org.jfree.chart.JFreeChart;import org.jfree.chart.ChartUtilities;import org.jfree.chart.ChartRenderingInfo;import org.jfree.chart.plot.PiePlot;import bels.StandardPieToolTipGenerator;import org.jfree.chart.entity.StandardEntityCollection;import org.jfree.chart.urls.StandardPieURLGenerator;import org.jfree.chart.servlet.ServletUtilities;import javax.servlet.jsp.*;import java.io.*;public class PieChartBean implements WebChartCommandInterface{private String graphFileName = null;public PieChartBean(){}public String generateSomeChart(String chartTitleString,String categoryName, String numberString,HttpSession session,JspWriter out) throws java.io.IOException{PrintWriter pw=new PrintWriter(out);DefaultPieDataset pieDatasetData =new DefaultPieDataset();pieDatasetData.setValue("六月",500);pieDatasetData.setValue("七月",580);pieDatasetData.setValue("八月",828);try{PiePlot plot = new PiePlot(pieDatasetData);plot.setToolTipGenerator(new StandardPieToolTipGenerator()); //在图形上产生tooltip文字plot.setURLGenerator(new StandardPieURLGenerator("WebChartHelp.jsp")); //在图表上产生超链接JFreeChart pieChart = new JFreeChart(chartTitleString,JFreeChart.DEFAULT_TITLE_FONT,plot,true);pieChart.setBackgroundPaint(java.awt.Color.white); //可选,设置图片背景色ChartRenderingInfo info = new ChartRenderingInfo(new StandardEntityCollection());/*选择存储成png格式的文件,当然你也可以使用saveChartAsJPEG的方法生成jpg图片saveChartAsPNG方法主要用于把图形对象JFreeChart以图片的形式保存。
⽤JFreeChart绘制股票K线图完整解决⽅案因为⼯作的需要,接触了⼀些股票图形绘制类的⼯作,其中最主要的还是股票K线图的绘制了,如果利⽤编程语⾔最底层的图形绘制⽅法去绘制这类图形,如果对编程语⾔不是特别熟悉的话,⼀般是有很⼤的困难的,通过在⽹上搜索发现,以⾃⼰最熟悉的两门语⾔为例,其中有PHP版的开源JPGraph画图程序和 JAVA版的JFreeChart画图⼯具包,jpgraph⽤过⼀段时间,但是发现,其中图形细节⽅⾯处理的不够细腻和精致,最后转向使⽤ jfreechart,这是国外⼀个开源的图形绘制的java包,⾥⾯的画图功能也相当的强⼤,更主要的利⽤java强⼤的⾯向对象的功能,可以进⾏很多⽅⾯的定制和修改。
⽹上有很多⼈在询问如何使⽤jfreechart来绘制股票K线图,通过阅读其中的⼀些例⼦来看,⼤多⽐较的凌乱,没有给出⼀个符合中国股票市场的K线图实例,因为中国的股票市场K线图的颜⾊表⽰与国外存在⼀点差异,也有很多⼈遇到了如何去掉周六,周⽇这类不存在交易的⽇期,⽹上没有⼀个很满意的答案,通过实践,本⼈整理出⼀个完整的实例,给出完整的注释,只要在eclipse中配置好相应的classpath,甚⾄不要修改就可以运⾏,得到⼀个包含⽇K 线和⽇成交量的组合图,希望给⼤家提供⼀点帮助,同时也希望⼤家能够⼀起交流,改进和挖掘更多的功能!在进⾏源代码讲解之前,有必要将本⼈所领悟到的⼀些关于jfreechart的概念讲述下,jfreechart⼯具基本上把⼀个图形分成了⼏个逻辑部分。
1.⾸先是整个的画布对象(chart),画布就相当与⼀个⼤的容器,包含⼀些图形元素,⽐如为⼀张⽩纸2.然后是画图区域对象(plot),就是实际图形所占据的区域,⽐如为⽩纸上的⼀个长⽅形3.然后是图形所需要两条轴对象(axis),⽐如为⽩纸上的两条轴线4.最后是如何进⾏图像的绘制对象(render),⽐如为⼀只画图的笔5.除开上⾯的这些对象,还有⼀个最主要的就是通过必须的数据集(dataset)来⽣成图形了⾄于⼀些具体的对象细节,就只好请各位去阅读相关的API⽂档了,在这⾥就不详细的说明 package chart; import java.awt.Color;//颜⾊系统 import java.text.SimpleDateFormat;//时间格式 import java.awt.Paint;//画笔系统 import org.jfree.data.time.*; importorg.jfree.data.time.Day; import org.jfree.data.time.ohlc.OHLCSeries; import org.jfree.data.time.ohlc.OHLCSeriesCollection; importorg.jfree.chart.renderer.xy.*; import org.jfree.chart.axis.*; import org.jfree.chart.plot.*; import org.jfree.chart.*;public class KLineCombineChart {public static void main(String[] args) { SimpleDateFormat dateFormat = new SimpleDateFormat("yyyy-MM-dd");//设置⽇期格式 double highValue = Double.MIN_VALUE;//设置K线数据当中的最⼤值 double minValue = Double.MAX_VALUE;//设置K线数据当中的最⼩值double high2Value = Double.MIN_VALUE;//设置成交量的最⼤值 double min2Value = Double.MAX_VALUE;//设置成交量的最低值OHLCSeries series = new OHLCSeries("");//⾼开低收数据序列,股票K线图的四个数据,依次是开,⾼,低,收 series.add(newDay(28, 9, 2007), 9.2, 9.58, 9.16, 9.34); series.add(new Day(27, 9, 2007), 8.9, 9.06, 8.83, 8.96); series.add(new Day(26, 9, 2007), 9.0, 9.1, 8.82, 9.04); series.add(new Day(25, 9, 2007), 9.25, 9.33, 8.88, 9.00); series.add(new Day(24, 9, 2007), 9.05, 9.50, 8.91, 9.25); series.add(new Day(21, 9, 2007), 8.68, 9.05, 8.40, 9.00); series.add(new Day(20, 9, 2007), 8.68, 8.95, 8.50, 8.69); series.add(new Day(19, 9, 2007), 8.80, 8.94, 8.50, 8.66); series.add(new Day(18, 9, 2007), 8.88, 9.17, 8.69, 8.80); series.add(new Day(17, 9, 2007), 8.26, 8.98, 8.15, 8.89); series.add(new Day(14, 9, 2007), 8.44, 8.45, 8.13, 8.33); series.add(new Day(13, 9, 2007), 8.13, 8.46, 7.97, 8.42); series.add(new Day(12, 9, 2007), 8.2, 8.4, 7.81, 8.13); series.add(new Day(11, 9, 2007), 9.0, 9.0, 8.1, 8.24); series.add(new Day(10, 9, 2007), 8.6, 9.03, 8.40, 8.95); series.add(new Day(7, 9, 2007), 8.89, 9.04, 8.70, 8.73); series.add(new Day(6, 9, 2007), 8.4, 9.08, 8.33, 8.88); series.add(new Day(5, 9, 2007), 8.2, 8.74, 8.17, 8.36); series.add(new Day(4, 9, 2007), 7.7, 8.46, 7.67, 8.27); series.add(new Day(3, 9, 2007), 7.5, 7.8, 7.48, 7.69); series.add(new Day(31, 8, 2007), 7.4, 7.6, 7.28, 7.43); series.add(new Day(30, 8, 2007), 7.42, 7.56, 7.31, 7.40); series.add(new Day(29, 8, 2007), 7.42, 7.66, 7.22, 7.33); series.add(new Day(28, 8, 2007), 7.31, 7.70, 7.15, 7.56); series.add(new Day(27, 8, 2007), 7.05, 7.46, 7.02, 7.41); series.add(new Day(24, 8, 2007), 7.05, 7.09, 6.90, 6.99); series.add(new Day(23, 8, 2007), 7.12, 7.16, 7.00, 7.03); series.add(new Day(22, 8, 2007), 6.96, 7.15, 6.93, 7.11); series.add(new Day(21, 8, 2007), 7.10, 7.15, 7.02, 7.07); series.add(new Day(20, 8, 2007), 7.02, 7.19, 6.94, 7.14); final OHLCSeriesCollection seriesCollection = new OHLCSeriesCollection();//保留K线数据的数据集,必须申明为final,后⾯要在匿名内部类⾥⾯⽤到seriesCollection.addSeries(series); TimeSeries series2=new TimeSeries("");//对应时间成交量数据 series2.add(new Day(28, 9, 2007), 260659400/100); series2.add(new Day(27, 9, 2007), 119701900/100); series2.add(new Day(26, 9, 2007), 109719000/100); series2.add(new Day(25, 9, 2007), 178492400/100); series2.add(new Day(24, 9, 2007), 269978500/100); series2.add(new Day(21, 9, 2007), 361042300/100); series2.add(new Day(20, 9, 2007), 173912600/100); series2.add(new Day(19, 9, 2007), 154622600/100); series2.add(new Day(18, 9, 2007), 200661600/100); series2.add(new Day(17, 9, 2007), 312799600/100); series2.add(newDay(14, 9, 2007), 141652900/100); series2.add(new Day(13, 9, 2007), 221260400/100); series2.add(new Day(12, 9, 2007), 274795400/100); series2.add(new Day(11, 9, 2007), 289287300/100); series2.add(new Day(10, 9, 2007), 289063600/100); series2.add(new Day(7, 9, 2007), 351575300/100); series2.add(new Day(6, 9, 2007), 451357300/100); series2.add(new Day(5, 9, 2007), 442421200/100); series2.add(new Day(4, 9, 2007), 671942600/100); series2.add(new Day(3, 9, 2007), 349647800/100); series2.add(new Day(31, 8, 2007), 225339300/100); series2.add(new Day(30, 8, 2007), 160048200/100); series2.add(new Day(29, 8, 2007), 247341700/100); series2.add(new Day(28, 8, 2007), 394975400/100); series2.add(new Day(27, 8, 2007), 475797500/100); series2.add(new Day(24, 8, 2007), 297679500/100); series2.add(new Day(23, 8, 2007), 191760600/100); series2.add(newDay(22, 8, 2007), 232570200/100); series2.add(new Day(21, 8, 2007), 215693200/100); series2.add(new Day(20, 8, 2007), 200287500/100); TimeSeriesCollection timeSeriesCollection=new TimeSeriesCollection();//保留成交量数据的集合timeSeriesCollection.addSeries(series2); //获取K线数据的最⾼值和最低值 int seriesCount = seriesCollection.getSeriesCount();//⼀共有多少个序列,⽬前为⼀个 for (int i = 0; i < seriesCount; i++) { int itemCount = seriesCollection.getItemCount(i);//每⼀个序列有多少个数据项 for (int j = 0; j < itemCount; j++) { if (highValue < seriesCollection.getHighValue(i, j)) {//取第i个序列中的第j个数据项的最⼤值 highValue = seriesCollection.getHighValue(i, j); } if (minValue > seriesCollection.getLowValue(i, j)) {//取第i个序列中的第j个数据项的最⼩值 minValue = seriesCollection.getLowValue(i, j); } }} //获取最⾼值和最低值 int seriesCount2 = timeSeriesCollection.getSeriesCount();//⼀共有多少个序列,⽬前为⼀个 for (int i = 0;i < seriesCount2; i++) { int itemCount = timeSeriesCollection.getItemCount(i);//每⼀个序列有多少个数据项 for (int j = 0; j < itemCount; j++) { if (high2Value < timeSeriesCollection.getYValue(i,j)) {//取第i个序列中的第j个数据项的值 high2Value = timeSeriesCollection.getYValue(i,j); } if (min2Value > timeSeriesCollection.getYValue(i, j)) {//取第i个序列中的第j个数据项的值min2Value = timeSeriesCollection.getYValue(i, j); } }} final CandlestickRenderer candlestickRender=new CandlestickRenderer();//设置K线图的画图器,必须申明为final,后⾯要在匿名内部类⾥⾯⽤到 candlestickRender.setUseOutlinePaint(true); //设置是否使⽤⾃定义的边框线,程序⾃带的边框线的颜⾊不符合中国股票市场的习惯 candlestickRender.setAutoWidthMethod(CandlestickRenderer.WIDTHMETHOD_AVERAGE);//设置如何对K线图的宽度进⾏设定 candlestickRender.setAutoWidthGap(0.001);//设置各个K线图之间的间隔 candlestickRender.setUpPaint(Color.RED);//设置股票上涨的K线图颜⾊ candlestickRender.setDownPaint(Color.GREEN);//设置股票下跌的K线图颜⾊ DateAxis x1Axis=new DateAxis();//设置x轴,也就是时间轴 x1Axis.setAutoRange(false);//设置不采⽤⾃动设置时间范围 try{ x1Axis.setRange(dateFormat.parse("2007-08-20"),dateFormat.parse("2007-09- 29"));//设置时间范围,注意时间的最⼤值要⽐已有的时间最⼤值要多⼀天 }catch(Exception e){ e.printStackTrace(); } x1Axis.setTimeline(SegmentedTimeline.newMondayThroughFridayTimeline());// 设置时间线显⽰的规则,⽤这个⽅法就摒除掉了周六和周⽇这些没有交易的⽇期(很多⼈都不知道有此⽅法),使图形看上去连续x1Axis.setAutoTickUnitSelection(false);//设置不采⽤⾃动选择刻度值 x1Axis.setTickMarkPosition(DateTickMarkPosition.MIDDLE);//设置标记的位置 x1Axis.setStandardTickUnits(DateAxis.createStandardDateTickUnits());//设置标准的时间刻度单位x1Axis.setTickUnit(new DateTickUnit(DateTickUnit.DAY,7));//设置时间刻度的间隔,⼀般以周为单位x1Axis.setDateFormatOverride(new SimpleDateFormat("yyyy-MM-dd"));//设置显⽰时间的格式 NumberAxis y1Axis=new NumberAxis();//设定y轴,就是数字轴 y1Axis.setAutoRange(false);//不不使⽤⾃动设定范围 y1Axis.setRange(minValue*0.9, highValue*1.1);//设定y轴值的范围,⽐最低值要低⼀些,⽐最⼤值要⼤⼀些,这样图形看起来会美观些 y1Axis.setTickUnit(new NumberTickUnit((highValue*1.1-minValue*0.9)/10));//设置刻度显⽰的密度 XYPlot plot1=new XYPlot(seriesCollection,x1Axis,y1Axis,candlestickRender);//设置画图区域对象 XYBarRenderer xyBarRender=new XYBarRenderer(){ private static final long serialVersionUID = 1L;//为了避免出现警告消息,特设定此值 public Paint getItemPaint(int i, int j){//匿名内部类⽤来处理当⽇的成交量柱形图的颜⾊与K线图的颜⾊保持⼀致if(seriesCollection.getCloseValue(i,j)>seriesCollection.getOpenValue(i,j)){//收盘价⾼于开盘价,股票上涨,选⽤股票上涨的颜⾊ return candlestickRender.getUpPaint(); }else{ return candlestickRender.getDownPaint(); } }}; xyBarRender.setMargin(0.1);//设置柱形图之间的间隔 NumberAxis y2Axis=new NumberAxis();//设置Y轴,为数值,后⾯的设置,参考上⾯的y轴设置y2Axis.setAutoRange(false); y2Axis.setRange(min2Value*0.9, high2Value*1.1); y2Axis.setTickUnit(newNumberTickUnit((high2Value*1.1-min2Value*0.9)/4)); XYPlot plot2=new XYPlot(timeSeriesCollection,null,y2Axis,xyBarRender);//建⽴第⼆个画图区域对象,主要此时的 x轴设为了null值,因为要与第⼀个画图区域对象共享x轴 CombinedDomainXYPlot combineddomainxyplot = new CombinedDomainXYPlot(x1Axis);//建⽴⼀个恰当的联合图形区域对象,以x轴为共享轴combineddomainxyplot.add(plot1, 2);//添加图形区域对象,后⾯的数字是计算这个区域对象应该占据多⼤的区域2/3 combineddomainxyplot.add(plot2, 1);//添加图形区域对象,后⾯的数字是计算这个区域对象应该占据多⼤的区域1/3 combineddomainxyplot.setGap(10);//设置两个图形区域对象之间的间隔空间 JFreeChart chart = new JFreeChart("中国联通", JFreeChart.DEFAULT_TITLE_FONT, combineddomainxyplot, false); ChartFrame frame = new ChartFrame("中国联通股票", chart); frame.pack(); frame.setVisible(true); }}为了能够保证K线图的上影线和下影线能够和K线图本⾝的颜⾊保持⼀致,找了很多的⽅法设置都不成功,可以说⽬前暂不提供单独绘制K线边框颜⾊的⽅法,所以,经过本⼈的实验,对其中的源代码进⾏了下修改,具体修改的地⽅是在下载回来的⽂件⽬中source\org\jfree\chart\renderer\ xy\CandlestickRenderer.java⽂件,将 Paint p = getItemPaint(series, item); Paint outlinePaint = null; outlinePaint = getItemOutlinePaint(series, item); }修改为如下的代码,这样就会保证K线图的上影线和下影线能够和K线图本⾝的颜⾊保持⼀致,符合中国股票市场K线图形颜⾊的习惯:Paint p = getItemPaint(series, item); Paint outlinePaint = null; if (eOutlinePaint) { if(yClose>yOpen){ if (this.upPaint != null) { outlinePaint=this.upPaint; } else { outlinePaint=p; } }else{ if (this.downPaint != null) { outlinePaint=this.downPaint; } else { outlinePaint=p; } } }然后使⽤ant集成编译⼯具,编译重新⽣成最新的开发包就可以了,如果各位在使⽤过程中遇到什么问题,欢迎留⾔探讨,也希望这个实例对⼤家有所帮助,等有时间了再给⼤家介绍下jpgraph的K线图的绘制,敬请期待,呵呵!。
用JFreeChart增强JSP报表的用户体验 JFreeChart是一组功能强大、灵活易用的Java绘图API,使用它可以生成多种通用性的报表,包括柱状图、饼图、曲线图、甘特图等。它能够用在Swing和Web等中制作自定义的图表或报表,并且得到广泛的应用。本文将通过引领读者学习在JFreeChart中饼图、柱状图和曲线图的进阶应用,来达到熟练使用JFreeChart的目的。
一. 下载与环境配置 1. 下载JFreeChart JFreeChart是开放源代码的免费软件,但是它的支持文档需要付费才能得到。其下载地址为:http://sourceforge.net/project/showfiles.php?group_id=15494,当前最新版本为1.0.6。笔者下载的是1.0.6最新版。
说明:1)source目录:为jfreechart的源码目录; 2)lib目录:为包目录,我们需要关注的包为jfreechart-1.0.6.jar、gnujaxp.jar和jcommon-1.0.10.jar这三个包;
3)根目录下的jfreechart-1.0.6-demo.jar是例子程序,大家双击后可看到其中有很多例子的运行结果。
2. 环境配置 笔者的开发环境如下: JDK:1.5 MyEclipse:5.1.1 GA Tomcat:5.5.28 为了后续的“用JFreeChart创建基于Web的图表”的一个例子的展示,我们在MyEclipse中创建一个名为jfreechart的Web工程。将下载的JFreeChart1.0.6下lib目录下的jar包拷贝到WebRoot/WEB-INF/lib目录下。另外还需要在web.xml文件中增加如下配置:
DisplayChart org.jfree.chart.servlet.DisplayChart DisplayChart /DisplayChart
二. 柱状图 在WebRoot目录下建立bar目录,用来存放柱状图的各个例子。首先在该目录下建立一个sample1.jsp文件,让我们来看一个简单的柱状图的例子,修改后的sample1.jsp的内容如下所示:
<%@ page contentType="text/html;charset=GBK"%> <%@ page import="org.jfree.chart.ChartFactory, org.jfree.chart.JFre
eChart, org.jfree.chart.plot.PlotOrientation, org.jfree.chart.se
rvlet.ServletUtilities, org.jfree.data.category.DefaultCategoryDataset"%> <%
DefaultCategoryDataset dataset = new DefaultCategoryDataset();
dataset.addValue(610, "广州", "猪肉");
dataset.addValue(220, "广州", "牛肉");
dataset.addValue(530, "广州", "鸡肉");
dataset.addValue(340, "广州", "鱼肉");
JFreeChart chart = ChartFactory.createBarChart3D("肉类销量统计图",
"肉类",
"销量",
dataset,
PlotOrientation.VERTICAL,
false,
false,
false);
String filename = ServletUtilities.saveChartAsPNG(chart, 500, 300, null, session);
String graphURL = request.getContextPath() + "/DisplayChart?filename=" + filename;
%>
在浏览器中输入地址:http://localhost:8080/jfreechart/bar/sample1.jsp,可看到如下柱状图: 上面的这个柱状图比较简单,稍显单调,在有些情况下,我们需要用不同颜色来表示不同的种类,或者在种类上标上具体数值,亦或需要加上3D水晶效果。下面让我们来做更深一步的探讨。接下来让我们看一个用不同颜色来表示不通种类的例子。在WebRoot的bar目录下新建sample2.jsp页面,将其代码修改如下:
<%@ page contentType="text/html;charset=GBK"%>
<%@ page import="org.jfree.chart.ChartFactory,
org.jfree.chart.JFreeChart,
org.jfree.chart.plot.PlotOrientation,
org.jfree.chart.servlet.ServletUtilities,
org.jfree.data.category.CategoryDataset,
org.jfree.data.general.DatasetUtilities"%>
<%
double[][] data = newdouble[][] {{1310}, {720}, {1130}, {440}};
String[] rowKeys = {"猪肉", "牛肉","鸡肉", "鱼肉"};
String[] columnKeys = {""};
CategoryDataset dataset = DatasetUtilities.createCategoryDataset(rowKeys, columnK
eys, data);
JFreeChart chart = ChartFactory.createBarChart3D("广州肉类销量统计图", "肉类",
"销量",
dataset,
PlotOrientation.VERTICAL,
true,
false,
false);
String filename = ServletUtilities.saveChartAsPNG(chart, 500, 300, null, session);
String graphURL = request.getContextPath() + "/DisplayChart?filename=" + filename;
%>
该页面的运行效果如下图所示:
对比该例与前例,可看出createBarChart3D的倒数第三个参数修改成了true,该参数可用来显示下方的:。上两例我们显示的只是一个城市的肉类销量,有时候我们有对比显示多个城市的不同肉类,只要将上例稍作修改即可。例如要在图中表示广州、深圳、东莞、佛山四个城市的四个肉类的销售情况,只需要将如下三句稍做修改:
double[][] data = newdouble[][] {{1310}, {720}, {1130}, {440}}; String[] rowKeys = {"猪肉", "牛肉","鸡肉", "鱼肉"}; String[] columnKeys = {""}; 例如修改成: double[][] data = newdouble[][] {{1310, 1220, 1110, 1000}, {720, 700, 680, 640}, {1130, 1020, 980, 800}, {440, 400, 360, 300}}; String[] rowKeys = {"猪肉", "牛肉","鸡肉", "鱼肉"}; String[] columnKeys = {"广州", "深圳", "东莞", "佛山"};
在运行该jsp页面,可看到如下界面:
在上述几例中,在某个柱子上都没有显示相应的数值,下面让我们为每个柱子都加上它的数值,我们新建一个sample4.jsp页面,其内容如下:
<%@ page contentType="text/html;charset=GBK"%> <%@ page import="org.jfree.chart.ChartFactory, org.jfree.chart.JFreeChar
t, org.jfree.chart.plot.PlotOrientation, org.jfree.chart.servlet.ServletUtilities, or
g.jfree.data.category.CategoryDataset,
org.jfree.data.general.DatasetUtilities,