PROCESS
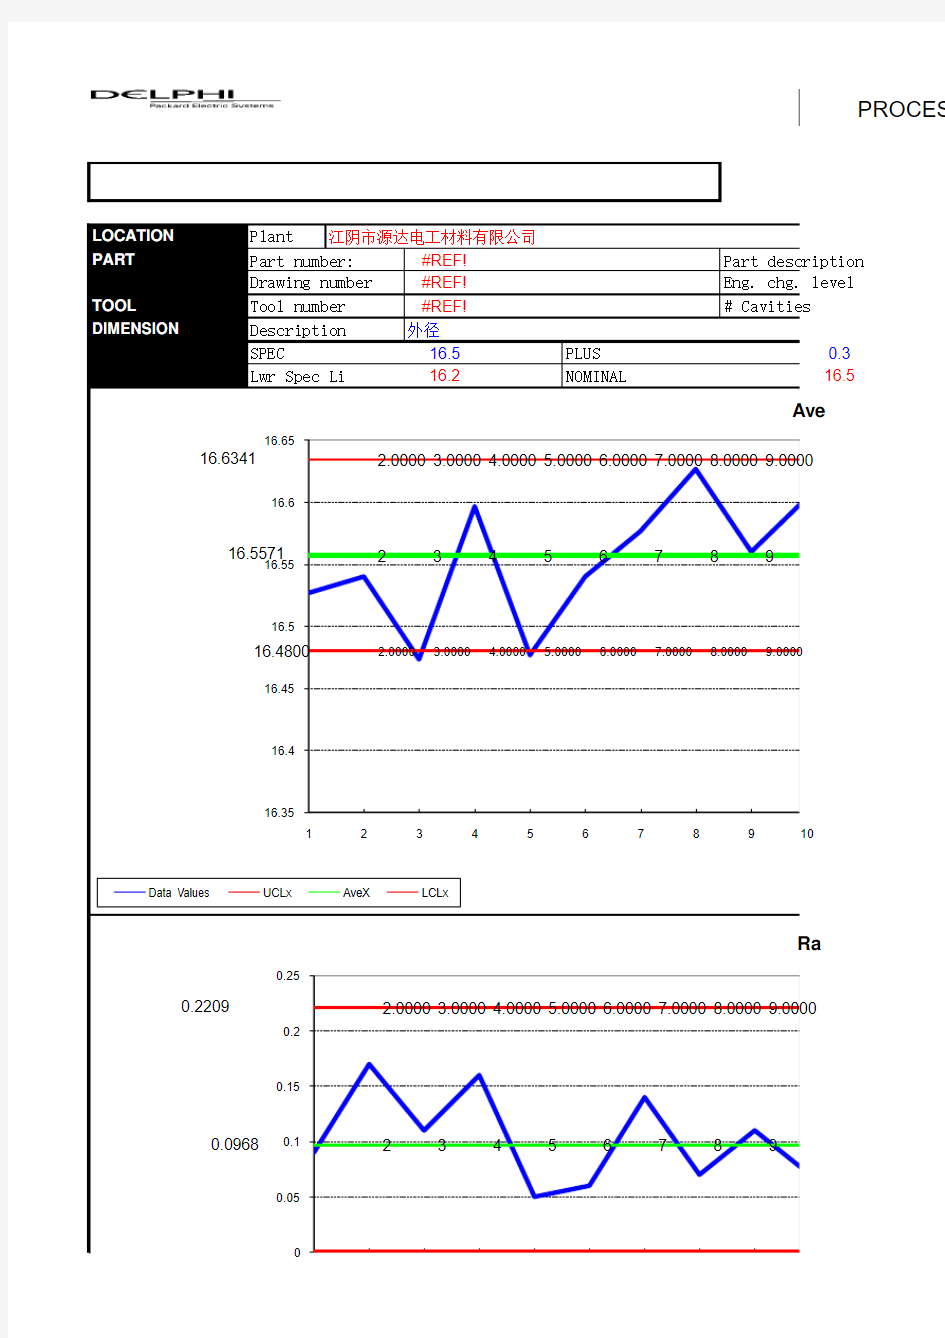
LOCATION Plant 江阴市源达电工材料有限公司PART Part number:#REF!Part description
Drawing number #REF!Eng. chg. level TOOL
Tool number #REF!# Cavities
DIMENSION
Description 外径SPEC 16.5PLUS Lwr Spec Li 16.2
NOMINAL
16.6341
2.0000
3.0000
4.0000
5.0000
6.0000
7.0000
8.0000
9.0000
16.5571
23456789
16.4800
2.0000
3.0000
4.0000
5.0000
6.0000
7.0000
8.0000
9.0000
16.35
16.4
16.45
16.5
16.55
16.6
16.65
1
2
3
4
5
6
7
8
9
10
A v e r a g e
Ave
Data Values UCLx AveX LCLx
0.2209
2.0000
3.0000
4.0000
5.0000
6.0000
7.0000
8.0000
9.0000
0.0968
23456789
0.05
0.1
0.15
0.2
0.25
R a n g e
Ra
PROCESS CAPABILITY CERTIFICATION REPORT
(see notes)
Dept:质检部P R O C E S S I N F O R M A T I O N Part description FLAL2G-85-B/T150GM蓄电池电缆Significant trends of data points:
Eng. chg. level#REF!Increasing RUN LENGTH
# Cavities mm HOW MANY RUNS
Units Decreasing RUN LENGTH
0.3MINUS0.3HOW MANY RUNS
16.5Upr Spec Li16.8Out of control limits
Average (X chart)
000010.000011.000012.000013.000014.000015.000016.000017.000018.000019.000020.000021.000022.000 10111213141516171819202122 00010.000011.000012.000013.000014.000015.000016.000017.000018.000019.000020.000021.000022.000
10111213141516171819202122
Data Points
Range (R chart)
000010.000011.000012.000013.000014.000015.000016.000017.000018.000019.000020.000021.000022.000 10111213141516171819202122
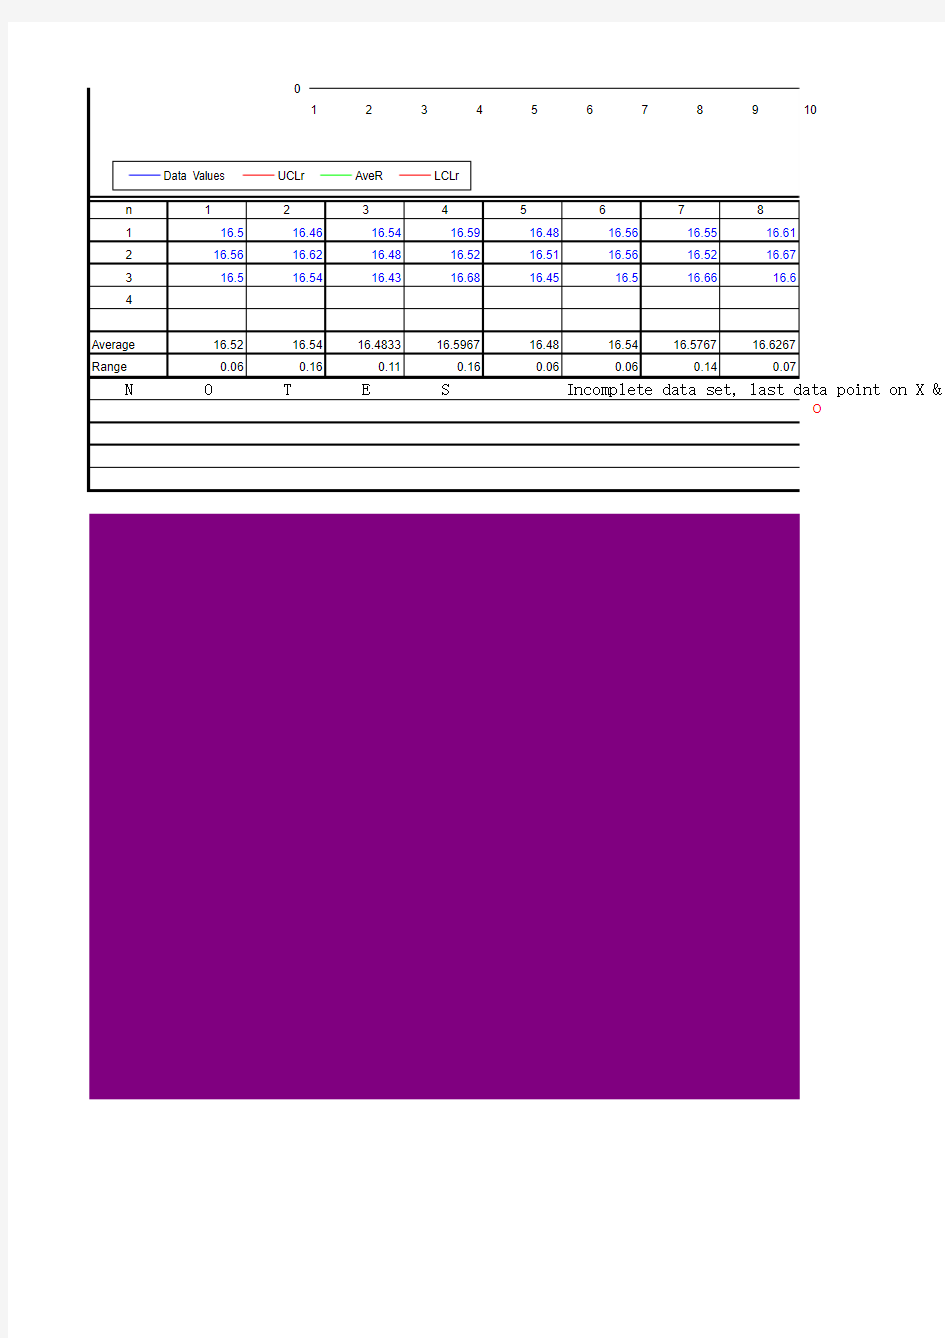
et, last data point on X & R chart are not actual readings Out of control limits (X) -
"16.4216.4116.43 PPU 1.4112009716.4416.4316.46 PPL 2.0857177416.4716.4616.48
16.4916.4816.51
16.5216.5116.53
16.5416.5316.56
16.5716.5616.58
16.5916.5816.61
16.6216.6116.63
16.6416.6316.66
16.6716.6616.68
AveX16.558UCLx16.634
LCLx16.482
D11AveR0.096UCLr0.218
M11Data Values LCLr0.000
UCLx16.63416.63416.63416.63416.634
AveX16.55816.55816.55816.55816.558
LCLx16.48216.48216.48216.48216.482
UCLr0.2180.2180.2180.2180.218
AveR0.0960.0960.0960.0960.096
LCLr0.0000.0000.0000.0000.000
XGoUP1010
XAcumUP1010
XAcumDw0101
XMaxUP4AF29
XMaxDown4AF30
XHMUps1
XHMDws1
RGoUP1010
RAcumUP1010
RAcumDw0101
RMaxUP3AF36
RMaxDown3AF37
RHMUps4
RHMDws3
sample #12345
Above UCLx0AJ16
Below LCLx1AJ17
Above UCLr0AJ18
Below LCLr0AJ19
XAbove00010
XBelow11101
RAbove01110
RBelow10001
XACounter01111
XBCounter12311
RACounter01231
RBCounter11111
MaxXA55 consecutive data points above average X
MaxXB33 consecutive data points below average X
MaxRA33 consecutive data points above average R
MaxRB33 consecutive data points below average R To chart:Data X16.5216.5416.4816.6016.48
170- Trend UP (X) -
170Trend DOWN (X) -
281Out of control limits (X) -
150Trend UP (R) -
170Trend DOWN (R) -
280Out of control limits (R) -
340Proc. variation (Pp not > 1.67) -
460Proc. not centered/capable (Ppk not > 1.67) -
500Process substandard, needs improvement (PPk<1.33).
0More than 7 consecutive points above X
0More than 7 consecutive points below X
0More than 7 consecutive points above R
0More than 7 consecutive points below R
2521FINAL CALL
ADDING
Out of control limits (X) -
Out of control limits (X) -
Out of control limits (X) -
Out of control limits (X) -
Out of control limits (X) -
Out of control limits (X) -
Out of control limits (X) -
1AJ04115.915.8415.96 2AJ05116.0215.9616.08 6AJ06416.1416.0816.2 15AJ07916.2616.216.32 28AJ081316.3816.3216.44 40AJ091216.516.4416.56 49AJ10916.6216.5616.68 57AJ11816.7416.6816.8 68AJ121116.8616.816.92 71AJ13316.9816.9217.04 75AJ14417.117.0417.16 71
Min16.43016.430LH term RH term Low end
Max16.68016.68016.200016.800015.9600 Diff0.250
Class0.025
16.63416.63416.63416.63416.63416.63416.63416.63416.634 16.55816.55816.55816.55816.55816.55816.55816.55816.558 16.48216.48216.48216.48216.48216.48216.48216.48216.482 0.2180.2180.2180.2180.2180.2180.2180.2180.218 0.0960.0960.0960.0960.0960.0960.0960.0960.096 0.0000.0000.0000.0000.0000.0000.0000.0000.000
111010110 123010120 000101001
010100110 010100120 201012001
67891011121314 011110111
100001000
010100010
101011101
112341123
211111111
111111111
211112311
ints above average X
ints below average X
ints above average R
ints below average R
16.5416.5816.6316.5616.6016.5316.5816.5916.58
1
0AS040AA3=0 if none
0AS050AA3=1 if bilateral
0AS060AA3=2 if Min
0AS070AA3=3 if Max
1AS081
44AS0943
75AS1031
75AS110
75AS120
75AS130
75AS140
75
High end Min15.960
17.0400Max17.040
Diff 1.08
Class0.12
16.63416.63416.63416.63416.63416.63416.63416.63416.634
16.55816.55816.55816.55816.55816.55816.55816.55816.558
16.48216.48216.48216.48216.48216.48216.48216.48216.482
0.2180.2180.2180.2180.2180.2180.2180.2180.218
0.0960.0960.0960.0960.0960.0960.0960.0960.096
0.0000.0000.0000.0000.0000.0000.0000.0000.000
100101010 100101010 012010101
110110110 120120120 001001001
151617181920212223 110100011
001011100 110110111 001001000
451111112 111112311 121121123 111111111
16.5916.5816.5116.5716.5516.5516.5416.5916.57
16.63416.634 16.55816.558 16.48216.482 0.2180.218 0.0960.096 0.0000.000
00
00
23
01
01
20
2425
10
01
01
10
31
11
11
11 16.5616.53