Findings:
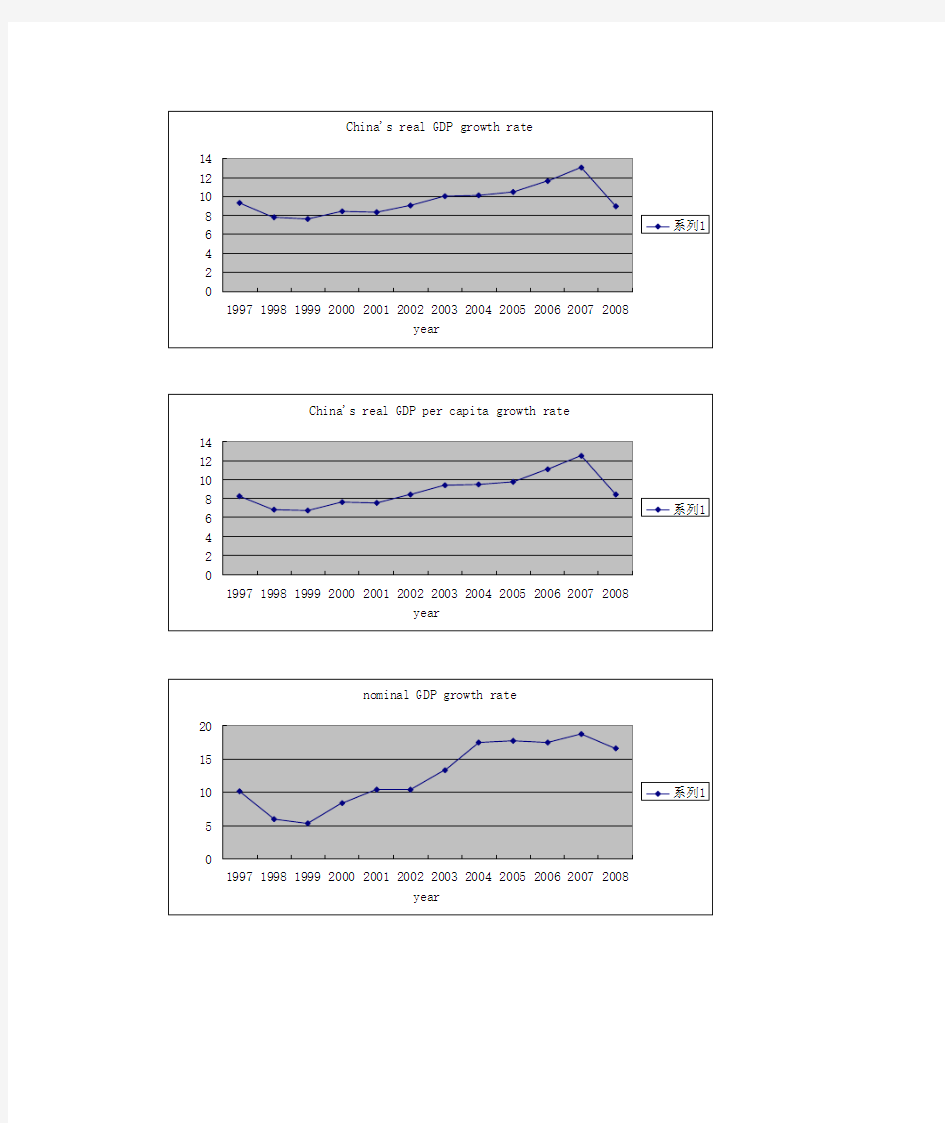
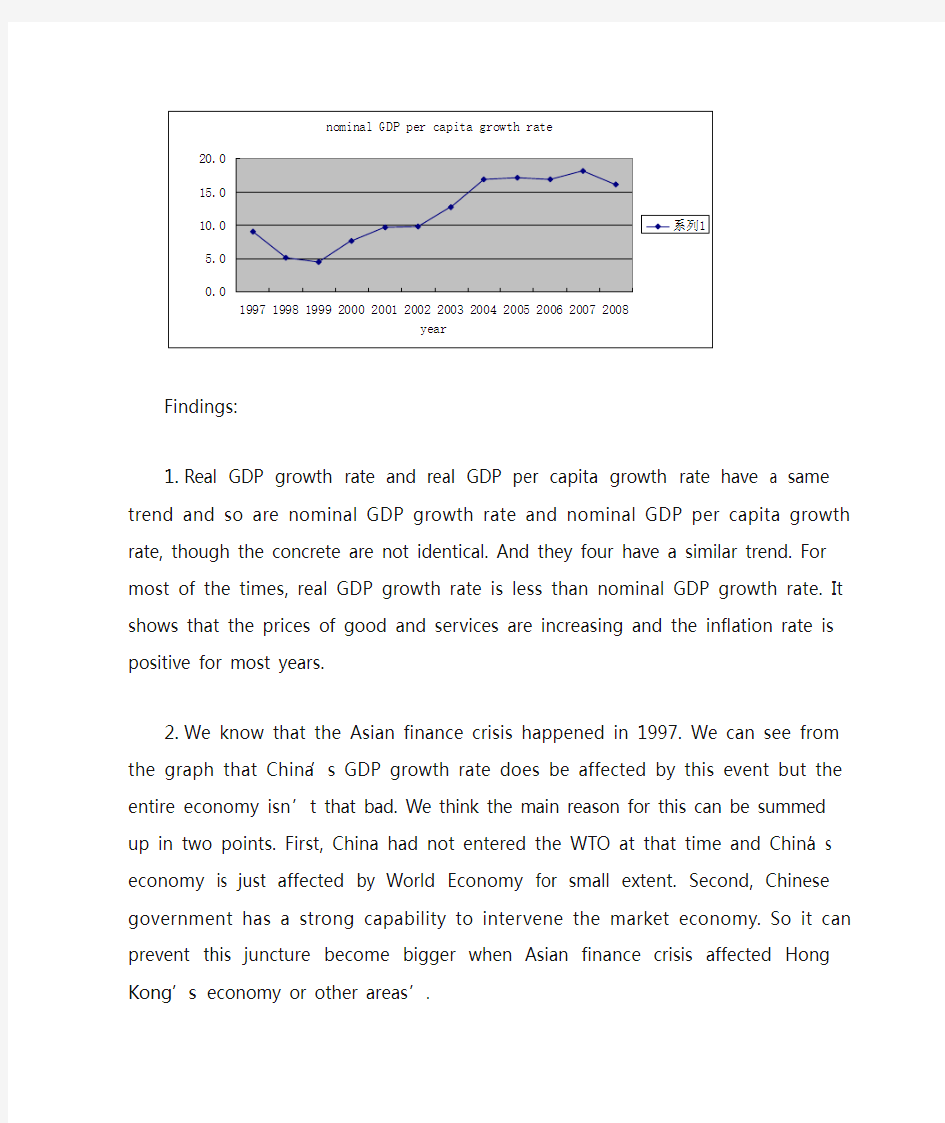
1.Real GDP growth rate and real GDP per capita growth rate have a same trend and so are
nominal GDP growth rate and nominal GDP per capita growth rate, though the concrete are not identical. And they four have a similar trend. For most of the times, real GDP growth rate is less than nominal GDP growth rate. It shows that the prices of good and services are increasing and the inflation rate is positive for most years.
2.We know that the Asian finance crisis happened in 1997. We can see from the graph that
China’s GDP growth rate does be affected by this event but the entire economy isn’t that bad.
We think the main reason for this can be summed up in two points. First, China had not entered the WTO at that time and China’s economy is just affected by World Economy for small extent. Second, Chinese government has a strong capability to intervene the market economy. So it can prevent this juncture become bigger when Asian finance crisis affected Hong Kong’s economy or other areas’.
3.After China’s accession to the World Trade Organization, China’s economy developed
gradually. The graph shows that no matter it is real GDP, or nominal GDP, it has a major development. It was possible that some companies didn’t get extra profit or even became worse after China entered the WTO. But the whole economy was getting better. Globalization is a chance and it is also a challenge for all the counties.
4.The GDP growth rate (both real GDP and nominal GDP) suddenly dropped down in 2008. We
know that the major reason for this situation is the subprime crisis. This economic crisis broke out from US and it quickly affected the whole world, of course including China. Compared to other counties, China didn’t suffer a lot from it. But this event warns us that we have to be careful about the economic or financial crisis at anytime.
5.There are also a lot of things which we can’t get from these graphs. The total GDP and GDP
per capita is increasing but we believe there also are many problems hided in these beautiful data. For example, the bubble of real estate market is a big problem for Chinese ordinary people and also for the government.
1.From these graphs we know that the inflation rate is negative in the year of 1998, 1999 and
2000. It means that in these years, the prices of goods and services are decreasing. And as for other years, the prices are increasing. Especially for recent years, both GDP deflator and inflation rate are really very high. Chinese people are under the pressure of high prices of goods and services.
2.The inflation rate is negative in 1998 to 2000, but the GDP is increasing. It tells us that the
prices of goods and services were decreasing but the quantity of goods and services which are dealt in the market were increasing. We can not make sure what events lead to this situation because there are not enough reports talking about this problem. But we think the Asian Financial Crisis must have something to do with this condition.
3.After China entered the WTO, both GDP deflator and inflation rate are increasing for most of
the years. On one side, it shows that China’s economy is developing. On the other side, it shows that China is under the pressure of inflation,
4.We think the rising prices of food, energy and other raw materials is the main reason for the
high inflation rate in developing countries and in China the price of real estate is also a big problem. And a fter the subprime crisis, the U.S. Federal Reserve takes some measures that make developing countries facing the pressure of inflation. Chinese government has taken some measures to make the inflation rate in control, such as increasing the reserve rate for several times. We hope this condition can be better in this and following years.
Reference:
《亚洲金融危机及其对中国的启示》周见《短期内通胀率难以形成趋势回落》刘煜辉