
Vol.23no.52007,pages641–643 BIOINFORMATICS APPLICATIONS NOTE doi:10.1093/bioinformatics/btm011 Genetics and population analysis
R/qtlbim:QTL with Bayesian Interval Mapping
in experimental crosses
Brian S.Yandell1,2,?,Tapan Mehta3,Samprit Banerjee3,Daniel Shriner3,
Ramprasad Venkataraman3,Jee Young Moon1,W.Whipple Neely1,Hao Wu4,
Randy von Smith5and Nengjun Yi3
1Department of Statistics and2Department of Horticulture,University of Wisconsin-Madison,1300University Avenue, Madison,WI53706,USA,3Section on Statistical Genetics,Department of Biostatistics,University of Alabama at Birmingham,Birmingham,AL35294,USA,4Department of Biostatistics,Johns Hopkins Bloomberg School of Public Health,615North Wolfe Street,Baltimore,MD21205,USA and5The Jackson Laboratory,600Main Street,
Bar Harbor,ME04609,USA
Received on October25,2006;revised on December11,2006;accepted on January12,2007
Advance Access publication January19,2007
Associate Editor:Keith Crandall
ABSTRACT
Summary:R/qtlbim is an extensible,interactive environment for the Bayesian Interval Mapping of QTL,built on top of R/qtl(Broman et al.,2003),providing Bayesian analysis of multiple interacting quantitative trait loci(QTL)models for continuous,binary and ordinal traits in experimental crosses.It includes several efficient Markov chain Monte Carlo(MCMC)algorithms for evaluating the posterior of genetic architectures,i.e.the number and locations of QTL,their main and epistatic effects and gene–environment interactions. R/qtlbim provides extensive informative graphical and numerical summaries,and model selection and convergence diagnostics of the MCMC output,illustrated through the vignette,example and demo capabilities of R(R Development Core Team2006).
Availability:The package is freely available from https://www.doczj.com/doc/cd2778615.html,. Contact:byandell@https://www.doczj.com/doc/cd2778615.html, or nyi@https://www.doczj.com/doc/cd2778615.html,
1INTRODUCTION
The freely available QTL mapping package R/qtlbim (https://www.doczj.com/doc/cd2778615.html,)provides a comprehensive framework for Bayesian model selection of the genetic architecture of complex traits in experimental crosses.Classical approaches to model selection in QTL mapping,such as multiple interval mapping as implemented in QTL Cartographer(Basten et al.,2002), largely rely on stepwise model selection with separate fits to each possible model.The Bayesian approach has the advantage of sampling across the more probable models,and providing graphical summaries that can compare many models at once. R/qtlbim can infer multiple QTL in the presence of epistasis (gene–gene interaction)and gene–environment interactions.
R/qtlbim is built on the widely used R/qtl framework (Broman et al.,2003),which provides many graphical tools for data checking and classical model selection.R/qtlbim shares the extensibility features of R/https://www.doczj.com/doc/cd2778615.html,putationally intensive algorithms are written in C,with data manipulation and graphics in R.R/qtlbim is available across Windows,Linux and Mac OS X platforms and accepts a variety of input formats via R/qtl.
2MCMC TECHNOLOGY
Central to R/qtlbim is the Markov chain Monte Carlo (MCMC)technology(Yi,2004;Yi et al.,2004,2005). MCMC samples are drawn from the posterior distribution of genetic architecture,including the number and location of genetic loci,gene action effects at all loci,epistatic interactions between pairs of loci,fixed and random covariates and gene–environment interactions.These MCMC samples are then summarized and interpreted with graphs to infer key aspects of the genetic architecture.
MCMC sampling provides a mechanism to study the full Bayesian posterior distribution for any particular genetic architecture.Further,using a prior distribution to model uncertainty of genetic architecture leads to MCMC samples across multiple genetic architectures.This brings model selection formally into a Bayesian framework in which the genetic architecture is just another parameter to be estimated. 3FEATURES
R/qtlbim contains several efficient MCMC algorithms to search for genetic architectures that are most probable. It includes graphical and tabular summaries that assess the contribution of individual loci and pairs of loci while adjusting for effects of all other possible loci and covariates via model averaging.
Graphical tools allow the user to examine the MCMC samples by loci and genotypic effects in a variety of ways.They include estimation of Bayes factors for model selection on the
*To whom correspondence should be addressed.
?The Author2007.Published by Oxford University Press.All rights reserved.For Permissions,please email:journals.permissions@https://www.doczj.com/doc/cd2778615.html,641
number of QTL,the pattern of QTL across chromosomes and the patterns of epistatic and gene–environment interactions.High posterior density (HPD)regions provide estimates of QTL analogous to LOD support intervals.Suggestions for model selection are provided in vignettes,examples and demos using the R (R Development Core Team,2006)interactive documentation system.The primary vignette,qtlbim.pdf ,gives an overview of the package.Each command has a help page and corresponding example,which can be adapted to the user’s own data.The command demo (qtlbim )leads the user through several demonstrations of the package capabilities.The scan.pdf vignette provides more detail on R/qtlbim extensions of typical interval mapping scans.The R/qtl package (Broman et al .,2003)offers genome scans of the classical log odds (LOD)of Lander et al .,(1989)and the Bayesian log posterior density (LPD)of Sen et al .(2001).These only consider the effect of one (scanone )or two (scantwo )QTL on a phenotype.R/qtlbim’s scan routines,principally qb.scanone and qb.scantwo ,use R/qtl’s generic plot routines for 1-D and 2-D scans,respectively.However,our philosophy differs in important ways beyond changes in the calling sequence and our use of the qb prefix.Our scans consider the contribution of a given locus,or a pair of loci,to the LPD after adjusting for all other possible QTL and covariates by model averaging over all genetic architectures that contain the QTLs being examined.These marginal scans are partitioned into contributions from main effects,epistatic interactions and gene–environment interactions.Another important distinction is that we provide functions to estimate marginal heritability,Bayes factors,means by genotypes and other features in addition to LPD.
A third vignette,hyperslide.pdf ,offers a way to automate model selection for genetic architecture of a complex trait.By default,it analyzes the hypertension data of Sugiyama et al .(2001)illustrated below.However,this vignette is an interactive object that can be reconfigured with another dataset using the qb.sweave command,via the Sweave framework (Leisch,2002).Sweave is an advanced feature using the LaTeX (https://www.doczj.com/doc/cd2778615.html,)typesetting system,which must be separately
installed.
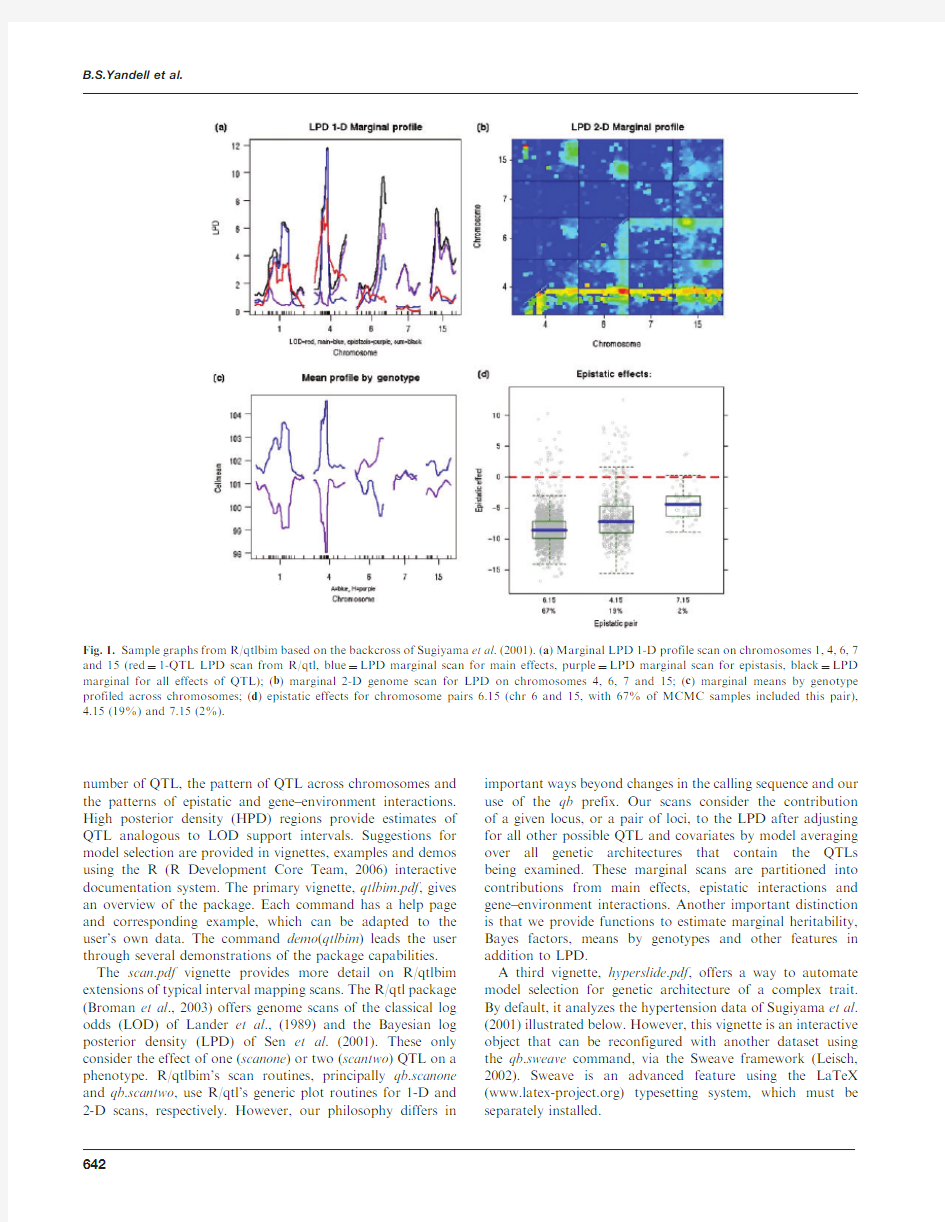
Fig.1.Sample graphs from R/qtlbim based on the backcross of Sugiyama et al .(2001).(a )Marginal LPD 1-D profile scan on chromosomes 1,4,6,7and 15(red ?1-QTL LPD scan from R/qtl,blue ?LPD marginal scan for main effects,purple ?LPD marginal scan for epistasis,black ?LPD marginal for all effects of QTL);(b )marginal 2-D genome scan for LPD on chromosomes 4,6,7and 15;(c )marginal means by genotype profiled across chromosomes;(d )epistatic effects for chromosome pairs 6.15(chr 6and 15,with 67%of MCMC samples included this pair),4.15(19%)and 7.15(2%).
B.S.Yandell et al.
642
An example of graphical output from R/qtlbim is provided in Figure1,using the salt-induced hypertension data of Sugiyama et al.(2001)that is available in R/qtl.Note the improvement in LPD over R/qtl scanone by(1)adjusting for effects of all other possible QTL and(2)providing marginal evidence for epistasis.
4FUTURE DEVELOPMENT
R/qtlbim is under continual development.Future plans include proper treatment of the X chromosome(Broman et al.,2006) and extensions to correlated traits and experimental crosses derived from multiple inbred lines and outbred populations. We are also investigating ways to assess false discovery and check the fit of a model to data and prior assumptions. More extensive graphics for gene–environment interactions and for ordinal traits are planned.We intend to build on the graphical user interface for R/qtl that is under development, and we are in close communication with the R/qtl development team.
ACKNOWLEDGEMENTS
Special thanks to Karl Broman,who provided useful feedback and coordinated the R/qtl releases and changes with us.This work is supported by National Institutes of Health(NIH) Grants R01GM069430(NY).In addition,RVS has partial support from NIH GM070683;BSY has partial support from NIH/PA-02-110,NIH/NIDDK5803701and NIH/NIDDK 66369-01;and NY has partial support from NIH HL80812, ES09912and DK067487.
Conflict of Interest:none declared.
REFERENCES
Basten,C.J.et al.(2002)QTL Cartographer,Version 1.16.Department of Statistics,North Carolina State University,Raleigh,NC.
Broman,K.W.et al.(2006)The X chromosome in quantitative trait locus mapping.Genetics,174,2151–2158.
Broman,K.W.et al.(2003)R/qtl:QTL mapping in experimental crosses.
Bioinformatics,19,889–890,https://www.doczj.com/doc/cd2778615.html,.
Leisch,F.(2002)Dynamic generation of statistical reports using literate data analysis.In Ha rdle,W.and Ro nz,B.(eds.)Compstat2002—Proceedings in Computational Statistics,Physika Verlag,Heidelberg,Germany, pp.575–580.
Lander,E.S.et al.(1989)Mapping Mendelian factors underlying quantitative traits using RFLP linkage maps.Genetics,121,185–199.
R Development Core Team(2006)R:A Language and Environment for Statistical Computing.R Foundation for Statistical Computing,Vienna,Austria,ISBN 3-900051-07-0,https://www.doczj.com/doc/cd2778615.html,.
Sen,S.et al.(2001)A statistical framework for quantitative trait mapping.
Genetics,159,371–387.
Sugiyama,F.et al.(2001)Concordance of murine quantitative trait loci for salt-induced hypertension with rat and human loci.Genomics,71, 70–77.
Yi,N.(2004)A unified Markov chain Monte Carlo framework for mapping multiple quantitative trait loci.Genetics,167,967–975.
Yi,N.et al.(2004)Mapping multiple quantitative trait loci for ordinal traits.
Behavior Genetics,34,3–15.
Yi,N.et al.(2005)Bayesian model selection for genome-wide epistatic quantitative trait loci analysis.Genetics,170,1333–1344.
QTL with Bayesian Interval Mapping in experimental crosses
643