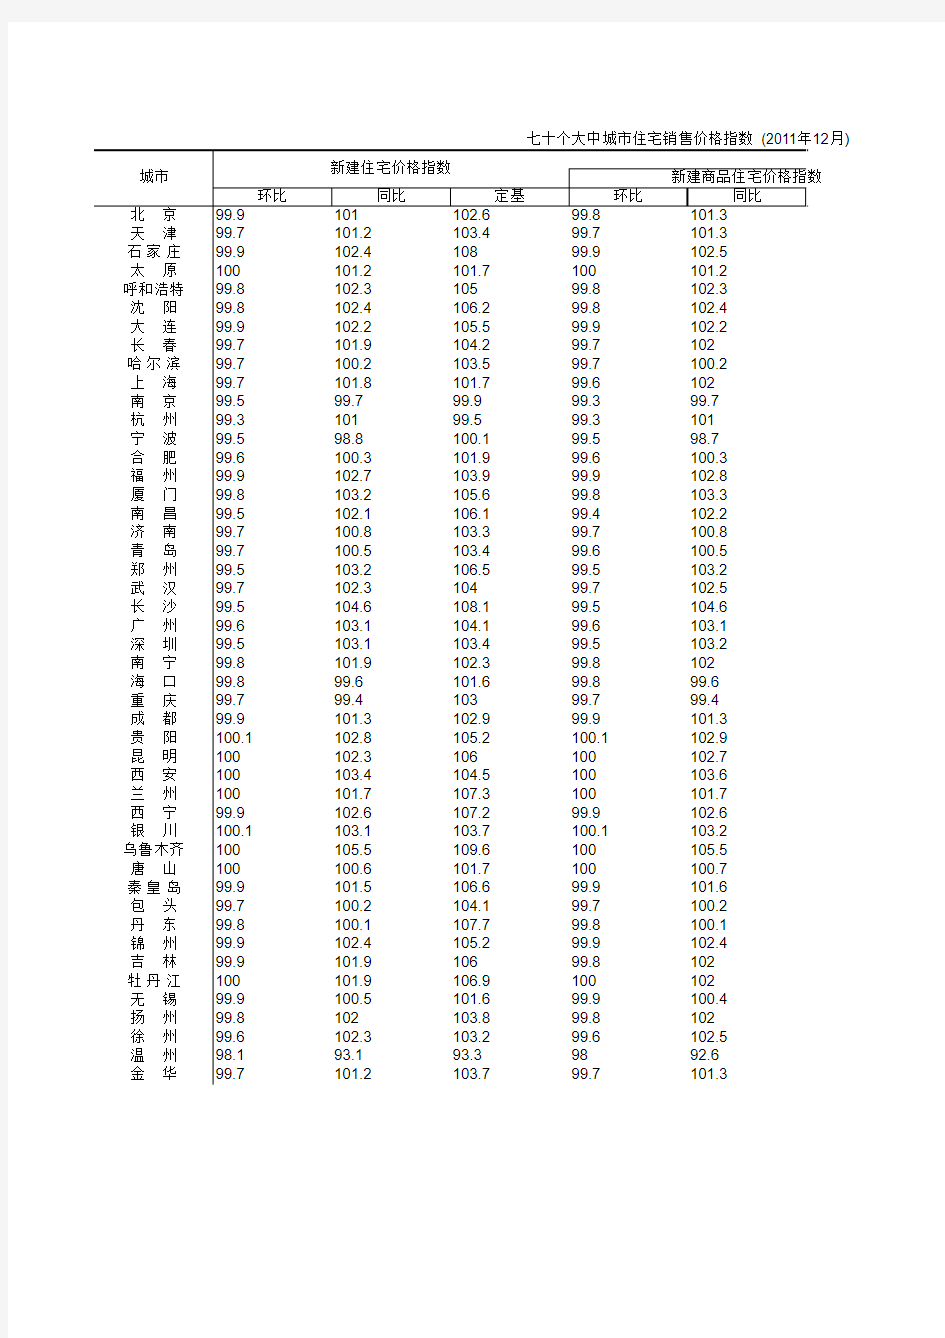

12月)
Note: The price of the same month in the previous year is 100 for year-on-year comparison, the price of the pr
(2011
103.899.797.698.8
108.29997.599.2
101.899.9103.2105.2
105.2100102.4104
106.7100101.4104.3
105.599.7100102.3
104.399.2100100.4
103.799.79899.5
10299.6101.7101.9
99.899.197.597.2
99.498.695.696.7
100.199.398.296.7
101.998.897.9100.2
1049995.195.3
105.799101.6101.7
106.299.697.398.8
103.399.8101102.6
103.599.398.8101.1
106.799.499.3103.1
104.299.699.6101.2
108.299.9100.2101.2
104.299.6102.1103.3
103.599.6102.7103.7
102.499.599.7101.2
101.699.298.295.9
10310099.5100.2
102.999.7100.7100.3
105.5100.1103.8107.7
106.499.5101.1103.2
104.899.9100102.8
107.498.79199
107.2100103.2106.2
103.899.5102.4103.1
109.699.6102.8108.4
101.999.8104.3104.5
107.399.699.3101.3
104.299.1101.5101.5
107.7100101.2102.3
105.2100100100.2
106.299.8102.4104.6
10799.1101103
101.6100103.8104.9
103.999.599.9102.2
103.399.796.997
92.995.188.794.4
103.79997.196.4
103.699.9101.3104.1
103.699.398.1100.4
101.199.799.399.3
102.899.599.4101.2
105.110098.599.1
103.999.9101.4103.4
103.499.6101105.2
10799.6104.2107.3
104.999.7106.3106.3
104.5100100.9102.2
106.4100101.8105.5
107.999.9100106.7
105.2100.2105108.2
104.9100103.1105.2
105.4100102.7106.2
106.4100102.8103.1
106.210099.7102.1
102.1100102.1102
101.497.893.995.5
102.399.7101.3100.2
99.999.8100.6101.1
106100.1102.4108.2
101.810098.8103.3
列北京市“新建商品住宅价格指数”与北京市有关部门发布的“新建普通住房价格”在统计口径、统计标准等方面均有不同。
he previous month is 100 for chain comparison and the year 2010 is 100 for f