Elemental abundances of Galactic bulge planetary nebulae from optical recombination lines
- 格式:pdf
- 大小:1.08 MB
- 文档页数:35
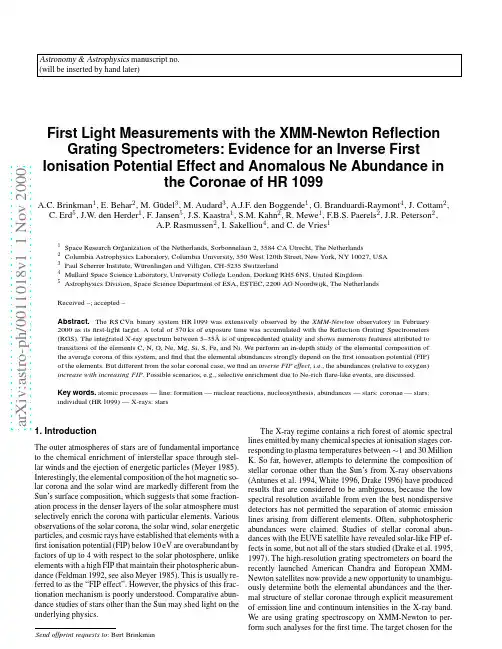
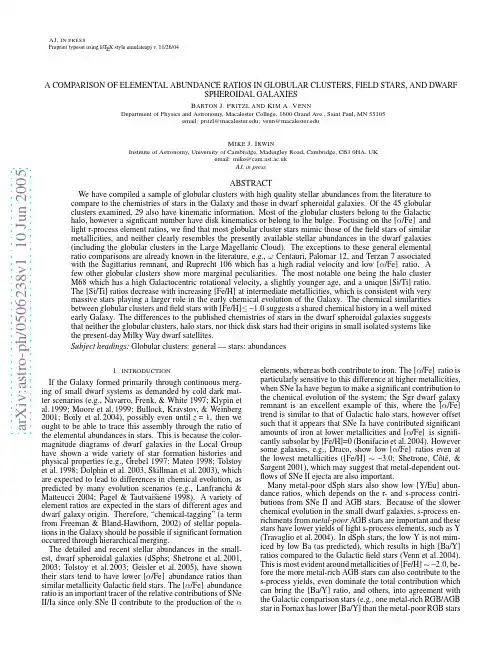
a r X i v :a s t r o -p h /0011018v 1 1 N o v 2000Astronomy &Astrophysics manuscript no.(will be inserted by hand later)First Light Measurements with the XMM-Newton Reflection Grating Spectrometers:Evidence for an Inverse First Ionisation Potential Effect and Anomalous Ne Abundance inthe Coronae of HR 1099A.C.Brinkman 1,E.Behar 2,M.G¨u del 3,M.Audard 3,A.J.F.den Boggende 1,G.Branduardi-Raymont 4,J.Cottam 2,C.Erd 5,J.W.den Herder 1,F.Jansen 5,J.S.Kaastra 1,S.M.Kahn 2,R.Mewe 1,F.B.S.Paerels 2,J.R.Peterson 2,A.P.Rasmussen 2,I.Sakelliou 4,and C.de Vries 11Space Research Organization of the Netherlands,Sorbonnelaan 2,3584CA Utrecht,The Netherlands2Columbia Astrophysics Laboratory,Columbia University,550West 120th Street,New York,NY 10027,USA 3Paul Scherrer Institute,W¨u renlingen and Villigen,CH-5235Switzerland4Mullard Space Science Laboratory,University College London,Dorking RH56NS,United Kingdom5Astrophysics Division,Space Science Department of ESA,ESTEC,2200AG Noordwijk,The NetherlandsReceived –;accepted –Abstract.The RS CVn binary system HR 1099was extensively observed by the XMM-Newton observatory in February 2000as its first-light target.A total of 570ks of exposure time was accumulated with the Reflection Grating Spectrometers(RGS).The integrated X-ray spectrum between 5–35˚Ais of unprecedented quality and shows numerous features attributed to transitions of the elements C,N,O,Ne,Mg,Si,S,Fe,and Ni.We perform an in-depth study of the elemental composition of the average corona of this system,and find that the elemental abundances strongly depend on the first ionisation potential (FIP)of the elements.But different from the solar coronal case,we find an inverse FIP effect ,i.e.,the abundances (relative to oxygen)increase with increasing FIP .Possible scenarios,e.g.,selective enrichment due to Ne-rich flare-like events,are discussed.Key words.atomic processes —line:formation —nuclear reactions,nucleosynthesis,abundances —stars:coronae —stars:individual (HR 1099)—X-rays:stars1.IntroductionThe outer atmospheres of stars are of fundamental importance to the chemical enrichment of interstellar space through stel-lar winds and the ejection of energetic particles (Meyer 1985).Interestingly,the elemental composition of the hot magnetic so-lar corona and the solar wind are markedly different from the Sun’s surface composition,which suggests that some fraction-ation process in the denser layers of the solar atmosphere must selectively enrich the corona with particular elements.Various observations of the solar corona,the solar wind,solar energetic particles,and cosmic rays have established that elements with a first ionisation potential (FIP)below 10eV are overabundant by factors of up to 4with respect to the solar photosphere,unlike elements with a high FIP that maintain their photospheric abun-dance (Feldman 1992,see also Meyer 1985).This is usually re-ferred to as the “FIP effect”.However,the physics of this frac-tionation mechanism is poorly parative abun-dance studies of stars other than the Sun may shed light on the underlying physics.2 A.C.Brinkman et al.:XMM-Newton RGS observations of HR1099Fig.1.First order spectrum of HR1099as measured by the RGS instruments onboard XMM-Newton.The most promi-nent spectral features are indicated justabove the spectrum by the correspond-ing emitting ion.present observation is HR1099,one of the X-ray brightest and most magnetically active stellar systems,which was observed early in the programme.HR1099has been the target of previ-ous EUVE and low-resolution X-ray spectroscopic investiga-tions(e.g.Pasquini et al.1989,Griffith&Jordan1998).Ayres et al.(2001)qualitatively compare the Chandra HETG spec-tra of HR1099and Capella,the latter being a somewhat cooler and less active coronal source.A companion paper(Audard et al.2001)to the present work discusses spectral variability in HR1099,based on selected XMM-Newton RGS data sets. 2.Observations and AnalysisThe XMM-Newton X-ray observatory incorporates a pay-load with two identical high-resolution Reflection Grating Spectrometers(RGS;den Herder et al.2001)with a spectral resolution of about0.06˚A FWHM.The spectral band cov-ered by the RGS ranges from5to35˚A.This range contains strong lines of C,N,O,Ne,Mg,Si,S,Ca,Fe,and Ni.The clearly detected eight consecutive charge states of Fe are of crucial importance for the present analysis.HR1099was ob-served in January and February2000for a total of570ksec yielding approximately1.3million source counts.The spec-trum was extracted by counting events inside a narrow spatial window along the dispersed CCD image,and then by using the CCD energy resolution to separate the spectral orders.The ex-tracted totalfirst-order spectrum between7and35˚A is shown in Fig.1.3.ResultsIn optically thin coronal plasmas,the power of a particular spectral line depends on the collisional and radiative transition rates.In this work,these quantities are calculated by means of the relativistic Hebrew University Lawrence Livermore Atomic Code(Bar-Shalom et al.1998).Owing to the high spectral resolution,we can directly scale the contribution of each ion species to match the observation.The atomic-level models are each calculated for a single electron temperature,T max, at which the relevant ion has its maximum abundance.Fig.2 shows the theoretical spectrum from7–18˚A(red curve),which also includes a phenomenological continuum component(blue) corresponding to a bremsstrahlung spectrum(which dominates over any other continuum components at the temperatures in question),compared with the HR1099data points(black).As can be seen,the agreement is very good.The majority of lines in this region are due to highly ionised Fe as demonstrated by the individual ion curves at the bottom of thefigure.The con-tribution of each ion species yields a direct measurement of the amount of coronal gas in the conditions appropriate for that ion.With the distance d(=29pc)to HR1099,the calculated line power and the measured lineflux can be used to ob-tain the emission measure EM(in cm−3),which is a product of the electron density and the H-ion density,integrated over the emitting volume.We assume that each ion emits mostly around the temperature T max.This leads to afirst approxi-mation of the emission measure distribution.This distribution is sufficiently accurate for our purposes if no steep gradients are present.Finally,in order to plot the EM,we use the ionic abundances from ionisation balance calculations(Arnaud& Raymond1992,Mazotta1998)and assume,as afirst step,ele-mental abundances of the solar photosphere.The resulting EM as a function of the electron temperature T e is shown in Fig.3 for ions of C,N,O,Ne,Mg,S,Fe,and Ni.These ions sample the HR1099hot coronae in the T e range from kT e=100eV to1500eV and illustrate the monotonic increase of the EM in this range.The errors on the temperature for each ion represent the range of T e for which the ion fraction exceeds50%of its maximum value,except for the He-like ions O6+,Ne8+,and Mg10+,for which line ratio methods(Gabriel&Jordan1969) are used to determine T e more precisely and the bars reflect a 25%uncertainty.HR10993Fig.2.Observed HR1099flux spec-trum(black dots)compared with thetotal calculated spectrum(red curve).The inferred thermal bremsstrahlungcontinuum is represented by the bluecurve.The eight separate plots at thebottom show the relative individual-ioncontributions of Fe16+to Fe23+(not toscale).The non-Fe lines(O,Ne,Mg,and Ni)are indicated explicitly.Table1.Abundance estimates a of the HR1099coronae,Solar photosphere b and Solar corona c relative to ONe21.560.570.150.15 1.0 3.8N14.530.170.120.13 1.08 1.4O13.61 1.0 1.0 1.0 1.0 1.0C11.260.280.470.50 1.060.59S10.360.00850.0190.024 1.260.45Fe7.870.00940.0380.16 4.210.25Mg7.640.0430.0450.18 4.00.95Ni7.630.000700.00210.0089 4.240.334 A.C.Brinkman et al.:XMM-Newton RGS observations of HR 10993.The empirical emission measure O 6+,O 7+,Ne 8+,Ne 9+,Mg 10+,11+,Fe 16+through Fe 23+,Ni 18+,5+,N 6+and S 13+(in order from left right for each element).The straight is the best-fit power-law for the Fealone.Fig.4.Enrichment of elemental abun-dances in the HR 1099coronae rela-tive to (solar)photospheric values,plot-ted as a function of the first ionisation potential (FIP).All values are given error bars of 20%.Note the increase with FIP,exactly opposite the trend ob-served in the average solar corona.the respective ratios of the solar corona,the contrast is even sharper.In fact,HR 1099reveals systematically a reversed FIP effect,which is illustrated in Fig.4;the coronal enrichment in-creases monotonically with the FIP.The only exception may be Mg (low FIP).Ne is strongly enhanced,by a factor of 3.8compared to the solar photosphere.This enhancement is rem-iniscent of a similar anomaly observed in a subset of solar flares (Schmelz 1993,Murphy et al.1991).Interestingly,flares are thought to be of great importance to the heating of ap-parently quiet coronae of active stars (Doyle &Butler 1985,G¨u del 1994,Audard et al.2000)and have been suggested to be pivotal for the elemental fractionation process as well (Wang1996,G¨u del et al.1999,Mewe et al.1997).Continuous mix-ing of photospheric and coronal material in low-lying loops through frequent flares could suppress the solar-like FIP effect (Feldman &Widing 1990)in these stars altogether.It is generally believed that the fractionation is the result of diffusive processes across magnetic field lines somewhere in the chromosphere,where the ionisation fraction differs sub-stantially among elements of high or low FIP (von Steiger &Geiss 1989).Low FIP elements can then be accelerated into the quiescent corona,leaving an excess of high FIP elements in the chromosphere (Schmelz 1993).If this chromospheric layer can be accessed by flares (Schmelz 1993),then a high-FIP-A.C.Brinkman et al.:XMM-Newton RGS observations of HR10995rich plasma may be heated and lifted into dense coronal X-ray loops giving rise to the reversed coronal FIP effect observed in HR1099.In any case,it is clear that the simple mechanism in-volving steady-state diffusion,which has been proposed for the quiet solar corona,does not operate in more active stars such as HR1099.Since cosmic rays do show a low FIP enhancement, it is unlikely that such active stars can be major contributors to the cosmic rayflux.The wide survey of stellar coronae planned with the RGS on XMM-Newton will provide more general an-swers to the questions raised by these observations. Acknowledgements.We thank the many teams in industry and at the scientific institutions and ESA,for building such an excellent space-craft and payload-and operating it.We are particularly grateful to Mr.Robert Lain´e and his project team at ESA for leading the project.We thank the XMM-Newton SOC staff for making the com-missioning phase data available to us.SRON isfinancially supported by the Netherlands Organization for Scientific Research(NWO). The Columbia University team acknowledges generous support from the National Aeronautics and Space Administration.The PSI group is supported by the Swiss Academy of Natural Sciences and the Swiss National Science Foundation(grants2100-049343and2000-058827).MSSL acknowledges support from the Particle Physics and Astronomy Research Council.This work is based on observations ob-tained with XMM-Newton,an ESA science mission with instruments and contributions directly funded by ESA member states and the USA (NASA).ReferencesAntunes,A.,Nagase,F.,White,N.E.1994,ApJ,436,L83 Arnaud,M.,Raymond,J.1992,ApJ,398,394Audard,M.,G¨u del,M.,Drake,J.J.,Kashyap,V.2000,ApJ,in press Audard,M.,G¨u del,M.,Mewe,R.2001,A&A,365(this issue) Ayres,T.R.,Brown,A.,Osten,R.A.,Huenemoerder,D.P.,Drake,J.J., Brickhouse,N.S.,Linsky,J.L.2001,ApJ,in pressBar-Shalom,A.,Klapisch,M.,Goldstein,W.H.,Oreg,J.1998,The HULLAC Code for Atomic Physics,unpublishedden Herder,J.W.,Brinkman,A.C.,Kahn,S.M.,et al.2001,A&A,365 (this issue)Doyle,J.G.,Butler,J.1985,Nature,318,378Drake,J.J.,Laming,J.M.,Widing,K.G.1995,ApJ,443,393 Drake,J.J.,Laming,J.M.,Widing,K.G.1997,ApJ,478,403 Drake,S.A.1996,in:X-ray Measurements of Coronal Abundances, 6th Ann.Astrophysics Conference,ASP Conf.Proc.,S.S.Holt,G.Sonneborn(eds.),San Francisco:ASP,p.215Feldman,U.1992,Phys.Scripta46,202Feldman,U.,Mandelbaum,P.,Seely,J.F.,Doschek,G.A.,Gursky,H.1992,ApJS,81,387Feldman,U.,Widing,K.G.1990,ApJ,363,292Gabriel,A.H.,Jordan,C.1969,MNRAS,145,241G¨u del,M.1994,ApJS,90,743G¨u del,M.,Linsky,J.L.,Brown,A.,Nagase,F.1999,ApJ,511,405 H´e noux J.-C.1995,Adv.Space Res.,15,23Mazzotta,P.,Mazzitelli,G.,Colafrancesco,S.,Vittorio,N.1998, A&ASS,133,403Meyer,J.P.1985,ApJ,57,173Mewe,R.,Kaastra,J.S.,van den Oord,G.H.J.,Vink,J.,Tawara,Y.1997,A&A,320,147Murphy,R.J.,Ramaty,R.,Kozlovsky,B.,Reames,D.V.1991,ApJ, 371,793Pasquini,L.,Schmitt,J.H.M.M.,Pallavicini,R.1989,A&A,226,225Randich,S.,Giampapa,M.S.,Pallavicini,R.1994,A&A,283,893 Schmelz,J.T.1993,ApJ,408,373von Steiger,R.,Geiss,J.1989,A&A,225,222Wang,Y.-M.1996,ApJ,464,L91White,N.E.1996,in:Cool stars,Stellar Systems and the Sun,ASP Conf.Series,109,p.193。
小学下册英语第四单元真题(含答案)考试时间:90分钟(总分:120)A卷一、综合题(共计100题共100分)1. 听力题:They are _____ (cooking/eating) dinner together.2. 听力题:Heat is a form of ______ energy.3. 填空题:The rabbit has a cute ______ (鼻子).4. 填空题:The ______ (小鸟) sits on a branch.5. 听力题:I have a _____ of chocolate in my bag. (bar)6. 选择题:What do we call the season when flowers bloom?A. AutumnB. WinterC. SpringD. Summer7. 选择题:What is the capital of Portugal?A. LisbonB. MadridC. RomeD. Athens答案: A. Lisbon8. 选择题:What do you call a group of fish swimming together?A. SchoolB. PackC. FlockD. Herd答案: A9. 填空题:I enjoy visiting the ________ (历史博物馆).10. 填空题:The ant builds complex ______ (巢穴) underground.11. 填空题:A ____(green marketing) emphasizes sustainability in advertising.12. 选择题:What is the name of the princess in "Aladdin"?A. JasmineB. ArielC. BelleD. Cinderella答案:A13. 选择题:What do we call the time when we eat lunch?A. BreakfastB. LunchC. DinnerD. Snack答案: B14. 听力题:A _______ is the state of matter that has a fixed volume but not a fixed shape.15. 听力题:The symbol for thorium is _____.16. 听力题:We collaborate on ________ (tasks) regularly.17. 选择题:What is the primary function of the heart?A. To digest foodB. To pump bloodC. To breatheD. To think答案: B18. 选择题:What is the capital of Venezuela?A. CaracasB. BogotaC. QuitoD. Lima19. 选择题:What is the primary color of a stop sign?a. Blueb. Yellowc. Redd. Green答案:C20. 选择题:What is the capital of Lesotho?a. Maserub. Teyateyanengc. Maputsoed. Mohale's Hoek答案:a21. 填空题:The ________ (植物适应性) to climate is amazing.22. 填空题:Elements on the left side of the periodic table are usually __________ (金属).23. 听力题:I will _____ (help/helped) you with your homework.24. 听力题:The chemical formula for sodium phosphate is _____.25. 填空题:I can ______ (参与) in community service projects.26. 选择题:What do we call the time when leaves fall from trees?A. SpringB. SummerC. FallD. Winter答案: C27. grant application) requests funding for initiatives. 填空题:The ____28. 选择题:What is the term for a young sheep?A. CalfB. FoalC. LambD. Kid答案:C29. 填空题:Violets are _______ flowers that bloom in spring.30. 选择题:根据短文内容,选出Tom和 Chen Jie 书包里的物品。

五年级世界历史英语阅读理解25题1<背景文章>Ancient Egypt is one of the most fascinating civilizations in history. The Egyptians made many great achievements. One of their most famous creations is the pyramid. Pyramids were huge structures built as tombs for the pharaohs. They were made of large stones and took many years to build.Another amazing achievement of the Egyptians is the mummy. Mummies are the preserved bodies of dead people. The Egyptians believed that the body needed to be preserved so that the soul could return after death. They used special techniques to dry out the body and wrap it in linen bandages.The Egyptians also had a very advanced writing system called hieroglyphics. Hieroglyphics were pictures and symbols that represented words and ideas. Only a few people knew how to read and write hieroglyphics.Egypt was also known for its beautiful art and architecture. The temples and palaces were decorated with colorful paintings and carvings.1. The pyramids were built as ________ for the pharaohs.A. homesB. templesC. tombsD. palaces答案:C。
a r X i v :a s t r o -p h /0506238v 1 10 J u n 2005AJ,IN PRESSPreprint typeset using L A T E X style emulateapj v.11/26/04A COMPARISON OF ELEMENTAL ABUNDANCE RATIOS IN GLOBULAR CLUSTERS,FIELD STARS,AND DW ARFSPHEROIDAL GALAXIESB ARTON J.P RITZL AND K IM A.V ENNDepartment of Physics and Astronomy,Macalester College,1600Grand Ave.,Saint Paul,MN 55105email:pritzl@;venn@M IKE J.I RWINInstitute of Astronomy,University of Cambridge,Madingley Road,Cambridge,CB30HA,UKemail:mike@AJ,in pressABSTRACTWe have compiled a sample of globular clusters with high quality stellar abundances from the literature to compare to the chemistries of stars in the Galaxy and those in dwarf spheroidal galaxies.Of the 45globular clusters examined,29also have kinematic information.Most of the globular clusters belong to the Galactic halo,however a signficant number have disk kinematics or belong to the bulge.Focusing on the [α/Fe]and light r-process element ratios,we find that most globular cluster stars mimic those of the field stars of similar metallicities,and neither clearly resembles the presently available stellar abundances in the dwarf galaxies (including the globular clusters in the Large Magellanic Cloud).The exceptions to these general elemental ratio comparisons are already known in the literature,e.g.,ωCentauri,Palomar 12,and Terzan 7associated with the Sagittarius remnant,and Ruprecht 106which has a high radial velocity and low [α/Fe]ratio.A few other globular clusters show more marginal peculiarities.The most notable one being the halo cluster M68which has a high Galactocentric rotational velocity,a slightly younger age,and a unique [Si/Ti]ratio.The [Si/Ti]ratios decrease with increasing [Fe/H]at intermediate metallicities,which is consistent with very massive stars playing a larger role in the early chemical evolution of the Galaxy.The chemical similarities between globular clusters and field stars with [Fe/H]≤−1.0suggests a shared chemical history in a well mixed early Galaxy.The differences to the published chemistries of stars in the dwarf spheroidal galaxies suggests that neither the globular clusters,halo stars,nor thick disk stars had their origins in small isolated systems like the present-day Milky Way dwarf satellites.Subject headings:Globular clusters:general —stars:abundances1.INTRODUCTIONIf the Galaxy formed primarily through continuous merg-ing of small dwarf systems as demanded by cold dark mat-ter scenarios (e.g.,Navarro,Frenk,&White 1997;Klypin et al.1999;Moore et al.1999;Bullock,Kravstov,&Weinberg 2001;Boily et al.2004),possibly even until z =1,then we ought to be able to trace this assembly through the ratio of the elemental abundances in stars.This is because the color-magnitude diagrams of dwarf galaxies in the Local Group have shown a wide variety of star formation histories and physical properties (e.g.,Grebel 1997;Mateo 1998;Tolstoy et al.1998;Dolphin et al.2003,Skillman et al.2003),which are expected to lead to differences in chemical evolution,as predicted by many evolution scenarios (e.g.,Lanfranchi &Matteucci 2004;Pagel &Tautvai˘s ien˙e 1998).A variety of element ratios are expected in the stars of different ages and dwarf galaxy origin.Therefore,“chemical-tagging”(a term from Freeman &Bland-Hawthorn,2002)of stellar popula-tions in the Galaxy should be possible if significant formation occurred through hierarchical merging.The detailed and recent stellar abundances in the small-est,dwarf spheroidal galaxies (dSphs;Shetrone et al.2001,2003;Tolstoy et al.2003;Geisler et al.2005),have shown their stars tend to have lower [α/Fe]abundance ratios than similar metallicity Galactic field stars.The [α/Fe]abundance ratio is an important tracer of the relative contributions of SNe II/Ia since only SNe II contribute to the production of the αelements,whereas both contribute to iron.The [α/Fe]ratio is particularly sensitive to this difference at higher metallicities,when SNe Ia have begun to make a significant contribution to the chemical evolution of the system;the Sgr dwarf galaxy remnant is an excellent example of this,where the [α/Fe]trend is similar to that of Galactic halo stars,however offset such that it appears that SNe Ia have contributed significant amounts of iron at lower metallicities and [α/Fe]is signifi-cantly subsolar by [Fe/H]=0(Bonifacio et al.2004).However some galaxies,e.g.,Draco,show low [α/Fe]ratios even at the lowest metallicities ([Fe/H]∼−3.0;Shetrone,Côté,&Sargent 2001),which may suggest that metal-dependent out-flows of SNe II ejecta are also important.Many metal-poor dSph stars also show low [Y/Eu]abun-dance ratios,which depends on the r-and s-process contri-butions from SNe II and AGB stars.Because of the slower chemical evolution in the small dwarf galaxies,s-process en-richments from metal-poor AGB stars are important and these stars have lower yields of light s-process elements,such as Y (Travaglio et al.2004).In dSph stars,the low Y is not mim-iced by low Ba (as predicted),which results in high [Ba/Y]ratios compared to the Galactic field stars (Venn et al.2004).This is most evident around metallicities of [Fe/H]∼−2.0,be-fore the more metal-rich AGB stars can also contribute to the s-process yields,even dominate the total contribution which can bring the [Ba/Y]ratio,and others,into agreement with the Galactic comparison stars (e.g.,one metal-rich RGB/AGB star in Fornax has lower [Ba/Y]than the metal-poor RGB stars2Pritzl,Venn,&Irwinin Fornax,in excellent agreement with Galactic comparison field stars).The chemical comparisons of a large sample of Galactic field stars were compared to those in the small dSph galax-ies by Venn et al.(2004).There the stars were divided into Galactic components based on their kinematics.While there is some marginal evidence that Galactic halo stars with ex-treme retrograde orbits overlap in[α/Fe]with the stars in dSphs,this was not evident in the[Ba/Y]ratios.Thus,it ap-pears that no significant component of the Galactic halo,nor the Galactic thick disk which was also examined,could have formed from the mergers of these small dwarf galaxies.How-ever,these comparisons were based on the available detailed abundances in seven dSph galaxies,and primarily from stars in their centralfields.Early results from the much broader CaT survey in three dSphs(Sculptor,Fornax,and Sextans from the DART survey;e.g.,see Tolstoy et al.2004for Sculp-tor)shows that the stars in their centralfields tend to have higher metallicities than most of the stars out near their tidal radii.It is possible then that these outer dSphfield stars have different chemical abundance ratios,which may be more sim-ilar to the metal-poor stars in the Galactic halo;detailed abun-dance ratios for these outer metal-poor dSph stars are pend-ing.Aside from the selection of stars in the dSphs,the com-parisons examined by Venn et al.(2004)also did not rule out early merging,before the dwarf galaxies had a chance to have a significant and unique chemical evolution history;merging with larger dwarf galaxies was also not ruled out.It is also interesting to note that another important physical difference between the large and small dSphs galaxies is that the larger dwarf galaxies have higher masses and contain globular clus-ters(GCs;van den Bergh2000).In this paper,we ask how do the GCsfit into this scheme? Can the GCs be used as a test of the merging history of large dwarf galaxies in the formation of our Galaxy?If some of the Galactic GCs have extragalactic origins,then we may assume that they trace the merging history of the large dwarf galax-ies,given that GCs are only found in the larger Milky Way dwarf galaxies of the Magellanic Clouds,Sagittarius(Sgr), Fornax,and Canis Major(CMa).We caution that the op-posite is not true;not all massive dwarf galaxies have GCs. Therefore we can only say that if wefind an extragalactic GC that it must have come from a more massive dwarf galaxy. Presumably,differences in star formation histories,chemical evolution,and/or the initial conditions(mass,pre-enrichment, or environmental factors)between the various dwarf galax-ies could also leave discernable chemical imprints on their GCs that might be chemically tagged when merged into our Galaxy.It has been shown that the Sgr GCs Terzan7(Ter7) and Palomar12(Pal12)follow the abundance trends of the Sgrfield stars(e.g.,Cohen2004;Tautvai˘s ienéet al.2004). In addition,the GCs andfield stars analyzed in the Large Magellanic Cloud(LMC;Hill et al.2000;Hill2004)follow the same abundance trends that have lower[α/Fe]ratios(O, Ca,and Ti;with the possible exception of Mg)than similar metallicityfield stars in the Galaxy,which is similar to the field stars in the small dwarf galaxies.Thus,the question is whether there is a population of GCs in the Galaxy that have low[α/Fe]ratios(and possibly other chemical signatures) that could be interpreted as these clusters having formed in dwarf galaxies and later were captured through merging. There have been many papers that present and/or review the abundances in GCs,or compare a subset of GCs to one another and/or to Galacticfield stars(most recently Sneden,Ivans,&Fulbright2004;Gratton,Sneden,&Carretta2004). In general,the Galactic GCs show amazing uniformity in their [α/Fe]ratios(plateau levels∼+0.3dex),and they follow the abundance trends seen in the Galacticfield stars when plot-ted as a function of the[Fe/H]values.This seems incredi-ble in terms of understanding hierarchical galaxy formation. Carney(1996)showed that there is little or no relationship between[α/Fe]and age for the GCs.Given SNe Ia con-tributions lead to a decrease in the[α/Fe]ratios with in-creasing metallicity as seen in the Galacticfield stars,Car-ney argued that the lack of a similar turn-down for the GCs implies a lack of SNe Ia contributions to the GCs.There-fore,if the timescale of when the Type Ia supernovae sig-nificantly contribute to the interstellar medium is short,the “old”halo and disk GCs could not share a common chemi-cal history and one of the populations must have been later accreted.The exceptions include GCs associated with the Sgr dwarf galaxy,e.g.,Ter7and Pal12,which have lower [α/Fe]ratios than comparison Galactic stars(Cohen2004; Sbordone et al.2005;Tautvai˘s ien˙e et al.2004),and both have younger ages than typical Galatic halo GCs.Also,ωCen-tauri(Pancino et al.2002)and Ruprecht106(Rup106;Lin &Richer1992;Brown,Wallerstein,&Zucker1997)show peculiar chemical abundances and are thought to be captured clusters.But when it comes to GCs,the more common ques-tions have been related to the internal variations in CNO and NaMgAl observed in their red giant stars.These variations are attributed to a combination of initial composition differ-ences coupled with internal mixing mechanisms(Gratton et al.2004),though others have been exploring the possibilities and predictions of enrichments from early AGB stars during the cluster formation process(Cottrell&Da Costa1981).Be-cause these abundance anomalies are seen only in GCs and never infield stars,including in dwarf galaxyfield stars1, Shetrone et al.(1998,2001,2003)concluded that the GCs cannot have formed from the small dwarf galaxies,e.g.,dur-ing the merging event.However,GCs formed in large dwarf galaxies that later merged into the Galactic halo and survived has not been ruled out.In this paper,we re-examine the element ratios in as many Galactic GCs as available in the literature to compare with the Galacticfield stars and stars in the dwarf galaxies.The goal is to indentify candidate GCs that show signatures of extra-galactic origins either chemically or ideally both chemically and kinematically.While it has been found that smaller dwarf galaxies(such as the present-day Milky Way dSph satellites) have contributed little or nothing to the Galactic halo(at least from those stars as summarized in Venn et al.2004),the GCs should examine the contributions of larger dwarf galaxies. Thefield stars with detailed abundance ratios include only stars that are currently in the solar neighborhood,while the GCs sample all parts of the Galaxy,including the bulge.Of particular interest are the[α/Fe]ratios,as well as the light r-process ratios which have been successful in separating the Galacticfield stars from stars in the dSphs.We study the GC abundance ratios with regards to their kinematic populations having adopted the Galactocentric velocities(Π,Θ,W)from Dinescu et al.(1999a,b,2000,2001,2003,and private com-munications for updates)to separate the GCs into standard Galactic components(as discussed in§3).By noting which 1One report of a star in the Sgr dwarf galaxy remnant by Smecker-Hane& McWilliam(2005).However the metallicity and location of their metal-poor stars make them possible members of the M54GC(Bonifacio et al.2004).Elemental Abundance Comparisons3F IG .1.—Toomre diagram showing stellar and globular cluster populations using kinematic probabilities from velocity ellipsoids;thin disk (red),thick disk (green),halo (cyan),extreme retrograde stars (black).Field stars are points,while globular clusters are larger black circles filled with a color that refers to its phase space population.M54and Terzan 7are included in this plot with the velocity information for the Sagittarius dwarf galaxy remnant.Ruprecht 106is included after assuming a range in proper motions (see text).As expected,a little over half of the globular clusters have halo kinematics.See Venn et al.(2004)for field star data references.component of the Galaxy the clusters belong to,we also try to identify clusters that may have unusual abundance signatures for their kinematically assigned Galactic component.2.THE DATABASEDetailed elemental abundances are available for 45GCs;32clusters with ≥3stars analyzed.These clusters are listed in Table 1,along with the number of stars analysed in each cluster and references.The literature was searched for high-resolution abundances determined within the past 20years.The oldest analysis included here is by Gratton,Quarta,&Ortolani (1986)for three GCs.A majority of the analyses are from the past five years.We have found that studies from older than 1990used lower resolution spectra (∼15000).More modern studies that use lower resolution (18000or less)include McWilliam,Geisler,&Rich (1992),Mishen-ina,Panchuck,&Samus (2003),Cavallo,Suntzeff,&Pila-chowski (2004).We consider the abundance ratios coming from these studies as being less reliable.In most cases when abundance ratios based on higher resolution spectra are avail-able,those from lower resolution spectra are not included in the final mean ratios.Table 2lists the elemental abundances and their standard error of the mean for select elements from Mg to Eu for each of the GCs in Table 1.We adopted the solar abundances and log g f values used by the Lick-Texas group as the standard values (solar abundances,Grevesse &Sauval 1998;log g f ,see Table 3in Fulbright 2000for example).All abundance ratios were corrected to these values (observed -adopted)in an effort to standardize the different datasets 2.Details on the adjustments are given in §4.In Table 2,the final individual abundance ratios relative to Fe (shown in bold)were averaged together by weighted averages according to the number of2Unless no solar abundances and/or log g f values were given in the pub-lished article.stars that were used in each study.The [α/Fe]and comparison ratios,e.g.[Ba/Y],were calculated using the final weighted-mean ratios.The italicized ratios were not used in calculating the final weighted mean abundance ratios.The GCs in Table 2span a range of −2.38(M15)≤[Fe/H]≤−0.06(NGC 6528).In a majority of the cases,the [FeI/H]and [FeII/H]ratios were averaged when both were available.Similarly,the [Ti/Fe]ra-tio is the average of the [TiI/Fe]and [TiII/Fe]ratios when both were given for the cluster,otherwise it is the [TiI/Fe]ratio.Ideally,it would be best to match ionization states when deter-mining the Ti ratios,e.g.,[TiI/FeI]and [TiII/FeII].However,in most cases not enough information was presented to de-termine these values.Many papers give the final abundances [TiI/Fe]and [TiII/Fe]with no clear explanation how [FeI/H]and [FeII/H]were averaged together to determine [Fe/H].As a result,we used the mean [Fe/H]ratio when determining the Ti ratios.Our selection of elements was based on those deter-mined regularly in GC stars,and those that have been useful in the analysis of stars in dSph galaxies.Variations in CNO,Na,Mg,and Al are regularly found in clusters from star-to-star,and are usually attributed to mixing with CNO-cycled gas (e.g.,Kraft 1994;Sneden 2000;Free-man &Bland-Hawthorn 2002;Sneden et al.2004;Gratton et al.2004).We have avoided these elements in this paper (with the exception of magnesium 3given its relevance as a true αelement indicator)because we are primarily concerned with global signatures of galaxy formation and not stellar or chem-ical evolution within GCs.For abundances in Galactic field stars,we have adopted those in Table 2in Venn et al.(2004;see references therein).The abundances in seven dSph galaxies are from Shetrone et al.(2001,2003)and Geisler et al.(2005).Stellar abundances for 26stars in the Sgr dwarf galaxy remnant have also been3Where mixing with CNO-cycled gas typically results in ∆Mg ≤0.3dex (see discussion in §5.1)4Pritzl,Venn,&IrwinF IG .2.—Variations in [Fe/H]and [α/Fe]as a function of the Galactocentric rotational velocity (Θ)using the same symbols as in Fig.1.The field stars show a large range in the thick disk and halo components,which also significantly overlap one another.As in Fig.1,M54and Terzan 7are included in this plot with the velocity information for the Sagittarius dwarf galaxy remnant,and Ruprecht 106is included after assuming a range in proper motions (reflected by the error bar;see text).The globular clusters tend to have a more narrow range in [Fe/H]and [α/Fe](where [α/Fe]=[(Ca+Ti)/2Fe]),with only a few exceptions which are discussed in §3and §5.added from Bonifacio et al.(2000;2004)and Smecker-Hane &McWilliam (2005).3.GLOBULAR CLUSTER KINEMATIC ASSIGNMENTSWe have determined the Galactic stellar population com-ponent for 29GCs based on a calculation of their phase space.Phase space distribution functions have been deter-mined using the Galactocentric velocity vector components (V(Π,Θ,W )in km s −1)from Dinescu et al.(1999ab,2000,2001,2003,and private communications for updates)and the Galactocentric positional vector components (R(X,Y ,Z)in kpc;Harris 1996).Firstly,we computed the probability for a GC to be associated with the Galactic thin disk,thick disk,or halo from its velocity vector using a standard Bayesian classi-fication scheme and Galactic Gaussian velocity ellipsoid com-ponents from Dehnen &Binney (1998;thin disk),Soubiran,Bienaymé,&Siebert (2003;thick disk),and Chiba &Beers (2000;halo).This method is the same as was used for the Galactic field stars by Venn et al.(2004).Secondly,the prob-ability for a GCs to be associated with these Galactic compo-nents was determined from its positional vector.For this,a standard Galactic model (Robin,Reyleé,Derrière,&Picaud 2003)was chosen with a maximum halo extent of R =150kpc,a softening parameter ρ=1.0(which is used to stop the density of the halo from going to infinite at the Galactic Cen-ter),and adopting an asympotitic r −3halo profile.This was not necessary for the Galactic field stars studied by Venn et al.(2004)since it is a good assumption that those stars are in the solar neighbourhood quadrant.The kinematic and posi-tional probabilities were combined for a phase space deter-mination of the final probabilities for each GC to be associ-ated with each Galactic component.Finally,we allocated any GCs within R =2.7kpc of the Galactic Center to a bulge component unless the kinematics placed it in another compo-nent,and did not probe more deeply into variations between bulge GCs and/or those associated with a bar (e.g.,Dinescu et al.2003).Table 3lists the velocity and positional vector components for each GC,as well as which Galactic component they be-long to.We have also added kinematic information for M54and Ter 7which are embedded in the Sgr dwarf galaxy rem-nant;thus,on the assumption that these clusters are associ-ated with the Sgr remnant,then we have adopted the known kinematics for Sgr (Ibata et al.1997)as a reasonable approxi-mation to their Π,Θ,W velocities.This allows us to highlight these clusters in our abundance ratios and kinematic analyses.Rup 106is another cluster that does not have kinematic infor-mation,however it has a large galactocentric radial velocity (−232km s −1;Harris 1996).Adopting a plausible range of proper motions (0",±1"in RA and DEC),we investigate its potential space velocities (UVW and Π,Θ,W ).In all cases,the Galactocentric radial velocity,Π,is quite large (−200to −330km s −1;see Table 4)implying Rup 106is a member of the Galactic halo,possibly on a plunging orbit that would be consistent with a captured cluster.The final column in Table 3lists the GC classifications from (Mackey &Gilmore 2004)which are based on the physical properties of GCs.While overall there is good agreement between the two classifica-tions,there are some key differences especially for the clusters which have thick disk kinematics,while according to Mackey &Gilmore they have halo-like properties.A Toomre diagram for the GCs is shown in Figure 1,where the Galactocentric rotational velocity Θis plotted against T (T 2=Π2+W 2).To be consistent with the field stars exam-ined by Venn et al.(2004),we plot the GCs as colored points according to the assigned Galactic component (e.g.,cyan =halo,green =thick disk,red =thin disk).GCs assigned to the bulge are not shown in Fig.1.Only three clusters stand out in this diagram;Pal 12has thin disk kinematics however its positional vector places it in the halo (thus cyan colored GC amongst the thin disk field stars),M68which has an unusually high Galactocentric rotational velocity (Θ=+303km s −1),and M22is a thick disk cluster with an unusually high T compo-nent (+212km s −1).Figure 2shows the distribution in [Fe/H]and [α/Fe]vs.Θfor the GCs compared with the field stars in the solar neigh-borhood.Venn et al.(2004)commented on the large and over-lapping distribution in these abundances for the field stars in each of the Galactic components.For the [α/Fe]plot,we have averaged the mean abundances of Ca and Ti per GC (note that this differs slightly from the field star analysis by Venn et al.2004where [α/Fe]represented an average of Mg,Ca,and Ti).The most outstanding GCs are Pal 12and Rup 106,with very low [α/Fe]ratios.Of course,Pal 12is associatedElemental Abundance Comparisons5with the Sgr dwarf galaxy remnant and Rup106is thought to have been captured possibly from the Magellanic Clouds (Lin&Richer1992).For the thick disk clusters,it is inter-esting to see that they are clustered both toward lower[Fe/H] and higher[α/Fe].Although they are within the range of the thick diskfield stars,the thick disk GCs do not show as wide of a spread in metallicity.In any case,we conclude that the [α/Fe]ratios from the GCs in each kinematic component are in good to excellent agreement with those of thefield stars in the same Galactic component.4.ABUNDANCE RATIO CORRECTIONS FOR GLOBULARCLUSTERSMost of the data on GC stellar abundances comes from the Lick-Texas group.Therefore we have adopted the solar abun-dances they used(Grevesse&Sauval1998),along with their log g f values(see Table3of Fulbright2000for references), as thefiducial standards on which all abundances are adjusted. Differences in solar abundances and log g f are in the sense of the value from the reference paper minus our adopted values.A number of clusters were not corrected because either their solar abundances and log g f values matched the adopted ones (no adjustments were made for differences of less than about 0.04dex)or no values were given.These GCs were noted in Table1.In the following we note each cluster where adjust-ments were made to the abundance ratios.No adjustments for differences in hyperfine splitting corrections have been made because such abundance ratio adjustments are not as simple as those for solar abundances and log g f.NGC104(47Tucanae):Although the values from Grat-ton,Quarta,&Ortolani(1986)are not used in thefinal mean abundances,we adjust them to match our adopted log g f val-ues.There are no solar abundances given in their paper,so no adjustments were made.[Mg/Fe],[Si/Fe],[Ca/Fe],[TiI/Fe], and[Ba/Fe]are corrected by+0.22,+0.21,+0.20,+0.12,and −0.86,respectively,assuming the log g f values are the same as in Gratton(1987).The values from Brown&Wallerstein (1992)are not used in thefinal mean abundances,but we ad-justed them to match our adopted solar abundances and log g f values.Since the logǫvalues are given,the ratios are de-termined directly from those values using our adopted solar abundances.From the log g f values,[Mg/Fe],[Si/Fe],and [TiII/Fe]have been corrected by+0.09,+0.05,and+0.25,re-spectively.To avaoid confusion,in Table3we have combined the results from Gratton et al.(2001)and James et al.(2004a) since they are both part of a collaboration that studies the same stars,but different element ratios.The abundances from James et al.are weighted means of the turnoff and subgiant star ratios.NGC288,NGC362,NGC5897,NGC6352,and NGC6362:No solar abundance values were given in Gratton (1987),so the only adjustments that were made were due to the log g f values.[Mg/Fe],[Si/Fe],[Ca/Fe],[TiI/Fe],and [Ba/Fe]are corrected by+0.22,+0.21,+0.20,+0.12,and −0.86.For NGC288and NGC362,the results from Gratton (1987)are superceeded by those in Shetrone&Keane(2000). NGC2298:No changes are needed due to the solar abun-dance values in McWilliam,Geisler,&Rich(1992).Only [La/Fe]is adjusted by+0.09due to the log g f values.NGC3201:We do not use the Gratton&Ortolani(1989) ratios because two of the three stars are redone by Gonzalez& Wallerstein(1998).Examining the solar abundances,adjust-ments in[Mg/Fe],[TiI/Fe],and[Ba/Fe]needed to be made for the Gonzalez&Wallerstein abundance ratios.Further correc-tions need to be made due to differences in the log g f values for[Mg/Fe],[TiI/Fe],and[Eu/Fe].It happens that the adjust-ments for the differences in the solar abundances and log g f cancel each other out for[Mg/Fe]and[TiI/Fe]so that no ad-justments are necessary.The total changes for[Ba/Fe]and [Eu/Fe]are+0.23and+0.17,respectively.In determing the Gonzalez&Wallerstein ratios,we have chosen to use the high resolution abundances from1991and1994for those stars ob-served multiple times.NGC4590(M68):The results from Shetrone et al.(2003) and Lee,Carney,&Habgood(2004)superceed those from Gratton&Ortolani(1989).The abundance ratios derived from photometric values in Lee,Carney,&Habgood were used.NGC5273(M3):The results of Kraft et al.(1993,1995) were redone by Sneden et al.(2004).In addition,the three stars in Shetrone,Côté,&Sargent(2001)are also done in either Sneden et al.or Cohen&Melendez(2005a).Therefore, we did not use their abundance ratios in thefinal weighted-mean ratios.For the Cohen&Melendez study,the[Fe/H] values were adjusted by−0.07due to a difference in the solar abundance value.The abundance ratios[Mg/Fe],[Ca/Fe],and [Eu/Fe]were adjusted due to differences in the log g f values by−0.10,+0.16,and−0.08.Therefore thefinal abundance ratios for M3are a weighted mean of those from Sneden et al.(2004)and Cohen&Melendez(2005a).NGC5466:There are no changes to the NGC5466abun-dance ratios.We note that the only available chemical abun-dances come from the anomalous Cepheid in this cluster.This type of variable star can derive from either binary mass trans-fer or younger stars(Demarque&Hirshfeld1975;Norris& Zinn1975;Renzini,Mengel,&Sweigart1977).Because of the star’s variability,we caution about the reliability of the abundance ratios from this single star even though they are consistent with other stars and clusters of similar metallicity. NGC5904(M5):Although the values from Gratton, Quarta,&Ortolani(1986)are not used in thefinal mean abun-dances,we adjust them to match our adopted log g f values. There are no solar abundances given in the paper,so no ad-justments can be made.[Mg/Fe],[Si/Fe],[Ca/Fe],[TiI/Fe], and[Ba/Fe]are corrected by+0.22,+0.21,+0.20,+0.12,and −0.86,respectively,assuming the log g f values are the same as in Gratton(1987).The ratios from Sneden et al.(1992) are not used because the stars were reanalyzed by Ivans et al.(2001).The asymptotic giant branch stars in the Ivans et al.study were not included in the mean abundance ratios.For the Ramírez&Cohen(2003)abundance ratios,adjustments are necessary for both the solar abundances and the log g f values.For the solar abundances,[Mg/Fe],[Ca/Fe],[TiI/Fe], [FeI/H],[FeII/H],and[La/Fe]need to be adjusted by−0.12,−0.22,−0.07,−0.08,−0.05,and−0.08,respectively.For the log g f values,[Mg/Fe],[Ca/Fe],and[Eu/Fe]need corrections of−0.08,+0.16,and−0.08,respectively.This leads to a to-tal adjustments of−0.20,−0.06,−0.07,−0.08,−0.05,−0.08, and−0.08for[Mg/Fe],[Ca/Fe],[TiI/Fe],[FeI/H],[FeII/H], [La/Fe],and[Eu/Fe].After all of the correction were made, the Ivans et al.and Ramírez&Cohen ratios were averaged together by a weighted mean.NGC6093(M80):The solar abundances in Cavallo, Suntzeff,&Pilachowski(2004)matched our adopted val-ues.For the log g f values,correction were made to[Ca/Fe], [TiII/Fe],and[Eu/Fe]by+0.13,−0.06,and+0.22,respec-tively.。

剑桥商务英语听说星系The Milky Way GalaxyThe Milky Way is the galaxy that contains our Solar System, with the Earth and Sun. This galaxy is a vast, spinning collection of stars, planets, dust and gas, held together by gravity. It is just one of hundreds of billions of galaxies in the observable universe.The Milky Way galaxy is estimated to contain 100-400 billion stars and have a diameter between 100,000 and 180,000 light-years. It is the second-largest galaxy in the Local Group, with the Andromeda Galaxy being larger. As with other spiral galaxies, the Milky Way has a central bulge surrounded by a rotating disk of gas, dust and stars. This disk is approximately 13 billion years old and contains population I and population II stars.The solar system is located about 25,000 to 28,000 light-years from the galactic center, on the inner edge of one of the spiral-shaped concentrations of gas and dust called the Orion Arm. The stars in the Milky Way appear to form several distinct components including the bulge, the disk, and the halo. These components are made of different types of stars, and differ in their ages and their chemicalabundances.The Milky Way galaxy is part of the Local Group, a group of more than 50 galaxies, including the Andromeda Galaxy and several dwarf galaxies. The Local Group in turn is part of the Virgo Supercluster, a giant structure of thousands of galaxies. The Milky Way and Andromeda Galaxy are moving towards each other and are expected to collide in about 4.5 billion years, although the likelihood of any actual collisions between the stars themselves is negligible.The Milky Way has several major arms that spiral from the galactic bulge, as well as minor spurs. The best known are the Perseus Arm and the Sagittarius Arm. The Sun and its solar system are located between two of these spiral arms, known as the Local Bubble. There are believed to be four major spiral arms, as well as several smaller segments of spiral arms.The nature of the Milky Way's bar and spiral structure is still a matter of active research, with the latest research contradicting the previous theories. The Milky Way may have a prominent central bar structure, and its shape may be best described as a barred spiral galaxy. The disk of the Milky Way has a diameter of about 100,000 light-years. The galactic halo is a spherical component of the galaxy that extends outward from the galactic disk, as far as 200,000 light-years from the galactic center.The disk of the Milky Way Galaxy is marked by the presence of a supermassive black hole known as Sagittarius A*, which is located at the very center of the Galaxy. This black hole has a mass four million times greater than the mass of the Sun. The Milky Way's bar is thought to be about 27,000 light-years long and may be made up of older red stars.The Milky Way is moving with respect to the cosmic microwave background radiation in the direction of the constellation Hydra with a speed of 552 ± 6 km/s. The Milky Way is a spiral galaxy that has undergone major mergers with several smaller galaxies in its distant past. This is evidenced by studies of the stellar halo, which contains globular clusters and streams of stars that were torn from those smaller galaxies.The Milky Way is estimated to contain 100–400 billion stars. Most stars are within the disk and bulge, while the galactic halo is sparsely populated with stars and globular clusters. A 2016 study by the Sloan Digital Sky Survey suggested that the number is likely to be close to the lower end of that estimate, at 100–140 billion stars.The Milky Way has several components: a disk, in which the Sun and its planetary system are located; a central bulge; and a halo of stars, globular clusters, and diffuse gas. The disk is the brightest part of theMilky Way, as seen from Earth. It has a spiral structure with dusty arms. The disk is about 100,000 light-years in diameter and about 13 billion years old. It contains the young and relatively bright population I stars, as well as intermediate-age and old stars of population II.The galactic bulge is a tightly packed group of mostly old stars in the center of the Milky Way. It is estimated to contain tens of billions of stars and has a diameter of about 10,000 light-years. The Milky Way's central bulge is shaped like a box or peanut. The galactic center, which lies within this bulge, is an extremely active region, with intense radio source known as Sagittarius A*, which is likely to be a supermassive black hole.The Milky Way's halo is a spherical component of the galaxy that extends outward from the galactic disk, as far as 200,000 light-years from the galactic center. It is relatively sparse, with only about one star per cubic parsec on average. The halo contains old population II stars, as well as extremely old globular clusters.The Milky Way's spiral structure is uncertain, and there is currently no consensus on the nature of the Milky Way's spiral arms. Different studies have led to different results, and it is unclear whether the Milky Way has two, four, or more spiral arms. The Milky Way's spiral structure is thought to be a major feature of its disk, and it may berelated to the generation of interstellar matter and star formation.The Milky Way's spiral arms are regions of the disk in which the density of stars, interstellar gas, and dust is slightly higher than average. The arms are thought to be density waves that spiral around the galactic center. As material enters an arm, the increased density causes the material to accumulate, thus causing star formation. As the material leaves the arm, star formation decreases.The Milky Way's spiral arms were first identified in the 1950s, when radio astronomers mapped the distribution of gas in the Milky Way and found that it was concentrated in spiral patterns. Since then, astronomers have used a variety of techniques to study the Milky Way's spiral structure, including observations of the distribution of young stars, star-forming regions, and interstellar gas and dust.One of the key challenges in studying the Milky Way's spiral structure is that we are located within the disk of the galaxy, which makes it difficult to get a clear view of the overall structure. Astronomers have had to rely on indirect methods, such as measuring the distances and motions of stars and gas clouds, to infer the shape and structure of the galaxy.Despite these challenges, our understanding of the Milky Way's spiral structure has advanced significantly in recent years, thanks tonew observations and more sophisticated modeling techniques. Ongoing research is continuing to shed light on the nature and evolution of the Milky Way's spiral arms, and the role they play in the overall structure and dynamics of the galaxy.。
a r X i v :a s t r o -p h /9707060v 1 4 J u l 1997METAL ABUNDANCES OF ONE HUNDRED HIPPARCOS DW ARFSR.G.Gratton 1,E.Carretta 2,G.Clementini 2,C.Sneden 31Osservatorio Astronomico di Padova,Vicolo dell’Osservatorio 5,35122Padova,ITALY2Osservatorio Astronomico di Bologna,ITALY3Department of Astronomy,The University of Texas at AustinABSTRACTAbundances for Fe,O,and the α−elements (Mg,Si,Ca,and Ti)have been derived from high resolution spectra of a sample of about one hundred dwarfs with high precision parallaxes measured by HIPPAR-COS.The stars have metal abundances in the range −2.5<[Fe/H]<0.2.The observational data set con-sists of high dispersion (20,000<R <70,000),high S/N (>200)spectra collected at the Asiago and McDonald Observatories.The abundance analysis followed the same precepts used by Gratton et al.(1997a)for ∼300field stars and for giants in 24glob-ular clusters (Carretta &Gratton 1997),and includes corrections for departures from LTE in the formation of O lines.Our main results are:1.the equilibrium of ionization of Fe is well satisfied in late F –early K dwarfs2.O and α−elements are overabundant by ∼0.3dex This large homogeneous data set was used in the derivation of accurate ages for globular clusters (See paper by Gratton et al.at this same Meeting).Key words:Stars:chemical abundances -Stars:ba-sic parameters1.INTRODUCTIONHIPPARCOS has provided parallaxes with accura-cies of ∼1mas for several hundreds dwarfs.We had access to data for about 100dwarfs with metal abun-dances in the range −2.5<[Fe/H]<0.2and have used them in a thorough revision of the ages of the old-est globular clusters derived by Main Sequence (MS)fitting technique.A crucial step in the derivation of ages via this method is the assumption that the nearby subdwarfs have the same chemical composi-tion of the globular cluster main sequence stars.This assumption was verified through a careful abundance analysis of the vast majority of nearby dwarfs with HIPPARCOS parallaxes available to us.Our data set and the HIPPARCOS parallaxes were also used to test whether an appreciable Fe overion-ization occurred in the atmosphere of late F –early K dwarfs (Bikmaev et al.1990;Magain &Zhao 1996).This was done by comparing abundances provided by neutral and singly ionized lines,once the surface gravity of each program star had be derived from its mass,temperature and luminosity rather then from the equilibrium of ionization of Fe.Finally,our abundances are fully consistent with those presented by Gratton et al.(1997a)for about 300field dwarfs.A large,homogenous data base of high accuracy (errors ∼0.07dex)abundances com-puted with the Kurucz (1993)model atmospheres is now available and can be used to recalibrate photo-metric and low S/N spectroscopic abundances.2.BASIC DATA FOR SUBDWARFS Average V magnitudes and colors (Johnson B −V and V −K ,and Str¨o mgren b −y ,m 1and c 1)for the programme stars were obtained from a careful discussion of the literature data.We used also the Tycho V magnitudes and B −V colors,after cor-recting them for the very small systematic difference with ground-based data.Absolute magnitudes M V were derived combining ap-parent V magnitudes and Hipparcos parallaxes.No Lutz-Kelker corrections were applied.Lutz-Kelker corrections (Lutz &Kelker 1973)take into account that stars with parallaxes measured too high are more likely to be included in a sample if the sample selection criteria are based on the parallaxes them-selves.Since our sample was selected before the HIP-PARCOS parallaxes were known;Lutz-Kelker correc-tions should not be applied when the whole sample is considered,as we do when comparing the abundances obtained from Fe I and Fe II lines.Multiple high precision radial velocity observations exist for a large fraction of our objects (80out of 99).Twenty stars in the sample are known and four are suspected spectroscopic binaries.Two further stars display very broad lines in our spectra,possibly due to fast rotation.They were discarded.A few other stars display some IR excess,which also may be a signature of binarity.No evidence for binarity dis-turbing the present analysis exists for the remaining stars.Sixty-eight out of the99stars of our sample are in-cluded in Carney et al.(1994)catalogue.Reddening estimates are given for58of them.All but two have zero values.We have thus assumed a zero reddening for all the programme stars.3.OBSERVATIONS AND REDUCTIONSHigh dispersion spectra for about two thirds of the programme stars were acquired using the2D-coud`e spectrograph of the2.7m telescope at McDonald Ob-servatory and the REOSC echelle spectrograph at the 1.8m telescope at Cima Ekar(Asiago).McDonald spectra have a resolution R=70,000,S/N∼200, and spectral coverage from about4,000to9,000˚A; they are available for21stars(most with[Fe/H]<−0.8).Cima Ekar telescope provided spectra with resolution R=15,000,S/N∼200,and two spectral ranges(4,500<λ<7,000and5,500<λ<8,000˚A) for65stars.Equivalent widths EW s of the lines were measured by means of a gaussianfitting routine applied to the core of the lines;appropriate average corrections were included to take into account the contribution of the damping wings.Only lines with log EW/λ<−4.7 were used in thefinal analysis(corrections to the EW s for these lines are≤7m˚A,that is well be-low10per cent).The large overlap between the two samples(14stars)allowed us to tie the Asiago EW s to the McDonald ones.External checks on our EW s are possible with Ed-vardsson et al(1993:hereinafter E93)and Tomkin et al.(1992:hereinafter TLLS).Comparisons per-formed using McDonald EW s alone show that they have errors of±4m˚A.From the r.m.s.scatter,σ, between Asiago and McDonald EW s,we estimate that the former have errors of±6.7m˚A.When Asi-ago and McDonald EW s are considered together,we find average residuals(us-others)of−0.2±1.0m˚A (39lines,σ=6.1m˚A)and+0.8±1.0m˚A(36lines,σ=5.9m˚A)with E93and TLLS,respectively.4.ANALYSIS4.1.Atmospheric ParametersThe abundance derivation followed precepts very similar to the reanalysis of∼300field and∼150 globular cluster stars described in Gratton et al. (1997a)and Carretta&Gratton(1997).The same line parameters were adopted.The effective tem-peratures were derived from B−V,b−y,and V−K colours using the iterative procedure outlined in Gratton et al.(1997a).Atmospheric parameters are derived as follows:1.we assume as input values log g=4.5and themetal abundance derived from the uvby photom-etry using the calibration of Schuster&Nissen (1989)2.T effis then derived from the colours,using theempirical calibration of Gratton et al.(1997a) for population I stars(assumed to be valid for [Fe/H]=0),and the abundance dependence given by Kurucz(1993)models3.afirst iteration value of log g is then derived fromthe absolute bolometric magnitude(derived from the apparent V magnitude,parallaxes from Hip-parcos,and bolometric corrections BC from Ku-rucz1993),and masses obtained by interpolation in T effand[A/H]within the Bertelli et al.(1997) isochrones4.steps2and3are iterated until a consistent setof values is obtained for T eff,log g,and[A/H] 5.the EW s are then analyzed,providing new val-ues for v t and[A/H](assumed to be equal to [Fe/H]obtained from neutral lines)6.the procedure is iterated until a new consistentset of parameters is obtained4.2.Error analysisRandom errors in T eff(±45K)were obtained by com-paring temperatures derived from different colours. Systematic errors may be larger;the T eff-scale used in this paper is discussed in detail in Gratton et al. (1997a).We assume that systematic errors in the adopted T eff’s are≤100K.Random errors in the gravities(±0.09dex)are esti-mated from the errors in the masses(1.2per cent), M V’s(0.18mag),and in the T eff’s(0.8per cent), neglecting the small contribution due to BC’s.Sys-tematic errors(±0.04dex)are mainly due to errors in the T effscale and in the solar M V value.Random errors in the microturbulent velocities can be estimated from the residuals around thefitting re-lation in T effand log g.We obtain values of0.47and 0.17km s−1for the Asiago and McDonald spectra, respectively.Random errors in the EW s and the line parameters significantly affect the abundances when few lines are measured for a given specie.Errors should scale as σ/√Figure1.Run of the difference between the abundances derived from neutral and singly ionized Fe lines as a func-tion of temperature(panel a)and overall metal abundance (panel b).Open squares are abundances obtained from the Asiago spectra;filled squares are abundances obtained from the McDonald spectraMcDonald spectra,respectively.Systematic errors (∼0.08dex)are mainly due to the T effscale.parison with other abundancesOn average,differences(Asiago−McDonald)in the Fe abundances are−0.01±0.02dex(12stars,σ= 0.07dex).Analogous differences for the[O/Fe] and[α/Fe]ratios are+0.02±0.08dex(5stars,σ=0.17dex),and+0.01±0.03dex(12stars,σ=0.10dex).E93measured abundances for∼200dwarfs;six stars are in common with our sample.Abundance residu-als(our analysis−E93)are+0.08±0.03,−0.02±0.03, and+0.02±0.02dex for[Fe/H],[O/Fe],and[α/Fe], respectively.Residual differences are mainly due to our use of a higher temperature scale(our T eff’s are larger by63±12K).We have six stars in common with TLLS,which used a restricted wave-length range.Average differences(ours−TLLS)are: +0.34±0.04and−0.31±0.07dex for[Fe/H]and [O/Fe],respectively.They are due to different as-sumption in the analysis:(i)our temperature scale is higher;(ii)TLLS used a different solar model; (iii)our non-LTE corrections to the O abundances are slightly larger.Finally,Gratton et al.(1997a) made a homogenous reanalysis of the original EW s for∼300metal-poorfield stars.On average,the present Fe abundances are larger by0.02±0.02dex (11stars,σ=0.06dex).Since the same analysis procedure is adopted,these differences are entirely due to random errors in the EW s and in the adopted colours.In the following,we assume that Gratton et al.abundances are on the same scale of the present analysis.4.4.Fe abundancesSince gravities are derived from masses and luminosi-ties rather than from the equilibrium of ionization for Fe,we may test if predictions based on LTE are sat-isfied for the program stars.In Figure1we plot the difference between abun-dances of Fe obtained from neutral and singly ion-ized lines against effective temperature and metal abundance.Different symbols refer to results ob-tained from McDonald and Asiago spectra,respec-tively.McDonald spectra have a higher weight be-cause the higher resolution allowed us to measure a larger number of Fe II lines(10∼20),and errors in the EW s are smaller;very few Fe II lines could be measured in the crowded spectra of cool and/or metal-rich stars observed from Asiago.Average dif-ferences between abundances given by Fe I and II lines are0.025±0.020(21stars,σ=0.093dex)for the Mc Donald spectra,and−0.063±0.019(52stars,σ=0.140dex)for the Asiago spectra.The scatter obtained for McDonald spectra agrees quite well with the expected random error of0.085dex.The average value is consistent with LTE if the adopted T effscale is too high by∼20K,well within the quoted error bar of±100K.The lower mean difference obtained for the Asiago spectra is due to a few cool metal-rich stars which have very crowded spectra.Very few Fe II lines could be measured in these spectra and the line-to-line comparison with the superior McDonald data suggests that even these lines may be affected by blends.We conclude that the equilibrium of ionization for Fe is well satisfied in the late F–K dwarfs of any metallicity in our sample.This result depends on the adopted temperature scale.Our empirical result agrees very well with the ex-tensive statistical equilibrium calculations for Fe by Gratton et al.(1997b).In that paper,the uncertain collisional cross sections were normalized in order to reproduce the observations of the RR Lyraes,where overionization is expected to be much larger than in late F–K dwarfs.The lower limit to collisional cross sections given by the absence of detectable overion-ization in RR Lyrae spectra(Clementini et al.1995) implies that LTE is a very good approximation for the formation of Fe lines in dwarfs.4.5.O andα−element abundancesO abundances were derived from the permitted IR triplet,and include non-LTE corrections computed for each line in each star following the precepts of Gratton et al.(1997b).Wefind that O and the other α−elements are overabundant in stars with[Fe/H]<−0.5(see Figure2):[O/Fe]=0.38±0.13[α/Fe]=0.26±0.08,(error bars are the r.m.s.scatter of individual val-ues around the mean).The moderate O excess de-rived from the IR permitted lines is a consequence of the rather high temperature scale adopted.When this adoption is made,abundances from permitted OI lines agree with those determined from the forbidden [OI]and the OH lines.The present abundances agree very well with those derived in Gratton et al.(1997c).Note also that the overabundance of O andα−elements found for thefield subdwarfs is similar to the excesses foundFigure2.Runs of the overabundances of O(panel a)and α−elements(panel b)as a function of[Fe/H]for the pro-gramme subdwarfs.Filled squares are abundances from McDonald spectra;open squares are abundances from Asi-ago spectrafor globular cluster giants(apart from those stars af-fected by the O-Na anticorrelation,see Kraft1994).5.CALIBRATION OF PHOTOMETRICABUNDANCESOnce combined with the abundances obtained by Gratton et al.(1997a),the sample of late F to early K-typefield stars with homogenous and accu-rate high dispersion abundances adds up to nearly 400stars.Schuster&Nissen(1989)have shown that rather accurate metal abundances for late F to early K-type can be obtained using Str¨o mgren uvby pho-tometry(available for a considerable fraction of the HIPPARCOS stars).Furthermore,the extensive bi-nary search by Carney et al.(1994)has provided a large number of metal abundances derived from an empirical calibration of the cross correlation dips for metal-poor dwarfs.We have recalibrated these abundance scales.Schus-ter&Nissen(1989)abundances onlydiffers for a zero-point offset(see panel a of Figure3);the mean difference is:[Fe/H]us =[Fe/H]SN+(0.102±0.012),(1)based on152stars(the r.m.s.scatter for a single star is0.151dex).In the case of Carney et al.(1994,panel b of Fig-ure3),a small linear term is also required.The best parison between the abundances obtained from high dispersion spectra(present analysis or Gratton et al.1997),and those provided by the original calibration of Schuster&Nissen(1989,panel a)and Carney et al. (1994,panel b)fit line(66stars)is:[Fe/H]us=(0.94±0.03)[Fe/H]C94+(0.18±0.17),(2) The offsets between the high dispersion abundances and those provided by Schuster&Nissen(1989)and Carney et al.(1994)are mainly due to different as-sumptions about the solar abundances in the high dispersion analyses originally used in the calibrations of Schuster&Nissen(1989)and Carney et al.(1994).REFERENCESBertelli,P.,Girardi,L.,Bressan,A.,Chiosi,C.,&Nasi,E.1997,in preparationBikmaev,I.F.,Bobritskij,S.S.,El’kin,V.G.,Lyashko,D.A.,Mashonkina,L.I.,&Sakhibullin,N.A.1990,inIAU Symp.145,Evolution of Stars:the Photospheric Abundance Connection,G.Michaud ed.Carney,B.W.,Latham,D.W.,Laird,J.B.,&Aguilar, L.A.1994,AJ,107,2240Carretta,E.,&Gratton,R.G.1997,A&AS,121,95 Clementini,G.,Carretta,E.,Gratton,R.G.,Merighi, R.,Mould,J.R.,&McCarthy,J.K.1995,AJ,110, 2319Edvardsson,B.,Andersen,J.,Gustafsson,B.,Lambert,D.L.,Nissen,P.E.,&Tomkin,J.1993,A&A,275,101Gratton,R.G.,Carretta,E.,&Castelli,F.1997a,A&A, in pressGratton,R.G.,Carretta,E.,Gustafsson,B.,&Eriksson, K.1997b,submitted to A&AGratton,R.G.,Carretta,E.,Matteucci,F.,&Sneden,C.1997d in preparationKing,J.R.1993,AJ,106,1206Kraft,R.P.1994,PASP,106,553Kurucz,R.L.1993,CD-ROM13and CD-ROM18 Lutz,T.E.,Kelker,D.H.1973,PASP,85,573 Magain,P.,Zhao,G.1996,A&A,305,245Schuster,W.J.,&Nissen,P.E.1989,A&A,221,65 Tomkin,J.,Lemke,M.,Lambert,D.L.,&Sneden,C.1992,AJ,104,1568。

Q1正确答案:C解析:momentous“重要的,重大的”,所以very important正确。
从单词本身看,意思上应该跟moment相关,“时刻的”,A和D明显不合文意。
原句提到这些变化对于本地稀疏的人口有什么影响,“常规的”影响明显不正确,答案是C。
Q2正确答案:B解析:EXCEPT题,排除法。
A/C/D都在第一段第一句中提到了,只有B没有提到,所以答案是B。
Q3正确答案:D解析:指代题,需要沿着提到的内容往前看,前一句提到由于农业和城镇的发展,人口成千上万,紧接着提到this change,说这个变化指的就是人口的增长,所以答案是D。
Q4正确答案:B解析:exploit“开采,开发,利用”,所以B的utilize正确。
原句提到当地人怎么样自然景观,之后举了很多例子,有放牧有打猎等等,都是在利用自然环境,所以是“利用”。
C“定居”和D“改善”都不正确;A选项不选,后面的例子说明不只是探索,所以答案是B。
Q5正确答案:A解析:根据这些例子找定位,提到定居点里包含很多通过贸易获得的外来物品,诸如……,所以列举的这些东西都是外来品,A是正确答案。
BCD都未提及。
Q6正确答案:D解析:cramped“局促的,狭窄的,难懂的”,所以confined正确。
原句提到在公元前9500年,一个村子的人都在一个什么样的住处里,根据句义,这里强调的是比较小,所以其他的都不合文意。
而且extend刚好和confine是相反的意思,所以D是答案。
Q7正确答案:D解析:Abu Hureyra做关键词定位至第一句的后半句和第二句的前半句,一直在说AH,接着往下看,提到接下来的1500年里,他们所在的地方气候温暖,种子丰富,所以答案是D,C与原文相反;A和B选项的内容在此并未提及。
Q8正确答案:C解析:shift“转变,转换,倒班”,所以最接近的答案是change。
原句提到漂浮的样品使得植物学家研究植物集群习惯的什么就好像在显微镜下看风景一样,风景是会变的,所以答案是change。
小学上册英语第二单元测验卷(有答案)英语试题一、综合题(本题有100小题,每小题1分,共100分.每小题不选、错误,均不给分)1.What is the name of the famous singer known as the "King of Pop"?A. Elvis PresleyB. Michael JacksonC. PrinceD. Freddie Mercury答案:B2.Did you see that _____ (小狗) digging in the dirt?3.The capital of Senegal is __________.4.What do we call the process of a plant making its own food using sunlight?A. PhotosynthesisB. RespirationC. DigestionD. Fermentation答案: A5.I like to celebrate my birthday with ________.6.I planted some ______ (种子) in my garden. I hope they grow into beautiful ______ (花).7.What do we call the area of land that is known for its unique climate and vegetation?A. BiomeB. EcosystemC. HabitatD. Region答案: A. Biome8.The chemical formula for sodium bromide is ______.9.Mount Everest is located in the __________ mountains.10.The element with the symbol O is __________.11. A mixture can be separated by __________ methods.12.The ______ (植物学家) studies plants.13.What do we call the young of a cow?A. CalfB. KidC. LambD. Foal答案: A14.Which bird is known for its colorful plumage?A. PigeonB. PeacockC. SparrowD. Crow答案: B15.The main component of proteins is ______.16. A _______ (小猩猩) is known for its intelligence and strength.17.On rainy days, I love to watch movies and drink __________. (热巧克力)18. A ______ is a representation of a chemical process.19.Some _______ are great for attracting hummingbirds.20.I want to _______ a big cake for my birthday.21.My friend is very __________ (包容的) towards others.22.What is the term for a young eagle?A. ChickB. EagletC. HatchlingD. Fledgling答案: B23.My friend is a ______. He loves to play video games.24.He is a researcher, ______ (他是一名研究员), studying animals.25.My friend loves to write __________ (诗歌).26. A bear can stand on its ______ (后腿).27.I enjoy ______ (参加) sports tournaments.28. A ______ is a region of flat land with higher elevation.29.I have a green ___. (ball)30.The first successful test of an atomic bomb was in _______.31.Which season comes after winter?A. FallB. SpringC. SummerD. Autumn答案: B32.How many colors are in a standard rainbow?A. 5B. 6C. 7D. 8答案:C33.What do we call the process of changing from a solid to a liquid?A. MeltingB. FreezingC. EvaporatingD. Boiling答案:A34.She is a _____ (记者) reporting on global issues.35.The elephant has a long ________________ (鼻子).36.My brother has a pet ______ (兔子) that is very cute.37.What do we call the largest type of shark?A. HammerheadB. Great whiteC. Whale sharkD. Tiger shark答案: C. Whale shark38.I can ______ (swim) really well.39.The process of combining elements to form compounds is called ______.40.Many plants can be grown in ______ (盆栽).41.My _____ (妈妈) loves to bake cookies for my friends. 我妈妈喜欢给我的朋友们烤饼干。
不同星族恒星的Sc和Mn元素丰度分析摘要恒星元素丰度是从观测上追踪银河系结构和化学演化的很好探针。
随着天文观测技术和仪器的改进和提高,近年来人们积累了大量的恒星光谱数据,分析得到了恒星中许多元素的丰度,为我们研究不同类型恒星的化学演化提供了支持。
本文我们以F和G 型矮星作为研究对象,分析这些恒星中Sc和Mn这两种元素的丰度趋势。
为了得到更具普遍性的观测结果,我们采用大样本恒星的统计分析,所选择的样本有2个来源:第一个来源是选择了从2000年以来一直到2011年的11个大样本恒星的观测结果,第二个来源是使用中国科学院国家天文台兴隆观测站的2.16米望远镜,观测得到的15颗F和G型矮星的元素丰度。
总共获得了798颗恒星的元素丰度,包括367颗薄盘星,303颗厚盘星和128颗晕星。
论文首先介绍了银河系的旋臂结构、成分结构,综述了对恒星Sc和Mn元素丰度的观测研究和分析结果;第二部分是星族的分类,用纯运动学来划分薄盘星、厚盘星和晕星;第三部分是我们的光谱观测和丰度分析结果,观测并分析了15颗贫金属矮星的元素丰度;第四部分多样本统计分析,包括样本的选取和完备性分析;最后一部分详细讨论了不同星族恒星的Sc和Mn元素的丰度演化趋势。
通过大样本恒星的统计分析,得到了以下重要结果:(1)Sc元素丰度的演化趋势:贫金属星中[Sc/Fe] 总体上是相对超丰,而且随[Fe/H]的增加呈下降趋势,但在整个金属丰度范围内[Sc/Fe]并不是单一斜率下降,[Sc/Fe]随金属丰度[Fe/H]的演化趋势在薄盘星、厚盘星和晕星中是不完全相同的。
在薄盘恒星([Fe/H] > -0.8)中[Sc/Fe] 随[Fe/H]的增加呈线性下降趋势,这一特性和α元素很相似,因此Sc有时被称为“类α元素”;在厚盘恒星中当[Fe/H]<-0.5 时[Sc/Fe]随[Fe/H]的增加是线性上升的,但当[Fe/H]达到-0.5后继续增加[Sc/Fe]转而变为线性下降的趋势;在晕族恒星中,[Sc/Fe]的弥散变得较大,且[Sc/Fe] 几乎与[Fe/H]的变化无关。
a r X i v :a s t r o -p h /9710339v 1 29 O c t 1997ARE ELLIPTICAL GALAXIES REALLY METAL-RICH?And,If Not,Then What?M.LOEWENSTEIN AND R.F.MUSHOTZKYNASA/GSFC Code 662,Greenbelt,MD 20771,USA 1.Introduction In elliptical galaxies,where most of the stars –and therefore most of the heavy elements –were formed at an early epoch,the total mass,spatial distribution,and relative abundances of metals are intimately connected to the galaxy formation process.Metallicities of the stars in elliptical galaxies can be estimated from optical broad-band photometry and spectroscopic measurement of selected absorption line indices.However,the transformation from these indirect abundance indicators to true stellar metallicites is highly non-trivial,de-pending on a priori assumptions about stellar physics details and star for-mation history.Since the hot interstellar medium primarily originates from stellar mass loss,X-ray observations provide independent and complemen-tary abundance information.Moreover,there are distinct advantages to using strong X-ray emission features over weak optical absorption features:the former are related to actual abundances in a much more direct,model-independent,manner;and,one can determine abundances much further out in radius.30-40early-type galaxies have been observed with ASCA ,representing the first large sample of high quality,broad-band X-ray spec-tra of elliptical galaxies.Most of these have been analyzed in detail by K.Matsushita,and we draw upon the results presented in her thesis,as well as our own analysis,in this review.2.Abundances in Gas-Rich EllipticalsASCA spectra can generally be decomposed into soft and hard components (Matsumoto et al.1997).The soft component originates in the hot (0.3-1keV)ISM,and shows a wide range of X-ray-to-optical flux ratios and X-ray extents for any given optical luminosity.The hard component generally2M.LOEWENSTEIN AND R.F.MUSHOTZKYscales linearly with optical luminosity,with a relative normalization and spectrum consistent with measurements of the integrated emission from low mass X-ray binaries in spiral galaxy bulges.Figure1(from Matsumoto et al.1997)compares ASCA Solid State Imaging Spectrometer(SIS)spectra of the elliptical galaxies NGC4365and NGC4636.Note that these galaxies have similar optical luminosities and hard components;however,the soft component in NGC4636is nearly two orders of magnitude more luminous than that in NGC4365.Since abundance uncertainties become large as the hard component begins to dominate and the equivalent widths of emission lines are diluted(e.g.,for NGC4365),this review focuses on observations of eighteen gas-rich ellipticals(e.g.,NGC4636)in the ASCA archive–galaxies with high X-ray-to-opticalfluxes based on ROSAT PSPC observations and low hard component fractions based on ASCA spectral decomposition.The X-ray emission extends well beyond the optical isophotes for some of these systems,but is more compact in others.Figure1.Co-added ASCA SIS spectra of NGC4636(filled circles)and NGC4365(open circles).Figure2shows a plot of abundance versus temperature derived from ASCA spectra extracted from the innerfive optical half-light radii.The soft component is modeled using the Raymond-Smith thermal plasma emissionELLIPTICAL GALAXY ABUNDANCES3 code with abundancesfixed at their solar photospheric ratios.The abun-dances–essentially the Fe abundance,since X-ray spectra at these temper-atures are dominated by Fe L emission lines–range from about one-tenth to two-thirds solar.Since it has generally been assumed that abundances of the mass-losing stars that are the origin of the hot gas are supersolar,and that Type Ia SN should further enrich the hot gas by at least an additional two times solar,X-ray abundances of elliptical galaxies are3-30times lower than what might naively be expected.Figure2.Hot gas metal abundance versus temperature.3.Reconciling Optical and X-ray AbundancesClearly,either the SNIa rate is much lower than estimated,and/or SNIa ejecta is not efficiently mixed into the hot ISM.Can optical and X-ray abundances be reconciled,even if SNIa enrichment is neglected?It must be the case that either(1)stellar abundances are not actually supersolar,(2) hot gas abundances are not actually subsolar,or(3)X-ray and optical ob-servations are not commensurate.We consider these possibilities in reverse order.4M.LOEWENSTEIN AND R.F.MUSHOTZKY(3)We now know that the X-ray emission from some elliptical galaxies is much more extended than the optical light and,accounting for the mea-sured abundance distributions,that the radius containing half of the hot gas metals is3-10times larger than the corresponding radius for the stars in such systems.The hot gas metallicity profile generally has a negative gradient(Matsushita1997).These facts indicate that accretion of primor-dial or intergalactic material may be diluting the abundances of the hot gas relative to the stars(Brighenti&Mathews1997).However,if this were a dominant effect one would expect lower average metallicities in more gas-rich galaxies–if anything,the opposite is observed.Although gasflows have undoubtedly rearranged and in some cases diluted the gas,it is probably meaningful to compare optical and X-ray metallicities within the optical radius.(2)The validity of the abundances obtained from single-phase hot gas plus X-ray binariesfits to ASCA data have been questioned on a number of fronts.Inadequacies in the treatment of Fe L transitions in plasma codes used for spectralfitting are an extra source of uncertainty(Arimoto et al.1997);however,excluding the energy region in question in spectralfits does not systematically raise the metallicity(Buote&Fabian1997).Higher abundances can also be accommodated in more complex spectral models. In particular,Buote and Fabian have recently found that the bestfit to ASCA data often consists of a two-temperature plasma,with the secondary component having a temperature of∼1.5keV,and that the abundances in suchfits are systematically higher by about a factor of two compared to models with a single gas phase plus X-ray binaries.However,there is more information in ASCA spectra than what can be obtained from global spectralfits alone.We have found that the temperature obtained from the He-like to H-like Si line ratios is in excellent agreement with the single-phase model(see Figure3for an example with a typical level of agreement),and is not consistent with the presence of hotter gas in the amounts suggested by Buote and Fabian.(1)So,it seems reasonable to adopt the metallicities in the single-phase hot gas plus X-ray binariesfits to ASCA spectra as measures of global inter-stellar Fe abundances,and sensible to compare these with global Fe abun-dances of the stars.What are the best current estimates of the latter?The conventional wisdom that elliptical galaxies have supersolar abundances is based on measurements of the nuclear Mg2index.However,when one ac-counts for the factor of2-3overabundance of Mg with respect to Fe in the stars(Worthey et al.1992),and the factor of two aperture correction(Ari-moto et al.1997)it becomes clear that the global Fe abundances of the stars and hot gas are not grossly discordant.We have compared recent estimates of the global Fe abundance using optical data kindly provided by S.TragerELLIPTICAL GALAXY ABUNDANCES5Figure3.68,90,and99%confidence contours for H-and He-like Si line strengths(in photons cm−2s−1)in the elliptical galaxy NGC1399.The solid lines show the ratios expected in three single-temperature thermal plasma models.The best-fit temperature to the spectrum derived from global Raymond-Smith plasma modelfits is1.05±0.04 keV(90%confidence uncertainties).(Trager1997)with the X-ray measurements.The comparison for the eight galaxies present in both samples is shown in Figure4.The discrepancy is generally minor,although a few galaxies still have unaccountably low X-ray abundances.The average optical Fe abundances are about0.45solar(as predicted in the chemically consistent evolutionary models of Moller et al. 1997)compared to0.3solar for the hot gas.4.Relative AbundancesElemental abundance ratios provide constraints on the primordial IMF and relative numbers of Type Ia and Type II supernovae.Given sufficient signal-to-noise,O,Mg,Si,S,and Fe all have prominent,distinct features in ASCA spectra of elliptical galaxies.In variable abundancefits of seven ellipticals, wefind Si-to-Fe ratios consistent with or perhaps somewhat less than the (meteoritic)solar value(Figure5).This is lower than the Mg-to-Fe ratio derived from nuclear optical spectra,and is more in line with what has been6M.LOEWENSTEIN AND R.F.MUSHOTZKYFigure4.X-ray versus optical global iron abundance.measured from the X-ray spectra of intergroup media.The Si abundanceprovides an independent and robust(plasma code uncertainties are verysmall for these Si lines)strong upper limit on the effective SNIa rate thatis consistent with what is derived using Fe.The limit of about0.03SNU(1SNU=1supernova per century per1010L B⊙)is about four times lower than the recent estimate of Cappellaro et al.(1997)for H o=75km s−1Mpc−15.Implications of Low Abundances for ICM EnrichmentWe have shown that the mass-averaged Fe abundance in an elliptical galaxy,based on X-ray and optical observations,is about one-half solar.This is onlyslightly higher than what is typically measured in the intracluster medium,and yet the mass in the ICM is generally2-10times greater.There is severaltimes more Fe(and Si,as well)in the ICM than is locked up in stars incluster galaxies.This implies the following.(1)If the stellar and ICM metals come from the same SNII-enriched proto-elliptical galaxy gas,then50-90%of the original galaxy mass has been lost and a significant fraction of the ICM is not primordial but hasELLIPTICAL GALAXY ABUNDANCES7Figure5.Si versus Fe abundance in the hot X-ray emitting gas.The solid line denotes Si:Fe in the ratio1:1,while the broken lines denote the ratios3:2and1:2with respect to the(meteoritic)solar ratio.been ejected from galaxies.(2)However,the actual amount of material directly associated with the SNII ejecta is roughly an order of magnitude less.If there is selective mass-loss of nearly pure SNII ejecta it is possible to lose most of the metals without losing most of the mass.(3)It is also possible that there is an additional significant source of ICM enrichment,although there are some difficulties with such a scenario (Gibson and Matteucci1997).Perhaps,alternate sources of enrichment should be re-examined in light of the downward revision of elliptical galaxy abundances;although,one must bear in mind that ICM Fe mass is highly correlated with the total luminosity in elliptical galaxies(Arnaud et al. 1992).6.Concluding RemarksX-ray spectra of elliptical galaxies are adequatelyfit by models consisting of hot gas with subsolar Fe abundance and roughly solar Si-to-Fe ratio,plus a hard component from an ensemble of X-ray binaries.The consistency of the relative magnitude and spectrum of the hard component with that8M.LOEWENSTEIN AND R.F.MUSHOTZKYexpected from X-ray binaries,along with its more compact spatial distribu-tion supports this model over ones where the hard component is primarily due to a hotter gas plications in the form of an extra soft con-tinuum or multiple phases can be considered,but the consistency of the Si line diagnostic and continuum temperatures demonstrates that the data–at the present level of sensitivity and spectral resolution–do not require these.Optical and X-ray Fe abundance estimates are converging,although there are some cases with anomalously low X-ray values.Problems in the Fe L spectral region remain;however,the main effect of improvements in atomic physics parameters is likely to be improved spectralfits rather than a radical upward revision in abundances.Occam’s razor would seem to demand that we provisionally accept the reality of low abundances in elliptical galaxies.As a result,we need to seriously reevaluate our notions of elliptical galaxy chemical evolution,in-tracluster enrichment,and Type Ia supernova rates.We are grateful to Scott Trager and Kyoko Matsushita for making re-sults from their dissertations available to us prior to publication.7.ReferencesArimoto,N.,Matsushita,K.,Ishimaru,Y.,Ohashi,T.,&Renzini,A.1997, ApJ,477,128Arnaud,M.,Rothenflug,R.,Boulade,O.,Vigroux,L.,&Vangioni-Flan,E.1992,A&A,254,49Brighenti,F.&Mathews,W.G.1997,ApJ,in pressBuote,D.A.,&Fabian,A.C.1997,MNRAS,submittedCappellaro,E.,Turatto,M.,Tsvetkov,D.Yu.,Bartunov,O.S.,Pollas,C., Evans,R.,&Hamuy,M.1997,A&A,322,431Gibson.B.K.,&Matteucci,F.1997,ApJ,475,47Matsumoto,H.,Koyama,K.,Awaki,H.,Tsuru,T.,Loewenstein,M.,& Matsushita,K.1997,ApJ,482,133Matsushita,K.1997,Ph.D.thesis,University of TokyoMoller,C.S.,Fritze-v.Alvensleben,U.&Fricke,K.J.1997,A&A,317, 676Trager,S.C.1997,Ph.D.thesis,University of California,Santa Cruz Worthey,G.,Faber,S.M.,&Gonzalez,J.J.1992,ApJ,398,69。
a rXiv:as tr o-ph/56285v113J un25From Lithium to Uranium:Elemental Tracers of Early Cosmic Evo-lution Proceedings IAU Symposium No.228,2005V.Hill,P.Fran¸c ois &F.Primas,eds.c 2005International Astronomical Union DOI:00.0000/X000000000000000X Metals in Star-Forming Galaxies at High Redshift Claus Leitherer Space Telescope Science Institute,3700San Martin Dr.,Baltimore,MD 21218,USA email:leitherer@ Abstract.The chemical composition of high-redshift galaxies is an important property that gives clues to their past history and future evolution.Measuring abundances in distant galaxies with current techniques is often a challenge,and the canonical metallicity indicators can often not be applied.I discuss currently available metallicity indicators based on stellar and interstellar absorption and emission lines,and assess their limitations and systematic uncertainties.Recent studies suggest that star-forming galaxies at redshift around 3have heavy-element abundances already close to solar,in agreement with predictions from cosmological models.Keywords.galaxies:abundances,galaxies:high-redshift,galaxies:starburst,ultraviolet:galax-ies2Claus Leithererparison between the observed spectrum of MS1512–cB58(solid)and two syn-thetic models with1/4Z⊙(lower;dashed)and Z⊙(upper;dotted).The models have continuous star formation,age100Myr,and Salpeter IMF between1and100M⊙.The stellar lines are weaker in the metal-poor model(from Leitherer et al.2001).3.Techniques—Restframe Optical versus UVAbundance determinations typically fall into two categories,either relying on indica-tors in the restframe optical,or on those in the restframe UV.The restframe optical wavelength region has traditionally been used to determine galaxy abundances from nebular emission lines.At a redshift of z=3,the restframe optical is observed in the near-infrared(IR)H and K bands.Spectroscopic observations of LBGs in the near-IR have become technically feasible(e.g.,Pettini et al.2001)but abundance analyses are still challenging.Only the strongest lines such as,e.g.,Hα,Hβ,[N II]λ6584,or[O III]λ5007are detectable at sufficient S/N.Even when good-quality spectra are available,the atmospheric windows usually restrict the wavelengths to a narrow range,which precludes commonly used techniques such as the classical R23strong-line method(McGaugh1991). The need for alternative variants of the classical strong-line method led Pettini&Pagel (2004)to readdress the usefulness of the N2and O3N2ratios.The former is defined as the ratio[N II]λ6584over Hαand was recently discussed by Denicol´o et al.(2002);the latter includes the oxygen line for the ratio([O III]λ5007/Hβ)/([N II]λ6584/Hα)and was originally introduced by Alloin et al.(1979).After calibrating the two abundance indicators with a local H II region sample,Pettini&Pagelfind that O3N2and N2predict O/H to within0.25dex and0.4dex at the2σconfidence level,respectively.The observed frame optical wavelength region corresponds to the restframe UV of LBGs.The UV contains few nebular emission lines in star-forming galaxies(Leitherer 1997)and has rarely been used for chemical composition studies in local galaxies of this type.Fig.1compares the UV spectrum of the LBG MS1512–cB58with theoretical spectra(Leitherer et al.2001).Three groups of lines can be distinguished:(i)Interstellar absorption lines,most of which are strong and heavily saturated.Only in very few cases can unsaturated absorption lines in LBGs be used for an abundance analysis.(ii)Broad stellar-wind lines with emission and blueshifted absorption.These lines are the telltales of massive OB stars whose stellar winds are metallicity dependent.(iii)Weak photospheric absorption lines which can only be seen in high-quality spectra.Abundance studies from stellar lines in restframe UV spectra must rely either on suitable template stars or on extensive non-LTE radiation-hydrodynamic models which are only beginning to become available(Rix et al.2004).Metals in High-z Galaxies3 4.The Chemical Composition of LBGsAn initial,rough estimate of the heavy-element abundances can be obtained from the equivalent widths of the strong UV absorption lines.Heckman et al.(1998)pointed out the close correlation of the Si IVλ1400and C IVλ1550equivalent widths with O/H in a sample of local star-forming galaxies.This correlation seems surprising,as these stellar-wind lines are deeply saturated.The reason for the metallicity dependence is the behavior of stellar winds in different chemical environments.At lower abundance,the winds are weaker and have lower velocity,and the lines become weaker and narrower.As a result,the equivalent widths are smaller at lower O/H.If the same correlation holds at high redshift,the observed equivalent widths in LBGs suggest[O/H]≃–0.5(Leitherer 1999).A similar,somewhat weaker correlation exists between O/H and the equivalent widths of the strongest interstellar lines.This is even more unexpected because the equivalent widths of saturated lines have essentially no dependence on the column density N ion:W∝b[ln(N ion/b)]0.5.Therefore the correlation must be caused by the b factor, and therefore by velocity.More metal-rich galaxies are thought to host more powerful starbursts with correspondingly larger mechanical energy release by stellar winds and supernovae.The energy input leads to increased macroscopic turbulence and higher gas velocities at higher O/H(Heckman et al.1998).If the same applies to star-forming galaxies in the high-redshift universe,their measured equivalent widths again indicate an oxygen abundance of about1/3the solar value.Pettini et al.(2001)determined oxygen abundances infive LBGs from emission lines in restframe optical spectra.The redshift range of the sample dictated the use of the R23 method.The galaxies turned out to be rather metal-rich,with O/H somewhat below the solar value.This is roughly in agreement with restframe UV results,and an order of magnitude above the metallicities found in damped Lyman-αabsorbers(DLA)which are found at the same redshift.Because of the double-valued nature of the R23method, the possibility exists but is deemed less likely that the sample has oxygen abundances of only1/10the solar value.The lensed LBG MS1512–cB58and its bright restframe UV spectrum can be studied at sufficiently high S/N and resolution to detect and resolve faint,unsaturated interstellar absorption lines.Pettini et al.(2002)measured numerous transitions from H to Zn cov-ering several ionization stages.Abundances of several key elements could be derived.The α-elements O,Mg,Si,P,and S all have abundances of about40%solar,indicating that the interstellar medium is highly enriched in the chemical elements produced by type II supernovae.In contrast,N and the Fe-peak elements Mn,Fe,and Ni are all less abundant than expected by factors of several.In standard chemical evolution models,most of the nitrogen is produced by intermediate-mass stars,whereas type Ia supernovae contribute most of the Fe-peak elements.Since the evolutionary time scales of intermediate-and low-mass stars are significantly longer than those of massive stars producing theα-elements, the release of N and the Fe-group elements into the interstellar medium is delayed by ∼109yr.MS1512–cB58may be an example of a star-forming galaxy in its early stage of chemical enrichment,consistent with its cosmological age of only about15%of the age of the universe.Mehlert et al.(2002)provided similar arguments to explain variation of the C IVλ1550line relative to Si IVλ1400in a small sample of LBGs.C IV appears to decrease in strength relative to Si IV from lower to higher redshift,which may reflect the time delay of the carbon release by intermediate-mass stars.The interstellar lines in LBGs have blueshifts with velocities of up to several hun-dred km s−1indicating large-scale outflows.The associated galactic mass-loss rates of ∼102M⊙yr−1are comparable to the rates of star formation.The newly formed heavy4Claus LeithererFigure2.Left pair of panels:comparison of the observed spectrum of MS1512–cB58(thick) with fully synthetic spectra(thin)forfive different metallicities,from twice solar to1/20solar. First panel:region around1425˚A;second:region of the Fe III blend near1978˚A.Each pair of panels is labeled with the metallicity of the synthetic spectrum shown.Right pair of panels: same as left pair,but for Q1307–BM1163(from Rix et al.2004).elements are removed from their birth sites by stellar winds and supernovae and are trans-ported into the halo and possibly into the intergalactic medium(Pettini et al.2002). Detailed studies of weak interstellar lines such as that done for MS1512–cB58remain a technical challenge,even for high-throughput spectrographs at the largest telescopes. Furthermore,the results for Fe-peak elements carry some uncertainty because of the a priori unknown depletion corrections.Abundance analyses using stellar lines are not affected by depletion uncertainties.However,the existence of non-standard element ratios precludes the use of locally observed template spectra for spectral synthesis.Therefore our group(F.Bresolin,R.Kudritzki,C.Leitherer,M.Pettini,S.Rix)has embarked on a project to model the spectra of hot stars and link them with a spectral synthesis code to predict the emergent UV spectrum of a composite stellar population as a function of metallicity.We generated a grid of hydrodynamic non-LTE atmospheres with the WM-basic code(Pauldrach et al.2001)and calculated the corresponding UV line spectra.The resulting library was incorporated into the Starburst99code(Leitherer et al.1999)which then allowed us to compute a suite of model spectra for appropriate stellar population parameters.As afirst application,we used several faint stellar blends around1425˚A and 1978˚A as a metallicity indicator(Rix et al.2004).The1425˚A feature is a blend of Si III, C III,and Fe V,and the1978˚A absorption is mainly Fe III.The synthesized spectra for five metallicities are compared to the observed restframe UV spectra of MS1512–cB58 and Q1307–BM1163in Fig.2.The model having40%solar metal abundance provides the bestfit to the data,in agreement with the results from other methods.A variety of independent techniques lead to consistent results for the chemical com-position of LBGs.While each method by itself is subject to non-negligible uncertainties,Metals in High-z Galaxies5Figure3.Metallicity-luminosity relationship.Data for local spiral and irregular galaxies are from Garnett(2002).The z=2objects are overluminous for their(O/H)abundances,derived using the N2calibration of Pettini&Pagel(2004)but lie closer to the relationship for the local galaxies than z=3LBGs(from Shapley et al.2004).the overall agreement of the results gives confidence in the derived abundances.LBGs at z≃3have heavy-element abundances of about1/3the solar value.5.Cosmological PerspectiveStar-forming galaxies at z≃3,at an epoch when the universe’s age was only15% the present value,display a high level of chemical enrichment.What does their chemical composition tell us about their relation to other galaxies at lower redshift and to other structures found at z=3?Galaxies at somewhat lower redshift have only recently become accessible for detailed study due to the combined challenges of instrumentation and the galactic spectral prop-erties.Shapley et al.(2004)obtained K-band spectroscopy of seven UV-selected star-forming galaxies at redshifts between2and2.5.The N2method calibrated by Pettini &Pagel(2004)was used as an abundance diagnostic.When compared to the original higher-z LBGs,the z≃2sample is more metal-rich.This can be seen in Fig.3,where O/H of the z=2galaxies is compared with that of LBGs at z≃3and of local star-forming galaxies over a range of blue luminosities.The latter were analyzed with the R23method.The z=2sample has almost solar chemical composition but is still less metal-rich than local late-type galaxies with comparable luminosities.As a caveat,the comparison rests on the assumption that the N2and R23calibrations have no significant offset.The difference between the average redshift of the LBG sample and of the z=2 galaxies translates into a mean age difference of about1Gyr.Both the chemical proper-ties and the masses of the z=2galaxies and LBGs are consistent with standard passive evolution models.Kewley&Kobulnicky(2005)followed the metallicity evolution of star-forming galaxies with comparable luminosities from z=0to3.5.O/H was determined from restframe optical emission lines using the strong-line method in four homogeneous galaxy samples. The samples were taken from the CfA2survey,from the GOODSfield,from Shapley et al.(2004),and from the LBG sample,covering z≈0,0.7,2.1−2.5,and2.5−3.5, respectively.The average oxygen abundance in the local universe,as defined by the CfA2 sample is about solar.O/H decreases with redshift to approximately1/3solar at z=3.6Claus LeithererIt is instructive to compare the heavy-element abundances of LBGs to those of DLAs and to the Lyman-forest at the same redshift(Pettini2004).DLA systems have metallic-ities of about1/15Z⊙and are thought to be the cross sections of the outer regions and halos of(proto)-galaxies seen along the sightlines of quasars.Although the properties of LBGs and DLAs do not immediately support a close relation between the two classes of objects,at least some link seems likely.If so,the observed outflows in LBGs may provide the metal enrichment of the halos.The Lyman-forest is predicted by cold dark matter models to result from structure formation in the presence of an ionizing background. The Lyman-forest had long been thought to be truly primordial,but metal enrichment of1/100–1/1000Z⊙has recently been detected(Aguirre et al.2004).This relatively high metal abundance early in the evolution of the universe could have been produced by afirst generation of Population III stars.Such stars can account for the amount of metals,and at the same time could have provided copious ionizing photons,as metal and photon production are closely correlated.Alternatively,star-forming galaxies at high redshift could be the production sites of the metals seen in the intergalactic medium if superwinds are capable of removing the newly formed metals from galactic disks. AcknowledgementsI would like to thank Max Pettini for a careful reading of the manuscript and for providing invaluable comments.ReferencesAguirre,A.,Schaye,J.,Kim,T.,Theuns,T.,Rauch,M.,&Sargent,W.2004,ApJ,602,38 Alloin,D.,Collin-Souffrin,S.,Joly,M.,&Vigroux L.1979,A&A,78,200Denicol´o,G.,Terlevich,R.,&Terlevich,E.2002,MNRAS,330,69Garnett,D.R.2002,ApJ,581,1019Giavalisco,M.2002,ARAA,40,579Heckman,T.M.,Robert,C.,Leitherer,C.,Garnett,D.,&van de Rydt,F.1998,ApJ,503,646 Kewley,L.,&Kobulnicky,H.A.2005,in R.de Grijs&R.M.Gonz´a lez Delgado(eds.),Star-bursts:From30Doradus to Lyman Break Galaxies,(Dordrecht:Springer),p.307 Kulkarni,V.P.,Fall,S.M.,Lauroesch,J.T.,York,D.G.,Welty,D.E.,Khare,P.,&Truran, J.W.2005,ApJ,618,68Leitherer,C.1997,in:W.H.Waller,M.N.Fanelli,J.E.Hollis,&A.C.Danks(eds.),The Ultraviolet Universe at Low and High Redshift:,(Woodbury:AIP),p.119Leitherer,C.1999,in:J.Walsh&M.Rosa(eds.),Chemical Evolution from Zero to High Redshift, (Berlin:Springer),p.204Leitherer,C.,Le˜a o,J.R.S.,Heckman,T.M.,Lennon,D.J.,Pettini,M.,&Robert,C.2001, ApJ,550,724Leitherer,C.,et al.1999,ApJS,123,3McGaugh,S.1991,ApJ,380,140Mehlert,D.,et al.2002,A&A,393,809Pauldrach,A.W.A.,Hoffmann,T.L.,&Lennon,M.2001,A&A,375,161Pettini,M.2004,in:C.Esteban,R.J.Garc´ıa L´o pez,A.Herrero,&F.S´a nchez(eds.),Cosmo-chemistry,XIII Canary Islands Winter School,(Cambridge:CUP),p.257Pettini,M.,Rix,S.A.,Steidel,C.C.,Adelberger,K.L.,Hunt,M.P.,&Shapley,A.E.2002, ApJ,569,742Pettini,M.,Shapley,A.E.,Steidel,C.C.,Cuby,J.,Dickinson,M.,Moorwood,A.F.M., Adelberger,K.L.,&Giavalisco,M.2001,ApJ,554,981Rix,S.A.,Pettini,M.,Leitherer,C.,Bresolin,F.,Kudritzki,R.,&Steidel,C.C.2004,ApJ, 615,98Shapley,A.E.,Erb,D.K.,Pettini,M.,Steidel,C.C.,&Adelberger,K.L.2004,ApJ,612,108 Steidel,C.C.,Adelberger,K.L.,Giavalisco,M.,Dickinson,M.&Pettini,M.1999,ApJ,519,1。
小学下册英语第5单元真题[含答案]考试时间:90分钟(总分:120)A卷一、综合题(共计100题共100分)1. 听力题:The dog loves to chase ______ (frisbees).2. 填空题:A parrot can live for over ______ (十年).3. 听力题:My friend likes to play ____ (soccer) after school.4. 选择题:What is the smallest continent?A. EuropeB. AustraliaC. AntarcticaD. Asia答案:B5. 填空题:I can take my ________ (玩具名称) anywhere I want.6. 填空题:The bumblebee pollinates flowers in the ________________ (春天).7. 听力题:A solution with a pH greater than is called a ______.8. 填空题:The ________ (河流系统) is essential for the environment.9. 听力题:My friend is a ______. He enjoys hiking.10. 填空题:I play the _______.11. 听力题:Stars are born in _______ clouds of gas and dust.12. 填空题:The __________ is a famous mountain in the Andes. (马丘比丘)13. 听力题:My favorite color is _____ (green/yellow).14. 填空题:The currency of Russia is the ________ (俄罗斯的货币是________).15. 选择题:What do you call a person who repairs pipes?A. ElectricianB. MechanicC. PlumberD. Carpenter答案:C16. 选择题:Which fruit is known for its high vitamin C content?A. AppleB. OrangeC. BananaD. Grape17. 听力题:A solution that can dissolve more solute is called a _______ solution.18. 听力题:The ____ has big eyes and can see well in the dark.19. 填空题:The leaves of a plant are usually ______ (绿色).20. 填空题:My favorite animal is a _______ (兔子).21. 选择题:Which instrument is played with keys?A. FluteB. DrumsC. PianoD. Guitar22. 选择题:What is the main ingredient in pizza?A. BreadB. CheeseC. Tomato SauceD. All of the above答案: D23. 听力题:The __________ is essential for studying the distribution of resources.24. 填空题:The __________ in spring brings new growth to the garden. (雨水)25. 填空题:My mom, ______ (我妈妈), is very kind.26. 选择题:What do you call the person who helps you at the store?A. TeacherB. CashierC. DoctorD. Waiter27. 填空题:The _____ (土壤类型) can affect plant growth.28. 填空题:A _______ (兔子) can hop very high.29. 选择题:What is 9 + 10?A. 18B. 19C. 20D. 21答案:B30. 填空题:I love to watch the sunrise and ________ (日落) at the beach. It’s very ________ (放松).The __________ (历史电影) can bring stories to life.32. 听力题:The chemical symbol for copper is ______.33. 选择题:What do you call the act of caring for someone who is sick?A. NursingB. AidingC. AssistingD. Supporting答案: A34. 选择题:What is the opposite of "hot"?A. WarmB. CoolC. ColdD. Scorching答案: C35. 填空题:The doctor, ______ (医生), checks our health every year.36. 填空题:The __________ (历史的复兴) fosters renewal.37. 填空题:My sister is a good __________. (歌手)38. 选择题:How many hearts does an octopus have?A. OneB. TwoC. ThreeD. Four39. 填空题:I enjoy ______ (与同学一起) studying together.40. 听力题:Organic chemistry is the study of ______ compounds.The Earth revolves around the Sun in ______ days.42. 填空题:The ______ (树叶) change color in fall.43. 听力题:Stars are made mostly of ______ and helium.44. 选择题:What do we call the process of taking care of plants?A. GardeningB. FarmingC. CultivationD. All of the above答案: D. All of the above45. 填空题:I have a ________ (毛绒玩具) that I take everywhere with me.46. 听力题:The fruit is ___. (delicious)47. 听力题:The chemical symbol for iron is ______.48. 听力题:I like to ________ with my friends.49. 填空题:I like to play with my toy ________ (玩具名称) at the park.50. 选择题:What is the term for a person who studies animals?A. ZoologistB. BotanistC. EcologistD. Biologist答案:A51. ts have _____ (特殊) colors that attract animals. 填空题:Some pla52. 听力题:The process of condensation occurs when a gas turns into a _______.I call my _____ (姑姑) every week.54. 选择题:What do you call a person who repairs buildings?A. ChefB. BakerC. ArchitectD. Builder55. 听力题:The capital of Croatia is _______.56. 选择题:What is the name of the hypothetical region containing icy bodies beyond Neptune?A. Kuiper BeltB. Oort CloudC. Asteroid BeltD. Heliosphere57. ts have adapted to live in ______ (沙漠). 填空题:Some pla58. 填空题:My favorite place to visit is ______.59. 听力题:I want to be a ________.60. 填空题:A ______ (海星) has five arms.61. 听力题:The main component of proteins is ______.62. 听力题:A _______ is a process that alters the state of matter.63. 听力题:The process of heating a solid to produce a gas is called _______.64. 填空题:The parrot is colorful and can ______ (说话). It is very ______ (有趣).65. 选择题:What is a group of lions called?a. Packb. Pridec. Flockd. School答案:B66. 选择题:What do you call a story about a hero?A. AdventureB. MythC. LegendD. All of the above答案:D67. 听力题:The kitten is ______ (playing) with a feather.68. 听力题:The water is _______ (deep).69. 听力题:Distillation separates mixtures based on their ________ points.70. 填空题:A ______ (猴子) eats bananas and climbs trees.71. 听力题:The bear forages for food in the dense ____.72. 听力题:The snow is ______ (white) and fluffy.73. 听力题:We will have ______ for dessert after dinner. (cake)74. 填空题:He is very _____ (安静) but has great ideas.75. 填空题:The ________ was a conflict that lasted from 1914 to 1918.76. 听力题:A _______ is a chemical process that involves rearranging atoms.77. 填空题:My friend is __________ (有创造力).The _______ (Plymouth Rock) is a symbol of the Pilgrims’ landing in America.79. 填空题:The ancient Greeks believed in many _____ and myths.80. 填空题:Look at that _____ (小马) running in the field!81. 选择题:Which of the following is a fruit?A. CarrotB. PotatoC. TomatoD. Lettuce答案:C82. 选择题:What do we call the practice of planting trees to restore forests?A. ReforestationB. DeforestationC. AfforestationD. Conservation答案: A. Reforestation83. 听力题:A rock can be classified based on its ______ and origin.84. 听力题:In a chemical reaction, the substances we start with are called ______.85. 填空题:The butterfly flaps its wings ______ (优雅).86. 填空题:_____ (vegetation) varies by climate.87. 填空题:I can combine different ________ (玩具类型) to create something new.88. 听力题:The ______ contributes to the ecosystem.89. 填空题:The first archaeological site to be excavated was in ________ (美索不达米亚).I love my ______ very much. (我非常爱我的______。
2024年6月英语六级试卷一、写作(15%)Directions: For this part, you are allowed 30 minutes to write an essay on the topic "The Impact of Artificial Intelligence on Employment". You should write at least 150 words but no more than 200 words.二、听力理解(35%)Section A.Directions: In this section, you will hear three news reports. At the end of each news report, you will hear two or three questions. Both the news report and the questions will be spoken only once. After you hear a question, you must choose the best answer from the four choices marked A), B), C) and D).News Report 1.Questions 1 - 2 are based on the news report you have just heard.1. A) The development of a new energy source.B) The discovery of a new species.C) A major breakthrough in medical research.D) An environmental protection project.2. A) It has been widely applied in hospitals.B) It is still in the experimental stage.C) It has caused some ethical debates.D) It is too expensive for general use.News Report 2.Questions 3 - 4 are based on the news report you have just heard.3. A) To promote international trade.B) To attract more tourists.C) To improve transportation infrastructure.D) To enhance cultural exchanges.4. A) By building more high - speed railways.B) By offering more favorable policies.C) By strengthening cooperation with neighboring countries.D) By developing new tourism products.News Report 3.Questions 5 - 7 are based on the news report you have just heard.5. A) A decrease in the number of students studying abroad.B) An increase in the quality of domestic education.C) Changes in the trend of overseas study.D) Problems faced by international students.6. A) The high cost of living abroad.B) The fierce competition in the job market.C) The improvement of domestic education resources.D) The influence of the global economic situation.7. A) They are more likely to choose Asian countries.B) They tend to focus on high - tech fields.C) They are more interested in short - term study programs.D) They prefer to study in their own countries.Section B.Directions: In this section, you will hear two long conversations. At the end of each conversation, you will hear four questions. Both the conversation and the questions will be spoken only once. After you hear a question, you must choose the best answer from the four choices marked A), B), C) and D).Conversation 1.Questions 8 - 11 are based on the conversation you have just heard.8. A) She is preparing for an exam.B) She is looking for a part - time job.C) She is writing a research paper.D) She is planning a trip.9. A) In the library.B) In the cafeteria.C) In the dormitory.D) In the classroom.10. A) It requires a lot of reading.B) It has a strict time limit.C) It needs to be done in groups.D) It involves field research.11. A) Help her find relevant materials.B) Give her some advice on writing.C) Join her study group.D) Share his own experience.Conversation 2.Questions 12 - 15 are based on the conversation you have just heard.12. A) A new movie.B) A best - selling book.C) A popular TV show.D) A famous actor.13. A) The interesting plot.B) The excellent acting.C) The beautiful scenery.D) The profound theme.14. A) He has seen it many times.B) He doesn't like it at all.C) He thinks it's just so - so.D) He hasn't seen it yet.15. A) Watch it together this weekend.B) Recommend some other movies.C) Discuss the story in detail.D) Buy the DVD of the movie.Section C.Directions: In this section, you will hear three passages. At the end of each passage, you will hear three or four questions. Both the passage and the questions will be spoken only once. After you hear a question, you must choose the best answer from the four choices marked A), B), C) and D).Passage 1.Questions 16 - 18 are based on the passage you have just heard.16. A) The origin of language.B) The development of language.C) The importance of language in communication.D) The differences between languages.17. A) By imitating the sounds of nature.B) By using gestures and facial expressions.C) By making up random sounds.D) By combining existing words.18. A) It helps people express complex ideas.B) It enables people to communicate across cultures.C) It reflects the creativity of human beings.D) It is constantly evolving.Passage 2.Questions 19 - 22 are based on the passage you have just heard.19. A) How to choose a suitable career.B) The factors influencing career choices.C) The importance of career planning.D) Different types of careers.20. A) Personal interests.B) Family expectations.C) Social status.D) Economic benefits.21. A) They are more likely to be satisfied with their jobs.B) They can earn more money.C) They can get promoted more easily.D) They are less likely to change their jobs.22. A) Do some internships.B) Take career assessment tests.C) Consult career counselors.D) Follow the advice of parents.Passage 3.Questions 23 - 25 are based on the passage you have just heard.23. A) The history of modern architecture.B) The characteristics of different architectural styles.C) The influence of architecture on people's lives.D) The development of sustainable architecture.24. A) It is more energy - efficient.B) It is more beautiful.C) It is more expensive.D) It is more difficult to construct.25. A) Using recycled materials.B) Designing more open spaces.C) Incorporating natural elements.D) Adopting new construction techniques.三、阅读理解(35%)Section A.Directions: In this section, there is a passage with ten blanks. You are required to select one word for each blank from a list of choices givenin a word bank following the passage. Read the passage through carefully before making your choices. Each choice in the bank is identified by a letter. Please mark the corresponding letter for each item on Answer Sheet 2. You may not use any of the words in the bank more than once.The Internet has become an integral part of our daily lives. It has_(26)_ the way we communicate, learn, work, and entertain ourselves. With just a few clicks, we can access a vast amount of information from all over the world. However, this convenience also comes with some _(27)_. One of the major concerns is the issue of privacy. When we use the Internet, we often leave behind a digital _(28)_ that can be used by others for various purposes. For example, companies may collect our personal information to target us with advertisements. Another problem is the spread of false information. In the age of social media, anyone can _(29)_ information without proper verification, which can lead to misunderstandings and even social unrest. To address these issues, governments and Internet companies need to work together. Governments should _(30)_ laws to protect users' privacy and regulate the spread of false information. Internet companies, on the other hand, should take _(31)_ measures to ensure the security of users' data and promote the authenticity of information.Word Bank:A) transformed.B) challenges.C) footprint.D) publish.E) enforce.F) responsible.G) limited.H) access.I) privacy.J) awareness.Section B.Directions: In this section, you will read several passages. Each passage is followed by several questions based on its content. You are to choose the best answer to each question from the four choices marked A), B), C) and D).Passage 1.Questions 32 - 36 are based on the following passage.The concept of "green jobs" has gained increasing attention in recent years. Green jobs are those that contribute to environmental protection and sustainable development. These jobs can be found in various sectors, suchas renewable energy, energy - efficient building, and waste management. The growth of green jobs is driven by several factors. Firstly, the increasing awareness of environmental issues has led to a greater demand for environmentally - friendly products and services. Secondly, government policies and incentives play an important role. Many governments around the world are providing subsidies and tax breaks to encourage the developmentof green industries. Thirdly, technological advancements have made it possible to develop more efficient and cost - effective green technologies.However, the development of green jobs also faces some challenges. One of the challenges is the lack of trained personnel. Since green jobs often require specialized knowledge and skills, there is a shortage of workers who are qualified to fill these positions. Another challenge is the high cost of some green technologies, which may limit their widespread adoption.32. What are green jobs according to the passage?A) Jobs that are related to plants and forests.B) Jobs that are only available in the environmental protection department.C) Jobs that contribute to environmental protection and sustainable development.D) Jobs that require workers to wear green uniforms.33. What drives the growth of green jobs?A) Only the increasing awareness of environmental issues.B) The increasing awareness of environmental issues, governmentpolicies and incentives, and technological advancements.C) Only government policies and incentives.D) Only technological advancements.34. What is one of the challenges faced by the development of green jobs?A) There are too many trained personnel.B) The lack of trained personnel.C) The low cost of green technologies.D) The over - adoption of green technologies.35. Which of the following sectors may not have green jobs?A) Renewable energy.B) Energy - efficient building.C) Traditional coal mining.D) Waste management.36. What can be inferred from the passage about green jobs?A) They are not very important for the future.B) They will develop without any difficulties.C) They have both opportunities and challenges.D) They are only popular in developed countries.Passage 2.Questions 37 - 41 are based on the following passage.In the digital age, e - books have become increasingly popular. They offer several advantages over traditional printed books. For one thing, e - books are more convenient. You can carry a whole library of e - books on a single device, such as a tablet or an e - reader. This means you can have access to a wide range of reading materials wherever you are. For another, e - books are often cheaper than their printed counterparts. Publishers can save on the cost of printing and distribution, and these savings can be passed on to the consumers.However, e - books also have some disadvantages. One problem is that reading e - books for a long time may cause eye strain. The backlit screens of e - readers and tablets can be tiring on the eyes, especially in low - light conditions. Another issue is that some people simply prefer the feelof a physical book in their hands. The texture of the paper, the smell of the ink, and the act of turning the pages all contribute to the reading experience for these people.37. What are the advantages of e - books?A) They are more expensive.B) They are less convenient.C) They are more convenient and often cheaper.D) They are only available on one device.38. Why are e - books often cheaper?A) Because publishers don't want to make money.B) Because publishers can save on the cost of printing and distribution.C) Because e - books are of lower quality.D) Because the government subsidizes e - books.39. What is one of the disadvantages of e - books?A) They can't be read on any device.B) They may cause eye strain.C) They are always more expensive than printed books.D) They have no page - turning function.40. Who may not like e - books according to the passage?A) People who like to read a lot.B) People who care about the cost.C) People who prefer the feel of a physical book.D) People who are always on the go.41. What can be concluded from the passage about e - books?A) They will completely replace printed books in the future.B) They are not as good as printed books in any aspect.C) They have both pros and cons.D) They are only suitable for young people.Section C.Directions: There are 2 passages in this section. Each passage is followed by some questions or unfinished statements. For each of them there are four choices marked A), B), C) and D). You should decide on the best choice and mark the corresponding letter on Answer Sheet 2.Passage 1.Questions 42 - 46 are based on the following passage.The sharing economy has emerged as a new economic model in recent years. It is based on the idea of sharing under - utilized resources, such as cars, houses, and tools. Platforms like Uber and Airbnb have become very popular, allowing people to earn extra income by sharing their assets.One of the main benefits of the sharing economy is that it can make more efficient use of resources. For example, instead of having a large number of cars sitting idle in parking lots, they can be used by others through car - sharing services. This can also reduce the need for new production, which is beneficial for the environment. Another advantage is that it can provide more affordable options for consumers. For instance, staying in an Airbnb accommodation is often cheaper than a hotel.However, the sharing economy also faces some challenges. One issue is the lack of regulation. Since it is a relatively new model, there are not enough laws and regulations to ensure fair competition and protect consumers. For example, some Uber drivers may not have proper insurance, which can pose a risk to passengers. Another problem is the quality control. It can be difficult to ensure the quality of shared resources, such as the cleanliness and safety of an Airbnb rental.42. What is the sharing economy based on?A) Buying new resources.B) Sharing under - utilized resources.C) Producing more resources.D) Wasting resources.43. What are the benefits of the sharing economy?A) It can make resources less efficient.B) It can only provide expensive options for consumers.C) It can make more efficient use of resources and provide more affordable options for consumers.D) It has no benefits at all.44. What are the challenges faced by the sharing economy?A) The over - regulation.B) The lack of regulation and quality control.C) The too - strict quality control.D) The high cost of production.45. Why is the lack of regulation a problem in the sharing economy?A) Because it ensures fair competition.B) Because it protects consumers.C) Because there are not enough laws and regulations to ensure fair competition and protect consumers.D) Because it makes the sharing economy too popular.46. What can be inferred about the sharing economy from the passage?A) It will disappear soon.B) It has both positive and negative aspects.C) It is only suitable for developed countries.D) It is a perfect economic model.Passage 2.Questions 47 - 50 are based on the following passage.Cultural heritage is an important part of a nation's identity. It includes historical buildings, artworks, traditions, and languages. Protecting cultural heritage is not only important for preserving anation's past but also for its future development.One of the ways to protect cultural heritage is through restoration. Restoration projects can bring old historical buildings back to life, allowing people to experience the past. For example, the restoration of the Forbidden City in China has made it a popular tourist destination, attracting millions of visitors every year. Another way is through education. By teaching people about their cultural heritage, they can develop a sense of pride and ownership, and be more likely to protect it.However, protecting cultural heritage also faces some challenges. One challenge is the lack of funds. Restoration projects can be very expensive, and many countries may not have enough money to carry out large - scale restoration work. Another challenge is the impact of modernization. As cities develop, some historical buildings may be demolished to make way for new construction.47. What is cultural heritage according to the passage?A) Only historical buildings.B) Only artworks.C) Historical buildings, artworks, traditions, and languages.D) Only modern buildings.48. Why is protecting cultural heritage important?A) Only for preserving a nation's past.B) Only for a nation's future development.C) For both preserving a nation's past and its future development.D) For no particular reason.49. What are the ways to protect cultural heritage?A) Only through restoration.B) Only through education.C) Through restoration and education.D) Through demolition.50. What are the challenges faced by protecting cultural heritage?A) The lack of funds and the impact of modernization.B) The over - abundance of funds and the lack.。
矿产资源开发利用方案编写内容要求及审查大纲
矿产资源开发利用方案编写内容要求及《矿产资源开发利用方案》审查大纲一、概述
㈠矿区位置、隶属关系和企业性质。
如为改扩建矿山, 应说明矿山现状、
特点及存在的主要问题。
㈡编制依据
(1简述项目前期工作进展情况及与有关方面对项目的意向性协议情况。
(2 列出开发利用方案编制所依据的主要基础性资料的名称。
如经储量管理部门认定的矿区地质勘探报告、选矿试验报告、加工利用试验报告、工程地质初评资料、矿区水文资料和供水资料等。
对改、扩建矿山应有生产实际资料, 如矿山总平面现状图、矿床开拓系统图、采场现状图和主要采选设备清单等。
二、矿产品需求现状和预测
㈠该矿产在国内需求情况和市场供应情况
1、矿产品现状及加工利用趋向。
2、国内近、远期的需求量及主要销向预测。
㈡产品价格分析
1、国内矿产品价格现状。
2、矿产品价格稳定性及变化趋势。
三、矿产资源概况
㈠矿区总体概况
1、矿区总体规划情况。
2、矿区矿产资源概况。
3、该设计与矿区总体开发的关系。
㈡该设计项目的资源概况
1、矿床地质及构造特征。
2、矿床开采技术条件及水文地质条件。