R-refcard-data-mining R语言数据挖据卡片
- 格式:pdf
- 大小:253.58 KB
- 文档页数:5
基于R语言的数据挖掘算法研究作者:张海阳齐俊传毛健来源:《电脑知识与技术》2016年第28期摘要:该文采用R语言作为研究工具以及聚类和决策树等数据挖掘算法,研究如何针对社交网站中的用户进行分类,挖掘最终可指导网站优化和提高服务质量的客户分类数据。
采用网络爬虫从某社交网站中抓取数据,该文采用聚类算法中的DIANA算法对抽样样本计算并对数据进行初步的簇类划分;接着采用PAM算法对整体样本进行进一步的计算并提取出大聚类,接着采用分别CART和C4.5等决策树算法对决策树规则进行进一步的研究,最终对研究结果进行评估并用来指导实践。
关键词:R语言;数据挖掘;C4.5;Cart中图分类号:TP393 文献标识码:A 文章编号:1009-3044(2016)28-0016-03随着互联网社交网站的繁荣和各种网络应用的不断深入,社交网站已成为互联网上的重要平台应用。
伴随社交网络的发展,不同地域、性格和特质的用户群展现出了差异化的需求,面对这些群体和用户需求,如何细分市场识别并提供差异化的服务,以帮助企业在激烈的竞争中保持老用户,发展新用户。
本文围绕社交网络理论和客户细分理论的研究,运用数据挖掘工具中的决策树算法,对社交网络客户细分进行了深入的探讨并最终得出可指导时间的社交网络客户细分规则。
1.1 R语言R是一种在数据统计领域广泛使用的语言,R语言是一种开源语言,该语言的前身是S语言,也可以说R语言是S语言的一种实现,R在语法上类似C语言。
R是一个统计分析软件,既可以进行统计分析,又可以进行图形显示。
R能进行复杂的数据存储和数据处理,利用数据、向量、矩阵的数学方法进行各种统计分析,并将统计分析结果以图形方式展示出来,因此R也是一种统计制图软件。
R内嵌丰富的数学统计函数,从而使使用者能灵活的进行统计分析。
它可以运行于UNIX,Windows和Macintosh的操作系统上,而且嵌入了一个非常方便实用的帮助系统。
R是一种功能强大的编程语言,就像传统的编程语言C和JAVA一样,R也可以利用条件、循环等编程方法实现对数据的各种处理,从而实现数据统计目的。
R语⾔:读取数据主要学习如何把⼏种常⽤的数据格式导⼊到R中进⾏处理,并简单介绍如何把R中的数据保存为R数据格式和csv⽂件。
1、保存和加载R的数据(与R.data的交互:save()函数和load()函数)a <- 1:10save(a, file = "data/dumData.Rdata") # data⽂件为当前⼯作⽬录下的⽂件,必须存在rm(a)load("data/dumData.Rdata")print(a)2、导⼊和加载.csv⽂件(write.csv()函数和read.csv()函数)var1 <- 1:5var2 <- (1:5) / 10var3 <- c("R", "and", "Data Mining", "Examples", "Case Studies")a <- data.frame(var1, var2, var3)names(a) <- c("VariableInt", "VariableReal", "VariableChar")write.csv(a, "data/dummmyData.csv", s = FALSE)b <- read.csv("data/dummmyData.csv")3、导⼊SPSS/SAS/Matlab等数据集# 导⼊spss的sav格式数据则要⽤到foreign扩展包,加载后直接⽤read.spss读取sav⽂件library(foreign)mydata=read.spss('d:/test.sav')# 上⾯的函数在很多情况下没能将sav⽂件中的附加信息导进来,例如数据的label,# 那么建议⽤Hmisc扩展包的spss.get函数,效果会更好⼀些。
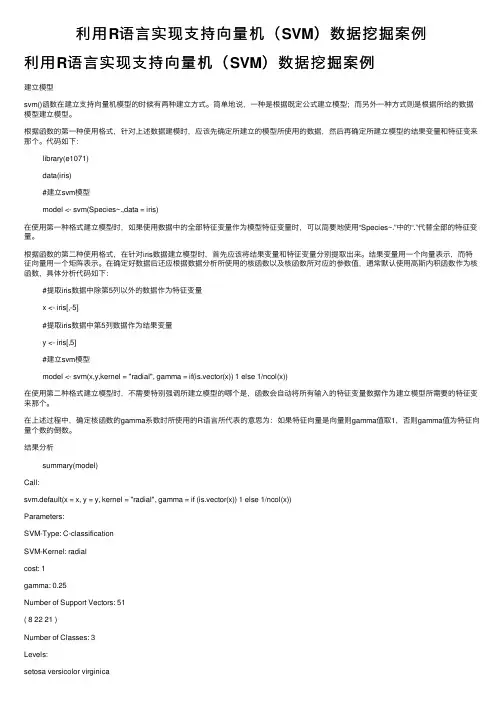
利⽤R语⾔实现⽀持向量机(SVM)数据挖掘案例利⽤R语⾔实现⽀持向量机(SVM)数据挖掘案例建⽴模型svm()函数在建⽴⽀持向量机模型的时候有两种建⽴⽅式。
简单地说,⼀种是根据既定公式建⽴模型;⽽另外⼀种⽅式则是根据所给的数据模型建⽴模型。
根据函数的第⼀种使⽤格式,针对上述数据建模时,应该先确定所建⽴的模型所使⽤的数据,然后再确定所建⽴模型的结果变量和特征变来那个。
代码如下:library(e1071)data(iris)#建⽴svm模型model <- svm(Species~.,data = iris)在使⽤第⼀种格式建⽴模型时,如果使⽤数据中的全部特征变量作为模型特征变量时,可以简要地使⽤“Species~.”中的“.”代替全部的特征变量。
根据函数的第⼆种使⽤格式,在针对iris数据建⽴模型时,⾸先应该将结果变量和特征变量分别提取出来。
结果变量⽤⼀个向量表⽰,⽽特征向量⽤⼀个矩阵表⽰。
在确定好数据后还应根据数据分析所使⽤的核函数以及核函数所对应的参数值,通常默认使⽤⾼斯内积函数作为核函数,具体分析代码如下:#提取iris数据中除第5列以外的数据作为特征变量x <- iris[,-5]#提取iris数据中第5列数据作为结果变量y <- iris[,5]#建⽴svm模型model <- svm(x,y,kernel = "radial", gamma = if(is.vector(x)) 1 else 1/ncol(x))在使⽤第⼆种格式建⽴模型时,不需要特别强调所建⽴模型的哪个是,函数会⾃动将所有输⼊的特征变量数据作为建⽴模型所需要的特征变来那个。
在上述过程中,确定核函数的gamma系数时所使⽤的R语⾔所代表的意思为:如果特征向量是向量则gamma值取1,否则gamma值为特征向量个数的倒数。
结果分析summary(model)Call:svm.default(x = x, y = y, kernel = "radial", gamma = if (is.vector(x)) 1 else 1/ncol(x))Parameters:SVM-Type: C-classificationSVM-Kernel: radialcost: 1gamma: 0.25Number of Support Vectors: 51( 8 22 21 )Number of Classes: 3Levels:setosa versicolor virginica通过summary()函数可以得到关于模型的相关信息。


使用R进行数据挖掘和机器学习实战案例引言在当今信息时代,大量的数据被生成和存储,这些数据蕴含了丰富的信息和价值。
然而,如何从这些海量数据中提取有用的信息仍然是一个具有挑战性的问题。
数据挖掘和机器学习技术的出现,为我们解决这个问题提供了一条可行的道路。
本文将使用R 语言为工具,介绍数据挖掘和机器学习的实战案例,并分为三个章节:数据预处理、数据挖掘和机器学习。
第一章:数据预处理在数据挖掘和机器学习之前,必须进行数据预处理,以清洗和准备数据,使其适合后续的分析和建模。
数据预处理步骤通常包括数据清洗、特征选择、特征缩放和数据转换等。
在R中,我们可以使用各种包和函数来处理数据。
例如,使用dplyr包可以对数据进行清洗和整理,使用tidyverse包可以进行特征选择,使用caret包可以进行特征缩放,使用reshape2包可以进行数据转换等。
通过这些功能强大的工具,我们可以在数据挖掘和机器学习之前对数据进行必要的预处理。
第二章:数据挖掘在数据预处理完成之后,接下来是数据挖掘的过程。
数据挖掘旨在发现数据背后的隐藏模式和关联规则,并提取有用的信息。
在R中,我们可以使用多种算法进行数据挖掘,如聚类分析、关联规则挖掘、时间序列分析等。
对于聚类分析,我们可以使用k-means算法、层次聚类算法等,在R中可以通过cluster包和stats包来实现。
关联规则挖掘可以使用Apriori算法和FP-Growth算法,在R中可以通过arules包和arulesSequences包来实现。
时间序列分析可以使用ARIMA模型和自回归平均滑动模型,在R中可以通过forecast包和stats包来实现。
通过这些算法和相应的R包,我们可以在数据中发现有用的模式和规律。
第三章:机器学习数据挖掘的结果往往是为了解决实际的问题或做出预测。
而机器学习就是通过利用数据的模式和规律来训练模型,并使用这些模型来做出预测或分类。
在R中,有许多机器学习算法和相应的包可以供我们选择。
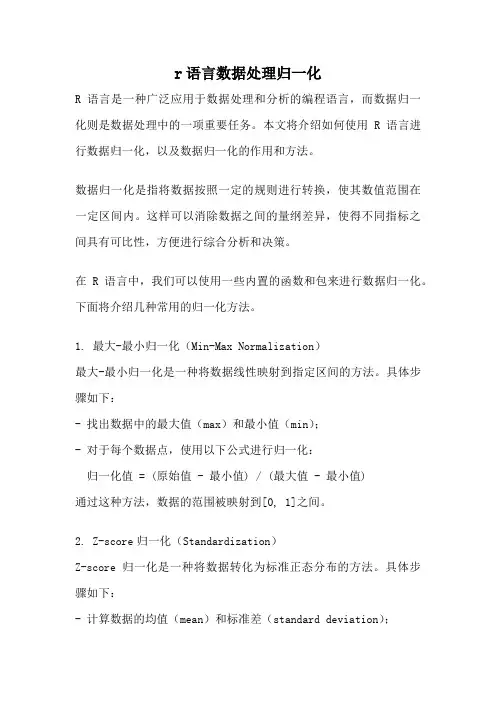
r语言数据处理归一化R语言是一种广泛应用于数据处理和分析的编程语言,而数据归一化则是数据处理中的一项重要任务。
本文将介绍如何使用R语言进行数据归一化,以及数据归一化的作用和方法。
数据归一化是指将数据按照一定的规则进行转换,使其数值范围在一定区间内。
这样可以消除数据之间的量纲差异,使得不同指标之间具有可比性,方便进行综合分析和决策。
在R语言中,我们可以使用一些内置的函数和包来进行数据归一化。
下面将介绍几种常用的归一化方法。
1. 最大-最小归一化(Min-Max Normalization)最大-最小归一化是一种将数据线性映射到指定区间的方法。
具体步骤如下:- 找出数据中的最大值(max)和最小值(min);- 对于每个数据点,使用以下公式进行归一化:归一化值 = (原始值 - 最小值) / (最大值 - 最小值)通过这种方法,数据的范围被映射到[0, 1]之间。
2. Z-score归一化(Standardization)Z-score归一化是一种将数据转化为标准正态分布的方法。
具体步骤如下:- 计算数据的均值(mean)和标准差(standard deviation);- 对于每个数据点,使用以下公式进行归一化:归一化值 = (原始值 - 均值) / 标准差通过这种方法,数据的均值为0,标准差为1。
3. 小数定标归一化(Decimal Scaling)小数定标归一化是一种将数据转化为[-1, 1]之间的方法。
具体步骤如下:- 找出数据中的最大值(max);- 对于每个数据点,使用以下公式进行归一化:归一化值 = 原始值 / 10^k其中k为使得最大值小于1的最小整数。
通过这种方法,数据的范围被映射到[-1, 1]之间。
除了以上几种方法,还有一些其他的归一化方法,如指数转换归一化、对数转换归一化等。
根据不同的数据和需求,选择适合的归一化方法是非常重要的。
在R语言中,可以使用如下代码进行数据归一化:```R# 最大-最小归一化normalize_min_max <- function(x) {return((x - min(x)) / (max(x) - min(x)))}# Z-score归一化normalize_z_score <- function(x) {return((x - mean(x)) / sd(x))}# 小数定标归一化normalize_decimal_scaling <- function(x) {k <- floor(log10(max(x)))return(x / 10^k)}# 使用示例data <- c(1, 2, 3, 4, 5)normalized_data <- normalize_min_max(data)```通过上述代码,我们可以对数据进行最大-最小归一化、Z-score归一化和小数定标归一化。
R语言实现的主成分分析算法及其在数据挖掘中的效果评估主成分分析(Principal Component Analysis,PCA)是一种常用的降维方法,通过线性变换将高维数据映射到低维空间中,同时尽量保留原始数据的主要信息。
在数据挖掘中,PCA可用于数据降维、可视化和特征提取等任务,它能够发现数据中的主要变化方向、确定重要特征和识别异常数据点等,对于处理高维数据具有重要的应用价值。
R语言是一种功能强大的数据分析和统计建模工具,提供了丰富的统计函数和扩展包,方便进行主成分分析及其效果评估。
本文将介绍R语言中实现主成分分析算法的常用方法,并分析其在数据挖掘中的常见应用。
首先,R语言中实现主成分分析的常用函数是prcomp(),它可以计算数据的主成分分析结果。
以下是使用prcomp()函数的代码示例:```R# 导入数据data <- read.csv("data.csv")# 提取数值型特征numeric_data <- data[, sapply(data, is.numeric)]# 进行主成分分析pca_result <- prcomp(numeric_data, scale. = TRUE)# 输出主成分分析结果summary(pca_result)```上述代码中,我们首先导入数据,并提取其中的数值型特征。
然后,使用prcomp()函数对数值型特征进行主成分分析,其中scale. = TRUE表示在计算之前对数据进行标准化处理。
最后,通过summary()函数输出主成分分析的结果,包括每个主成分的解释方差比例、特征值和主成分载荷。
主成分分析的效果评估包括解释方差比例、主成分载荷和主成分得分等指标。
解释方差比例表示每个主成分解释原始数据方差的比例,通常我们选取累计解释方差比例达到一定阈值(例如80%)的前几个主成分作为降维后的特征。
主成分载荷表示每个主成分与原始特征之间的相关性,可以用于解释主成分所代表的信息。
目录一、 获得帮助二、 输入与输出三、 数据创建四、 数据切割和分离五、 变量变换六、 变量信息七、 数据选取和操作八、 数学函数九、 矩阵十、 高级数据处理十一、 字符十二、 日期和时间十三、 绘图十四、 低水平绘图命令十五、 绘图参数十六、 网格(Lattice)绘图十七、 模型拟和十八、 统计十九、 分布二十、 编程获得帮助一、获得帮助一、1.大部分R函数都有在线文档。
help(topic)关于topic的文档.2.?topic同上3.help.search(ntopicn) 搜索帮助系统4.apropos("topic") 返回所有在搜索路径下满足正则表达式"topic"的所有对象名称。
5.help.start() HTML形式的帮助6.str(a) 显示R对象的内在属性(structure)或简要说明对象7.summary(a) 给出a的概要,通常是一个一般性统计概要;且它有不同的机理和a的属性8.ls() 显示搜索路径下的对象;指定pat="pat"时,按式样条件搜索9.ls.str() str()搜索路径下的每个变量10.dir() 在当前的目录下显示文件11.methods(a) 显示a的“S3methods”12.methods(class=class(a)) 列表所有可以解决属于对象类的方法输入与输出二、输入与输出二、1.load() 加载由save命令得到的数组2.data(x) 加载指定的数组3.library(x) 加载包4.read.table(file) 读取表格式的文件并将其创建成数据框;默认分割符sep=""为任意whitespace;使用header=TRUE读取第一行作为列标题;使用as.is=TRUE防止字符向量变为factors;使用comment.char=""防止被解释为注释;使用skip=n在读数据前跳过n行;详细见帮助关于行命名,NA处理,和其他5.read.csv("filename",header=TRUE) 同上,但默认设置为读取逗点分割文件6.read.delim("filename",header=TRUE) 同上,默认设置为读取tab分割文件7.read.fwf(file,widths,header=FALSE,sep="",as.is=FALSE) 以fixed width formatted形式读取数据金数据框;widths是整数向量,用于设置调整宽度字段8.save(file,...) 以不分平台的二进制保存指定的对象9.save.image(file) 保存所有的对象10.cat(..., file="", sep="")强制转化为字符后打印arguments;sep为arguments间的分割字符11.print(a, ...) 显示arguments;—般性的,且它有不同的机理和a的属性12.format(x,...) 格式化,更好的显示R对象13.write.table(x,file="",s=TRUE,s=TRUE,sep="") 在把x转化为数据框后,写到文件;如果quote为TRUE,字符和因子列就会被(")所包围;sep是字段分隔符;eol为尾行分割符;na为缺失值字符串;使用s=NA增加列标题以便于和表格输入一致14.sink(file) 输出到文件file,直到输入命令sink()15.大部分I /O函数都有file参数。
r语言数据挖掘课程设计一、课程目标知识目标:1. 掌握R语言基础语法和数据类型,理解数据结构在数据挖掘中的重要性;2. 学会使用R语言进行数据导入、清洗、转换和预处理,掌握基本的数据处理技巧;3. 了解并掌握常用的数据挖掘算法,如关联规则、分类、聚类等,能够运用到实际问题中;4. 学会使用R语言中的数据可视化工具,对数据进行有效展示,提高数据分析的可读性。
技能目标:1. 能够独立运用R语言进行数据挖掘项目的实施,包括数据预处理、挖掘算法应用和结果分析;2. 培养学生具备运用R语言解决实际问题的能力,提高编程实践技能;3. 能够运用所学知识,结合实际案例进行数据挖掘分析,形成数据分析报告。
情感态度价值观目标:1. 激发学生对数据挖掘的兴趣,培养主动探究和解决问题的热情;2. 培养学生的团队协作精神,学会与他人共同分析问题、探讨解决方案;3. 引导学生认识到数据挖掘在现实生活中的应用价值,提高数据素养,培养数据伦理观念。
本课程针对高年级学生,结合学科特点和教学要求,注重理论与实践相结合,旨在提高学生运用R语言进行数据挖掘的实际操作能力,培养学生具备数据分析的基本素养,为未来的学术研究或职业发展打下坚实基础。
通过对课程目标的分解,为后续教学设计和评估提供明确的方向。
二、教学内容1. R语言基础语法和数据类型:介绍R语言的安装与配置,基础语法规则,变量和数据类型,控制结构等;教材章节:第1章 R语言概述与安装,第2章 R语言基础语法;内容安排:2学时。
2. 数据导入与预处理:讲解如何使用R语言读取不同格式的数据,数据清洗、转换和预处理方法;教材章节:第3章 数据导入与预处理;内容安排:3学时。
3. 常用数据挖掘算法:介绍关联规则、分类、聚类等常用算法,并通过实例进行讲解;教材章节:第4章 数据挖掘算法概述,第5章 关联规则挖掘,第6章 分类与聚类算法;内容安排:6学时。
4. 数据可视化:讲解R语言中的数据可视化工具,如ggplot2等,以及如何对数据进行有效展示;教材章节:第7章 数据可视化;内容安排:2学时。
R语言在数据挖掘中的应用及其算法分析作者:王星来源:《电脑知识与技术》2017年第07期摘要;开源中的R语言具有很好的扩展性,它具有可视算法及多种数据分析。
该文将通过对于R语言中的相关算法和技术进行分析,分析一些实际应用案例,探讨一下R语言中在数据挖掘中的优势。
关键词:R语言;数据挖掘;算法中图分类号:TP311 文献标识码:A 文章编号:1009-3044(2017)07-0209-02现今很多企业都采用“用数据决策”,以及“用数据说话”等方式对自身的企业进行改革以及转变发展方向。
但是利用传统的数据随机抽取、或是全样抽取等数据收集方式,具有严重的实效差,已经满足不了人们对于信息需求的实时性,而且严重地影响了数据的准确度。
如何在大量的数据中收集到准确度度较高的信息,是一个企业提高竞争力的重要内容。
1在数据挖掘中的R语言技术1.1Kmeans技术Kmeans自定义算法编写流程可以看图1,先是进行绘制p.kmeans相关的函数,之后就是对每个数据中的样本设置相应的id号,其中mid是中心数据,c.core主要就是对数据进行集中分类。
对于每个聚类的中心坐标是用Mid.core函数进行位置计算的,通过对多个中心进行计算,如果每次的计算结果都是相同的,那么就停止进行函数循环计算。
否则就要继续进行计算,指导每个中线点值都是相同的。
1.2IGRAPH技术IGRAPH常用于电商平台和社交网站等平台,它主要是将每个站点的图片等相关信息进行分析,然后获得具有价值的数据决策。
它是经过对结点和线段进行图片构建,然后给予两者进行赋值:比如对于线段的无方向权重,或是有向权重是多少。
而且IGRAPH自身就具备多种图片建设策略。
比如图1中的“随机算法”可以将随意两点进行连线,构成图片,对于图片的生成也可以利用数据中“最小生成树算法”,这样可以构成最小连线权重。
其中将两个结点的连线穿透到第三个结点可以使用“穿插算法”,对于那种带方向的图片,想要对两个结点进行连通就需要M指向N的必要条件作为支持,对于无方向的图片,只有M与N是相互指向的才能称为是连通的。
R Reference Card for Data MiningYanchang Zhao,,August 15,2013-See the latest versionat .Click the link also for documentR and Data Mining:Examples and Case Studies .-The package names are in parentheses.-Recommended packages and functions are shown in bold.-Click a package in this PDFfile to find it on CRAN.apriori()mine associations with APRIORI algorithm –a level-wise,breadth-first algorithm which counts transactions to find frequent item-sets (arules )eclat()mine frequent itemsets with the Eclat algorithm,which employsequivalence classes,depth-first search and set intersection instead of counting (arules )cspade()mine frequent sequential patterns with the cSPADE algorithm (aru-lesSequences )seqefsub()search for frequent subsequences (TraMineR )Packagesarules mine frequent itemsets,maximal frequent itemsets,closed frequent item-Apriori and Eclat.mine frequent sequences of states or eventsctree()conditional inference trees,recursive partitioning for continuous,cen-sored,ordered,nominal and multivariate response variables in a condi-tional inference framework (party )rpart()recursive partitioning and regression trees (rpart )mob()model-based recursive partitioning,yielding a tree with fitted models as-sociated with each terminal node (party )Random Forestcforest()random forest and bagging ensemble (party )randomForest()random forest (randomForest )importance()variable importance (randomForest )varimp()variable importance (party )Neural Networksnnet()fit single-hidden-layer neural network (nnet )mlp(),dlvq(),rbf(),rbfDDA(),elman(),jordan(),som(),art1(),art2(),artmap(),assoz()various types of neural networks (RSNNS )neuralnet training of neural networks (neuralnet )Support Vector Machine (SVM)svm()train a support vector machine for regression,classification or density-estimation (e1071)ksvm()support vector machines (kernlab )Performance Evaluationperformance()provide various measures for evaluating performance of pre-diction and classification models (ROCR )PRcurve()precision-recall curves (DMwR )CRchart()cumulative recall charts (DMwR )roc()build a ROC curve (pROC )auc()compute the area under the ROC curve (pROC )ROC()draw a ROC curve (DiagnosisMed )Packagesparty recursive partitioningrpart recursive partitioning and regression treesrandomForest classification and regression based on a forest of trees using ran-dom inputsROCR visualize the performance of scoring classifiersrpartOrdinal ordinal classification trees,deriving a classification tree when the response to be predicted is ordinal rpart.plot plots rpart modelspROC display and analyze ROC curvesnnet feed-forward neural networks and multinomial log-linear modelsRSNNS neural networks in R using the Stuttgart Neural Network Simulator (SNNS)neuralnet training of neural networks using backpropagation,resilient backprop-weight backtrackinglm()linear regressionglm()generalized linear regression predict()predict with modelsresiduals()residuals,the difference between observed values and fitted val-uesnls()non-linear regressiongls()fit a linear model using generalized least squares (nlme )gnls()fit a nonlinear model using generalized least squares (nlme )Packagesmixed effects modelsClusteringpartition the data into k groups first and then try to improve the quality of clus-tering by moving objects from one group to anotherkmeans()perform k-means clustering on a data matrixkmeansruns()call kmeans for the k-means clustering method and includesestimation of the number of clusters and finding an optimal solution from several starting points (fpc )pam()the Partitioning Around Medoids (PAM)clustering method (cluster )pamk()the Partitioning Around Medoids (PAM)clustering method with esti-mation of number of clusters (fpc )kmeansCBI()interface function for kmeans (fpc )cluster.optimal()search for the optimal k-clustering of the dataset(bayesclust )clara()Clustering Large Applications (cluster )fanny(x,k,...)compute a fuzzy clustering of the data into k clusters (cluster )kcca()k-centroids clustering (flexclust )ccfkms()clustering with Conjugate Convex Functions (cba )apcluster()affinity propagation clustering for a given similarity matrix (ap-cluster )apclusterK()affinity propagation clustering to get K clusters (apcluster )cclust()Convex Clustering,incl.k-means and two other clustering algorithms(cclust )KMeansSparseCluster()sparse k-means clustering (sparcl )tclust(x,k,alpha,...)trimmed k-means with which a proportion alpha ofobservations may be trimmed (tclust )Hierarchical Clusteringa hierarchical decomposition of data in either bottom-up (agglomerative)or top-down (divisive)wayhclust()hierarchical cluster analysis on a set of dissimilaritiesbirch()the BIRCH algorithm that clusters very large data with a CF-tree (birch )pvclust()hierarchical clustering with p-values via multi-scale bootstrap re-sampling (pvclust )agnes()agglomerative hierarchical clustering (cluster )diana()divisive hierarchical clustering (cluster )mona()divisive hierarchical clustering of a dataset with binary variables only(cluster )rockCluster()cluster a data matrix using the Rock algorithm (cba )proximus()cluster the rows of a logical matrix using the Proximus algorithm(cba )isopam()Isopam clustering algorithm (isopam )flashClust()optimal hierarchical clustering (flashClust )fastcluster()fast hierarchical clustering (fastcluster )cutreeDynamic(),cutreeHybrid()detection of clusters in hierarchical clus-tering dendrograms (dynamicTreeCut )HierarchicalSparseCluster()hierarchical sparse clustering (sparcl )Model based ClusteringMclust()model-based clustering (mclust )HDDC()a model-based method for high dimensional data clustering (HDclassif )fixmahal()Mahalanobis Fixed Point Clustering (fpc )fixreg()Regression Fixed Point Clustering (fpc )mergenormals()clustering by merging Gaussian mixture components (fpc )Density based Clusteringgenerate clusters by connecting dense regionsdbscan(data,eps,MinPts,...)generate a density based clustering ofarbitrary shapes,with neighborhood radius set as eps and density thresh-old as MinPts (fpc )pdfCluster()clustering via kernel density estimation (pdfCluster )Other Clustering Techniquesmixer()random graph clustering (mixer )nncluster()fast clustering with restarted minimum spanning tree (nnclust )orclus()ORCLUS subspace clustering (orclus )Plotting Clustering Solutionsplotcluster()visualisation of a clustering or grouping in data (fpc )bannerplot()a horizontal barplot visualizing a hierarchical clustering (cluster )Cluster Validationsilhouette()compute or extract silhouette information (cluster )cluster.stats()compute several cluster validity statistics from a clusteringand a dissimilarity matrix (fpc )clValid()calculate validation measures for a given set of clustering algorithmsand number of clusters (clValid )clustIndex()calculate the values of several clustering indexes,which can beindependently used to determine the number of clusters existing in a data set (cclust )NbClust()provide 30indices for cluster validation and determiningthe numberof clusters (NbClust )Packagescluster cluster analysisfpc various methods for clustering and cluster validation mclust model-basedclustering and normal mixture modeling birch clustering very large datasets using the BIRCH algorithm pvclust hierarchical clustering with p-values apcluster Affinity Propagation Clusteringcclust Convex Clustering methods,including k-means algorithm,On-line Up-date algorithmand Neural Gas algorithm and calculation of indexes for finding the number of clusters in a data setcba Clustering for Business Analytics,including clustering techniques such as Proximus and Rockbclust Bayesian clustering using spike-and-slab hierarchical model,suitable for clustering high-dimensional databiclust algorithms to find bi-clusters in two-dimensional data clue cluster ensemblesclues clustering method based on local shrinking clValid validation of clustering resultsclv cluster validation techniques,contains popular internal and external cluster validation methods for outputs produced by package cluster bayesclust tests/searches for significant clusters in genetic dataclustsig significant cluster analysis,tests to see which (if any)clusters are statis-procedure for a data set generation clustering via mutual clusters Clusteringmultiple genomic data types (EMC)methods for clustering (EMM)for data stream clusteringboxplot.stats()$out list data points lying beyond the extremes of thewhiskerslofactor()calculate local outlier factors using the LOF algorithm (DMwRor dprep )lof()a parallel implementation of the LOF algorithm (Rlof )PackagesLOF algorithmin one-dimensional data based on robust methods identifying outliersts()create time-series objects plot.ts()plot time-series objectssmoothts()time series smoothing (ast )sfilter()remove seasonal fluctuation using moving average (ast )Decompositiondecomp()time series decomposition by square-root filter (timsac )decompose()classical seasonal decomposition by moving averages stl()seasonal decomposition of time series by loess tsr()time series decomposition (ast )ardec()time series autoregressive decomposition (ArDec )Forecastingarima()fit an ARIMA model to a univariate time series predict.Arima()forecast from models fitted by arimaauto.arima()fit best ARIMA model to univariate time series (forecast )forecast.stl(),forecast.ets(),forecast.Arima()forecast time series using stl ,ets and arima models (forecast )Packagesanalysing univariate time series forecasts utilities (DTW)and control program decompositionlinear,time-invariant,time series modelsCorpus()build a corpus,which is a collection of text documents (tm )tm map()transform text documents,e.g.,stemming,stopword removal (tm )tm filter()filtering out documents (tm )TermDocumentMatrix(),DocumentTermMatrix()construct aterm-document matrix or a document-term matrix (tm )Dictionary()construct a dictionary from a character vector or a term-document matrix (tm )findAssocs()find associations in a term-document matrix (tm )findFreqTerms()find frequent terms in a term-document matrix (tm )stemDocument()stem words in a text document (tm )stemCompletion()complete stemmed words (tm )termFreq()generate a term frequency vector from a text document (tm )stopwords(language)return stopwords in different languages (tm )removeNumbers(),removePunctuation(),removeWords()re-move numbers,punctuation marks,or a set of words from a text docu-ment (tm )removeSparseTerms()remove sparse terms from a term-document matrix (tm )textcat()n-gram based text categorization (textcat )SnowballStemmer()Snowball word stemmers (Snowball )LDA()fit a LDA (latent Dirichlet allocation)model (topicmodels )CTM()fit a CTM (correlated topics model)model (topicmodels )terms()extract the most likely terms for each topic (topicmodels )topics()extract the most likely topics for each document (topicmodels )wordcloud()plot a word cloud (wordcloud )comparison.cloud()plot a cloud comparing the frequencies of wordsacross documents (wordcloud )commonality.cloud()plot a cloud of words shared across documents(wordcloud )Packagesgraph(),graph.edgelist(),graph.adjacency(),graph.incidence()create graph objects respectively from edges,an edge list,an adjacency matrix and an incidence matrix (igraph )plot(),tkplot(),rglplot()static,interactive and 3D plotting ofgraphs (igraph )gplot(),gplot3d()plot graphs (sna )vcount(),ecount()number of vertices/edges (igraph )V(),E()vertex/edge sequence of igraph (igraph )is.directed()whether the graph is directed (igraph )are.connected()check whether two nodes are connected (igraph )degree(),betweenness(),closeness(),transitivity()various cen-trality scores (igraph ,sna )add.edges(),add.vertices(),delete.edges(),delete.vertices()add and delete edges and vertices (igraph )neighborhood()neighborhood of graph vertices (igraph ,sna )get.adjlist()adjacency lists for edges or vertices (igraph )nei(),adj(),from(),to()vertex/edge sequence indexing (igraph )cliques(),largest.cliques(),maximal.cliques(),clique.number()find cliques,plete subgraphs (igraph )clusters(),no.clusters()maximal connected components of a graph andthe number of them (igraph )munity(),munity()community detection(igraph )cohesive.blocks()calculate cohesive blocks (igraph )induced.subgraph()create a subgraph of a graph (igraph )%->%,%<-%,%--%edge sequence indexing (igraph )get.edgelist()return an edge list in a two-column matrix (igraph )read.graph(),write.graph()read and writ graphs from and to filesof various formats (igraph )Packagesigraph network analysis and visualization sna social network analysisstatnet a set of tools for the representation,visualization,analysis and simulation of network dataegonet ego-centric measures in social network analysis snort social network-analysis on relational tables network tools to create and modify network objectsbipartite visualising bipartite networks and calculating some (ecological)indices blockmodeling generalized and classical blockmodeling of valued networks diagram visualising simple graphs (networks),plotting flow diagramsNetClusterclustering for networksNetData network data for McFarland’s SNA R labsNetIndices estimating network indices,includingtrophic structure of foodwebsin RNetworkAnalysis statistical inference on populations of weighted or unweighted andlongitudinalnetworksgeocode()geocodes a location using Google Maps (ggmap )plotGoogleMaps()create a plot of spatial data on Google Maps (plot-GoogleMaps )qmap()quick map plot (ggmap )get map()queries the Google Maps,OpenStreetMap,or Stamen Maps serverfor a map at a certain location (ggmap )gvisGeoChart(),gvisGeoMap(),gvisIntensityMap(),gvisMap()Google geo charts and maps (googleVis )GetMap()download a static map from the Google server (RgoogleMaps )ColorMap()plot levels of a variable in a colour-coded map (RgoogleMaps )PlotOnStaticMap()overlay plot on background image of map tile(RgoogleMaps )TextOnStaticMap()plot text on map (RgoogleMaps )spatial data as HTML map mushup over Google Maps on Google map tiles in Rwith Google Maps and OpenStreetMapof spatial and spatio-temporal objects in Google Earth based Clustering Summaries for spatial point patterns weighting schemes,statistics and modelssummary()summarize datadescribe()concise statistical description of data (Hmisc )boxplot.stats()box plot statisticsAnalysis of Varianceaov()fit an analysis of variance modelanova()compute analysis of variance (or deviance)tables for one or more fittedmodel objectsStatistical Testt.test()student’s t-testprop.test()test of equal or given proportions binom.test()exact binomial testMixed Effects Modelslme()fit a linear mixed-effects model (nlme )nlme()fit a nonlinear mixed-effects model (nlme )Principal Components and Factor Analysisprincomp()principal components analysis prcomp()principal components analysisOther Functionsvar(),cov(),cor()variance,covariance,and correlation density()compute kernel density estimatesPackagesmixed effects modelsplot()generic function for plottingbarplot(),pie(),hist()bar chart,pie chart and histogram boxplot()box-and-whisker plotstripchart()one dimensional scatter plot dotchart()Cleveland dot plotqqnorm(),qqplot(),qqline()QQ (quantile-quantile)plot coplot()conditioning plotsplom()conditional scatter plot matrices (lattice )pairs()a matrix of scatterplotscpairs()enhanced scatterplot matrix (gclus )parcoord()parallel coordinate plot (MASS )cparcoord()enhanced parallel coordinate plot (gclus )parallelplot()parallel coordinates plot (lattice )densityplot()kernel density plot (lattice )contour(),filled.contour()contour plotlevelplot(),contourplot()level plots and contour plots (lattice )smoothScatter()scatterplots with smoothed densities color representation;capable of visualizing large datasetssunflowerplot()a sunflower scatter plot assocplot()association plot mosaicplot()mosaic plotmatplot()plot the columns of one matrix against the columns of another fourfoldplot()a fourfold display of a 2×2×k contingency table persp()perspective plots of surfaces over the x?y planecloud(),wireframe()3d scatter plots and surfaces (lattice )interaction.plot()two-way interaction plotiplot(),ihist(),ibar(),ipcp()interactive scatter plot,histogram,barplot,and parallel coordinates plot (iplots )pdf(),postscript(),win.metafile(),jpeg(),bmp(),png(),tiff()save graphs into files of various formatsgvisAnnotatedTimeLine(),gvisAreaChart(),gvisBarChart(),gvisBubbleChart(),gvisCandlestickChart(),gvisColumnChart(),gvisComboChart(),gvisGauge(),gvisGeoChart(),gvisGeoMap(),gvisIntensityMap(),gvisLineChart(),gvisMap(),gvisMerge(),gvisMotionChart(),gvisOrgChart(),gvisPieChart(),gvisScatterChart(),gvisSteppedAreaChart(),gvisTable(),gvisTreeMap()various interactive charts produced with the Google Visualisation API (googleVis )gvisMerge()merge two googleVis charts into one (googleVis )Packagesggplot2an implementation of the Grammar of GraphicsgoogleVis an interface between R and the Google Visualisation API to create interactive chartsrCharts interactive javascript visualizations from Rlattice a powerful high-level data visualization system,with an emphasis on mul-tivariate datatransform()transform a data framescale()scaling and centering of matrix-like objects t()matrix transpose aperm()array transpose sample()samplingtable(),tabulate(),xtabs()cross tabulation stack(),unstack()stacking vectorssplit(),unsplit()divide data into groups and reassemble reshape()reshape a data frame between “wide”and “long”format merge()merge two data frames;similar to database join operations aggregate()compute summary statistics of data subsets by()apply a function to a data frame split by factorsmelt(),cast()melt and then cast data into the reshaped or aggregatedform you want (reshape )complete.cases()find complete cases,i.e.,cases without missing values na.fail,na.omit,na.exclude,na.pass handle missing valuesPackagesreshape flexibly restructure and aggregate datadata.table extension of data.frame for fast indexing,ordered joins,assignment,data manipulationsave(),load()save and load R data objectsread.csv(),write.csv()import from and export to .CSV filesread.table(),write.table(),scan(),write()read andwrite dataread.fwf()read fixed width format fileswrite.matrix()write a matrix or data frame (MASS )readLines(),writeLines()read/write text lines from/to a connection,such as a text filesqlQuery()submit an SQL query to an ODBC database (RODBC )sqlFetch()read a table from an ODBC database (RODBC )sqlSave(),sqlUpdate()write or update a table in an ODBC database(RODBC )sqlColumns()enquire about the column structure of tables (RODBC )sqlTables()list tables on an ODBC connection (RODBC )odbcConnect(),odbcClose(),odbcCloseAll()open/close con-nections to ODBC databases (RODBC )dbSendQuery execute an SQL statement on a given database connection (DBI )dbConnect(),dbDisconnect()create/close a connection to a DBMS(DBI )PackagesRODBC ODBC database accessforeign read and write data in other formats,such as Minitab,S,SAS,SPSS,Stata,Systat,...DBI a database interface (DBI)between R and relational DBMS RMySQL interface to the MySQL databasethe JDBC interfacedriverdatabase files from data framesdownload.file()download a file from the InternetxmlParse(),htmlParse()parse an XMLor HTML file (XML)userTimeline(),homeTimeline(),mentions(),retweetsOfMe()retrieve various timelines within the Twitter uni-verse(twitteR )getUser(),lookupUsers()get information of Twitter users (twitteR )getFollowers(),getFollowerIDs(),getFriends(),getFriendIDs()get a list of followers/friends or their IDs of a Twitter user (twitteR )twListToDF()convert twitteR lists to data frames (twitteR )Packagesinterface for R documentsmapreduce()define and execute a MapReduce job (rmr2)keyval()create a key-value object (rmr2)from.dfs(),to.dfs()read/write R objects from/to file system (rmr2)Packageswith R via MapReduce on a Hadoop cluster Distributed File System (HDFS)NoSQL HBase databaseIntegrated Processing Environment via HIVE querycloud using Amazon’s Elastic Map Reduce (EMR)engine for using R scripts in Hadoop streaming via the MapReduce paradigm client interface for Ras.ffdf()coerce a dataframe to an ffdf (ff )read.table.ffdf(),read.csv.ffdf()read data from a flat file to an ffdfobject (ff )write.table.ffdf(),write.csv.ffdf()write an ffdf object to a flat file(ff )ffdfappend()append a dataframe or an ffdf to an existing ffdf (ff )big.matrix()create a standard big.matrix ,which is constrained to availableRAM (bigmemory )read.big.matrix()create a big.matrix by reading from an ASCII file (big-memory )write.big.matrix()write a big.matrix to a file (bigmemory )filebacked.big.matrix()create a file-backed big.matrix ,which may ex-ceed available RAM by using hard drive space (bigmemory )mwhich()expanded “which”-like functionality (bigmemory )Packagesff memory-efficient storage of large data on disk and fast access functions ffbase basic statistical functions for package fffilehash a simple key-value database for handling large data g.data create and maintain delayed-data packagesBufferedMatrix a matrix data storage object held in temporary files biglm regression for data too large to fit in memorybigmemory manage massive matrices with shared memory and memory-mapped filesbiganalytics extend the bigmemory package with various analyticsbigtabulate table-,tapply-,and split-like functionality for matrix and sfInit(),sfStop()initialize and stop the cluster (snowfall )sfLapply(),sfSapply(),sfApply()parallel versions oflapply(),sapply(),apply()(snowfall )foreach(...)%dopar%looping in parallel (foreach )registerDoSEQ(),registerDoSNOW(),registerDoMC()register respec-tively the sequential,SNOW and multicore parallel backend with the foreach package (foreach ,doSNOW ,doMC )Packagessnowfall usability wrapper around snow for easier development of parallel R programssnow simple parallel computing in Rmulticore parallel processing of R code on machines with multiple cores or CPUssnowFT extension of snow supporting fault tolerant and reproducible applica-(Message-Passing Interface)Virtual Machine)execution facilities for Rthe multicore package for the snow package for the Rmpi packagefor the multicore package backend for foreach Loops hosts,clusters or grids processesto Weka,and enables to use the following WekaAssociation rules:Apriori(),Tertius()Regression and classification:LinearRegression(),Logistic(),SMO()Lazy classifiers:IBk(),LBR()Meta classifiers:AdaBoostM1(),Bagging(),LogitBoost(),MultiBoostAB(),Stacking(),CostSensitiveClassifier()Rule classifiers:JRip(),M5Rules(),OneR(),PART()Regression and classification trees:J48(),LMT(),M5P(),DecisionStump()Clustering:Cobweb(),FarthestFirst(),SimpleKMeans(),XMeans(),DBScan()Filters:Normalize(),Discretize()Word stemmers:IteratedLovinsStemmer(),LovinsStemmer()Tokenizers:WordTokenizer().jcall()call a Java method (rJava ).jnew()create a new Java object (rJava ).jinit()initialize the Java Virtual Machine (JVM)(rJava ).jaddClassPath()adds directories or JAR files to the class path (rJava )Sweave()mixing text and R/S code for automatic report generationin R R sessions drawing analysis visualisation/svn-history/r76/Rpad_homepage/R-refcard.pdf or/doc/contrib/Short-refcard.pdfR Reference Card,by Jonathan Baron/doc/contrib/refcard.pdfR Functions for Regression Analysis,by Vito Ricci/doc/contrib/Ricci-refcard-regression. pdfRDataMining Group on LinkedIn(3000+members):RDataMining on Twitter(1200+followers):/rdataminingsuggest any relevant R pack-ages/functions,please feel free to email me<yanchang@>. Thanks.-Have added some functions for retrieving Twitter data.2August2013:-Recomended packages and functions are shown in bold.They are packages and functions that I use often and would like to recommand.1August2013:-Click a package in this PDFfile tofind it on CRAN.-A few packages for MapReduce and Hadoop have been added.。