雅思小作文经典例文
- 格式:doc
- 大小:411.12 KB
- 文档页数:18
雅思写作-小作文-饼图(精选五篇)第一篇:雅思写作-小作文-饼图雅思考试优秀作文范文:是否禁烟?Version 122 Some people claim that using tobacco has brought severe social problems and smoking should be banned.T o what extent do you agree with theabove statement?Introduction(56 words)Since the discovery of tobacco related to a number of health problems, an increasing number of people have called for prohibiting smoking.It is undeniable that still a considerable amount of smokers exist in this world.I would like to examine the advantages and disadvantages of smoking cigarettes as following and then offer my own opinion.Body1(95words) There are some advantages to taking tobacco.(topic sentence)First, tobacco industry contributes a great proportion of revenue to the nation.Extremely high taxation imposed on tobacco yielding and cigarette manufacturing has released the financial burden for both the government and the individual taxpayergeneration by generation.Second, the soothing effects of smoking has been confirmed by ordinary smokers;particularly those who have hard-brain-working jobs are in favor of it;they claim that smoking cigarettes can make them calm and stimulate brain cells to work more efficiently.Finally, cigarettes play an important role in social activities.Body2(106words)On the other hand, smoking demonstrates numerous negative effects.(topic sentence)Initially, nicotine may bring takers a number of diseases.Second-hand smoking also doesharm to your health.Moreover, hatred from non-smokers always grow against smokers hence some conflicts arise frequently.We then look at the statistics showing that thousands of fire accidents worldwide occur each year due to the litter of non-extinguished cigarette ends, not to mention the related deaths and st but not least, expenses have to be taken into consideration.Fine cigarettes are not cheap.If you get addicted to them, your daily amount of cigarette consumption will increase inevitably, emptying your pocket money.Conclusion(88words) After all, so far no direct evidence has been provided that smoking can definitely result in takers' death of lung cancer, and those fire accidents are the result of carelessness or irresponsibility of the smokers, not tobacco to be laid blames.Also, spending pocket money can never be considered as a financial burden.In addition, I suggest more restricted smoking areas be planned so as not to violate non-smokers' rights.After weighing the pros and cons of using tobacco, I, for one, am against the act to ban smoking.声明:本范文为赖老师专供无忧雅思作品,转载请注明作者和出处!范文仅供参考,切不可背诵,否则可能得非常低的分数,甚至0分。
雅思小作文范文
篇一:餐饮服务质量
近年来,餐饮业成为了国内一个新兴的行业,越来越多
的人参与其中,去享受美食的同时也越来越注重餐厅的服务质量。
绍兴市内的餐饮业也是一样,有的餐饮业表现优秀,吸引消费者的目光;有些则差强人意,让消费客户望而却步。
我本人有过亲身体验,一家名为“明记”酒楼的餐厅,
虽然环境卫生良好,但是在服务方面却有些怠慢。
具体表现为:一、服务员面对顾客时,态度冷漠,没有任何笑容;二、服务员的反应速度比较慢,顾客需要再次提醒才会来添饮料或清理残渣等;三、餐厅缺乏一些常见菜品,需要顾客等很久才能上餐。
相比之下,我也光顾过一家名为“彩虹湾”的餐厅,这
家餐厅在对待顾客时的服务就显得有些热情,不仅仅是会主动服务,而且还会做一些小动作,如避免顾客在等候过程中感到无聊,配有有声声响的TV等。
为提高餐饮业的服务质量,顾客在体验中有时会提出一
些意见和建议,餐厅也应该通过改进服务、添加特色,以及增加额外的关注和配套服务来建立信誉。
餐厅更应注重声誉和
服务,提升质量和价格的竞争力,以取得消费者信任。
同时,进行合适的宣传和营销活动,还可以积极创新款待方式、增加吸引力和乐趣。
才能让更多的消费者信任、选择并且留连不忘。
雅思写作小作文真题范文雅思写作小作文真题范文分享,今天就给大家带来了雅思写作小作文真题范文,希望能够帮助到大家,下面就和大家分享,来欣赏一下吧。
雅思写作小作文真题范文雅思写作小作文范文解析该线性题目描述了4个发达国家在过去200年间人均身高的变化。
很明显总体趋势都是上升,并且在第一个世纪除了持续波动,身高变化不大。
在之后一百年,都是显著上升趋势。
既然总体趋势相似,重点应放在国家之间的对比。
范文共计9句话。
雅思写作小作文范文The line chart illustrates how the average heights of people had varied in four developed countries over two centuries from 1775 to 1975. Generally, the heights underwent an overall upward trend across all the countries.Initially, Americans ranked the top, with an average height of approximately 168 cm which was immediately followed by British (166cm) while people from Denmark and France were slightly higher than 160 cm.Over the following seven and a half decades, in spite of some minor ups and downs, the average heights had almost remained unchanged in all the countries except France where people’s height kept rising in the latter half of the period. This exceeded that of the Danish in around 1850.After that, the trend in the USA and the UK showed great similarity though at a slightly different rate. They saw an ongoing rise until 1975, when the height equaled to approximately 180 cm. The Danish grew considerably and became the tallest at almost 190 cm, standing in remarkable contrast with French who were merely 173 cm.In short, while Americans and the British were equally high in the end, the gap between Danes and Frenchmen had widened.雅思大作文7分范文:城市化问题题目是:Some people think traffic and housing problems in large cities can be solved by moving companies and factories and their employees to the countryside. To what extent do you agree or disagree with this statement.雅思大作文审题本题的核心问题是:城市的交通和住房压力很大,于是政府鼓励企业搬迁到农村地区去,此举是好还是坏?我们的惯性思维当然是:此举甚好!因为企业一旦搬出城市,不仅空气好了,交通和住房压力都会大大地降低,同时还会带动农村当地的经济和发展。

ThelinegraphcomparesaverageyearlyspendingbyAmericansonmobileand landlinephoneservicesfrom2001to2010. Itisclearthatspendingonlandlinephonesfellsteadilyoverthe10-yearperiod, whilemobilephoneexpenditurerosequickly.Theyear2006marksthepointat whichexpenditureonmobileservicesovertookthatforresidentialphoneserv ices.In2001,USconsumersspentanaverageofnearly$700onresidentialphoneser vices,comparedtoonlyaround$200oncellphoneservices.Overthefollowing fiveyears,averageyearlyspendingonlandlinesdroppedbynearly$200.Byco ntrast,expenditureonmobilesrosebyapproximately$300.Intheyear2006,theaverageAmericanpaidoutthesameamountofmoneyonb othtypesofphoneservice,spendingjustover$500oneach.By2010,expendit ureonmobilephoneshadreachedaround$750,whilethefigureforspendingo nresidentialserviceshadfallentojustoverhalfthisamount.Thediagramillustratesthevariousstagesinthelifeofahoneybee.Wecanseeth atthecompletelifecyclelastsbetween34and36days.Itisalsonoticeablethatt herearefivemainstagesinthedevelopmentofthehoneybee,fromeggtomat ureadultinsect. Thelifecycleofthehoneybeebeginswhenthefemaleadultlaysanegg;thefemaletypicallylaysoneortwoeggsevery3days.Between9and10dayslater,each egghatchesandtheimmatureinsect,ornymph,appears. Duringthethirdstageofthelifecycle,thenymphgrowsinsizeandshedsitsskin threetimes.Thismoultingfirsttakesplace5daysaftertheegghatches,then7d ayslater,andagainanother9dayslater.Afteratotalof30to31daysfromthestar tofthecycle,theyoungadulthoneybeeemergesfromitsfinalmoultingstage,a ndinthespaceofonly4daysitreachesfullmaturity.(169words,band9)Thechartcomparesaveragefiguresfortemperatureandprecipitationoverth ecourseofacalendaryearinKolkata. ItisnoticeablethatmonthlyfiguresforprecipitationinKolkatavaryconsidera bly,whereasmonthlytemperaturesremainrelativelystable.Rainfallishighest fromJulytoAugust,whiletemperaturesarehighestinAprilandMay. BetweenthemonthsofJanuaryandMay,averagetemperaturesinKolkatarise fromtheirlowestpointataround20°Ctoapeakofjustover30°C.Averagerainfa llinthecityalsorisesoverthesameperiod,fromapproximately20mmofraininJ anuaryto100mminMay. Whiletemperaturesstayroughlythesameforthenextfourmonths,theamoun tofrainfallmorethandoublesbetweenMayandJune.Figuresforprecipitation remainabove250mmfromJunetoSeptember,peakingataround330mminJu ly.Thefinalthreemonthsoftheyearseeadramaticfallinprecipitation,toalowo fabout10mminDecember,andasteadydropintemperaturesbacktotheJanuaryaverage.(173words,band9)PostedbySimoninIELTSThebarchartscomparestudentsofdifferentagesintermsofwhytheyarestudy ingandwhethertheyaresupportedbyanemployer. Itisclearthattheproportionofstudentswhostudyforcareerpurposesisfarhig heramongtheyoungeragegroups,whiletheoldeststudentsaremorelikelyto studyforinterest.Employersupportismorecommonlygiventoyoungerstud ents.Around80%ofstudentsagedunder26studytofurthertheircareers,whereaso nly10%studypurelyoutofinterest.Thegapbetweenthesetwoproportionsna rrowsasstudentsgetolder,andthefiguresforthoseintheirfortiesarethesame ,atabout40%.Studentsagedover49overwhelminglystudyforinterest(70%)r atherthanforprofessionalreasons(lessthan20%).Justover60%ofstudentsagedunder26aresupportedbytheiremployers.Byc ontrast,the30-39agegroupisthemostself-sufficient,withonly30%beinggiv entimeoffandhelpwithfees.Thefiguresriseslightlyforstudentsintheirforties andforthoseaged50ormore.(178words,band9)Thebarchartcomparesthenumberofincidentsandinjuriesforevery100millionpassengermilestravelledonfivedifferenttypesofpublictransportin2002. Itisclearthatthemostincidentsandinjuriestookplaceondemand-responsev ehicles.Bycontrast,commuterrailservicesrecordedbyfarthelowestfigures. Atotalof225incidentsand173injuries,per100millionpassengermilestravell ed,tookplaceondemand-responsetransportservices.Thesefigureswerene arlythreetimesashighasthoseforthesecondhighestcategory,busservices.T herewere76incidentsand66peoplewereinjuredonbuses. Railservicesexperiencedfewerproblems.Thenumberofincidentsonlightrail trainsequalledthefigurerecordedforbuses,butthereweresignificantlyfewer injuries,atonly39.Heavyrailservicessawlowernumbersofsucheventsthanlig htrailservices,butcommuterrailpassengerswereevenlesslikelytoexperienc eproblems.Infact,only20incidentsand17injuriesoccurredoncommutertrai ns.(165words,band9)Thelinegraphcomparesthepercentageofpeopleaged65ormoreinthreecou ntriesoveraperiodof100years. Itisclearthattheproportionofelderlypeopleincreasesineachcountrybetwee n1940and2040.Japanisexpectedtoseethemostdramaticchangesinitselderl ypopulation.In1940,around9%ofAmericanswereaged65orover,comparedtoabout7%o fSwedishpeopleand5%ofJapanesepeople.TheproportionsofelderlypeopleintheUSAandSwedenrosegraduallyoverthenext50years,reachingjustund er15%in1990.Bycontrast,thefiguresforJapanremainedbelow5%untiltheea rly2000s.Lookingintothefuture,asuddenincreaseinthepercentageofelderlypeopleis predictedforJapan,withajumpofover15%injust10yearsfrom2030to2040.B y2040,itisthoughtthataround27%oftheJapanesepopulationwillbe65years oldormore,whilethefiguresforSwedenandtheUSAwillbeslightlylower,atab out25%and23%respectively.(178words,band9)Thetableshowspercentagesofconsumerexpenditureforthreecategoriesof productsandservicesinfivecountriesin2002. Itisclearthatthelargestproportionofconsumerspendingineachcountrywen tonfood,drinksandtobacco.Ontheotherhand,theleisure/educationcatego ryhasthelowestpercentagesinthetable.Outofthefivecountries,consumerspendingonfood,drinksandtobaccowasn oticeablyhigherinTurkey,at32.14%,andIreland,atnearly29%.Theproportio nofspendingonleisureandeducationwasalsohighestinTurkey,at4.35%,whil eexpenditureonclothingandfootwearwassignificantlyhigherinItaly,at9%,t haninanyoftheothercountries. ItcanbeseenthatSwedenhadthelowestpercentagesofnationalconsumerex penditureforfood/drinks/tobaccoandforclothing/footwear,atnearly16%andjustover5%respectively.Spainhadslightlyhigherfiguresforthesecategori es,butthelowestfigureforleisure/education,atonly1.98%.Thechartscomparetheamountofwaterusedforagriculture,industryandho mesaroundtheworld,andwateruseinBrazilandtheDemocraticRepublicofC ongo. Itisclearthatglobalwaterneedsrosesignificantlybetween1900and2000,and thatagricultureaccountedforthelargestproportionofwaterused.Wecanals oseethatwaterconsumptionwasconsiderablyhigherinBrazilthanintheCon go.In1900,around500km³ofwaterwasusedbytheagriculturesectorworldwide. Thefiguresforindustrialanddomesticwaterconsumptionstoodataroundon efifthofthatamount.By2000,globalwateruseforagriculturehadincreasedto around3000km³,industrialwaterusehadrisentojustunderhalfthatamount,a nddomesticconsumptionhadreachedapproximately500km³.Intheyear2000,thepopulationsofBrazilandtheCongowere176millionand5. 2mil lionrespectively.WaterconsumptionperpersoninBrazil,at359m³,wasm uchhigherthanthatintheCongo,atonly8m³,andthiscouldbeexplainedbyth efactthatBrazilhad265timesmoreirrigatedland.(184words,band9)Thebarchartcomparesthecostofanaveragehouseinfivemajorcitiesoverape riodof13yearsfrom1989. Wecanseethathousepricesfelloverallbetween1990and1995,butmostofthe citiessawrisingpricesbetween1996and2002.Londonexperiencedbyfarthe greatestchangesinhousepricesoverthe13-yearperiod.Overthe5yearsafter1989,thecostofaveragehomesinTokyoandLondondro ppedbyaround7%,whileNewYorkhousepriceswentdownby5%.Bycontrast, pricesrosebyapproximately2%inbothMadridandFrankfurt.Between1996and2002,Londonhousepricesjumpedtoaround12%aboveth e1989average.HomebuyersinNewYorkalsohadtopaysignificantlymore,wi thpricesrisingto5%abovethe1989average,buthomesinTokyoremainedch eaperthantheywerein1989.ThecostofanaveragehomeinMadridrosebyafur ther2%,whilepricesinFrankfurtremainedstable.(165words)Thetablegivesinformationaboutpovertyratesamongsixtypesofhouseholdi nAustraliaintheyear1999.Itisnoticeablethatlevelsofpovertywerehigherforsinglepeoplethanforcoup les,andpeoplewithchildrenweremorelikelytobepoorthanthosewithout.Po vertyrateswereconsiderablyloweramongelderlypeople.Overall,11%ofAustralians,or1,837,000people,werelivinginpovertyin1999.Agedpeopleweretheleastlikelytobepoor,withpovertylevelsof6%and4%for singleagedpeopleandagedcouplesrespectively. Justoveronefifthofsingleparentswerelivinginpoverty,whereasonly12%ofp arentslivingwithapartnerwereclassedaspoor.Thesamepatterncanbeseenf orpeoplewithnochildren:while19%ofsinglepeopleinthisgroupwerelivingb elowthepovertyline,thefigureforcoupleswasmuchlower,atonly7%. (150words,band9)Themapshowstwopotentiallocations(S1andS2)foranewsupermarketinato wncalledGarlsdon.ThemaindifferencebetweenthetwositesisthatS1isoutsidethetown,wherea sS2isinthetowncentre.Thesitescanalsobecomparedintermsofaccessbyroa dorrail,andtheirpositionsrelativetothreesmallertowns. Lookingattheinformationinmoredetail,S1isinthecountrysidetothenorthw estofGarlsdon,butitisclosetotheresidentialareaofthetown.S2isalsocloseto thehousingarea,whichsurroundsthetowncentre. TherearemainroadsfromHindon,BransdonandCransdontoGarlsdontownc entre,butthisisanotrafficzone,sotherewouldbenoaccesstoS2bycar.Bycontr ast,S1liesonthemainroadtoHindon,butitwouldbemoredifficulttoreachfro mBransdonandCransdon.BothsupermarketsitesareclosetotherailwaythatrunsthroughGarlsdonfromHindontoCransdon.ThebarchartcomparesconsumerspendingonsixdifferentitemsinGermany,I taly,FranceandBritain. ItisclearthatBritishpeoplespentsignificantlymoremoneythanpeopleintheo therthreecountriesonallsixgoods.Ofthesixitems,consumersspentthemost moneyonphotographicfilm.PeopleinBritainspentjustover£170,000onphotographicfilm,whichisthehig hestfigureshownonthechart.Bycontrast,Germanswerethelowestoverallsp enders,withroughlythesamefigures(justunder£150,000)foreachofthesixpr oducts. ThefiguresforspendingontoyswerethesameinbothFranceandItaly,atnearly £160,000.However,whileFrenchpeoplespentmorethanItaliansonphotogra phicfilmandCDs,Italianspaidoutmoreforpersonalstereos,tennisracquetsa ndperfumes.TheamountspentbyFrenchpeopleontennisracquets,around£145,000,isthelowestfigureshownonthechart.Thediagramsshowhowhousedesignsdifferaccordingtoclimate. Themostnoticeabledifferencebetweenhousesdesignedforcoolandwarmcl imatesisintheshapeoftheroof.Thedesignsalsodifferwithregardtothewindo wsandtheuseofinsulation. Wecanseethatthecoolclimatehousehasahigh-angledroof,whichallowssunlighttoenterthroughthewindow.Bycontrast,theroofofthewarmclimatehou sehasapeakinthemiddleandroofoverhangstoshadethewindows.Insulatio nandthermalbuildingmaterialsareusedincoolclimatestoreduceheatloss,w hereasinsulationandreflectivematerialsareusedtokeeptheheatoutinwarm climates.Finally,thecoolclimatehousehasonewindowwhichfacesthedirectionofthes un,whilethewarmclimatehousehaswindowsontwosideswhichareshadedfr omthesun.Byopeningthetwowindowsatnight,thehousedesignedforwarm climatescanbeventilated.(162words,band9)Thepictureillustratesthewayinwhichwaterpassesfromoceantoairtolanddu ringthenaturalprocessknownasthewatercycle. Threemainstagesareshownonthediagram.Oceanwaterevaporates,fallsasr ain,andeventuallyrunsbackintotheoceansagain. Beginningattheevaporationstage,wecanseethat80%ofwatervapourinthea ircomesfromtheoceans.Heatfromthesuncauseswatertoevaporate,andwat ervapourcondensestoformclouds.Atthesecondstage,labelled‘precipitati on’onthediagram,waterfallsasrainorsnow. Atthethirdstageinthecycle,rainwatermaytakevariouspaths.Someofitmayf allintolakesorreturntotheoceansvia‘surfacerunoff’.Otherwise,rainwate rmayfilterthroughtheground,reachingtheimperviouslayeroftheearth.Saltwaterintrusionisshowntotakeplacejustbeforegroundwaterpassesintotheo ceanstocompletethecycle.(156words,band9)Thefirstpictureshowsthelayoutofanartgallery,andthesecondshowssomep roposedchangestothegalleryspace. Itisclearthatsignificantchangeswillbemadeintermsoftheuseoffloorspacein thegallery.Therewillbeacompletelynewentranceandmorespaceforexhibiti ons.Atpresent,visitorsenterthegallerythroughdoorswhichleadintoalobby.How ever,theplanistomovetheentrancetotheParkinsonCourtsideofthebuilding ,andvisitorswillwalkstraightintotheexhibitionarea.Inplaceofthelobbyando fficeareas,whichareshownontheexistingplan,thenewgalleryplanshowsane ducationareaandasmallstoragearea. Thepermanentexhibitionspaceintheredevelopedgallerywillbeabouttwice aslargeasitisnowbecauseitwilloccupytheareathatisnowusedfortemporary exhibitions.Therewillalsobeanewroomforspecialexhibitions.Thisroomissh owninredontheexistingplanandisnotcurrentlypartofthegallery.(178words,band9)Thetableshowsdataabouttheundergroundrailnetworksinsixmajorcities.Thetablecomparesthesixnetworksintermsoftheirage,sizeandthenumbero fpeoplewhousethemeachyear.Itisclearthatthethreeoldestundergroundsy stemsarelargerandservesignificantlymorepassengersthanthenewersyste ms.TheLondonundergroundistheoldestsystem,havingopenedin1863.Itisalsot helargestsystem,with394kilometresofroute.Thesecondlargestsystem,inP aris,isonlyabouthalfthesizeoftheLondonunderground,with199kilometres ofroute.However,itservesmorepeopleperyear.Whileonlythirdintermsofsiz e,theTokyosystemiseasilythemostused,with1927millionpassengersperye ar.Ofthethreenewernetworks,theWashingtonDCundergroundisthemostexte nsive,with126kilometresofroute,comparedtoonly11kilometresand28kilo metresfortheKyotoandLosAngelessystems.TheLosAngelesnetworkisthen ewest,havingopenedin2001,whiletheKyotonetworkisthesmallestandserv esonly45millionpassengersperyear.(185words)CambridgeIELTSbook7,page101:Thepiechartscomparetheamountofelectricityproducedusingfivedifferent sourcesoffuelintwocountriesovertwoseparateyears. Totalelectricityproductionincreaseddramaticallyfrom1980to2000inbothA ustraliaandFrance.Whilethetotalsforbothcountriesweresimilar,therewere bigdifferencesinthefuelsourcesused.Coalwasusedtoproduce50ofthetotal100unitsofelectricityinAustraliain198 0,risingto130outof170unitsin2000.Bycontrast,nuclearpowerbecamethem ostimportantfuelsourceinFrancein2000,producingalmost75%ofthecountr y’selectricity. Australiadependedonhydropowerforjustunder25%ofitselectricityinbothy ears,buttheamountofelectricityproducedusingthistypeofpowerfellfrom5t oonly2unitsinFrance.Oil,ontheotherhand,remainedarelativelyimportantf uelsourceinFrance,butitsusedeclinedinAustralia.Bothcountriesreliedonna turalgasforelectricityproductionsignificantlymorein1980thanin2000. (170words)ThechartgivesinformationaboutUKimmigration,emigrationandnetmigrat ionbetween1999and2008. Bothimmigrationandemigrationratesroseovertheperiodshown,butthefig migrationpeakedin2004a nd2007.In1999,over450,000peoplecametoliveintheUK,whilethenumberofpeoplewhoemigratedstoodatjustunder300,000.Thefigurefornetmigrationwasar ound160,000,anditremainedatasimilarleveluntil2003.From1999to2004,th eimmigrationraterosebynearly150,000people,buttherewasamuchsmaller migrationpeakedatalmost250,000peoplein2004. After2004,therateofimmigrationremainedhigh,butthenumberofpeoplee migratingfluctuated.Emigrationfellsuddenlyin2007,beforepeakingatabou t420,000peoplein2008.Asaresult,thenetmigrationfigurerosetoaround240, 000in2007,butfellbacktoaround160,000in2008.Itisclearfromthechartsthatthefiguresfordevelopedcountriesaremuchhigh erthanthosefordevelopingnations.Also,thechartsshowanoverallincreasei nparticipationineducationandsciencefrom1980to1990. Peopleindevelopingnationsattendedschoolforanaverageofaround3years, withonlyaslightincreaseinyearsofschoolingfrom1980to1990.Ontheotherh and,thefigureforindustrialisedcountriesrosefromnearly9yearsofschooling in1980tonearly11yearsin1990.From1980to1990,thenumberofscientistsandtechniciansinindustrialisedc ountriesalmostdoubledtoabout70per1000people.Spendingonresearcha nddevelopmentalsosawrapidgrowthinthesecountries,reaching$350billio nin1990.Bycontrast,thenumberofscienceworkersindevelopingcountriesre mainedbelow20per1000people,andresearchspendingfellfromabout$50b illiontoonly$25billion.(187words) ThediagrambelowshowshowtheAustralianBureauofMeteorologycollects up-to-the-minuteinformationontheweatherinordertoproducereliablefor ecasts.ThefigureillustratestheprocessusedbytheAustralianBureauofMeteorolog ytoforecasttheweather.Therearefourstagesintheprocess,beginningwiththecollectionofinformati onabouttheweather.Thisinformationisthenanalysed,preparedforpresenta tion,andfinallybroadcasttothepublic. Lookingatthefirstandsecondstagesoftheprocess,therearethreewaysofcoll ectingweatherdataandthreewaysofanalysingit.Firstly,incominginformatio ncanbereceivedbysatelliteandpresentedforanalysisasasatellitephoto.Thes amedatacanalsobepassedtoaradarstationandpresentedonaradarscreeno rsynopticchart.Secondly,incominginformationmaybecollecteddirectlybyr adarandanalysedonaradarscreenorsynopticchart.Finally,driftingbuoysals oreceivedatawhichcanbeshownonasynopticchart. Atthethirdstageoftheprocess,theweatherbroadcastispreparedoncompute rs.Finally,itisdeliveredtothepublicontelevision,ontheradio,orasarecordedt elephoneannouncement.Thelinegraphcomparesthepercentageofpeopleinthreecountrieswhoused theInternetbetween1999and2009. ItisclearthattheproportionofthepopulationwhousedtheInternetincreasedineachcountryovertheperiodshown.Overall,amuchlargerpercentageofCan adiansandAmericanshadaccesstotheInternetincomparisonwithMexicans, andCanadaexperiencedthefastestgrowthinInternetusage.In1999,theproportionofpeopleusingtheInternetintheUSAwasabout20%.T hefiguresforCanadaandMexicowerelower,atabout10%and5%respectively .In2005,InternetusageinboththeUSAandCanadarosetoaround70%ofthep opulation,whilethefigureforMexicoreachedjustover25%.By2009,thepercentageofInternetuserswashighestinCanada.Almost100% ofCanadiansusedtheInternet,comparedtoabout80%ofAmericansandonly 40%ofMexicans.ThemapshowsthegrowthofavillagecalledChorleywoodbetween1868and1 994. Itisclearthatthevillagegrewasthetransportinfrastructurewasimproved.Fou rperiodsofdevelopmentareshownonthemap,andeachofthepopulatedare asisneartothemainroads,therailwayorthemotorway.From1868to1883,Chorleywoodcoveredasmallareanexttooneofthemainro ads.ChorleywoodParkandGolfCourseisnowlocatednexttothisoriginalvilla gearea.Thevillagegrewalongthemainroadtothesouthbetween1883and19 22,andin1909arailwaylinewasbuiltcrossingthisareafromwesttoeast.Chorleywoodstationisinthispartofthevillage. TheexpansionofChorleywoodcontinuedtotheeastandwestalongsidethera ilwaylineuntil1970.Atthattime,amotorwaywasbuilttotheeastofthevillage,a ndfrom1970to1994,furtherdevelopmentofthevillagetookplacearoundmo torwayintersectionswiththerailwayandoneofthemainroads.。
雅思写作小作文模板及范文雅思写作小作文模板及范文。
雅思写作小作文是雅思考试中的一个重要部分,它要求考生在有限的时间内写出一篇简短的文章,表达自己的观点和看法。
为了帮助考生更好地应对雅思写作小作文,下面将介绍一些常用的写作模板和范文,供考生参考。
模板一,提出观点。
首先,引出话题,简要介绍自己的观点;其次,列举2-3个支持自己观点的理由或例子;最后,总结观点,得出结论。
范文一,提出观点。
Nowadays, more and more people prefer to work from home rather than in an office. In my opinion, working from home has several advantages.Firstly, working from home can save commuting time and reduce stress. Many people spend hours commuting to and from work every day, which can be tiring and frustrating. By working from home, they can avoid the daily commute and have more time for themselves.Secondly, working from home can improve work-life balance. With the flexibility of working hours, people can better manage their time and allocate more time to their families and personal interests. This can lead to a happier and more fulfilling life.In conclusion, working from home has many benefits, including saving time, reducing stress, and improving work-life balance. Therefore, I believe that working from home is a preferable option for many people.模板二,对比观点。
Content1.Line graph ------------------------Exp1-3-----------------------P2-42.Bar chart---------------------------Exp4-5-----------------------P5-63.Table-------------------------------Exp6-8-----------------------P6-84.Pie chart---------------------------Exp9-11----------------------P9-105.Flow chart-------------------------Exp12------------------------P11-126.Map---------------------------------Exp13-----------------------P12-13the requirement of getting 6 score : correct + nativeExample 1The version of teacher Answer 1The graph shows the increase in the percentage of people aged 65 or more in Japan, Sweden and the USA.In 1940 the proportion of people over 65 years stood at only 5% in Japan, approximately 7% in Sweden and 9% in the US. However, while the figures for the Western countries grew to about 15% in around 1990, the figure for Japan dipped to only 2.5% for much of his period, before rising to almost 5% again at the present time.In spite of some fluctuation in the expected percentages, the proportion of older people will probably continue to increase in the next two decades in the three countries.A more dramatic rise is predicted between 2030 and 2040 in Japan, by which time it is thought that the proportion of elderly people will be similar in the three countries.Overall, it indicates that the percentage of elderly people in all three countries is expected to increase to almost 25% of the respective populations by the year 2040.Example 2NOTE①表将来:...%... Be (is/was) predicted to increase/decrease Be expected to ,,, Be planned to .. Be projected to ...②Introduction 改写题目Origin:The graph below shows the number (thousands) of people taking part in four kinds of sports in a particular region between 1985 and 2005 .Revise:①The line graph reflects how many people participated/joined in four types of sports in a specific area from 1985 to 2005.②The line graph illustrates how the number of people who joined in four types ......changed in a....during 1985, to2005.③line graph步骤第一段改写分两段主体段,主体段抓细节描写,不能主观臆断添油加醋,看到什么说什么按照从左到右,从上到下的顺序描写不要一条一条描写,必须先分类。
雅思ielt小作文折线图范文篇《雅思 ielt 小作文折线图范文篇》
嘿呀,大家好呀!今天咱来聊聊雅思 ielt 小作文里的折线图。
就说上次我去超市买东西,我特别留意了一下几种水果价格的变化。
我就把这当成一个小折线图来看待啦。
比如说苹果,那价格就像一条起起伏伏的线。
有段时间特别便宜,我就开心地买了好多,那段时间感觉自己像赚到了一样,哈哈。
然后过了一阵子,价格又蹭蹭往上涨,哎呀,我就只能少买点咯。
香蕉呢,也是这样,有时候价格低得让我偷笑,有时候又高得让我咋舌。
我就仔细观察着这些价格的变化,就像在研究雅思小作文里的折线图一样。
我发现啊,这价格的波动还真挺有意思的。
有时候会因为季节呀、供应呀各种原因而变化。
这不就跟我们雅思里的折线图似的嘛,有起有落,有高有低的。
哎呀,通过观察超市水果价格的这个小事情,我可真是对这折线图有了更深刻的认识呢。
以后再看到雅思小作文里的折线图,我肯定就更得心应手啦,就像我熟悉超市里那些水果价格的变化一样!哈哈,这就是我的小发现和小体验啦,你们觉得有意思不?
好了,就说到这啦,下次再和你们分享其他有趣的事儿哟!。
雅思c7t1小作文例文英文回答:The given prompt is about the IELTS Academic Writing Task 1 example essay for a band 7 candidate. The task requires writing a response to a given graph or chart in at least 150 words. In this case, I will provide an example response to a bar chart.The bar chart illustrates the percentage of people in three different age groups who use smartphones in a particular country. Overall, it can be observed that the younger the age group, the higher the percentage of smartphone users.According to the chart, among those aged 18-24, approximately 90% of them use smartphones. This percentage drops slightly for the 25-34 age group, with around 85% using smartphones. The lowest percentage of smartphone users is found in the 35-44 age group, with only about 70%using smartphones.中文回答:这个柱状图展示了一个特定国家三个不同年龄组的人使用智能手机的百分比。
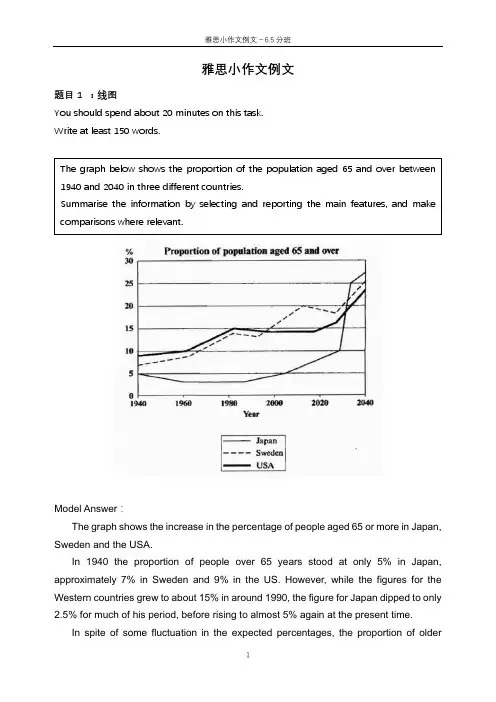
雅思小作文例文题目1 :线图You should spend about 20 minutes on this task.Write at least 150 words.Model Answer :The graph shows the increase in the percentage of people aged 65 or more in Japan, Sweden and the USA.In 1940 the proportion of people over 65 years stood at only 5% in Japan, approximately 7% in Sweden and 9% in the US. However, while the figures for the Western countries grew to about 15% in around 1990, the figure for Japan dipped to only2.5% for much of his period, before rising to almost 5% again at the present time.In spite of some fluctuation in the expected percentages, the proportion ofolder The graph below shows the proportion of the population aged 65 and over between 1940 and 2040 in three different countries.Summarise the information by selecting and reporting the main features, and make comparisons where relevant.people will probably continue to increase in the next two decades in the three countries.A more dramatic rise is predicted between 2030 and 2040 in Japan, by which time it is thought that the proportion of elderly people will besimilar in the three countries.Overall, it indicates that the percentage of elderly people in all three countries is expected to increase to almost 25% of the respective populations by the year 2040.题目2: 饼图The charts below give information about the ages of the populations of Yemen and Italy in 2000 and projections for 2050.Summarise the information by selecting and reporting the main features, and make comparisons where relevant.The pie charts below show the percentages of different age groups in Italy and Yemen in 2000 and its prediction for 2050. The age groups can be divided into 0-14 years, 15-59 years and 60+years.In 2000, the population aged under 14 accounted for the largest proportion of the overall population in Yemen, at 50.1%. This figure is expected to drop to 37% in 2050. Yemen is expected to see a slight increase in the proportion of people over 60 years from 3.6% to 5.7% in 2050, despite the fact that this age group will still represent the smallest section of the population. There will also be an increase in the percentage of the 15-59 age group from 46.3% to 57.3%.In contrast, most of the population in Italy was between 15-19 in 2000, at 61.6%. This figure is expected to drop to 46.2% in 2050. Those aged under 14 are projected to dip from 14.3% to 11.5%, representing the least proportion of the total population in both years. While the percentage of people aged over 60 will almost double to 42.3% in 2050.Overall, the projection is that the populations of both countries will become older. Italy had an older population than Yemen in the year 2000, and the same is predicted in 2050.题目3 柱状图The charts below give information about the ages of the populations of Yemen and Italy in 2000 and projections for 2050.Summarise the information by selecting and reporting the main features, and make comparisons where relevant.The bar charts given show the amount of marriages and divorces every ten yearsfrom 1970 to 2000 as well as the specific information about the percentages of different marital status in the U.S. in 1970 and 2000.The first chart gives statistic information on marriages and divorces each decade between 1970 and 2000. The number of marriages remained higher than that of divorces throughout this period. There were 2.5 million marriages in both 1970 and 1980, higher than the rest two years. The figure then continued to decrease to around 2.3 million in 1990 and 2 million in 2000. In contrast, there were 1 million divorces in 1970, representing the lowest point between 1970 and 2000. The number increased to almost 1.5 million in 1980 before it dropped all the way down to 1 million in 2000.The second chart compares the proportion of adult Americans in 4 different marital status: never married, married, widowed and divorced. In 1970, the most common marital status of adult Americans was married, which took up the largest proportion at 70%. In contrast, the percentage of people in the rest three marital status remained much lower. Despite a slight decrease occurred in the percentage of the widowed, both figures for the divorced and never married saw moderate increases of less than 10 percentage point.Overall, with years, the marriage rate of adult Americans decreased while the opposite trend was apparent in the divorce rate.题目4 表格1The table below shows the changes in the average distance measured in milestravelled by different modes of transport per person per year in 1985 and 2000 in England. Overall, the distance travelled in all modes of transportation significantly increased from 4740 miles in 1985 to 6475 miles in 2000. Car travelled the longest distance for everyone in both 1985 and 2000, increasing from 3199 miles to 4899 miles. Taxi, the least popular mode of transportation in 1985, only travelled for 13 miles and this figure slightly increased to 42 in 2000. The amount of the travelling distance of long distance bus doubled from 1985 (54 miles) to 2000 (124 miles). However, the figure for local bus in 2000 was almost half of the figure for 1985. The other ways of transport including bicycle, train and walking barely changed in these two years in terms of travelling distance.In summary, the modes of transport which allow the travelling for relatively long distance such as car, long distance bus and train remained popular in both these two years.The table below gives information about changes in modes of travel in England between 1985 and 2000.Average distance in milestravelled per person peryear, by mode of travel题目5 表格2The table below gives information about the underground railway system in six cities.Summarise the information by selecting and reporting the main features and make comparisons where relevant.The table presents statistic information about six countries’ underground systems regarding the time of opening, the length of route measured in kilometres and the yearly number of passengers measured in millions.London has the oldest underground railway system among the six cities, which was opened in 1863 while the railway system in Los Angeles is the newest, opened in the year 2001. For the rest four cities, that is, Paris, Tokyo, Washington DC and Kyoto, the opening dates were all in the 20th century.Next, in terms of the length of route measured in kilometres, the underground system in London is the longest at 394, almost double the size of the second largest one located in Paris, while the figure for Kyoto is the smallest at 11, followed by Los Angeles at 28.Lastly, when it comes to the yearly amount of passengers travelled by the underground system in these six cities, Tokyo has the largest number of passengers at 1927 million followed by Paris at 1191 million. On the contrary, the numbers for Kyoto and Los Angeles are the smallest at 45 million and 50 million respectively.Overall, the underground systems in different cities vary a lot regarding the opening date, the size and the number of passengers. Tokyo and Paris use it as the main mode of transport while in Kyoto and Los Angeles the metro system was less popular.雅思小作文例文-信息图表1.流程图The diagrams below show the life cycle of the silkworm and the stages in the production of silk cloth.Summarise the information by selecting and reporting the main features, and make comparisons where relevant.The flow chart illustrates the life cycle of the silkworm and the making process of silk cloth.In the first stage, a moth lays eggs and it takes 10 days for eggs to grow into larva which feeds on mulberry leaves. This stage lasts for 4-6 weeks until the larva produces silk thread. 3-8 days later, a number of cocoons are produced. 16 days later, the adult moths emerge from these cocoons, where a new cycle begins.The cocoons are the raw material used for the production of silk cloth. Once selected, they are boiled in water and the threads can be separated in the unwinding stage. Each thread is between 300 and 900 metres long, which means they can either be twisted together, dyed and then directly used to produce cloth in the weaving stage, or the threads can first go through the steps of twisting and weaving before the dyeing procedure.Overall, the diagrams show that the cocoon stage of the silkworm can be used to produce silk cloth through a very simple process.2.地图The two maps illustrate how the island has changed before and after the construction of some tourist equipment.Looking first at the map before construction, we can see a huge island with a beach in the west. The island was almost bare despite a few trees in the western and eastern area.Looking at the maps in more detail, we can see that small huts have been built to accommodate visitors to the island. The other physical structures that have been added are a reception building, in the middle of the island, and a restaurant to the north of the reception. As well as the buildings mentioned above, the new facilities on the island include a pier, where boats can dock. There has also been a vehicle track linking the pier with the reception and restaurant, and some footpaths connecting the huts. Finally, a swimming area has been designated for tourists on the western tip of the island.Overall, the island has become more tourism focused after the construction of some tourist facilities.。
雅思考试写作范文1there has long been controversy over the legality and apparent acceptance of tobacco in society .some hold that cigarettes and other tobacco containing products should be banned, that is, treated as agree with this point of view for the following reasons:although cigarettes do not offer as intense an effect as drugs like heroin and cocaine,they rank higher in the level of dependence it creates in the of smokers try to rid themselves of cigarettes but cannot,because of the physiological dependence they developed,chiefly imputable to its chemical explains why smokers continue their habit despite the numerous health warnings. furthermore,medical science has now proved beyond a doubt that smoking all the other causes of preventable deaths such as alcohol,illegal drugs,aids,suicide,road accidents,fire,and guns,cigarettes still account for more preventable deaths than all of those combined.more disturbingly,whilst the use of heroin is dangerous solely to the users,the use of tobacco endangers those who are in their vicinity as well. this phenomenon, known as passive smoking, nulls the counter-argument that putting one's own health at risk through smoking should be up to one's own individual have shown that the amount of second-hand smoke inhaled by a typical nonsmoker is equivalent to one cigarette smoked per day,and what is more,passive smoking can increase a nonsmoker's chance of getting cancer by ten to thirty two per cent.there are those who will say that the black market created by outlawing tobacco will produce deadlier cigarettes because the product standards of the bootleggers are not as should all bear in mind that legal cigarettes cause roughly four hundred thousand deaths a is hard to imagine the limited distribution provided by the criminal underworld could compete with this tragic figure.to sum up, the harm visited upon our society by tobacco usage is will be no solution other than to control tobacco much in the same way that the government now controls drugs which could allow people to remain attentive to the seriousness of the effects of these substances,and hopefully to prohibit their usage.雅思考试写作范文2Nowadays, the gap between the city and the countryside becomes more and more overt, which arouses colossal concerns. To understand t he solution, let’s take a closer look at the causes of the gap at first.The main reason of the gap is the unequal investment between city and rural area. China is a typical example. While more and more money is being invested to the coastal areas and big cities, such as Beijing and Shanghai, the lack of investment barriers greatly the society development of rural area and western regionsThe low education level partly sharps the gap. There is no doubt that the prime force of productivity is education. However, because of poverty, thousands of people go to work without graduating from primary school. The poorer, the few children go to school. This bad cycle finally leads to the dream of rich becoming a dream that is hard to realize.Moreover, the rural area is short of people with high quality. A survey proved that most of university students, whether they come from city or countryside, choose big cities instead of poor areas to work. The rural area can neither adept talent man nor attract talent man. No wonder the gap is increasing largely.Hence, The government ought to knock itself out to decrease the gap as soon as possible. First, balance the investment between city and rural area. In addition, the education level should be improved, especially pay attention on raising high quality people. Besides, let more people realize the latent capacity of rural area in order to attract talent and investment. The set up of CCTV channel12-western region channel is a good example.Only when the ways mentioned above are realized step by step, can the gap between the cities and the countryside be bridged.雅思考试写作范文3the birth of cars have made an enormous change to our the past,we travel from one place to another only by foot,nowaday,cars can do it .its goes withour saying that the invention of cars bring great benefit to all of as proverb goes:no garden without is not exception.owing a car has a lot of one thing,car provide us the most convient way of can get around freely without spenting a lot of always found driving is so another,its the comfortable to drive a always can stay warm and dry even in rainy whether,in addition,drivers are usually safe in their cars when they are out at night.Cars bring the human merits,their side-effects graudually come to the run a car need a lot of oil,which is getting less and increasing number of cars contribute the lacking of more and more cars are used,the traffic ecpecially in big cities is getting heaver and heavier,which lead to the serious social problem--traffic addition,the inceasing numbers of cars ,which excaust sent a huge quantities of carbon monoxide into make the air of cities unbreathabe,it strip people contact with frensh air.therefore,the new energy should be explored to replace the oil so that our envionmental pollution can be avioded .and the strick law should be issued to keep the numbers of cars under heavier traffic can be solluted!雅思考试写作范文4Private cars vs Public trafficAs traffic problems become more and more serious in many cities of developed and developing countries, their governments have to try hard and loads of money and energy have been spent to deal with them.Firstly, it is not efficient for the commuters to use their private cars to and back from their workplaces. Occasionally we can see they have to sit on the wheels wasting time and fuel in a heavy traffic jam. At the same time, through burning the fossil fuels, green house gas CO2, CO1, acid rain gas SO2, fumes and dusts are being released into the atmosphere, all of which heavily overload the environment. Thirdly, with the increase of private cars, the road trafficaccidents are also rise dramatically. For example, in a city with 5000 cars, there will be at least 250 accidents happening everyday, which also burden the public healthy services.On the contrary, expected public traffic may be an ideal solution to these problems. For example city buses and railways are widely used or being constructed by many cities. People can take buses easily, which can be found every 10 minutes or less in the peak time. Actually, Nottingham Transport Company is building its own light railway in the city, which is announced by the speak man of the company, “It will be completed in the next year, the tickets will be very competitive and at the same time the travel will be very safe and comfortable.”On the other hand, public traffic had its own disadvantages. Usually it cannot provide door-to-door service. It is inconvenient to go shopping by public vehicles. Sometimes you must wait a long time for the train. And quite a lot of people prefer to enjoy driving.In conclusion, developing the public traffic is a useful approach to deal with these difficulties. One possible way, if not the best, is to taxi private cars heavily and use these revenues to provide citizens cheaper public traffic services.雅思考试写作范文5Nowhere in the world has the issue of tobacco been so much debated as inour society. Nowadays, tobacco is more harmful than drug to people’shealth, therefore many people think that smoking is legal that is a direct andprimary reason to induce this kind of problem. The above point is certainlytrue; this essay will outline three reasons.The main reason is that tobacco is a silent killer to smokers. Tobacco isknown to be the probable cause of some 25 different diseases, and for some,such as lung cancer, bronchitis and emphysema, it is the main cause.According to a WHO report four million people die yearly from tobacco-related diseases, that is one death every eight seconds. Tobacco is significantlybecoming a greater cause of death and disability than any other single cause.Another reason is that more and more young people are under 18 years old who smoke cigarette have been blinded by the deceit of tobacconists. Tobacco among adolescents remains stubbornly persistent. Smoking among adolescents rose in the 1990s in several developed countries, such as China,Vietnam and Thailand . While new markets are being opened by the tobacco industry actions, old markets have not been closed. Tobacco is a global threat.Last but not the least reason is the increase in cigarette smuggling. Becauseof tobacco smuggling, the legal retailing and distribution systems are badlyaffected, and faced with increased lawlessness and heavy tax losses. This behavior severely affects the economy.In conclusion, the tobacco should be considered illegal. Perhaps a pack ofcigarettes is less harmful than another drug, but tobacco is actually thebiggest killer of all the drugs.雅思考试写作范文6travelling to a different culture can be an overwhelming,indeed,even an intimidating is very easy for misunderstandings to occur,and tourists are often deterred from places of cultural interest through fear of offending the indigenous would argue,it is up to the locals to accomodate visitors by speaking their language,serving their cuisine,and generally making them 'at home'.without doing this,local perple can be considered as unfriendly and viewed with suspicion by they are dissuaded from staying,which is ultimately detrimental to the local community,as the tourists take their spending-money with them.the counterview argues that acting naturally does not necessarily equate with being a local person wishes to live their life as his or her ancestors have done for centuries then visitors should show respect and allow them to do fact,many would argue that immersing one's self in a different culture is vital in order to truly appreciate is gained bytravelling,potentially,thousands of miles to experience the same language,food and culture that could have been found a few miles down the road from one's is a waste ofmoney,nothing is learned from the experience,and the memories saved will be less vivid. this is the point of view i it is vital for many countries' economies to welcome tourists,it does not have to imitate them so as to encourage their travellers have the right mind-set and show respect,all they need to do is to let the locals carry out their day-to-day lives to gain many insights into the this way,visitor and host can mutually benefit each other,through an increased income,and an enriching experience,respectively.雅思考试写作范文7Recent years, because traffic is convenient day-by-day, people have a more chance to travel around the world. The plane can make us reach any corner of the earth in a short time. Some people think visitors to others countries should imitated local custom and behaviors. Some people disagree; they think the host country should welcome culture different.As the a famous saying goes: Do as they do at Rome. The knowledge of local custom can help outside person adapt to the new environment rapidly. Moreover, each place has the own unique culture, may keep in touch more ideology and culture through the local folkways and customs. For instance, a Chinese people came to Britain, he can imitate British life style. Inthis way, He can understand British habit more thoroughly, thus, make himself live a more comfortable life in Britain.On the other hand, the outside thought has a lot of positive influence on local culture too. For example, the outside thought could bring the new theory and inject vigor into local culture. The exchanges of outside thought and traditional culture can help people to find out about the culture of other areas and countries.Making a general survey of human history, it is a positive trend that the nationality has been merging all the time. So, we should not only propagate local culture for the outside people but also study outside culture and custom. In this way, the earth would become a family, all the people would get along harmoniously.雅思考试写作范文8nowaday,the culture shock exists between the tourists and host people consider should try to model themselves on the local culture and totally agree with the above point.firstlly,by abserving and understanding of local culture,the tourists can reduce the chance of offending the locals and misunderstanding consiously and manchu area of china,people think the dog is their you come there,you must always show respects and love to dog,otherwise it will lead to the embarrassment and conflict.secondly,understanding and following the activites of local people can show our respects to doing things with their way,we will be easy to establish the good relationship with local residents often feel friendly when their culture are imitated and are unconsiously bring us into the members of them.in addition,imitating can let us gain insigts into other not only can know whats people's life is like in other counties,we also can be enlarged our knowledge and broaded our horizon,which will be cherish wealth in our life.to sum should adjust themselves adapt to the local habits and customs,which will make them fully enjoy their travel and live in harmony!雅思考试写作范文9Along with the mass use of computer technology in education circles, we are delighted to witness the uncountable conveniences be brought by computer. Some people even argue that teacher will not be important in classroom any more. Is this reasonable? Personal speaking, I oppose holding such a ridiculous conclusion.In the first place, the feature of teaching defines teachers as an essential part in education. It is well known that teaching is a process of mutual-communication: firstly, teachersimpart/initiate knowledge or ideas to students, then students should promptly transfer their feedback to teachers, moreover, teachers will give students the final interpretation according to their specific requirement. Besides, teachers also can (teach students in accordance of their aptitude). In contrast, what computers can do is merely to display materials which havealready stored in their EMS memory or mechanically execute operator’s commands. We actually can not image what our education will being if computers substitute teachers totally. As to another reason, it seems that teacher’s role as a supervis or is more and more overt. Computer is indeed a controversy, it not only can be an efficient education assistant, but also can become an addiction which includes too much violent and (pornographic propaganda). Youngsters do not mature fully in psychology, therefore, without teachers' supervision, many children would spend hours playing computer games or surfing unhealthy websites, which are regarded as a waste of valuable time and intelligence, instead of trying to have a good command of knowledge and skills.We never deny that computers are absolutely an available education implements, furthermore, the combination of teacher and computer technology will greatly improve our education quality. However, from all of the grounds of argument mentioned above, we can safely draw a conclusion that teacher will not be replaced by computer in the classroom. 雅思考试写作范文10Which element between nature and nurture plays the major role in children’s personality and development is always a controversial problem. Of course, which you prefer depends on your own experience, life style and emotional concern. Here, I would like to illustrate my point of view about it.Admittedly, different nature determines people have distinguished starting points in their lifetime. To beginning, i n light of medical research, a person’s blood type has considerable influence to his character. General speaking, for example, a person whose blood type is A means that his personality is amiable and tender probably. Besides, the physical condition, even a ppearance may influence a person’s development. Statistics shows that beautiful people are more confident than others, because they do not need to worry about the prejudice from public. Obviously, some parts of our personality have been decided when we born.On the other hand, although nature is important during the course of shaping personality, we cannot ignore another essential element, nurture. There are many factors which affect the development of children, both parental support and education being vital influence. It is reported that the kid whose parents are divorced is more likely has psychological troubles than those with a harmonious family. By contrast, as we all know, good education will positively cultivate a person’s personality and improve his self-restraint in a big way.In summary, from what has been discussed above, we may safely arrive at the conclusion that partly because of different nature, partly because of different nurture, people have their unique personality.雅思考试写作范文11The computer is widely used in education and some people think teachers are not playing an important role in the classroom. To what extend do you agree or disagree?With more and more extensive use of computers in education, some people claim that the importance attached to teachers has been jeopardized. Therefore, computers will replaceteachers in the classroom. However, it seems quite clear to me that learning from teachers is the most important way that cannot be substituted for students.Naturally, some people maintain that computer should instead of the old way of education. They hold that the strong function of the computer offers a new mode of education, which is more interesting, more vivid and more acceptable by children. The students will not face to the serious teachers and calm classes any more, which are replaced by a brand-new world offered by the Internet. In addition, this can decrease the investment on the foundational education and save the human resources and material resources.As an assistant, computers do help teachers with their work, but they can never replace the important role of a real teacher. The main functions of any computer are storage and calculation. It cannot think on its own anyway. All the teaching data stored in computers are the essence of teaching experience generalized by many teachers during their work. Hence, to assist education, what a computer can do is just to repeat the contents summarized by real teachers.In addition, each student has different talents and different defects, and accordingly, they may come across various problems during their study. Computer programmer designing the software, however, cannot predict these problems. Therefore, a single computer can never solve these problems without a teacher’s guidanceFurthermore, if the significance of teacher has been weakened, the number of teachers may be decreased, that is to say, many teachers may be laid-off. If such a case comes to reality, series of social problems will break out, such as the drop of working opportunity which will surely make the burden of whole society become heavier and heavier.In conclusion, although computer-aided-education has spread widely, teachers still play s crucial part in the classroom, which cannot and will not be replaced by computer.雅思考试写作范文12In this IT age, computers are widely used in the classroom in order to enrich the methods of teaching. This phenomenon gives some the illusion that the thing teaching students is no longer the teacher but a computer. Personally, I disagree with this opinion.As another machines, computer doesn’t enable to control itself. Though computers are capable of learning from their mistakes and improving on their performance, they need details instructions from human being in order to be able to operate. They can never, as it were lead independent lives, no mention teaching students. In case a computer lacks the control of a teacher, there is no difference between a computer and waste.Not only this, but computers, unlike a teacher, can’t solve a variety of new problems. Everything is developing in today’s society, including education. For example, a student suddenly asks a creative question that the computer isn’t programmed for, it can do nothing, while teacher can explain clearly though abundant teaching experience.Last but not least, the computer can’t communicate with students from emotion. Such as an eyesight or gesture of teacher can transfer his or her idea and feeling to students. In this way,students can feel more human touch in the class. In comparison, the computer is too dry and dusty to understand.All in all, no matter how nice a computer is, it can’t take the place of teacher. Of course, I don’t mean that computer is useless. In contrary, I believe it will become the most powerful assistants to teacher in further.雅思考试写作范文13Computer, the most exciting and significant invention in 20 century, will reshape our lives and our world. As a result, some people proclaim that computers should be involved into our classroom, and replace the roles of human teachers. However, I cannot agree with their point of view.Admittedly, as the useful tools, computers can become the optimum assistants for human teachers in the classroom. To beginning, vivid pictures shown on screen can motivate students’ interest and curiosity dramatically. Moreover, the combination of computers and Internet can provide children the abundant information. Although computers enjoy considerable merits, they cannot compare with human teachers for two main reasons. Among countless factors which influence my inclination, there is a most conspicuous one: computers are not as qualified as human teachers in academic fields. As we all know, students can get the final result of a mathematic question under the help of computers, however, they are still confused on the whole computing process. By contrast, our human teachers’ performance is much better in those cases. They not only can teach students how to analyze and compute the question, but also can remind them what are the possible errors that they may meet. Thus, human teachers are more adequate than computers in academic aspect. The second advantage of human teachers is they can guide students to deal with some psychological problems that they meet in schools. In China, sometimes, teachers even burden many responsibilities that students’ parents have. For example, as for the student with rebellious spirit, the important duty for teachers is to prevent the student from campus violence, even crime. Obviously, computers cannot do that.In summary, from what has been discussed above, we may safely arrive at the conclusion that the positions of human teachers are unshakable, and computers cannot take the places of them.。

雅思小作文真题雅思小作文是雅思考试中的一大难点,它要求考生在有限的时间内完成一篇短文,内容要点明确,语言表达准确,结构合理,逻辑清晰。
以下是一些雅思小作文真题及范文,供考生参考。
1. 图表描述类。
题目,The chart below shows the number of hours per week that children of different age groups spend on selected activities. Write a report for a university lecturer describing the information shown.范文,The chart gives information about the amount of time children of different age groups spend on various activities in a typical week. It is clear that the amount of time spent on activities varies greatly with age.Overall, younger children spend more time on activities such as watching TV and playing computer games, while older children spend more time on homework and reading.2. 流程图描述类。
题目,The diagrams below show the life cycle of the silkworm and the stages in the production of silk cloth. Summarize the information by selecting and reporting the main features, and make comparisons where relevant.范文,The diagrams illustrate the life cycle of the silkworm and the process of producing silk cloth. It is clear that the production of silk cloth involves a number of stages, from the laying of the silkworm eggs to the weaving of the silk threads into cloth.Overall, the production of silk cloth begins with the laying of silkworm eggs, which hatch into silkworm larvae. These larvae then spin cocoons, from which the silk threads are extracted. These threads are then dyed and woven into cloth.3. 表格描述类。
【导语】为了让⼤家更好的准备雅思考试,整理了“雅思写作⼩作⽂范⽂:篇1”供考⽣参考,请关注! Nowhere in the world has the issue of children’s education been so muchdebated as in our society. Nowadays, many parents let their children attend allkinds of courses that will help children to get a better future; therefore, somepeople think that the postnatal nurture is more important than the congenitalfactors for personal growth and progress. The above point is certainly true;this essay will outline three reasons. The main reason is that success of a child would not be separated fromright teaching and personal effort. Currently, lots of famous scientists andpoliticians gain huge success in the world, as they are long-term to hard work.Moreover, the main reason why plenty of developing countries drop behind istheir poor education. Another reason is that if people do not work hard but only depend on theirhigh intellect, they will be far from successful. For instance, the littleBronte was quite clever during his childhood; he was particularly adept atwriting. But he was so satisfied with his superior intellect that he did not studycarefully. Finally, he became an idle person. However, his sisters became famousauthors as a result of their hard study. They are Charlotte Bronte and EmilyBronte. Charlotte wrote “Jane Eyre “, “Wuthering Heights” was written byEmily. Last but not the least reason is the advantages of natural factors that aremore and more similar.Plenty of advanced technological products are invented andwidely used.They can supply people’s gaps.In the past, the difference ofmathematical ability was remarkable. With the invention of the calculator,people can hardly find out the difference. In conclusion, scientific and proper teaching is the most significantfactor for personal growth and development. If people are satisfied with theiradvantages, they will become the biggest failures.。
小站雅思写作范文精选为了让大家高效备考雅思,提高写作成绩,下面小编为大家整理了几篇小站雅思的写作范文,希望对大家有所帮助。
小站雅思书信写作范文之写给经理的请辞信You have decided to leave your current job even though you enjoy it. Write a letter to inform your manager of your decision. In your letter tell the manager about your decision and the reason for itdescribe what you learnt in your current job and ask the manager to write a reference letter to help you with future employment.即使你喜欢现在的工作,你还是决定离开。
写信告诉你的经理你的决定。
在你的信中告诉经理你的决定和原因描述你在目前的工作中学到了什么,让经理写一封推荐信来帮助你未来的工作。
范文Dear Mr Smith,I am writing to inform you Of my decision to leave Smith Industries when my Current contract comes to an end next month.I have thoroughly enjoyed my three years here. However, I feel that now is the time for me to broaden my horizons and gain experience Of different working environments and practices Within our industry. Iwould also like the chance to travel more as part Of my job.Over the course of my three years at Smith Industries, I have learnt an incredible amount. Not only am I now proficient with the key software programs that are used across the industry, but I have also learntvaluable interpersonal skills, such as how to organise a team or delegate tasks.I would be extremely grateful if you could provide me with a letter of reference for future employers.Thank you for all Of your help and support.Yours sincerely,Paul Jones范文译文亲爱的史密斯先生,我写这封信是想告诉您,我决定在下个月现有合同期满时离开史密斯工业公司。
雅思经典小作文范文1. The charts below show the percentage of their food budget the average family spent on restaurant meals in different years. The graph shows the number of meals eaten in fast food restaurants and sit-down restaurants. You should write at least 150 words. Give reasons for your answer and include any relevant examples from your own knowledge or experience.Over the past 30 years, the average family has dramatically increased the number of meals that they eat at restaurants. The percentage of the family's food budget spent on restaurant meals steadily climbed. Just 10 percent of the food budget was spent on restaurant meals in 1970, and 15 percent in 1980. That percentage more than doubled in 1990, to 35 percent, and rose again in 2000 to 50 percent. Where families eat their restaurant meals also changed during that 30-year period. In 1970, families ate the same number of meals at fast food and sit-down restaurants. In 1980, fam?ilies ate slightly more frequently at sit-down restaurants. However, since 1990, fast food restaurants serve more meals to the families than do the sit-down restaurants. Most of the restaurant meals from 2000 were eaten at fast food restaurants. If this pattern continues, eventually the number of meals that families eat at fast food restaurants could double the number of meals they eat at sit-down restaurants. (164 words)2. You should spend about 20 minutes on this task. The map below is of the town of Garlsdon. A new supermarket (S) is planned for the town. The map shows two possible sites for the supermarket. Summarise the information by selecting andreporting the main features, and make comparisons where relevant. You should write at least 150 wordsmodel answer: The first potential location (S1) is outside the town itself, and is sited just off the main road to the town of Hindon, lying 12 kms to the north-west. This site is in the countryside and so would be able to accommodate a lot of car parking. This would make it accessable to shoppers from both Hindon and Garlsdon who could travel by car. As it is also close to the railway line linking the who towns to Cransdon (25 km to the south-east), a potentially large number of shoppers would also be able to travel by train. In contrast, the suggested location, S2, is right in the town centre, which would begood for local residents. Theorically the store could be accessed by road or rail from the surrounding towns, including Bransdon, but as the central area is a notraffic zone, cars would be unable to park and access would be difficult. Overall, neither site is appropriate for all the towns, but for customers in Cransdon, Hindon and Garlsdon, the out-of-town site (S1) would probably offer more advantages. (179 words)3. You should spend about 20 minutes on this task. The table below shows CO2 emissions for different forms of transport in the European Union. The Pie Chart shows the percentage of European Union funds being spent on different forms of transport. You should write at least 150 words.model answer: The chart shows CO2 emissions per passenger kilometre for variuos methods of transport in the European Union while the pie chart shows European Unionspending on transport. Flying by air produces by far the greatest CO2 emissions, approximately three times as much as passenger cars which are the next largest producers. Very little is spent by the EU on air travel while roads make up more than half of the EU transport budget. Trains produce about three times less CO2 emissions per passenger kilometre than passenger cars and eight times less than air travel. Nearly a third of EU transport funds are spent on railways. Ships are a clean form of transport and produce about the same amount of CO2 per passenger kilometre as trains do. However, only 2 percent of EU funds are spent on ports. A further one percent is spent on inland waterways. Coaches are the cleanest form of transport. Emissions of CO2 per passenger kilometre from coaches are half those of buses. Buses emit less than half as much CO2 per passenger kilometre as cars. The European Union spends 10 percent of its transport budget on public transport, such as buses and coaches. (197 words)4. You should spend about 20 minutes on this task. The table below shows the sales at a small restaurant in a downtown business district. Summarize the information by selecting and reporting the main features, and make comparisons where relevant. You should write at least 150 words. Give reasons for your answer and include any relevant examples from your own knowledge or experience.Sales: week of October 7-13 Mon. Lunch Dinner $2,400 $3,623 Tues. $2,450 $3,850 Wed. $2,595 $3,445 Thurs. $2,375 $3,800 Fri. $2,500 $4,350 Sat. $1,950 $2,900 Sun. $1,550 $2,450 model answer:The sales at this small restaurant during the week of October 7 to 13th followed a fairly set pattern from Monday to Friday, andthen showed notable shift on the weekend. The lunch and dinner sales during the week peaked on Friday and then dipper down as the weekend set in. During the week of October 7-14th, the lunch sales averaged at approximately $2,400. The highest lunch sales occurred on Friday, and the lowest occurred on Sunday. Sunday's lunch sales were approximately $1,000 less than the average lunch sales during the rest of the week. Dinner sales, which generated at least $1,000 to $1,500 more a day than lunch sales, also remained steady during the week. Just like the lunch sales, the dinner sales peak on Friday and dipped down for the weekend. Excluding Wednesday and Thursday, the lunch and dinner sales from October 711 rose gradually until the end of the business week. Midweek, on Wednesday and Thursday, the sales were slightly lower than they were on Tuesday. According to the sales report, this restaurant has a steady lunch and dinner crowd. The most profitable day during the second week of October was Friday. Sunday, was the least prof?itable day, with the full day's sales totaling/totalling less than the Friday dinner sales. These numbers are reflective of a restaurant that is located in a business/financial district where business hours are Monday through Friday.# 40. You should spend about 20 minutes on this task. In June 1996, an experimental flu vaccine was trialled in a large country town on females only. Summarise the information by selecting and reporting the main features, and make comparisons where relevant. You should write at least 150 words. Give reasons for your answer and include any relevant examples from your own knowledge or experience.model answer: The diagrams show data for a flu epidemic which hit a large country town in 1996. Figure 1 gives the number of persons who died; Figure 2 shows the percentage breakdown of females who received a new flu vaccine; and Figure 3 gives the number of cases of flu before and during the epidemic. In Figure 1 it can be seen that the flu was responsible for the deaths of 2 females but no males in the period from March to May. However, from June to August, there were 4 female deaths and 1 male death. According to the pie chart in Figure 2, only those females most at risk were given the new flu vaccine; 28% did not take part in the trial. Of those females who took part, 35% were aged (over 65 years old); 24% were babies or children; and 13% were either hospitalised or receiving other medical attention. From Figure 3 it is clear that the new vaccine had a positive effect on the number of new cases of flu reported in females. There were just over 1000 cases reported in March, climbing rapidly to a peak of 3500 in June. Thereafter, the number of cases dropped slowly to about 2800 in August, before levelling off at 2500 for the rest of the year. For males, the figures were lower but showed a similar trend throughout the epidemic. (232 words)# 38. You should spend about 20 minutes on this task. The chart shows the number of mobile phones and landlines per 100 people in selected countries. Write a report for a university lecturer describing the information given. You should write at least 150 words.model answer: The graph shows the number of mobile phones and landlines per 100 users, for selected countries. Overall, most of the countries included in the graph have more mobile phones subscribers than landlines. Most Europeancountries have high mobile phone use. The biggest users of mobile phones are the Italians, with 88 cell phones per 100 people. For example, Italy has twice as many mobile phones as landlines, with 88 mobiles per hundred people compared to 45 for landlines. Mobile phone use is low in Canada, with fewer than 40 phones per 100 people. Denmark is also unusual because it has slightly more landlines than mobile phones. However, in some countries, the number of landlines is higher than the number of mobile phones. One example is the USA, where the number of mobiles, at 50 per 100 people, is much lower than the number of landlines, at almost 70 per hundred. A similar pattern can be seen in Canada. The highest number of landlines in the graph is in Denmark, with about 90 per 100 people. In contrast, the lowest figures for fixed lines are in Italy and the UK. In conclusion, it seems that mobile phone use is higher in Europe than in North America.#39. You should spend about 20 minutes on this task. The chart below shows estimated world literacy rates by region and by gender for the year 2000. Write a report for a university lecturer describing the information below. You should write at least 150 words.modelanswer:In this report I will describe a bar chart that shows the estimated world illiteracy rates by gender and region for the year 2000. First I will look at male illiteracy for the 6 areas shown. The lowest rates were in Developed Countries, Latin America/Caribbean and East Asia/Oceania with rates of 1% (approximately), 10% and 8% (approximately) respectively. Therates for the next three areas were much higher and quite similar to each other. Sub-Saharan Africa, the Arab States and South Asia had rates of approximately 31%, 29% and 34%. Female illiteracy was much higher relatively in each area except Latin America/Caribbean where it was only slightly higher. The lowest rates for female illiteracy were again Developed Countries, Latin America/Caribbean and East Asia/Oceania with rates of approximately 2%, 12% and 20%. Again the rates for the next three areas were much higher and quite similar to each other. SubSaharan Africa, the Arab States and South Asia had rates of approximately 48%, 52% and 56%.This ends my report.# 37. You should spend about 20 minutes on this task. The graphs show enrolment in different colleges in the Higher Colleges of Technology in 1999. Write a total of 150 - 200 words about the information in the three graphs. Write a report for a university lecturer describing the information given. You should write at least 150 wordsmodel answer:The charts shows student enrolment by gender and level in different colleges of the Higher Colleges of Technology colleges in the UAE. There are clear differences in male and female enrolment. Females outnumber men in all the colleges, with almost 25% more students in Dubai Women's college than in Dubai Men's. Ras Al-Khaimah Women's College has almost 180 students, compared to only 100 in the Men's college. Females also outnumber males by level, with almost double the number of men at Higher Diploma level (330 compared to 181). Only at Diploma level does the number of men slightly exceed that ofwomen. Over half the students are in Certificate level, with less than a quarter at Higher Diploma or Bachelor level. In conclusion, most students in the Higher Colleges are enrolled at Diploma level or below, and the majority of students are women. (143 words)# 36. You should spend about 20 minutes on this task. The line graph below shows the number of annual visits to Australia by overseas residents. The table below gives information on the country of origin where the visitors came from. Write a report for a university lecturer describing the information given. You should write at least 150 words.NUMBER OF VISITORS (million) 1975 SOUTH KOREA JAPAN CHINA USA BRITAIN EUROPE Total 2.9 3.2 0.3 0.4 0.9 1.1 8.8 2005 9.1 12.0 0.8 1.1 2.9 4.5 30.4model answer: The given line graph illustrates information on the number of overseas visitors traveling to Australia in millions of people. Overall, one notable trend seems to be that Australia has steadily become more popular as a destination spot. For example, there were 20 million more visitors to Australia in 2005 than in 1975. That's a jump from 10 million to 30 million in 20 years. The second table gives statistics showing the countries whose residents went to Australia between 1975 and 2005. In both years, the largest number of visitors came from Japan, followed by South Korea and Europe. Britain, the United States and China also had many people traveling to Australia in these years. In fact, the number of people visiting Australia grew in every one of these countries. For example, in 2005, 12 million people went there from Japan compared with only 3.2 million in1975. (147 words)#35. You should spend about 20 minutes on this task. The table below shows the consumer durables (telephone, refrigerator, etc.) owned in Britain from 1972 to 1983. Write a report for a university lecturer describing the information shown below. You should write at least 150 words.Consumer durables Percentage of households with: central heating television video vacuum cleaner refrigerator washing machine dishwasher telephone 1972 1974 1976 1978 1979 1981 1982 198339 93 87 73 66 4243 95 89 81 68 5048 96 92 88 71 5452 96 92 91 75 3 6055 97 93 92 74 3 6759 97 94 93 78 4 7560 97 95 93 79 4 7664 98 18 94 80 5 77model answer: The chart shows that the percentage of British households with a range of consumer durables steadily increased between 1972 and 1983. The greatest increase was in telephone ownership, rising from 42% in 1972 to 77% in 1983. Next came centralheating ownership, rising from 37% of households in 1972 to 64% in 1983. The percentage of households with a refrigerator rose 2 1% over the same period and of those with a washing machine by 14%. Households with vacuum-cleaners. televisions and dishwashers increased by 8%, 5% and 2% respectively. In 1983. the year of their introduction, 18% of households had a video recorder. The significant social changes reflected in thestatistics are that over the period the proportion of British houses with central heating rose from one to two thuds, and of those with a phone from under a half to over three-quarters. Together with the big increases in the ownership of washing machines and refrigerators, they are evidence of both rising living standards and the trend to lifestyles based on comfort and convenience.#34. You should spend about 20 minutes on this task. The table below shows the figures for imprisonment in five countries between 1930 and 1980. Write a report for a university, lecturer describing the information shown below. You should write at least 150 wordsmodel answer: The table shows that the figures for imprisonment in the five countries mentioned indicate no overall pattern of increase or decrease. In fact there is considerable fluctuation from country to country. In Great Britain the numbers in prison have increased steadily from 30 000 in 1930 to 80,000 in 1980. On the other hand in Australia, and particularly in New Zealand the numbers fell markedly from 1930 to 1940. Since then they have increased gradually, apart from in 1980 when the numbers in prison in New Zealand fell by about 30,000 from the 1970 total. Canada is the only country in which the numbers in prison have decreased over the period 1930 to 1980, although there have been fluctuations in this trend. The figures for the United States indicate the greatest number of prisoners compared to the other four countries but population size needs to be taken into account in this analysis. The prison population in the United States increased rapidly from 1970 to 1980 and this must be a worrying trend.。
. . 流程图 流程图6点参考要领: 1. 找到流程图的过程,起点,终点。 2. 找到图上标出的已知动作,如果出现生词,尽量猜测。无词,用自己的语言。 3. 按照步骤,分段描述,千万不能省略任何一步。 4. 切记!加入流畅合理的表示顺序的关联词。 5. 句型以主动为主,搭配被动,以及主语从句(例如:It can be seen from the graph that…)。 6. 时态要使用一般现在时。 Chocolate comes from the cacao tree, which is grown in parts of South America, Africa and Indonesia.(开头不能一上来就直接介绍cacao tree,而是通过主题词chocolate引出,否则显得太唐突)【流程图特点之一:介绍过程要使用一般现在时】【流程图特点之二:大量使用定语从句,将有关联的两句话连接。】【流程图特点之三:大量使用被动语态】The tree produces large red pods which contain white cocoa beans.【流程图特点之四:使用一些表示顺序的连接词】when the pods are ripe, they are harvested, the beans are removed and they are fermented for several days in large wooden boxes.(三个句子的并列:“句子A,句子B and 句子C”。)During the fermenting process, the beans turn brown.【流程图特点之五:要适当地添加个别图中没有交代但能从图片中直接读出来的一些内容,否则可能达不到字数要求。但是一定要把握尺度,千万不要加上自己的主观观点,否则会扣分】
Next, the brown beans are spread in the sun to dry. They are then put in large sacks and transported by train or lorry. After this, the beans are taken to a chocolate factory where they are roasted in an oven at temperatures of between 250 and 350 degree Celsius.
After being roasted, the beans are crushed and the outer shell is removed. This part is not needed for making chocolate. Finally, the inner part of the bean is pressed and liquid chocolate is produced.【流程图特点之六:一般不需要写总结】
The process by which bricks are manufactured for the building industry can be outlined in seven consecutive steps. First the raw material, clay, which was just below the surface of soil in certain clay-rich areas has to be dug up by a digger. . . Then the lumps of clay are placed on a metal grid in order to break up the big chunks of clay into much smaller areas, which fall through the metal grid onto a roller, whose motion further segregates the bits of clay. Sand and water are added to make a homogenous mixture, which is then either formed in moulds or cut into brick-shaped pieces by means of a wire cutter.
Those fresh bricks are then kept in a drying oven for at least 24 and a maximum of 48 hours, several dozens if not hundreds of bricks at a time. The dried bricks are then transferred to a so-called kiln, another type of high temperature oven. First they are kept at a moderate temperature of 200 ℃ -1300 ℃. This process is followed by cooling down the finished bricks for 48 to 72 hours in a cooling chamber.
Once the bricks have cooled down and have become hard, they get packaged and delivered to their final destination, be it a building site or storage.
The first diagram shows that there are four main stages in the life of the silkworm. 第一个图显示了,在蚕的生命过程中主要有四步。First of all, eggs are produced by the moth and it takes ten days for each egg to become a silkworm larva that feeds on mulberry leaves. 首先,蛾子产出卵,每个卵用10天的时间变成蚕的幼虫,他们以桑叶 为食。This stage lasts for up to six weeks until the larva produces a cocoon of silk thread around itself. 这个阶段持续最多到六个星期,直到幼虫周围生产出茧(silk thread). After a period of about three weeks, the adult moths eventually emerge from these cocoons and the life cycle begins again. 经过三个星期的一段时间之后, 成年的蛾子最终从茧里面出来,这个生命的循环就再一次开始了。 The cocoons are the raw material used for the production of silk cloth. 茧是生产 丝绸的原材料。Once selected, they are boiled in water and the thread can be separated in the unwinding stage. 一旦被挑选出来,他们在水里煮沸,丝可以在打开的阶段中被分 离出来。Each thread is between 300 and 900 metres long, which means they can be twisted together, dyed and then used to produce cloth in the weaving stage. 每条丝是300 . . 到900米长,这就意味着,他们能够被缠绕在一起,染色,然后在织布阶段被用于生产布品。
Overall, the diagrams show that the cocoon stage of the silk worm can be used to produce silk cloth through a very simple process. 范文总结: 1. 163个字。 2. 使用了很多合适的关联词,见阴影部分。 3. 主要是简单的并列句。 4. 句型,搭配了一些被动语态。 5. 动词使用丰富:produce, feed on, last, emerge, select, boil, separate, unwind, in 10 days during the period of 10 days The process lasts for up to 10 days after 10 days 10 days passed until something happened. 就这些图形,我们来总结地理变迁题的写作要点。 地图题注意要点:
1 .地图的起始点 2 .方向很重要 3 .认真阅读并尽量记住图中已有的信息 考察点: 1 .方向方位路线顺序的把握 2 .相对位置关系的描述和辨别 . . 3 .表方位的词或者词组主要是介词的用法 4 .图中关键词的定位 The car park has been removed and replaced by a theatre. The number of homes in Town A is likely to double 2.确定写的顺序,是按变化写还是按位置写,还是两个的综合体。
3. 描述变化,把明显的变化先划出,最好用词在图旁边描述,确定 自己要写几点。 4.句型多用被动语态。 5.时态使用一般现在时或者过去时,也可能现在完成时。表示将来的时间可以用 下列表达:be predicted/be expected to do… 一般不用将来时,用上面的结构。 It is obvious/notable/noticeable It is easy to locate/to find that… It can be seen from the graph that… î 细节变化 地图每个细节变化都要提到,不要忽视一个细节 î 语态 地图题用被动语态 A is/ lies/ is located/ is situated in/on / to the east/west/south/north of B A 在B…..角落 A is at/in the south-eastern corner of B ( at 表示A 在B 外部, in表A 在B 内部)