864/JOURNAL OF ENGINEERING MECHANICS/SEPTEMBER2001
JOURNAL OF ENGINEERING MECHANICS /SEPTEMBER 2001/
865
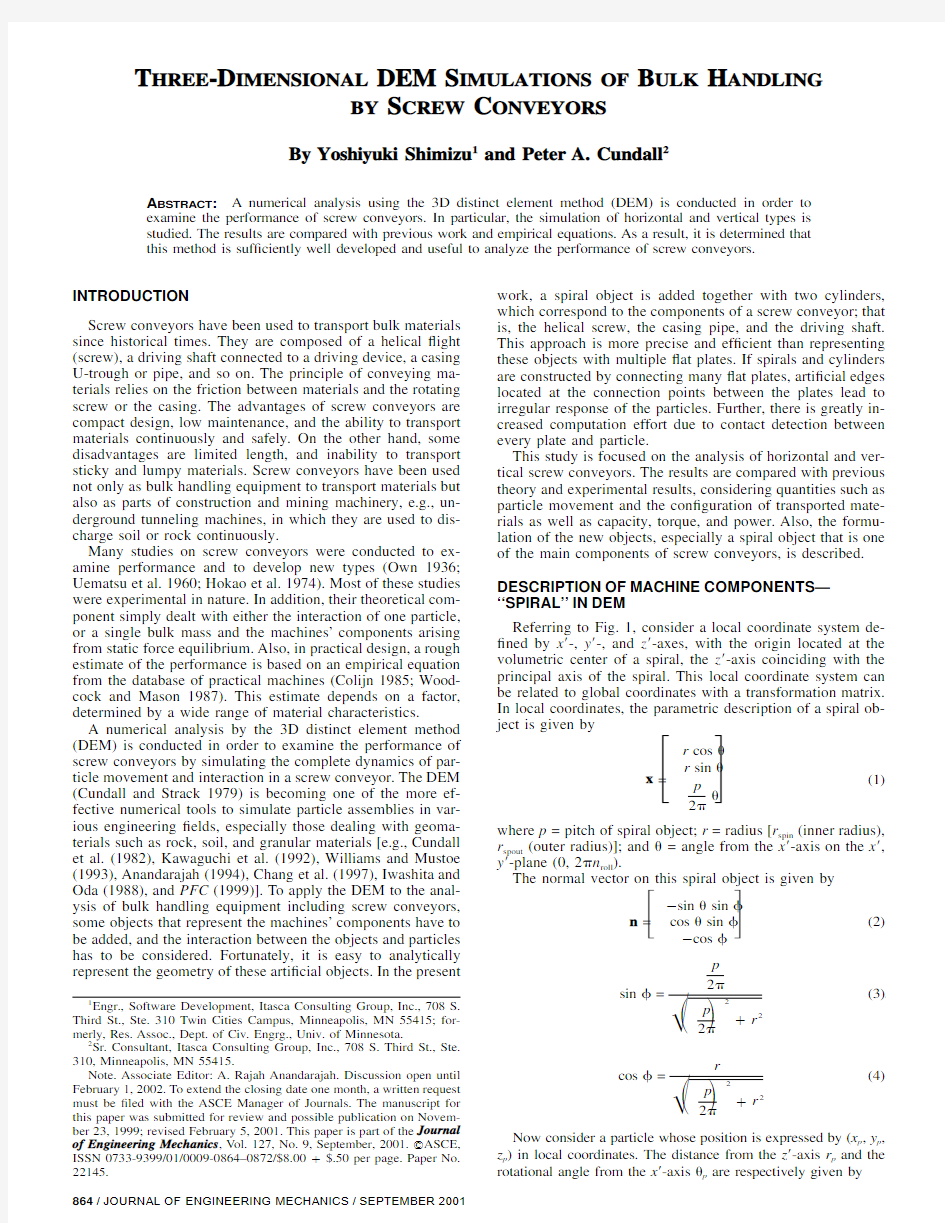
FIG. 1.
Spiral Object in DEM
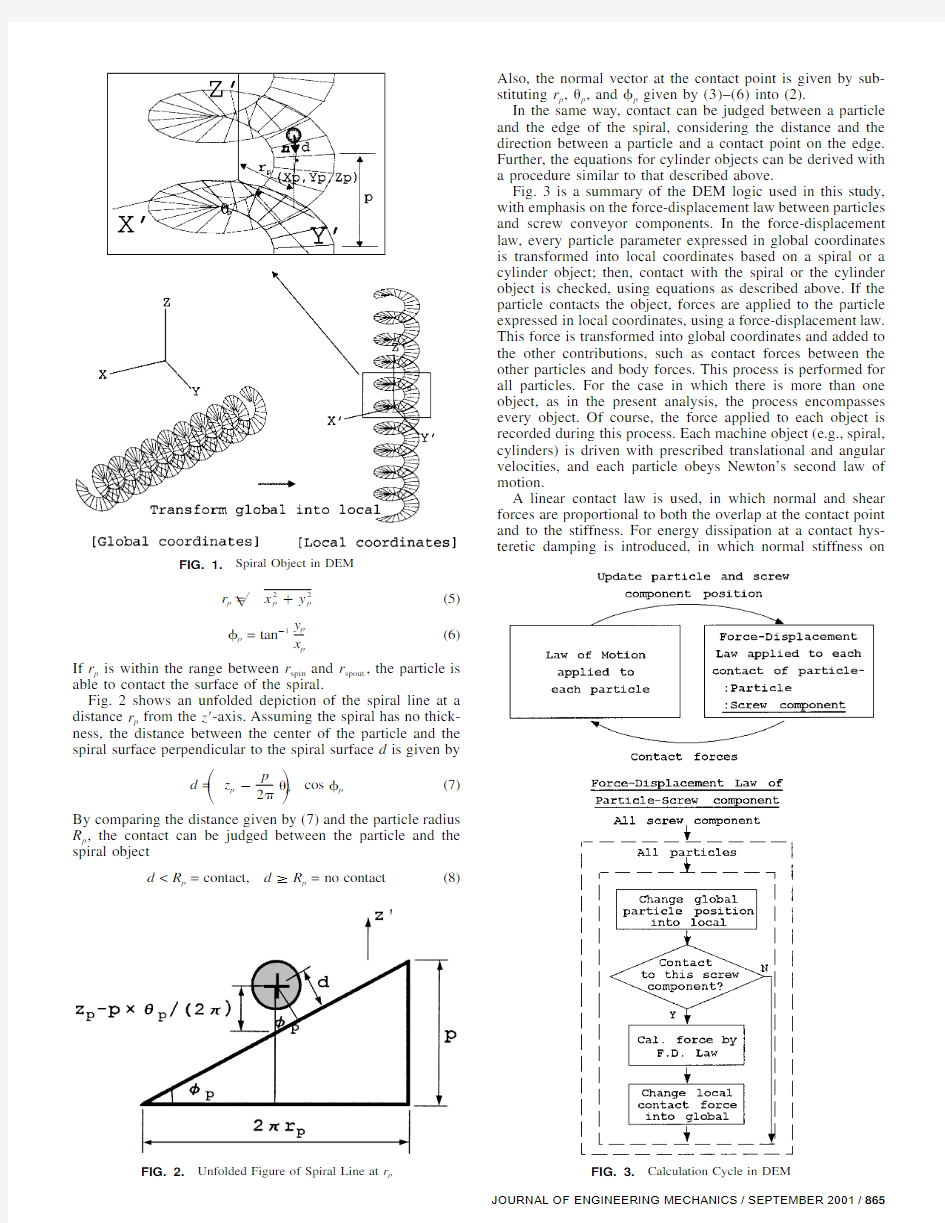
FIG. 3.Calculation Cycle in DEM
FIG. 2.Unfolded Figure of Spiral Line at r p 22
r =x ?y (5)?p p p
y p
?1
?=tan (6)
p x p
If r p is within the range between r spin and r spout ,the particle is able to contact the surface of the spiral.
Fig.2shows an unfolded depiction of the spiral line at a distance r p from the z ?-axis.Assuming the spiral has no thick-ness,the distance between the center of the particle and the spiral surface perpendicular to the spiral surface d is given by
p d =
z ?
?cos ?(7)
p p p ?
?
2?
By comparing the distance given by (7)and the particle radius R p ,the contact can be judged between the particle and the spiral object
d d ?R =no contact (8) p p Also,the normal vector at the contact point is given by sub-stituting r p ,?p ,and ?p given by (3)–(6)into (2). In the same way,contact can be judged between a particle and the edge of the spiral,considering the distance and the direction between a particle and a contact point on the edge.Further,the equations for cylinder objects can be derived with a procedure similar to that described above. Fig.3is a summary of the DEM logic used in this study,with emphasis on the force-displacement law between particles and screw conveyor components.In the force-displacement law,every particle parameter expressed in global coordinates is transformed into local coordinates based on a spiral or a cylinder object;then,contact with the spiral or the cylinder object is checked,using equations as described above.If the particle contacts the object,forces are applied to the particle expressed in local coordinates,using a force-displacement law.This force is transformed into global coordinates and added to the other contributions,such as contact forces between the other particles and body forces.This process is performed for all particles.For the case in which there is more than one object,as in the present analysis,the process encompasses every object.Of course,the force applied to each object is recorded during this process.Each machine object (e.g.,spiral,cylinders)is driven with prescribed translational and angular velocities,and each particle obeys Newton’s second law of motion. A linear contact law is used,in which normal and shear forces are proportional to both the overlap at the contact point and to the stiffness.For energy dissipation at a contact hys-teretic damping is introduced,in which normal stiffness on 866/JOURNAL OF ENGINEERING MECHANICS /SEPTEMBER 2001 TABLE 2.Material Properties for Horizontal Screw Analysis Property Dimension Particle Number 2.5,5,7.5,10?103Effective diameter D 1021mm Uniformity coef?cient 1.5 Density 2.65g/cm 3 Normal stiffness 5.0?106N/m Shear stiffness 5.0?106N/m Friction coef?cient 0.7 Screw conveyor Normal stiffness 2.0?109N/m Shear stiffness 2.0?109N/m Friction coef?cient 0.6 TABLE 1. Dimensions of Horizontal Screw Conveyor Component Dimension Casing pipe Length (m)Diameter (m)40.5Shaft Length (m)Diameter (m)40.1 Screw blade Length (m) 4 Outer diameter (m)0.5,0.5,0.425,0.35Pitch (m) 0.375,0.5,0.319,0.263Pitch/diameter 0.75,1.0,0.75,0.75Number of pitch 10.7,8,12.5,15.2Lead angle (degrees) 13.4,17.7,13.4,13.4 Note:Inner diameter of screw is same as diameter of shaft.FIG. 5.General View of Horizontal Screw Conveyor Model FIG. 4.Free Body Diagram between Particle and Horizontal,Inclined Screw Components unloading is greater than that on loading.The hysteretic damp-ing is independent of the relative velocity before and after contact between two particles or a particle and a screw com-ponent.The ratio between the two stiffnesses is determined by setting the restitution coef?cient at 0.9,calibrated with a par-ametric pretest.A calculation time step is determined by the highest stiffness to preserve numerical stability.Also,dissi-pation by Coulomb’s law of friction acts in the shear direction.Stiffnesses used in this work (k n ,k s )are evaluated from Young’s modulus of material E c using (PFC 1999) k =k =4E R (9) n s c p The simulation was done using a personal computer (300MHz Intel Pentium II processor,Intel Corp.,Santa Clara,Calif.)and PFC3D Version 2.1(Itasca Consulting Group Inc.,Minneap-olis)with some added features described above.HORIZONTAL SCREW CONVEYOR Empirical Formula and Previous Theory The following formula by the Conveyor Equipment Man-ufacturers Association (Naples,Fla.)describes the net power to transport material P net (Colijn 1985;Woodcock and Mason 1987): P =C ?gLF F F (10) net a f m p In this formula,the material factor F m corresponds to the friction coef?cient between particles and screw components,and depends on the material properties;materials are divided into four classes,that is,classes 1–4,in which F m varies from 0.5to 1.0for class 1and 3to 4for class 4.The ?ight factor F f and the paddle factor F p are provided as correction factors for various screw ?ight forms. Uematsu et al.(1960)derived equations for static force equilibrium between one particle and a screw or a casing.Fig.4shows the free body diagram between particle and screw components in a horizontal or a small inclined screw conveyor.On the condition that a particle keeps a steady-state holding angle ?0from the vertical axis (de?ned as the critical angle),and moving only in the z -direction,(11)–(13)are derived by force equilibrium in each direction R ?w cos ?cos ?=0 (r -direction) (11) c 0?w cos ?sin ??R sin ???R cos ?=0(?-direction) 0s ss s (12)R cos ???R sin ??w sin ???R =0 (z -direction) s ss s sc c (13) Substituting material properties and screw angles into (11)–(13),the critical angle ?0is evaluated.Further,using the weight of the bulk mass instead of a particle,and its center of gravity instead of the outer radius of the screw,the velocity of materials in the axial direction (de?ned as the transfer ve-locity)v t ,required torque T q ,and overall power p all are given in (14)–(16).The transfer velocity derived from (14)is equal to the advance velocity of screw p ?/(2?) p ?v =r ?tan ?= (14)t g g 2? T =Wr sin ?cos ?(15)q g 0P =Wr ?sin ?cos ? (16) all g 0Model Fig.5shows an example of a screw conveyor and Table 1provides its main dimensions.The model is composed of one spiral and two cylinders of different diameters.The spiral rep-resents a screw,and the cylinders represent a casing pipe and a driving shaft.These components are all 4m in length.Four JOURNAL OF ENGINEERING MECHANICS /SEPTEMBER 2001/ 867 FIG. 6.Results of Triaxial Test Simulation FIG.8.Side View of Results FIG.7.General View of Typical Result (Initial and Final Stage) parametric studies were made to examine the in?uence of the screw pitch and the clearance between the screw and the cas-ing pipe.The reference case has a pitch-to-diameter ratio of 0.75,and no clearance. Table 2lists material properties.Spherical particles were used instead of sand as transported materials,with a density of 2.65g/cm 3and a size distribution of 15–35mm.The ef-fective diameter D 10is 21mm and the uniformity coef?cient C u is 1.5.The number of particles varies from 2,500to 10,000to examine the effect of the loading factor,which is de?ned as the ratio between the cross-section area of bulk mass and that of the space in a casing,generally between 0.15and 0.45.Normal and shear stiffness of particle contacts are both 5.0?106N/m.These values are considerably smaller than those derived from (9)using the intact Young’s modulus of 10–50Gpa.The reason for using reduced contact stiffnesses is to account for microfractures and general degradation present near the exposed surfaces of rock fragments.These surfaces are thus more deformable than intact material in a virgin state.For the screw conveyor components,the normal and shear stiffnesses are 2.0?109N/m,derived from (9)using Young’s modulus and 5mm thickness of steel. Fig.6shows results of a triaxial test simulation,in which the same material properties of a horizontal and a vertical screw conveyor simulation are used.The internal friction angle of the bulk mass largely depends on the friction coef?cient between particles.Even though a large value of the friction coef?cient is used,the internal friction angle of the bulk mass is small in comparison with real materials such as sand.The friction coef?cient between particles used in the screw con-veyor simulation is 0.7in order to compensate for the lower resistance.Also,the friction coef?cient between particles and the screw conveyor components is 0.6,which corresponds to that in the experimental study by Uematsu et al.(1960).As described above,a hysteretic damping is introduced that sim-ulates a coef?cient of restitution of 0.9. Parametric calculations are conducted to examine the fol-lowing in?uences:(1)speed of screw revolution (15,30,45,and 60rpm);(2)material content (2,500,5,000,7,500,and 10,000particles);(3)ratio of screw pitch to diameter (0.75and 1.0);and (4)clearance between screw and casing pipe (0.0,37.5,and 75mm). The simulation procedure is as follows.A speci?ed number of particles are initially created at random locations within a half-section of the screw conveyor,and then dropped by grav-ity.After reaching equilibrium,the screw and the driving shaft are both rotated through three complete rotations at the spec-i?ed,constant angular velocity,while the casing remains at rest. 868/JOURNAL OF ENGINEERING MECHANICS /SEPTEMBER 2001 FIG.10.Time History of Power and Torque (5,000Particles,60 rpm)FIG.9.End View of Results (60rpm,Pitch/Diameter = 0.75) https://www.doczj.com/doc/aa12079504.html,parison between Calculated Power and Theoretical https://www.doczj.com/doc/aa12079504.html,parison between Calculated Transfer Velocity and The- oretical FIG.11.Relationship between Critical Angle and Revolution Speed Results Fig.7shows a typical con?guration at the initial and ?nal stages.To make the movement of each particle and the mixing conditions visible,each particle was classi?ed at every 10%of cross-section area from the bottom by initially setting a different color at each level.It is evident that particles are moving forward,while the free surface has some angle from the horizontal surface with respect to the direction of spiral rotation. Fig.8shows the side view of calculated results after three rotations from the initial stage.Almost all particles move for-ward by the three-screw pitch distance.As the number of par-ticles increases,the bulk mass occupies the upper area;then,some particles migrate across the driving shaft,as seen in Fig.9.There is little difference in the con?guration of transported materials when changing the ratio of screw pitch diameter from 0.75to 1.0. Fig.9shows the end view of calculated results after three rotations.For more than 7,500particles,the particles migrate across the driving shaft.This means that some particles move backward along the helical screw.Also,as the number of par-ticles increases,the critical angle increases.This is because the bulk mass consists of many particles that move dynamically JOURNAL OF ENGINEERING MECHANICS /SEPTEMBER 2001/869 TABLE 3. Dimensions of Vertical Screw Conveyor Component Dimension Casing pipe Length (m)Diameter (m) 1.330.13Shaft Length (m)Diameter (m) 1.330.042Screw blade Length (m) 1.33Outer diameter (m)0.12Pitch (m) 0.066Pitch/diameter 0.554Number of pitch 20Lead angle (degrees) 10.0 Note:Inner diameter of screw is same as diameter of shaft. FIG.16.General View of Vertical Screw Conveyor Model FIG.15.Free Body Diagram between Particle and Vertical Screw Components FIG.14.Time History of Power Affected by Clearance (5,000Parti-cles,60rpm) preventing each spherical particle from rotating with respect to each other. Fig.10shows the time history of the overall torque and power required to rotate the screw and the driving shaft against the friction from particle https://www.doczj.com/doc/aa12079504.html,rge torque and power are needed at start-up in order to accelerate stationary particles.Soon after start-up,they reach steady state,although there are slight ?uctuations induced by random components in each par-ticle’s motion. Fig.11shows the calculated critical angle.The critical angle is de?ned on the cross-section area as the angle from the ver-tical line to the line between the center of gravity of bulk mass and the principal axis.The solid line shows the critical angle derived from static force equilibrium [(11)–(13)].The calcu-lated results are considerably smaller than that derived from static force equilibrium.In this analysis,spherical particles were used.These particles tend to rotate before slipping on the screw conveyor component.This is similar to the simu-lations of angle of repose,in which assemblies of spherical particles exhibit smaller angles of repose than nonspherical particles.There is also evidence that the bulk friction coef?-cient of assemblies of spherical particles is almost independent of the friction coef?cient between particles (Skinner 1969). The critical angle increases slightly as the revolution speed increases,although static force equilibrium predicts the angle to be independent of revolution speed. Fig.12shows the comparison between calculated transfer velocity and that derived from (14).The transfer velocity in-creases linearly as the revolution speed increases.Although the calculated results show somewhat smaller velocity compared with that derived from (14),they are in good agreement.Ac-tually,the particles move not only in the axial direction but also in the radial and the rotational directions.Further,as the number of particles increases,some particles move backward by migrating across the driving shaft;in that case,the calcu-lated velocities become much smaller. Fig.13shows the comparison between calculated power and that derived from (16),into which the calculated critical angle and the center of gravity were substituted.Calculated power is larger than that derived from (16),and shows almost 15%deviation.One reason is that the particles move dynamically, 870/JOURNAL OF ENGINEERING MECHANICS /SEPTEMBER 2001 TABLE 4. Material Properties for Vertical Screw Analysis Property Dimension Particle Number 5,000Effective diameter D 105mm Uniformity coef?cient 1.4 Density 2.65g/cm 3 Normal stiffness 1.2?106N/m Shear stiffness 1.2?106N/m Friction coef?cient 0.7 Screw conveyor Normal stiffness 2.0?109N/m Shear stiffness 2.0?109N/m Friction coef?cient 0.6 FIG.17.General View of Results so power is needed to accelerate particles.Further,when the number of particles increases,the difference between calcu-lated power and that from (16)become large.This is because (16)does not consider backward movement of particles across the driving shaft and the power to rotate the driving shaft against the friction from particles.A comparison was made between calculated power (overall power)and net power,de-rived from (10),in which 1.0was used as F m .The ratio of net power to overall power,corresponding to ef?ciency,was al-most 85%.As described before,the screw conveyor works not only to transport bulk material in the axial direction but also to move particles in other directions. Fig.14shows a time history of the overall power for two values of clearance between the screw and the casing pipe. JOURNAL OF ENGINEERING MECHANICS /SEPTEMBER 2001/ 871 https://www.doczj.com/doc/aa12079504.html,parison between Calculated Mass Flow Rate and Ex- perimental FIG.18.Relationship between Transfer Angle,Upward Velocity,and Revolution Speed The upper graph shows the results for the case of 37.5mm clearance,corresponding to 1.5times the average particle di-ameter.The lower graph shows the case of 75mm clearance,three times the average particle https://www.doczj.com/doc/aa12079504.html,paring these re-sults and also the result of zero clearance,shown in Fig.10,the result for the case of 1.5times the average particle diam-eter exhibits large ?uctuation in power.This is because some particles stick in the area between the screw and casing pipe in the case of clearance below three times the average particle diameter. VERTICAL SCREW CONVEYOR Previous Theory Hokao et al.(1974)derived equations for static force equi-librium between one particle and a screw or a casing.Fig.15shows the free body diagram between particle and screw com-ponents in a vertical screw conveyor.Eqs.(17)–(19)are de-rived by force equilibrium in each direction 2R ??rw /g =0 (r -direction) (17) c 0??R cos ??R sin ???R cos ?=0(?-direction) sc c s ss s (18)R cos ??w ??R sin ???R sin ?=0 (z -direction) s sc c ss s (19) Substituting material properties and screw angles into (17)–(19),the angle,derived from the arctangent of the particle velocity component in the axial direction to that in the rota-tional direction (de?ned as the transfer angle)?,is evaluated.Further,using the center of gravity of bulk mass instead of the outer radius of the screw,the velocity of particles in the axial direction (de?ned as the upward velocity)v u is given by r ?tan ?tan(???)g v = (20) u tan ??tan(???) Model Fig.16and Table 3show a model and main dimensions of a vertical screw conveyor.The model is composed of one spi-ral and two cylinders,in which the axial direction is vertical.The main dimensions of the model coincide with that used in experiments by Hokao et al.(1974)except for the length of 1.33m,which corresponds to 20turns of the spiral (20times the pitch)in order to obtain steady-state conditions in the ver-tical transport of bulk materials.Similar to the horizontal case,each particle was classi?ed at every 10%of one pitch by set-ting a different color in the initial setup. Table 4shows the material properties.Spherical particles were used instead of sand as bulk material as in the analysis of the horizontal screw conveyor.The size distribution is 4–8mm,with the effective diameter D 10of 5mm and the uni-formity coef?cient C u of 1.4.The number of particles is 5,000.Normal and shear stiffness of particles are 1.2?106N/m.These values are estimated by substituting a small Young’s modulus of 0.1Gpa into (9).Also,the friction coef?cients between particles and between particle and the screw conveyor components are 0.7and 0.6,respectively.Further,the hyster-etic damping was adjusted such that the restitution coef?cient is equal to 0.9. The simulation procedure is similar to that of the horizontal screw conveyor.That is,5,000particles are initially created in the lower part of the screw conveyor,then dropped by gravity.After particles reach a kinematically stable condition,the screw and the driving shaft are both rotated 20rotations,at the speci?ed constant speed of revolution.The speed was set at various values between 100and 500rpm. Results Fig.17shows the calculated results after 5,10,15,and 20rotations from the initial stage for revolution speeds of 200,300,400,and 500rpm.Almost all particles in every case are moving upward as the number of revolutions becomes larger.As the revolution speed increases,the bulk mass of particles has a compact form in the axial direction.On the other hand,as the revolution speed decreases,the mass concentration spreads out in the axial direction.Particularly,for a revolution speed of <200rpm,some particles are not able to resist the gravity force because of the small centrifugal force.These par-ticles fall back through the helical path or between the clear-ance of the screw and casing pipe. Fig.18shows the calculated transfer angle and upward ve-locity.The solid line shows each value derived from static force equilibrium [(17)–(19)and (20)].As evident in this ?g-ure,the transfer angle approaches 180?as the revolution speed decreases,which means that the particles are not transported upward around 100rpm.The calculated results are very close to that derived from static force equilibrium.As the revolution speed increases,there is an increasing discrepancy between the calculated results and that from static force equilibrium.This arises from dynamic effects that are not considered in the the-ory of static force equilibrium. Fig.19shows the comparison between calculated mass ?ow rate and experimental results by Hokao et al.(1974).The cal-culated mass ?ow rate was derived from the upward velocity and the volumetric concentration within the area of bulk mass.The calculated results show a smaller ?ow rate compared with the experimental results.One reason is that the transported mass?ow rate is largely dependent on the condition at the inlet.In the experiment,particles are fed continuously,in con-trast to the simulation,in which they are fed as a batch.Thus, the volumetric concentration of bulk mass in the simulation becomes smaller than that in the experiments. SUMMARY The3D DEM was extended by the authors to add some objects,and used to analyze the performance of screw con-veyors.These objects analytically represent the machines’components,making the simulation more precise and ef?cient. In this study,simulations of horizontal and vertical screw con-veyors are conducted.The results are compared with previous work and empirical equations.As a result,it is concluded that this method is suf?ciently well developed and useful to ana-lyze the performance of screw conveyors. Some results from each analysis are listed below. Horizontal screw analysis ?The critical angle was considerably smaller than that pre-dicted from static force equilibrium because of the spher-ical shape of modeled particles.The particles are likely to rotate rather than slip on the screw conveyor components.?The transfer velocity of particles was almost equal to the advance velocity of the screw. ?The overall power is larger by about15%than that de-rived from static force equilibrium using calculated results of the critical angle and the center of gravity,due to in-ertia forces exerted by dynamic particle movement.Also, when the number of particles increases,additional power is needed to resist backward movement of particles across the driving shaft and to rotate the driving shaft against the friction from particles. ?The con?guration of transported materials is smaller to that observed in experimental research and practical ma-chines.Also the required clearance between screw and casing is reasonable from a common sense viewpoint on granular materials. Vertical screw analysis ?The con?guration of transported materials is realistic.As the revolution speed increases,the particles move faster as a bulk mass,which has a compact form in the axial direction.On the other hand,as the revolution speed de-creases,the particles move slower,and the mass concen-tration spreads out in the axial direction. ?The transfer angle and the upward velocity of particles are very close to those described from static force equi-librium except at high revolution speed,in which the dy-namic effects need to be considered. ?The computed?ow rate differs somewhat from that ob-served in experiments.One reason is that a different way of feeding materials at the inlet is used. REFERENCES Anandarajah,A.(1994).‘‘Discrete-element method for simulating behav-ior of cohesive soil.’’J.Geotech.Engrg.,ASCE,120(9),1593–1613.Chang,C.A.,Babic,M.,Liang,R.Y.,and Misra,A.,eds.(1997).Me-chanics of deformation and?ow of particulate materials,ASCE,New York. Colijn,H.(1985).Mechanical conveyors for bulk solid,Elsevier Science, New York,110–168. Cundall,P.A.,Drescher,A.,and Strack,O.D.L.(1982).‘‘Numerical experiments on granular assemblies;Measurements and observations.’’Proc.,IUTAM Conf.on Deformation and Failure of Granular Mat., 335–370. Cundall,P.A.,and Strack,O.D.L.(1979).‘‘A discrete numerical model for granular assemblies.’’Ge′otechnique,London,29(1),47–65. Hokao,Z.,Kondo,K.,and Hatta,T.(1974).‘‘Study on development of vertical screw conveyors.’’J.Mining and Mat.Processing Inst.of Ja-pan,90(1039),595–600. Iwashita,K.,and Oda,M.(1998).‘‘Rolling resistance at contacts in sim-ulation of shear band development by DEM.’’J.Engrg.Mech.,ASCE, 124(3),286–292. Kawaguchi,T.,Tanaka,T.,and Tsuji,Y.(1992).‘‘Numerical simulation of?uidized bed using the discrete element method(the case of spouting bed).’’Trans.JSME B,58(551),2119–2125. Owen,J.H.(1936).‘‘Power absorption in screw conveyors.’’Engrg,Lon-don,142,291. PFC manual.(1999).Itasca Consulting Group Inc.,Minneapolis. Skinner,A.E.(1969).‘‘A note on the in?uence of interparticle friction on the shearing strength of a random assembly of spherical particles.’’Ge′otechnique,London,19,150–157. Williams,J.R.,and Mustoe,G.G.W.,eds.,(1993).Proc.,2nd Int.Conf. on Discrete Element Methods(DEM),MIT,Cambridge,Mass. Woodcock,C.R.,and Mason,J.S.(1987).Bulk solids handling,Leonard Hill,London,335–357. Uematsu,T.,Nakamura,S.,Hino,Y.,and Suyama,H.(1960).‘‘A study of the screw conveyor.’’Trans.JSME,26(162),180–186. NOTATION The following symbols are used in this paper: C=capacity(volume?ow rate); F f=?ight(screw)factor,1.0for standard; F m=material factor; F p=paddle factor,1.0for no paddle; g=gravitational acceleration; L=total length; n roll=number of pitch; P all=overall power; P net=net power; p=pitch of spiral object; R c=reaction(normal)force from casing; R s=reaction(normal)force from screw; r=radius[r spin(inner radius),r spout(outer radius)]; r g=radius of center of gravity of bulk mass; T q=torque; v t=transfer velocity; v u=upward velocity; W=weight of bulk mass; w=weight of particle; ?=inclination angle of screw conveyor; ?=lead angle of spiral line; ?g=lead angle of this spiral line at r g; ?=transfer angle(0.5?rad,?rad); ?sc=friction coef?cient between casing and particle; ?ss=friction coef?cient between screw and particle; ?a=apparent density of material; ?=angle from x?-axis on x?,y?-plane(0,2?n roll); ?0=critical angle; ?=angular velocity of screw;and ?0=angular velocity of particle. 872/JOURNAL OF ENGINEERING MECHANICS/SEPTEMBER2001
相关主题
文本预览