Robustness of complex networks with the local protection strategy against cascading failures
- 格式:pdf
- 大小:1.06 MB
- 文档页数:7

国际自动化与计算杂志.英文版.1.Improved Exponential Stability Criteria for Uncertain Neutral System with Nonlinear Parameter PerturbationsFang Qiu,Ban-Tong Cui2.Robust Active Suspension Design Subject to Vehicle Inertial Parameter VariationsHai-Ping Du,Nong Zhang3.Delay-dependent Non-fragile H∞ Filtering for Uncertain Fuzzy Systems Based on Switching Fuzzy Model and Piecewise Lyapunov FunctionZhi-Le Xia,Jun-Min Li,Jiang-Rong Li4.Observer-based Adaptive Iterative Learning Control for Nonlinear Systems with Time-varying DelaysWei-Sheng Chen,Rui-Hong Li,Jing Li5.H∞ Output Feedback Control for Stochastic Systems with Mode-dependent Time-varying Delays and Markovian Jump ParametersXu-Dong Zhao,Qing-Shuang Zeng6.Delay and Its Time-derivative Dependent Robust Stability of Uncertain Neutral Systems with Saturating ActuatorsFatima El Haoussi,El Houssaine Tissir7.Parallel Fuzzy P+Fuzzy I+Fuzzy D Controller:Design and Performance EvaluationVineet Kumar,A.P.Mittal8.Observers for Descriptor Systems with Slope-restricted NonlinearitiesLin-Na Zhou,Chun-Yu Yang,Qing-Ling Zhang9.Parameterized Solution to a Class of Sylvester MatrixEquationsYu-Peng Qiao,Hong-Sheng Qi,Dai-Zhan Cheng10.Indirect Adaptive Fuzzy and Impulsive Control of Nonlinear SystemsHai-Bo Jiang11.Robust Fuzzy Tracking Control for Nonlinear Networked Control Systems with Integral Quadratic ConstraintsZhi-Sheng Chen,Yong He,Min Wu12.A Power-and Coverage-aware Clustering Scheme for Wireless Sensor NetworksLiang Xue,Xin-Ping Guan,Zhi-Xin Liu,Qing-Chao Zheng13.Guaranteed Cost Active Fault-tolerant Control of Networked Control System with Packet Dropout and Transmission DelayXiao-Yuan Luo,Mei-Jie Shang,Cai-Lian Chen,Xin-Ping Guanparison of Two Novel MRAS Based Strategies for Identifying Parameters in Permanent Magnet Synchronous MotorsKan Liu,Qiao Zhang,Zi-Qiang Zhu,Jing Zhang,An-Wen Shen,Paul Stewart15.Modeling and Analysis of Scheduling for Distributed Real-time Embedded SystemsHai-Tao Zhang,Gui-Fang Wu16.Passive Steganalysis Based on Higher Order Image Statistics of Curvelet TransformS.Geetha,Siva S.Sivatha Sindhu,N.Kamaraj17.Movement Invariants-based Algorithm for Medical Image Tilt CorrectionMei-Sen Pan,Jing-Tian Tang,Xiao-Li Yang18.Target Tracking and Obstacle Avoidance for Multi-agent SystemsJing Yan,Xin-Ping Guan,Fu-Xiao Tan19.Automatic Generation of Optimally Rigid Formations Using Decentralized MethodsRui Ren,Yu-Yan Zhang,Xiao-Yuan Luo,Shao-Bao Li20.Semi-blind Adaptive Beamforming for High-throughput Quadrature Amplitude Modulation SystemsSheng Chen,Wang Yao,Lajos Hanzo21.Throughput Analysis of IEEE 802.11 Multirate WLANs with Collision Aware Rate Adaptation AlgorithmDhanasekaran Senthilkumar,A. Krishnan22.Innovative Product Design Based on Customer Requirement Weight Calculation ModelChen-Guang Guo,Yong-Xian Liu,Shou-Ming Hou,Wei Wang23.A Service Composition Approach Based on Sequence Mining for Migrating E-learning Legacy System to SOAZhuo Zhang,Dong-Dai Zhou,Hong-Ji Yang,Shao-Chun Zhong24.Modeling of Agile Intelligent Manufacturing-oriented Production Scheduling SystemZhong-Qi Sheng,Chang-Ping Tang,Ci-Xing Lv25.Estimation of Reliability and Cost Relationship for Architecture-based SoftwareHui Guan,Wei-Ru Chen,Ning Huang,Hong-Ji Yang1.A Computer-aided Design System for Framed-mould in Autoclave ProcessingTian-Guo Jin,Feng-Yang Bi2.Wear State Recognition of Drills Based on K-means Cluster and Radial Basis Function Neural NetworkXu Yang3.The Knee Joint Design and Control of Above-knee Intelligent Bionic Leg Based on Magneto-rheological DamperHua-Long Xie,Ze-Zhong Liang,Fei Li,Li-Xin Guo4.Modeling of Pneumatic Muscle with Shape Memory Alloy and Braided SleeveBin-Rui Wang,Ying-Lian Jin,Dong Wei5.Extended Object Model for Product Configuration DesignZhi-Wei Xu,Ze-Zhong Liang,Zhong-Qi Sheng6.Analysis of Sheet Metal Extrusion Process Using Finite Element MethodXin-Cun Zhuang,Hua Xiang,Zhen Zhao7.Implementation of Enterprises' Interoperation Based on OntologyXiao-Feng Di,Yu-Shun Fan8.Path Planning Approach in Unknown EnvironmentTing-Kai Wang,Quan Dang,Pei-Yuan Pan9.Sliding Mode Variable Structure Control for Visual Servoing SystemFei Li,Hua-Long Xie10.Correlation of Direct Piezoelectric Effect on EAPap under Ambient FactorsLi-Jie Zhao,Chang-Ping Tang,Peng Gong11.XML-based Data Processing in Network Supported Collaborative DesignQi Wang,Zhong-Wei Ren,Zhong-Feng Guo12.Production Management Modelling Based on MASLi He,Zheng-Hao Wang,Ke-Long Zhang13.Experimental Tests of Autonomous Ground Vehicles with PreviewCunjia Liu,Wen-Hua Chen,John Andrews14.Modelling and Remote Control of an ExcavatorYang Liu,Mohammad Shahidul Hasan,Hong-Nian Yu15.TOPSIS with Belief Structure for Group Belief Multiple Criteria Decision MakingJiang Jiang,Ying-Wu Chen,Da-Wei Tang,Yu-Wang Chen16.Video Analysis Based on Volumetric Event DetectionJing Wang,Zhi-Jie Xu17.Improving Decision Tree Performance by Exception HandlingAppavu Alias Balamurugan Subramanian,S.Pramala,B.Rajalakshmi,Ramasamy Rajaram18.Robustness Analysis of Discrete-time Indirect Model Reference Adaptive Control with Normalized Adaptive LawsQing-Zheng Gao,Xue-Jun Xie19.A Novel Lifecycle Model for Web-based Application Development in Small and Medium EnterprisesWei Huang,Ru Li,Carsten Maple,Hong-Ji Yang,David Foskett,Vince Cleaver20.Design of a Two-dimensional Recursive Filter Using the Bees AlgorithmD. T. Pham,Ebubekir Ko(c)21.Designing Genetic Regulatory Networks Using Fuzzy Petri Nets ApproachRaed I. Hamed,Syed I. Ahson,Rafat Parveen1.State of the Art and Emerging Trends in Operations and Maintenance of Offshore Oil and Gas Production Facilities: Some Experiences and ObservationsJayantha P.Liyanage2.Statistical Safety Analysis of Maintenance Management Process of Excavator UnitsLjubisa Papic,Milorad Pantelic,Joseph Aronov,Ajit Kumar Verma3.Improving Energy and Power Efficiency Using NComputing and Approaches for Predicting Reliability of Complex Computing SystemsHoang Pham,Hoang Pham Jr.4.Running Temperature and Mechanical Stability of Grease as Maintenance Parameters of Railway BearingsJan Lundberg,Aditya Parida,Peter S(o)derholm5.Subsea Maintenance Service Delivery: Mapping Factors Influencing Scheduled Service DurationEfosa Emmanuel Uyiomendo,Tore Markeset6.A Systemic Approach to Integrated E-maintenance of Large Engineering PlantsAjit Kumar Verma,A.Srividya,P.G.Ramesh7.Authentication and Access Control in RFID Based Logistics-customs Clearance Service PlatformHui-Fang Deng,Wen Deng,Han Li,Hong-Ji Yang8.Evolutionary Trajectory Planning for an Industrial RobotR.Saravanan,S.Ramabalan,C.Balamurugan,A.Subash9.Improved Exponential Stability Criteria for Recurrent Neural Networks with Time-varying Discrete and Distributed DelaysYuan-Yuan Wu,Tao Li,Yu-Qiang Wu10.An Improved Approach to Delay-dependent Robust Stabilization for Uncertain Singular Time-delay SystemsXin Sun,Qing-Ling Zhang,Chun-Yu Yang,Zhan Su,Yong-Yun Shao11.Robust Stability of Nonlinear Plants with a Non-symmetric Prandtl-Ishlinskii Hysteresis ModelChang-An Jiang,Ming-Cong Deng,Akira Inoue12.Stability Analysis of Discrete-time Systems with Additive Time-varying DelaysXian-Ming Tang,Jin-Shou Yu13.Delay-dependent Stability Analysis for Markovian Jump Systems with Interval Time-varying-delaysXu-Dong Zhao,Qing-Shuang Zeng14.H∞ Synchronization of Chaotic Systems via Delayed Feedback ControlLi Sheng,Hui-Zhong Yang15.Adaptive Fuzzy Observer Backstepping Control for a Class of Uncertain Nonlinear Systems with Unknown Time-delayShao-Cheng Tong,Ning Sheng16.Simulation-based Optimal Design of α-β-γ-δ FilterChun-Mu Wu,Paul P.Lin,Zhen-Yu Han,Shu-Rong Li17.Independent Cycle Time Assignment for Min-max SystemsWen-De Chen,Yue-Gang Tao,Hong-Nian Yu1.An Assessment Tool for Land Reuse with Artificial Intelligence MethodDieter D. Genske,Dongbin Huang,Ariane Ruff2.Interpolation of Images Using Discrete Wavelet Transform to Simulate Image Resizing as in Human VisionRohini S. Asamwar,Kishor M. Bhurchandi,Abhay S. Gandhi3.Watermarking of Digital Images in Frequency DomainSami E. I. Baba,Lala Z. Krikor,Thawar Arif,Zyad Shaaban4.An Effective Image Retrieval Mechanism Using Family-based Spatial Consistency Filtration with Object RegionJing Sun,Ying-Jie Xing5.Robust Object Tracking under Appearance Change ConditionsQi-Cong Wang,Yuan-Hao Gong,Chen-Hui Yang,Cui-Hua Li6.A Visual Attention Model for Robot Object TrackingJin-Kui Chu,Rong-Hua Li,Qing-Ying Li,Hong-Qing Wang7.SVM-based Identification and Un-calibrated Visual Servoing for Micro-manipulationXin-Han Huang,Xiang-Jin Zeng,Min Wang8.Action Control of Soccer Robots Based on Simulated Human IntelligenceTie-Jun Li,Gui-Qiang Chen,Gui-Fang Shao9.Emotional Gait Generation for a Humanoid RobotLun Xie,Zhi-Liang Wang,Wei Wang,Guo-Chen Yu10.Cultural Algorithm for Minimization of Binary Decision Diagram and Its Application in Crosstalk Fault DetectionZhong-Liang Pan,Ling Chen,Guang-Zhao Zhang11.A Novel Fuzzy Direct Torque Control System for Three-level Inverter-fed Induction MachineShu-Xi Liu,Ming-Yu Wang,Yu-Guang Chen,Shan Li12.Statistic Learning-based Defect Detection for Twill FabricsLi-Wei Han,De Xu13.Nonsaturation Throughput Enhancement of IEEE 802.11b Distributed Coordination Function for Heterogeneous Traffic under Noisy EnvironmentDhanasekaran Senthilkumar,A. Krishnan14.Structure and Dynamics of Artificial Regulatory Networks Evolved by Segmental Duplication and Divergence ModelXiang-Hong Lin,Tian-Wen Zhang15.Random Fuzzy Chance-constrained Programming Based on Adaptive Chaos Quantum Honey Bee Algorithm and Robustness AnalysisHan Xue,Xun Li,Hong-Xu Ma16.A Bit-level Text Compression Scheme Based on the ACW AlgorithmHussein A1-Bahadili,Shakir M. Hussain17.A Note on an Economic Lot-sizing Problem with Perishable Inventory and Economies of Scale Costs:Approximation Solutions and Worst Case AnalysisQing-Guo Bai,Yu-Zhong Zhang,Guang-Long Dong1.Virtual Reality: A State-of-the-Art SurveyNing-Ning Zhou,Yu-Long Deng2.Real-time Virtual Environment Signal Extraction and DenoisingUsing Programmable Graphics HardwareYang Su,Zhi-Jie Xu,Xiang-Qian Jiang3.Effective Virtual Reality Based Building Navigation Using Dynamic Loading and Path OptimizationQing-Jin Peng,Xiu-Mei Kang,Ting-Ting Zhao4.The Skin Deformation of a 3D Virtual HumanXiao-Jing Zhou,Zheng-Xu Zhao5.Technology for Simulating Crowd Evacuation BehaviorsWen-Hu Qin,Guo-Hui Su,Xiao-Na Li6.Research on Modelling Digital Paper-cut PreservationXiao-Fen Wang,Ying-Rui Liu,Wen-Sheng Zhang7.On Problems of Multicomponent System Maintenance ModellingTomasz Nowakowski,Sylwia Werbinka8.Soft Sensing Modelling Based on Optimal Selection of Secondary Variables and Its ApplicationQi Li,Cheng Shao9.Adaptive Fuzzy Dynamic Surface Control for Uncertain Nonlinear SystemsXiao-Yuan Luo,Zhi-Hao Zhu,Xin-Ping Guan10.Output Feedback for Stochastic Nonlinear Systems with Unmeasurable Inverse DynamicsXin Yu,Na Duan11.Kalman Filtering with Partial Markovian Packet LossesBao-Feng Wang,Ge Guo12.A Modified Projection Method for Linear FeasibilityProblemsYi-Ju Wang,Hong-Yu Zhang13.A Neuro-genetic Based Short-term Forecasting Framework for Network Intrusion Prediction SystemSiva S. Sivatha Sindhu,S. Geetha,M. Marikannan,A. Kannan14.New Delay-dependent Global Asymptotic Stability Condition for Hopfield Neural Networks with Time-varying DelaysGuang-Deng Zong,Jia Liu hHTTp://15.Crosscumulants Based Approaches for the Structure Identification of Volterra ModelsHouda Mathlouthi,Kamel Abederrahim,Faouzi Msahli,Gerard Favier1.Coalition Formation in Weighted Simple-majority Games under Proportional Payoff Allocation RulesZhi-Gang Cao,Xiao-Guang Yang2.Stability Analysis for Recurrent Neural Networks with Time-varying DelayYuan-Yuan Wu,Yu-Qiang Wu3.A New Type of Solution Method for the Generalized Linear Complementarity Problem over a Polyhedral ConeHong-Chun Sun,Yan-Liang Dong4.An Improved Control Algorithm for High-order Nonlinear Systems with Unmodelled DynamicsNa Duan,Fu-Nian Hu,Xin Yu5.Controller Design of High Order Nonholonomic System with Nonlinear DriftsXiu-Yun Zheng,Yu-Qiang Wu6.Directional Filter for SAR Images Based on NonsubsampledContourlet Transform and Immune Clonal SelectionXiao-Hui Yang,Li-Cheng Jiao,Deng-Feng Li7.Text Extraction and Enhancement of Binary Images Using Cellular AutomataG. Sahoo,Tapas Kumar,B.L. Rains,C.M. Bhatia8.GH2 Control for Uncertain Discrete-time-delay Fuzzy Systems Based on a Switching Fuzzy Model and Piecewise Lyapunov FunctionZhi-Le Xia,Jun-Min Li9.A New Energy Optimal Control Scheme for a Separately Excited DC Motor Based Incremental Motion DriveMilan A.Sheta,Vivek Agarwal,Paluri S.V.Nataraj10.Nonlinear Backstepping Ship Course ControllerAnna Witkowska,Roman Smierzchalski11.A New Method of Embedded Fourth Order with Four Stages to Study Raster CNN SimulationR. Ponalagusamy,S. Senthilkumar12.A Minimum-energy Path-preserving Topology Control Algorithm for Wireless Sensor NetworksJin-Zhao Lin,Xian Zhou,Yun Li13.Synchronization and Exponential Estimates of Complex Networks with Mixed Time-varying Coupling DelaysYang Dai,YunZe Cai,Xiao-Ming Xu14.Step-coordination Algorithm of Traffic Control Based on Multi-agent SystemHai-Tao Zhang,Fang Yu,Wen Li15.A Research of the Employment Problem on Common Job-seekersand GraduatesBai-Da Qu。
a r X i v :c o n d -m a t /0008064v 1 [c o n d -m a t .d i s -n n ] 3 A u g 2000Error and attack tolerance of complex networksR´e ka Albert,Hawoong Jeong,Albert-L´a szl´o Barab´a siDepartment of Physics,University of Notre Dame,Notre Dame,IN 46556Many complex systems display a surprising degree of tolerance against er-rors.For example,relatively simple organisms grow,persist and reproduce de-spite drastic pharmaceutical or environmental interventions,an error tolerance attributed to the robustness of the underlying metabolic network [1].Complex communication networks [2]display a surprising degree of robustness:while key components regularly malfunction,local failures rarely lead to the loss of the global information-carrying ability of the network.The stability of these and other complex systems is often attributed to the redundant wiring of the func-tional web defined by the systems’components.In this paper we demonstrate that error tolerance is not shared by all redundant systems,but it is displayed only by a class of inhomogeneously wired networks,called scale-free networks.We find that scale-free networks,describing a number of systems,such as the World Wide Web (www)[3–5],Internet [6],social networks [7]or a cell [8],display an unexpected degree of robustness,the ability of their nodes to com-municate being unaffected by even unrealistically high failure rates.However,error tolerance comes at a high price:these networks are extremely vulnerable to attacks,i.e.to the selection and removal of a few nodes that play the mostimportant role in assuring the network’s connectivity.Such error tolerance and attack vulnerability are generic properties of communication networks,such as the Internet or the www,with complex implications on assuring information readiness.The increasing availability of topological data on large networks,aided by the computer-ization of data acquisition,has lead to major advances in our understanding of the generic aspects of network structure and development[9–16].The existing empirical and theoretical results indicate that complex networks can be divided into two major classes based on their connectivity distribution P(k),giving the probability that a node in the network is connected to k other nodes.Thefirst class of networks is characterized by a P(k)that is peaked at an average k and decays exponentially for large k.The most investigated examples of such exponential networks are the random graph model of Erd˝o s and R´e nyi[9,10]and the small-world model of Watts and Strogatz[11],both leading to a fairly homogeneous network,in which each node has approximately the same number of links,k≃ k .In contrast,results on the world-wide web(www)[3–5],Internet[6]and other large networks[17–19]indicate that many systems belong to a class of inhomogeneous networks,referred to as scale-free networks,for which P(k)decays as a power-law,i.e.P(k)∼k−γ,free of a characteristic scale.While the probability that a node has a very large number of connections(k>> k ) is practically prohibited in exponential networks,highly connected nodes are statistically significant in scale-free networks(see Fig.1).We start by investigating the robustness of the two basic network models,the Erd˝o s-R´e nyi(ER)model[9,10]that produces a network with an exponential tail,and the scale-free model[17]with a power-law tail.In the ER model wefirst define the N nodes,and then connect each pair of nodes with probability p.This algorithm generates a homogeneous net-work(Fig.1),whose connectivity follows a Poisson distribution peaked at k and decaying exponentially for k>> k .The inhomogeneous connectivity distribution of many real networks is reproduced by the scale-free model[17,18]that incorporates two ingredients common to real networks: growth and preferential attachment.The model starts with m0nodes.At every timestep t a new node is introduced,which is connected to m of the the already existing nodes.The probabilityΠi that the new node is connected to node i depends on the connectivity k i ofthat node,such thatΠi=k i/jk j.For large t the connectivity distribution is a power-lawfollowing P(k)=2m2/k3.The interconnectedness of a network is described by its diameter d,defined as the av-erage length of the shortest paths between any two nodes in the network.The diameter characterizes the ability of two nodes to communicate with each other:the smaller d is,the shorter is the expected path between works with a very large number of nodes can have a rather small diameter;for example the diameter of the www,with over800million nodes[20],is around19[3],while social networks with over six billion individuals are be-lieved to have a diameter of around six[21].To properly compare the two network models we generated networks that have the same number of nodes and links such that P(k)follows a Poisson distribution for the exponential,and a power-law for the scale-free network.Error tolerance—To address the networks’error tolerance,we study the changes in the diameter when a small fraction f of the nodes is removed.The malfunctioning(absence)of a node in general increases the distance between the remaining nodes,since it can eliminate some paths that contribute to the system’s interconnectedness.Indeed,for the exponential network the diameter increases monotonically with f(Fig.2a),thus,despite its redundant wiring(Fig.1),it is increasingly difficult for the remaining nodes to communicate with each other.This behavior is rooted in the homogeneity of the network:since all nodes have approximately the same number of links,they all contribute equally to the network’s diameter,thus the removal of each node causes the same amount of damage.In contrast,we observe a drastically different and surprising behavior for the scale-free network(Fig.2a): the diameter remains unchanged under an increasing level of errors.Thus even when as high as5%of the nodes fail,the communication between the remaining nodes in the network is unaffected.This robustness of scale-free networks is rooted in their extremely inhomogeneous connectivity distribution:since the power-law distribution implies that the majority of nodes have only a few links,nodes with small connectivity will be selected with much higher probability,and the removal of these”small”nodes does not alter the path structure of the remaining nodes,thus has no impact on the overall network topology.Attack survivability—An informed agent that attempts to deliberately damage a net-work,such as designing a drug to kill a bacterium,will not eliminate the nodes randomly,but will rather target the most connected nodes.To simulate an attack wefirst remove the most connected node,and continue selecting and removing nodes in the decreasing order of their connectivity k.Measuring the diameter of an exponential network under attack,wefind that,due to the homogeneity of the network,there is no substantial difference whether the nodes are selected randomly or in decreasing order of connectivity(Fig.2a).On the other hand,a drastically different behavior is observed for scale-free networks:when the most connected nodes are eliminated,the diameter of the scale-free network increases rapidly, doubling its original value if5%of the nodes are removed.This vulnerability to attacks is rooted in the inhomogeneity of the connectivity distribution:the connectivity is ensured by a few highly connected nodes(Fig.1b),whose removal drastically alters the network’s topology,and decreases the ability of the remaining nodes to communicate with each other.Network fragmentation—When nodes are removed from a network,clusters of nodes, whose links to the system disappear,can get cut offfrom the main cluster.To better understand the impact of failures and attacks on the network structure,we next investigate this fragmentation process.We measure the size of the largest cluster,S,shown as a fraction of the total system size,when a fraction f of the nodes are removed either randomly or in an attack mode.Wefind that for the exponential network,as we increase f,S displays a threshold-like behavior such that for f>f c≃0.28we have S≃0.A similar behavior is observed when we monitor the average size s of the isolated clusters(i.e.all the clusters except the largest one),finding that s increases rapidly until s ≃2at f c,after which it decreases to s =1.These results indicate the following breakdown scenario(Fig.4):For small f,only single nodes break apart, s ≃1,but as f increases,the size of the fragments that fall offthe main cluster increases,displaying a singular behavior at f c.At f c the system practically falls apart,the main cluster breaking into small pieces,leading to S≃0,and the size of the fragments, s ,peaks.As we continue to remove nodes(f>f c),we fragment these isolated clusters,leading to a decreasing s .Since the ER model is equivalent to theinfinite dimensional percolation[22],the observed threshold behavior is qualitatively similar to the percolation critical point.However,the response of a scale-free network to attacks and failures is rather different (Fig.3b).For random failures no threshold for fragmentation is observed,rather the size of the largest cluster slowly decreases.The fact that s ≃1for most f indicates that the network is deflated by nodes breaking offone by one,the increasing error level leading to the isolation of single nodes only,not clusters of nodes.Thus,in contrast with the catastrophic fragmentation of the exponential network at f c,the scale-free network stays together as a large cluster for very high values of f,providing additional evidence of the topological stability of these networks under random failures.This behavior is consistent with the existence of an extremely delayed critical point(Fig.3),the network falling apart only after the main cluster has been completely deflated.On the other hand,the response to attack of the scale-free network is similar(but swifter)to the response to attack and failure of the exponential network(Fig.3b):at a critical threshold f sf c≃0.18,smaller than the value f e c≃0.28observed for the exponential network,the system breaks apart,forming many isolated clusters(Fig.4).While great efforts are being made to design error tolerant and low yield components for communication systems,little is known about the effect of the errors and attacks on the large-scale connectivity of the network.To demonstrate the impact of our model based studies to these systems,next we investigate the error and attack tolerance of two networks of increasing economic and strategic importance:the Internet and the www.Recently Faloutsos et al.[6]investigated the topological properties of the Internet at the router and inter-domain level,finding that the connectivity distribution follows a power-law, P(k)∼k−2.48.Consequently,we expect that it should display the error tolerance and attack vulnerability predicted by our study.To test this,we used the latest survey of the Internet topology,giving the network at the inter-domain(autonomous system)level.Indeed,wefind that the diameter of the Internet is unaffected by the random removal of as high as2.5%of the nodes(an order of magnitude larger than the failure rate(0.33%)of the Internet routers[23]),while if the same percentage of the most connected nodes are eliminated(attack),d more than triples(Fig.2b).Similarly,the large connected cluster persists for high rates of random node removal,but if nodes are removed in the attack mode,the size of the fragments that break offincreases rapidly,the critical point appearing at f I c≃0.03(Fig.3b).The www forms a huge directed graph whose nodes are documents and edges are the URL hyperlinks that point from one document to another,its topology determining the search engines’ability to locate information on it.The www is also a scale-free network:the probabilities P out(k)and P in(k)that a document has k outgoing and incoming links follow a power-law over several orders of magnitude,i.e.P(k)∼k−γ,withγin=2.1andγout=2.45 [3,4,24].Since no complete topological map of the www is available,we limited our study to a subset of the web containing325,729nodes and1,469,680links( k =4.59)[3].Despite the directedness of the links,the response of the system is similar to the undirected networks we investigated earlier:after a slight initial increase,d remains constant in the case of random failures,while it increases for attacks(see Fig.2c).The network survives as a large cluster under high rates of failure,but the behavior of s indicates that under attack the system abruptly falls apart at f w c=0.067(Fig.3c).In summary,wefind that scale-free networks display a surprisingly high degree of toler-ance against random failures,a property not shared by their exponential counterparts.This robustness is probably the basis of the error tolerance of many complex systems,ranging from cells[8]to distributed communication systems.It also explains why,despite frequent router problems[23],we rarely experience global network outages or,despite the temporary unavailability of many webpages,our ability to surf and locate information on the web is unaffected.However,the error tolerance comes at the expense of attack survivability:the diameter of these networks increases rapidly and they break into many isolated fragments when the most connected nodes are targeted.Such decreased attack survivability is useful for drug design[8],but it is less encouraging for communication systems,such as the Internet or the www.While the general wisdom is that attacks on networks with distributed resource management are less successful,our results indicate that the topological weaknesses of thecurrent communication networks,rooted in their inhomogeneous connectivity distribution, have serious effects on their attack survivability,that could be exploited by those seeking to damage these systems.REFERENCES[1]Hartwell,L.H.,Hopfield,J.J.,Leibler,S.&Murray,A.W.,From molecular to modularcell biology,Nature402,C47-C52(1999).[2]Claffy,K.,Monk,T.E.&McRobb,D.Internet tomography,Nature web matters,7January1999,</webmatters/tomog/tomog.html>.[3]Albert,R.,Jeong,H.&Barab´a si,A.-L.Diameter of the World-Wide Web,Nature401,130-131(1999).[4]Kumar,R.,Raghavan,P.,Rajalopagan,S.&Tomkins,A.Extracting large-scale knowl-edge bases from the web,Proc.25th VLDB Conf.,Edinburgh,1999.[5]Huberman,B.A.&Adamic,L.A.Growth dynamics of the World-Wide Web,Nature401,131(1999).[6]Faloutsos,M.,Faloutsos,P.&Faloutsos,C.On Power-Law Relationships of the InternetTopology,ACM SIGCOMM’99,mun.Rev.29,251-263(1999).[7]Wasserman,S.&Faust,K.Social Network Analysis(Cambridge University Press,Cam-bridge,1994).[8]Jeong,H.,Tombor,B.,Albert,R.,Oltvai,Z.&Barab´a si,A.-L.The large-scale organi-zation of metabolic networks.(preprint).[9]Erd˝o s,P.&R´e nyi,A.On the evolution of random graphs.Publ.Math.Inst.Hung.Acad.Sci.5,17-60(1960).[10]Bollob´a s,B.Random Graphs(Academic Press,London,1985).[11]Watts,D.J.&Strogatz,S.H.Collective dynamics of’small-world’networks.Nature393,440-442(1998).[12]Zegura,E.W.,Calvert,K.L.&Donahoo,M.J.A Quantitative Comparison of Graph-based Models for Internet Topology.IEEE/ACM Transactions on Networking5,770-787 (1997).[13]Cohen,J.E.,Briand,F.&Newman,munity food webs:data and theory(Springer-Verlag,Berlin1990).[14]Maritan,A.,Colaiori,F.,Flammini,A.,Cieplak,M.,&Banavar,J.Universality Classesof Optimal Channel Networks.Science272,984-986(1996).[15]Banavar,J.R.,Maritan,A.&Rinaldo,A.Size and form in efficient transportationnetworks.Nature399,130-132(1999).[16]Barth´e l´e my,M.&Amaral,L.A.N.Small-World Networks:Evidence for a CrossoverPicture.Phys.Rev.Lett.82,3180-3183(1999).[17]Barab´a si,A.-L.&Albert,R.Emergence of Scaling in Random Networks.Science286,509-511(1999).[18]Barab´a si,A.-L.,Albert,R.&Jeong,H.Mean-field theory for scale-free random net-works.Physica272A,173-187(1999).[19]Redner,S.,How popular is your paper?An empirical study of the citation distribution.Euro.Phys.J.B4,131-134(1998).[20]Lawrence,S.&Giles,C.L.Accessibility of information on the web.Nature400,107-109(1999).[21]gram,The Small-World Problem.Psychol.Today2,60-67(1967).[22]Bunde,A.&Havlin S.(editors)Fractals and Disordered Systems(Springer,New York,1996).[23]Paxson,V.End-to-End Routing Behavior in the Internet.IEEE/ACM Transactions onNetworking5,601-618(1997).[24]Adamic,L.A.The Small World Web.Lect.Notes Comput.Sci1696,443-452(1999).FIGURESFIG.1.Visual illustration of the difference between an exponential and a scale-free network. The exponential network a is rather homogeneous,i.e.most nodes have approximately the same number of links.In contrast,the scale-free network b is extremely inhomogeneous:while the ma-jority of the nodes have one or two links,a few nodes have a large number of links,guaranteeing that the system is fully connected.We colored with red thefive nodes with the highest number of links, and with green theirfirst neighbors.While in the exponential network only27%of the nodes are reached by thefive most connected nodes,in the scale-free network more than60%are,demonstrat-ing the key role the connected nodes play in the scale-free network.Note that both networks contain 130nodes and215links( k =3.3).The network visualization was done using the Pajek program for large network analysis<http://vlado.fmf.uni-lj.si/pub/networks/pajek/pajekman.htm>.0.000.010.021015200.000.010.020510150.000.020.044681012abcfdInternetwwwAttackFailureAttackFailureSFE AttackFailure FIG.2.Changes in the diameter of the network as a function of the fraction of the removed nodes.a ,Comparison between the exponential (E)and scale-free (SF)network models,each containing N =10,000nodes and 20,000links (i.e. k =4).The blue symbols correspond to the diameter of the exponential (triangles)and the scale-free (squares)network when a fraction f of the nodes are removed randomly (error tolerance).Red symbols show the response of the exponential (diamonds)and the scale-free (circles)networks to attacks,when the most connected nodes are removed.We determined the f dependence of the diameter for different system sizes (N =1,000,5,000,20,000)and found that the obtained curves,apart from a logarithmic size correction,overlap with those shown in a ,indicating that the results are independent of the size of the system.Note that the diameter of the unperturbed (f =0)scale-free network is smaller than that of the exponential network,indicating that scale-free networks use more efficiently the links available to them,generating a more interconnected web.b ,The changes in the diameter of the Internet under random failures (squares)or attacks (circles).We used the topological map of the Internet,containing 6,209nodes and 12,200links ( k =3.4),collected by the National Laboratory for Applied Network Research </Routing/rawdata/>.c ,Error (squares)and attack (circles)survivability of the world-wide web,measured on a sample containing 325,729nodes and 1,498,353links [3],such that k =4.59.012301<s > a n d S0.00.20.40120.00.20.401210-110101102f<work fragmentation under random failures and attacks.The relative size of the largest cluster S (open symbols)and the average size of the isolated clusters s (filled symbols)in function of the fraction of removed nodes f for the same systems as in Fig.2.The size S is defined as the fraction of nodes contained in the largest cluster (i.e.S =1for f =0).a ,Fragmentation of the exponential network under random failures (squares)and attacks (circles).b ,Fragmentation of the scale-free network under random failures (blue squares)and attacks (red circles).The inset shows the error tolerance curves for the whole range of f ,indicating that the main cluster falls apart only after it has been completely deflated.Note that the behavior of the scale-free network under errors is consistent with an extremely delayed percolation transition:at unrealistically high error rates (f max ≃0.75)we do observe a very small peak in s ( s max ≃1.06)even in the case of random failures,indicating the existence of a critical point.For a and b we repeated the analysis for systems of sizes N =1,000,5,000,and 20,000,finding that the obtained S and s curves overlap with the one shown here,indicating that the overall clustering scenario and the value of the critical point is independent of the size of the system.Fragmentation of the Internet (c )and www (d ),using the topological data described in Fig.2.The symbols are the same as in b .Note that s in d in the case of attack is shown on a different scale,drawn in the right side of the frame.While for small f we have s ≃1.5,at f w c=0.067the average fragment size abruptly increases,peaking at s max ≃60,then decays rapidly.For the attack curve in d we ordered the nodes in function of the number of outgoing links,k out .Note that while the three studied networks,the scale-free model,the Internet and the www have different γ, k and clustering coefficient [11],their response to attacks and errors is identical.Indeed,we find that the difference between these quantities changes only f c and the magnitude of d ,S and s ,but not the nature of the response of these networks to perturbations.f≈0.05f≈0.18f≈0.45 FIG.4.Summary of the response of a network to failures or attacks.The insets show the cluster size distribution for various values of f when a scale-free network of parameters given in Fig.3b is subject to random failures(a-c)or attacks(d-f).Upper panel:Exponential networks under random failures and attacks and scale-free networks under attacks behave similarly:for small f clusters of different sizes break down,while there is still a large cluster.This is supported by the cluster size distribution:while we see a few fragments of sizes between1and16,there is a large cluster of size9,000(the size of the original system being10,000).At a critical f c(see Fig.3)the network breaks into small fragments between sizes1and100(b)and the large cluster disappears. At even higher f(c)the clusters are further fragmented into single nodes or clusters of size two. Lower panel:Scale-free networks follow a different scenario under random failures:The size of the largest cluster decreases slowly asfirst single nodes,then small clusters break off.Indeed,at f=0.05only single and double nodes break off(d).At f=0.18,when under attack the network is fragmented(b),under failures the large cluster of size8,000coexists with isolated clusters of size1through5(e).Even for unrealistically high error rate of f=0.45the large cluster persists, the size of the broken-offfragments not exceeding11(f).。
电力线的点云聚类方法Point cloud clustering is an important and challenging task in various fields, including the analysis of power lines. 电力线的点云聚类是各种领域中重要且具有挑战性的任务。
One perspective to consider in addressing the point cloud clustering problem for power lines is the use of advanced machine learning and deep learning techniques. This involves leveraging algorithms such as k-means clustering, DBSCAN, or hierarchical clustering to extract meaningful patterns and structures from the point cloud data. Additionally, deep learning methods like convolutional neural networks (CNNs) and recurrent neural networks (RNNs) can be employed to further improve the accuracy and efficiency of power line point cloud clustering. 一种应对电力线点云聚类问题的角度是使用先进的机器学习和深度学习技术。
这涉及利用k均值聚类、DBSCAN或分层聚类等算法从点云数据中提取有意义的模式和结构。
此外,还可以采用卷积神经网络(CNN)和循环神经网络(RNN)等深度学习方法,以进一步提高电力线点云聚类的准确性和效率。
第45卷第3期2019年6月兰州理工大学学报Journal of Lanzhou University of TechnologyVol.45No.3Jun.2019文章编号:1673-5196(2019)03-0101-07聚类系数指标对复杂网络鲁棒性的影响分析卢鹏丽1,董瑚1,曹乐2(1.兰州理工大学计算机与通信学院,甘肃兰州730050; 2.天水师范学院电子信息与电气工程学院,甘肃兰州741000)摘要:分析了采用度分布相同且聚类系数不同的三种类型网络(中性网络、同配网络和异配网络)在遇到随机故障或者蓄意攻击时,网络的初始聚类系数变化对网络鲁棒性的影响.实验分析表明,网络的初始聚类系数越大,网络在受到随机故障或蓄意攻击时网络中最大连通子图的直径和网络中最大连通子图的平均路径长度的起伏也就越大.初始聚类系数的变化在异配网中对网络鲁棒性的作用最明显,中性网次之,对同配网的鲁棒性不明显.关键词:复杂网络;鲁棒性;聚类系数中图分类号:TP202文献标志码:AAnalysis of influence of clustering coefficient as itsindex on robustness of complex networkLU Peng-li1,DONG Men1,CAO Le2(1.College of Computer and Communication,Lanzhou Univ,of Tech.,Lanzhou730050,China; 2.School of Electronic Information and Electrical Engineering,Tianshui Normal University,Tianshui741000,China)Abstract:The complex networks can be divided into three types according to chaining rules of their nodes,namely neutral network,assortative network,and hetero-assortative network.In this paper,three types of network with identical degree distribution and different clustering coefficient are used to analyze the influence of their initial clustering coefficient on their robustness when they are subjected to random failure and deliberate attack.Experimental analysis shows that the larger the initial clustering coefficient of the network is,the larger the fluctuation of the diameter and average path length of the maximum connected subgraph in network will be when the network is subj ected to random failures or deliberate attacks. And the effect of initial clustering coefficient in hetero-assortative network on the network robustness will be most obvious9the effect will be less for neutral network9and there will be no obvious effect for assortative network.Key words:complex network;robustness;clustering coefficient大数据在人们生活中扮演的角色越来越重要,复杂网络和复杂系统也得到人们进一步的重视•生活中的各种复杂系统都可以抽象作为复杂网络,复杂网络中节点数目众多,节点与节点之间的关系也千差万别•复杂网络的一项研究领域是网络部分结构失效对网络整体结构和功能的影响⑴,称为鲁棒性分析.Albert等⑵分析了小世界网(WS模型)和无标度网(EA模型)在遭到蓄意攻击或随机故障时的网收稿日期:2017-09-27基金项目:国家自然科学基金(11361033)作者简介:卢鹏丽(1973-),女,甘肃酒泉人,博士,教授.络鲁棒性,并对万维网的鲁棒性进行了分析•结果显示小世界网在蓄意攻击和随机故障两种情况下的鲁棒性差异不是很大,无标度网和万维网对于随机故障的鲁棒性明显优于对蓄意攻击的鲁棒性,主要原因是两种网络的结构分布差异较大.Paolo等⑶建立了一种基于动态方法的模型,在动态模型下对WS小世界网和EA无标度网进行鲁棒性分析,提出了无标度网的不均匀性・Liu等⑷对中国九江炼油系统进行了鲁棒性分析,得出真实系统中具有均匀分布的网络鲁棒性更高.Bansanl等⑸提出了同配网络、异配网络和中性网络的概念,并分析了三种网络的鲁棒性.Schultz等⑹提出变量梯度法对复杂・102・兰州理工大学学报第45卷网络进行稳定性的判断・Iyer等⑺除了采用介数中心性,还加入了紧密度和特征向量等全局指标,分析合成网络和真实网络遭到随机故障和蓄意攻击时的鲁棒性.已有的文献多是对于复杂网络最大连通度的分析,本文主要采取最大连通子图的直径和最大连通子图的平均路径长度作为衡量标准⑻,全面分析了具有相同度分布且聚类系数不同的中性网络、异配网络和同配网络的鲁棒性•复杂网络的随机故障和蓄意攻击在文献[9-11]中已经有详细的描述,本文重点分析聚类系数在不同网络攻击中的表现.1基本概念G(V,E)表示一个无向无权的简单网络,其中V ={“,巳2,•・•,"}表示G中节点的集合;E{(v i9Vj)I3伯GV}是G中边的集合,且|V|=〃|E|=m;A是其对应的邻接矩阵,如果节点s和口之间有边存在,则其元素Aij=\,否则Aij=0.定义1(网络的直径D)—般定义两节点G汀)间的最短距离心[⑵为连接两者的最短路径的边的数目;网络的直径为所有两点间的最大距离,记为D:13],即:D=max(1)(心)定义2(平均路径长度L)网络的平均路径长度L是所有节点对之间距离的平均值,即:L=——--------工右(2)y N(N—1)3其中:N为网络节点的总数目;平均路径长度L:13]描述网络中节点间的离散程度.定义3(聚类系数C)聚类系数C用来描述网络中节点的聚集情况,即网络有多紧密•一般地,假设网络中的一个节点i通过局条边与其他节点相连接虫是节点z的邻居节点数目•如果局个节点之间互相连接,它们之间存在局(化一1)/2条边,而这局个节点之间实际存在的边数£与总的可能存在边数之比就是节点,的聚类系数G,即:G=怂(铝1)(3)一个网络的聚类系数a⑶就是网络中所有节点的聚类系数的平均值,即:C气%⑷显然有O<C<1,只有在全连通网络中,聚类系数才能等于1,通常情况下一般均小于1.在完全随机网络中,C〜NT,其中N为网络节点的总数目.定义4(最大连通度&喚)最大连通度Gnax M 是指当网络受到攻击或者干扰时,在所剩仍具有连接能力网络中,其中所含节点数目最多的子网络中的节点数占所剩下节点数目的比例,即:其中:是最大连通子图的节点个数;N'是所有连通子图的节点数总和.2复杂网络的鲁棒性分析2.1复杂网络的结构对于一个复杂网络,如果网络中连接度大的节点总是倾向于与连接度大的节点连接,那么这种网络称为同配网络;如果网络中连接度大的节点总是倾向于与连接度小的节点连接,那么这种网络称为异配网络;如果网络中两个节点之间是否有边相连与这两个节点的连接度无关,那么这种网络称为中性网络•图1〜3形象地描述了中性网络、同配网络和异配网络在受到蓄意攻击和随机故障后网络的连通状况的仿真结果•其中蓄意攻击是指网络中的特定节点(即关键节点)发生故障以后网络的连通情况,而随机故障是指网络中任意节点发生故障以后网络的连通情况.(C)中性网随机故障图1中性网在受到蓄意攻击或随机故障前后的连通状态Fig.1Connective state of neutral network before andafter intentional attack or random fault通过仿真结果的对照可知,蓄意攻击对网络连通度的影响明显大于随机故障对网络连通度的影响.中性网络节点之间的连接并无明确的规律,故对抗蓄意攻击和随机故障时表现出很大的不明确性.第3期卢鹏丽等:聚类系数指标对复杂网络鲁棒性的影响分析・103・同配网中关键节点总是相互连接在一起,故同配网络在蓄意攻击时显得异常脆弱•而异配网在蓄意攻击时显示出很强的健壮性.(b)同配网蓄意攻击(c)同配网随机故障图2同配网在受到蓄意攻击或随机故障前后的连通状态Fig.2Connective state of assortative network before and after intentional attack or random fault(b)异配网蓄意攻击图3异配网在受到蓄意攻击或随机故障前后的连通状态Fig.3Connective state of hetero-assortative network before and after intentional attack or random fault对多数实际网络进行研究显示,互联网以及蛋白质交换网络等生物网络是异配网络,而人际关系网以及电影演员合作网络等许多现实网络是同配网络,包括复杂网络中著名的无标度网络也属于同配网络•而不同的在线社会网络可能是同配、异配或者中性网络•例如包含7亿多节点的Facebook网络呈现出同配性特征,大型在线社交网络Cyworld却是异配网络⑸.2.2复杂网络的鲁棒性对于现实中的复杂系统,总是希望复杂系统拥有一定的鲁棒性,也就是复杂系统对外界的各种干扰具备一定的抗干扰能力•在实际生活中,系统面临各种各样的主观或者客观的干扰是不可避免的,鲁棒性和脆弱性分别是从稳定指标与失效指标的角度来表征网络的特性,两者相辅相成•鲁棒性越大,其脆弱性就越小,即抗毁能力越强;鲁棒性越小,其脆弱性越大,即抗毁能力越弱.先前的各种鲁棒性分析中都围绕着网络的最大连通度进行•网络的鲁棒性通常与网络的最大连通子图有关,所以网络中最大连通子图的直径和平均路径长度是网络鲁棒性分析的指标.2.3算法介绍复杂网络由于节点众多且结构复杂,网络在构造时很难出现构造的两个网络结构一样的情况,往往构造出来的网络结构之间有较大的差异•为了更准确地分析聚类系数指标对复杂网络鲁棒性的影响,本文选取待分析网络时让待分析网络具有相同的节点度分布,使得构造出的网络之间结构差异较小•网络都由I000个节点度已知情况下的节点,根据同配网、异配网和中性网的连接规律,将节点连接成所对应的同配网、异配网和中性网•为确保生成网络聚类系数的一般性,根据以上网络生成规则,生成100组同配网、异配网和中性网,并对它们的初始聚类系数进行了统计•统计发现节点数为I000的中性网络,初始聚类系数主要分布在0.001到0.003之间,同配网的初始聚类系数主要分布在0.008到0.012之间,异配网的初始聚类系数主要分布在0.0015到0.0025之间,故实验中采用了具有特殊初始聚类系数的网络作为待分析网络.本文主要采取网络的最大连通子图的直径和最大连通子图的平均路径长度作为衡量标准,全面地分析了具有相同度分布且聚类系数不同的中性网络、异配网络和同配网络的鲁棒性,攻击方式分为随机故障和蓄意攻击•算法如下:1)随机生成具有I000个节点的网络,计算网络的度分布.2)根据随机网络的度分布,对网络进行重连,生成多组相应的同配网络、中性网络和异配网络.3)计算多组同配网络、异配网络和中性网络的聚类系数,并在同一种网络中取出三组聚类系数不同的网络,作为待分析网络.・104・兰州理工大学学报第45卷4)分别按照随机故障和蓄意攻击两种方式确定需要在待分析网络中删除的节点,随机故障时随机选取节点进行删除,蓄意攻击时选取节点度较大的节点优先进行删除.同时将待删除节点以及待删除节点所连接的边删除.5)判断当前网络的最大连通子图,计算f、D 和L.其中J为受到攻击时节点数与原网络节点数的比值Q为网络受到攻击后最大子图的直径丄为网络受到攻击后最大子图的平均最短路径.6)计算待分析网络中的节点数•若节点数为0,则进行下一步,否则返回步骤4.7)算法结束.3实验与分析实验结果分别如图4〜6所示,其中L为当前最大连通子图的平均路径长度,D为当前最大连通子图的直径.图4分别为初始聚类系数为0.001、0.002和0.003的中性网络在随机故障和蓄意攻击时网络中L和D的变化情况•图5分别为初始聚类系数为0.008,0.010和0.012的同配网络在受到随机故障和蓄意攻击时网络中L和D的变化情况•图6分别为初始聚类系数为0・0015、0・0020和0.0025的异配网络在受到随机故障和蓄意攻击时网络中L 和D的变化情况.3.1中性网络图4a比较了三种中性网络在受到随机故障时网络中D的变化情况•在丢失少量节点时,网络中D变化不明显.初始聚类系数越大的中性网络,D的起伏越大•图4b比较了三种中性网络在受到随机故障时网络中L的变化情况•图4c比较了三种中性网络在受到蓄意攻击时网络中D的变化情况,且初始聚类系数越大的网络,D越先出现起伏现象.图4d比较了三种中性网络在受到蓄意攻击时网络中L的变化情况,相比于网络随机故障,初始聚类系数越小的网络在被攻击时所产生的L的最大值要高于初始聚类系数大的网络.根据以上分析得出,当移除节点数目较少时,无论是随机故障还是蓄意攻击,网络的D和L都呈现出一个缓慢增值的趋势,但在移除节点数目到达一定数量时,D和L的变化明显,蓄意攻击在移除节点40%左右出现浮动,随机故障在移除节点60%左右出现浮动,蓄意攻击对网络的破坏明显大于随机故障•中性网络在少量节点丢失时,网络最大子图的直径与平均最短路径都缓慢地增长•但在大量节点丢失时,网络的D和L都发生剧烈的变化•这是由于中性网络的不确定性造成的,中性网络中节点之间的连边没有什么明确的关系,在受到大量节点丢失时,节点之间的离散程度明显变化很大,且聚类系数越大的中性网络,在丢失节点后网络中的D和L 越大,节点间的离散程度越高,网络的鲁棒性越差.目M画中V*鴉屋移除节点百分比(a)随机故障时的D(b)随机故障时的厶目M画中V*鴉屋移除节点百分比(c)蓄意攻击时的D(d)蓄意攻击时的厶图4三种初始聚类系数不同的中性网络在受到攻击时网络中最大连通子图中的最大直径和平均最短路径变化情况Fig.4The maximum diameter and average shortest path change in the most Dalian subgraph of the neutralnetwork with three initial clustering coefficients inthe network underattack第3期卢鹏丽等:聚类系数指标对复杂网络鲁棒性的影响分析• 105 •1412108 6 4 2目M 画中V *鴉屋移除节点百分比(a)随机故障时的DO0.1 0.2 0.3 0.4 0.5 0.6 0.7 0.8 0.9 1.0移除节点百分比(a)随机故障时的D移除节点百分比(b)随机故障时的厶■■■■■■■ O6 5 4 3 2 1移除节点百分比(b)随机故障时的厶粗M 画中V *鴉屋粗M 画中V *鴉屋— 0.001 5——0.002 0一 0.002 5移除节点百分比(c)蓄意攻击时的D0 0.1 0.2 0.3 0.4 0.5 0.6 0.7 0.8 0.9 1.0移除节点百分比(c)蓄意攻击时的D移除节点百分比移除节点百分比(d)蓄意攻击时的厶(d)蓄意攻击时的厶图5三种初始聚类系数不同的同配网络在受到攻击时网络中最大连通子图中的最大直径和平均最短路径变化情况Fig. 5 the maximum diameter and average shortest pathchange of the most Dalian pass subgraph in the as sortative network under three different initial clus tering coefficients when attacked3.2同配网络同配网络的D 和L 在随机故障中体现出很高的稳定性•在丢失大量节点之前,D —直保持着一个图6三种初始聚类系数不同的异配网络在受到攻击时网络中最大连通子图中的最大直径和平均最短路径变化情况Fig. 6 The maximum diameter and average shortest pathchange of the most Dalian pass subgraph in thedisassortative network under three different initialclustering coefficients when attacked稳定的状态•随着丢失节点数目的增加(在丢失节点数50%时)网络中最大连通子图的直径才有微弱的 变化,且初始聚类系数越大的同配网络,直径的起伏・106・兰州理工大学学报第45卷越大•在丢失节点数75%左右时,网络被分割为大量小碎片,直径剧烈下降•这是由于同配网络中连接度大的节点优先与连接度大的节点连接,这种网络结构类似于无标度网,所以同配性网络在随机故障时,网络的D和L都呈现出一种稳定的态势.且初始聚类系数越大,网络在随机故障时出现的直径最大值越高,网络的离散程度越高•同配网络在遭到蓄意攻击时,网络的D和L变化剧烈,且在丢失节点占比35%左右时就出现明显的变化,所产生的D和L的最大值都远高于同配网络在受到随机故障时所产生的D和L.在同配网中初始聚类系数越大,网络中D和L的浮动越大,节点间的离散程度越高,网络的鲁棒性越差.3.3异配网络图6a比较了三种异配网络在受到随机故障时网络中D的变化情况.图6b比较了三种异配网络在受到随机故障时网络中L的变化情况•图6c比较了三种异配网络在受到蓄意攻击时D的变化情况.图6d比较了三种异配网络在受到蓄意攻击时,网络中L的变化情况•初始聚类系数越大,异配网络在遭到蓄意攻击时网络的直径起伏越大.异配网络的D和L在随机故障中体现的相对较稳定•在丢失大量节点前,网络的D和L—直保持着一个相对稳定的状态,但有小的起伏•随着丢失节点数目的增加(在丢失节点的数60%左右时)网络中的最大连通子图的直径开始剧烈下降,且下降的程度与初始的聚类系数无关•异配网络在少量的节点遭到蓄意攻击时,网络的最大连通子图的直径缓慢增长,在移除节点占比50%左右时,直径明显地增长,且初始聚类系数越大的网络直径的变化越大•网络的最大连通子图的平均最短路径呈现出一种缓慢增加的趋势,在移除节点占比60%左右时出现极值,平均路径长度开始缓慢下降•在异配网络的蓄意攻击中可以明显地看出聚类系数对网络中D 和L的影响较大,聚类系数越大的异配网D和L的变化越明显,节点间的离散程度越高,网络的鲁棒性越差.3.4综合分析中性网络和异配网络的初始网络直径都在9左右,初始平均路径长度都在5左右,且不会随着初始聚类系数的变化而发生变换.同配网的初始网络直径和初始平均路径长度相对较大,初始直径在22左右,初始平均路径长度在8.10左右,也不会随着初始聚类系数的变化而改变.由表1分析可知,在度分布相同的情况下,同配网的初始聚类系数明显大于中性网和异配网,中性网和异配网的初始聚类系数相似•为了进一步分析聚类系数指标对不同系统的鲁棒性的影响,取初始聚类系数相同的中性网和异配网进行比较.图7为移除节点百分比(b)随机故障时的厶目M画中V*鴉屋161412108642—•中性网络-一异配网络00.10.20.30.40.50.60.70.80.9 1.0移除节点百分比(d)蓄意攻击时的厶图7相同聚类系数的中性网和异配网在受到攻击时网络中最大连通子图中的最大直径和平均最短路径变化情况Fig.7The maximum diameter and the average shortest path change in the most Dalian pass graph in the networkwhen the neutral network and the disassortative network with the same clustering coefficients are attacked第3期卢鹏丽等:聚类系数指标对复杂网络鲁棒性的影响分析・107・表1三种不同网络在不同聚类系数下网络的初始直径和初始聚类系数Tab.1Initial diameter and initial clustering coefficient of three different networks under different clusteringcoefficients网络类型初始聚类系数初始直径初始路径长度0.00110 5.20中性网0.0029 5.450.00310 5.460.00820&10同配网0.01022&160.01224&140.00159 4.93异配网0.002010 4.890.00259 4.87初始聚类系数都为0.002的中性网和异配网在受到随机故障和蓄意攻击时网络中L和D的变化情况.图7a比较了中性网络和异配网络在受到随机故障时网络中D的变化情况.图7b比较了中性网络和异配网络在受到随机故障时网络中L的变化情况•图7c比较了中性网络和异配网络在受到蓄意攻击时D的变化情况.图7d比较了中性网络和异配网络在受到蓄意攻击时,网络中L的变化情况.图7中网络的节点数目、节点度分布和初始聚类系数都相同,只因为节点之间连线的方式存在差异就使得网络的鲁棒性有着巨大的差异.由以上分析可知,聚类系数越大,网络中D和L的起伏越大,网络的鲁棒性越差•对于异配网,初始聚类系数对网络受到随机故障和蓄意攻击时的影响最大,中性网络次之,同配网络虽然有很大初始聚类系数,却在随机故障和蓄意攻击时对其最大连通子图的直径和平均路径长度都没有很大的影响.4结语通过分析聚类系数对复杂网络中最大连通子图的直径和平均路径长度的影响可知•在度分布相同的情况下,聚类系数越大,网络的鲁棒性越差•且聚类系数在不同的网络中所体现出作用的大小也不同,在异配网中聚类系数对网络的鲁棒性的作用明显,中性网次之,同配网中受到聚类系数的影响最小•除聚类系数对网络中最大连通子图的直径和最大连通子图的平均路径长度的影响外,聚类系数对网络中其他相关方面的影响将来需要做进一步的研究和验证.参考文献:[1]PATEL S J,PATTEWAR T M.Software birthmark basedtheft detection of JavaScript programs using agglomerative clustering and frequent subgraph minming[C]//Embedded System(ICES),2014International Conference on.[S.1.]:IEEE,2014.[2]ALBERT R,JEONG H,SI A L.Error and attack tolerance ofcomplex networks[J].Nature,2000,406(4):378-382.[3]CRUCITTI P,LATORA V,MARCHIORI Error andattack tolerance of complex networks[J].Physica A,2004,340:388-397.[4]LIU Suyu,RONG Gang.Analysis on refinery system as a complex task-resource network[J].Chinese Journal of Chemical Engineering,2013,21(3):253-262.:5]毛凯.复杂网络结构的稳定性与鲁棒性研究m.计算机科学,2015,42:85-88.[6]MAO J,GAO J,LIU Y.Power allocation over finding cognitiveMIMO channels:an ergodic capacity perspective[J].Trans Veh Technol,2016,61:1162-1173.[7]陆靖桥,傅秀芬,蒙在桥.复杂网络的鲁棒性与中心性指标的研究[J1计算机应用与软件,2016,33:302-310.[8]MYLES G,COLLBERG C.Softwate watermarking via opaquepredicates:Implementation analysis and attacks[J].Electronic Commerce Research,2006,6(2):155-171.[9]MYLES G,COLLBERG C,HEIDEPEIEM Z,et al.The evaluation of two software watermaking algorithms[J].Software:Practice and Experience,2015,35(10):923-938.[10]MELIAN C J,BASCOMPTE plex netwokrs:two waysto be robust[J].Ecology Letters,2010,5(6):705-70& [11]刘飞飞,蔺靖娜,刘潇潇.基于贝叶斯复杂网络的复杂网络攻击方法研究[J].计算机工程与应用,2017(53):18-25. [12]CHRISTIAN S.Shortest-path queries in static networks[J].ACM Computing Surveys,2014,46(4):1-31.[13]刘宏鲍,周涛.中国城市航空网络的实证研究与分析[J].物理学报,2007,56(5):106-112.[14]刘一奎,刘天琪,李茜,等.一种高聚类系数的无标度网络演化模型[J].网络安全技术与应用,2015(1):55-56.。

robustnessRobustnessIntroduction:Robustness is a fundamental concept in various fields, including engineering, computer science, and biology. It refers to the ability of a system or organism to withstand and adapt to changing conditions, disturbances, or uncertainties. In this document, we will explore the concept of robustness, its significance in different domains, and strategies to enhance it.1. Importance of Robustness:Robustness plays a crucial role in ensuring the stability, reliability, and efficiency of systems. In engineering, it is essential to design robust structures and machines that can endure extreme conditions without significant damage. For example, in civil engineering, structures like buildings and bridges must be robust enough to withstand earthquakes, heavy winds, and other external forces.Similarly, in computer science, robustness is critical for ensuring the resilience and availability of software systems.Robust software is capable of handling unexpected user inputs, recovering from errors, and preventing crashes or system failures. This is especially important in mission-critical systems such as aviation, healthcare, and financial sectors.2. Factors Affecting Robustness:Various factors contribute to the robustness or vulnerability of a system. One crucial factor is redundancy, which involves duplicating critical components or functionalities. Redundancy can provide backup mechanisms that help the system to continue functioning even if some parts fail. For example, in electric power distribution systems, redundancy is employed to minimize the impact of a single point of failure.Another factor is adaptability, which refers to the system's ability to adjust its behavior or configuration in response to changing conditions. Adaptive systems can detect deviations, learn from them, and modify their strategies accordingly. This adaptability is particularly important in dynamic environments, such as autonomous vehicles navigating through traffic or robotics systems faced with unpredictable scenarios.Furthermore, fault tolerance is a measure of a system's ability to continue operating even when certain components orprocesses fail. Fault-tolerant systems utilize mechanisms such as error detection, error recovery, and error correction to prevent complete system failures. These techniques are commonly employed in communication networks, where the failure of individual nodes should not disrupt the entire network.3. Enhancing Robustness:There are several strategies that can be employed to enhance the robustness of a system or organism:a. Redundancy: Introducing redundancies in critical components or processes can provide backup mechanisms to ensure continuous operation. Redundancy can be achieved through component duplication, introducing backup systems, or implementing failover mechanisms.b. Testing and Validation: Thorough testing and validation processes can help identify vulnerabilities and weaknesses in a system. By subjecting the system to various testing scenarios and analyzing its responses, developers can strengthen the system's resilience and prepare it for unexpected challenges.c. Error Handling and Recovery: Implementing robust error handling and recovery mechanisms is crucial for preventing system failures. Techniques such as exception handling, error logging, and graceful degradation can help the system recover from errors in a controlled manner while minimizing the impact on its overall operation.d. Adaptive Control: Adaptive control strategies enable the system to continuously monitor its performance and make real-time adjustments to optimize its behavior. This can involve algorithms that learn from past experiences, machine learning techniques, or feedback control systems that adjust parameters based on environmental changes.e. Security Measures: Enhancing the security of a system can significantly contribute to its robustness. Implementing secure authentication protocols, encryption algorithms, and access control mechanisms can safeguard the system against various threats and minimize vulnerabilities.Conclusion:Robustness is a vital characteristic that ensures the stability, reliability, and adaptability of systems in various domains. By incorporating redundancy, adaptability, fault tolerance, testing/validation, error handling, and security measures,system developers can enhance robustness and ensure optimal performance even under challenging conditions. As technology continues to advance, robustness will remain a critical consideration in designing and managing complex systems.。

仿真花不同类型的英文术语在仿真领域中,有许多不同类型的英文术语。
下面是一些常见的术语及其解释:1. Simulation (仿真): The imitation or representation of the operation or features of one system through the use of another system, typically a computer program. It is used to study, analyze, and predict the behavior of complexreal-world systems.2. Virtual Reality (虚拟现实): A computer-generated simulation of a three-dimensional environment that can be interacted with and experienced by a person. It typically involves the use of a head-mounted display and other sensory devices to create a sense of presence in thevirtual world.3. Augmented Reality (增强现实): An interactive experience that combines real-world elements with computer-generated sensory inputs, such as graphics, sound, or GPSdata. It enhances the user's perception of the real world by overlaying digital information onto the physical environment.4. Agent-based Modeling (基于代理的建模): A simulation technique that models the behavior of individual agents or entities and their interactions within a system. Agents can represent individuals, organizations, or other entities, and their behavior is governed by predefined rules or algorithms.5. Monte Carlo Simulation (蒙特卡洛仿真): A statistical technique that uses random sampling to model and analyze the behavior of complex systems. It is particularly useful for assessing the risk and uncertainty associated with decision-making processes.6. Discrete Event Simulation (离散事件仿真): A simulation technique that models the behavior of a system as a sequence of discrete events in time. It is commonly used to study systems with dynamic, time-dependent processes, such as manufacturing systems or transportationnetworks.7. Continuous Simulation (连续仿真): A simulation technique that models the behavior of a system as a continuous function of time. It is often used to study systems with continuous, time-dependent processes, such as fluid dynamics or electrical circuits.8. Sensitivity Analysis (敏感性分析): A technique used to assess the impact of changes in input parameters or assumptions on the output of a simulation model. It helps identify the most influential factors and understand the robustness of the model.9. Validation (验证): The process of comparing the behavior of a simulation model to the real-world system it represents. It involves verifying that the model accurately reproduces the observed behavior and meets the intended objectives.10. Optimization (优化): The process of finding the best possible solution to a problem within a given set ofconstraints. In simulation, optimization techniques are often used to identify the optimal configuration or parameter values that maximize or minimize a certain objective.这些术语涵盖了仿真领域的一些关键概念和技术。


基于社团划分的复杂网络级联抗毁攻击策略作者:丁超姚宏杜军彭兴钊李浩敏来源:《计算机应用》2014年第06期摘要:为研究在社团划分基础上复杂网络的级联抗毁攻击策略,采用节点及其邻居节点介数定义初始负荷,这种定义方式综合考虑了节点的信息,采用局部择优分配策略处理故障节点负荷,研究了网络耦合强度,WS(WattsStrogatz)小世界网络、BA(BarabásiAlbert)无标度网络、ER(ErdsRényi)随机网络、局域世界(WL)网络在社团划分攻击策略下抗毁性,以及不同攻击策略下具有重叠和非重叠社团结构网络的抗毁性。
仿真结果表明,网络的耦合强度与抗毁性成负相关;不同类型网络在快速分裂算法识别社团前提下,攻击介数最大节点时网络抗毁性最弱;具有重叠社团结构的网络在集团渗流算法(CPM)识别后,采用攻击重叠部分介数最大节点的策略时网络抗毁性最弱。
结论表明采用社团划分的攻击策略可以最大规模破坏网络。
关键词:攻击策略;社团划分;复杂网络;级联抗毁性;网络模型中图分类号: TP393;N945.1文献标志码:A6 结语级联故障普遍存在现实网络中,研究网络的攻击策略对网络抗毁性的影响对于有效打击敌方网络,指导我方网络建设提高网络抗毁性具有重要意义。
本文提出了一种基于社团划分的网络级联抗毁攻击策略,节点初始负荷根据节点及其邻居节点介数定义的“负荷容量”模型,故障负荷分配方式采用局部择优策略。
仿真分析了网络的负荷分配指数对抗毁性的影响,结果表明当α=1时网络的抗毁性最强。
研究分析了WS、BA、ER、WL四种网络模型在社团划分下的攻击策略,重点研究了具有重叠和非重叠社团结构网络的抗毁攻击策略,仿真结果表明基于社团划分的蓄意攻击策略在四种网络模型中均具有较好攻击效果。
研究了社团结构参数对网络抗毁性的影响,结果表明网络的耦合强度与抗毁性成正相关。
在非重叠社团网络中首先快速实现社团划分,然后分社团攻击介数最大的节点取得了最好的攻击策略;在重叠社团结构网络中,实现社团划分后蓄意攻击重叠部分介数最大的节点,然后分社团攻击介数最大节点为最有效网络攻击策略。

英语作文-重大工程项目成功背后的技术支持In the realm of monumental engineering projects, success is not merely a product of grand vision or meticulous planning, but also hinges crucially on the technical underpinnings that support these endeavors. Whether constructing a skyscraper that defies gravity, a bridge that spans oceans, or a complex network of tunnels threading through rugged terrain, the ultimate achievement of these feats is fundamentally rooted in the robustness and innovation of their technical foundations.The backbone of any major engineering project lies in its technical infrastructure. This encompasses a vast array of disciplines, from structural engineering and materials science to advanced computing and environmental analysis. Each facet contributes uniquely to ensuring the project's viability and success. For instance, in the construction of high-rise buildings, engineers must meticulously calculate load distributions, wind resistance, and seismic stability to guarantee both safety and longevity.Moreover, the advent of cutting-edge technologies has revolutionized the landscape of engineering projects. Computer-aided design (CAD) software allows for precise modeling and simulation, enabling engineers to foresee potential challenges and optimize designs before construction commences. This preemptive approach not only minimizes risks but also enhances efficiency, reducing both time and costs associated with the project.In the realm of infrastructure development, particularly in transportation networks, technological advancements have facilitated the creation of bridges and tunnels that seamlessly integrate with their natural surroundings while accommodating heavy traffic flows. Advanced materials such as carbon fiber composites and high-strength alloys have expanded the possibilities of construction, enabling engineers to build structures that are both lightweight and resilient.Furthermore, the role of information technology cannot be overstated in modern engineering projects. Real-time monitoring systems equipped with sensors provide continuous feedback on structural health and performance, allowing for proactivemaintenance and timely interventions. This proactive approach not only extends the lifespan of infrastructure but also enhances safety standards, ensuring public trust and confidence in the completed project.Beyond physical structures, the success of major engineering projects also hinges on sustainable practices and environmental stewardship. The integration of renewable energy sources, such as solar and wind power, into the design of buildings and infrastructure reduces carbon footprints and promotes energy efficiency. Similarly, initiatives like green roofs and rainwater harvesting systems contribute to mitigating urban heat islands and alleviating strain on municipal water resources.In conclusion, the realization of major engineering projects is a testament to human ingenuity and technical prowess. It is the harmonious convergence of innovative design, rigorous analysis, and meticulous execution that defines their success. By embracing the ultimate in technological advancements and sustainable practices, engineers not only shape the physical landscape but also pave the way for a more resilient and interconnected world. Thus, behind every towering skyscraper, sprawling bridge, and intricate tunnel lies a symphony of technical support that transforms visionary concepts into tangible realities for generations to come.。
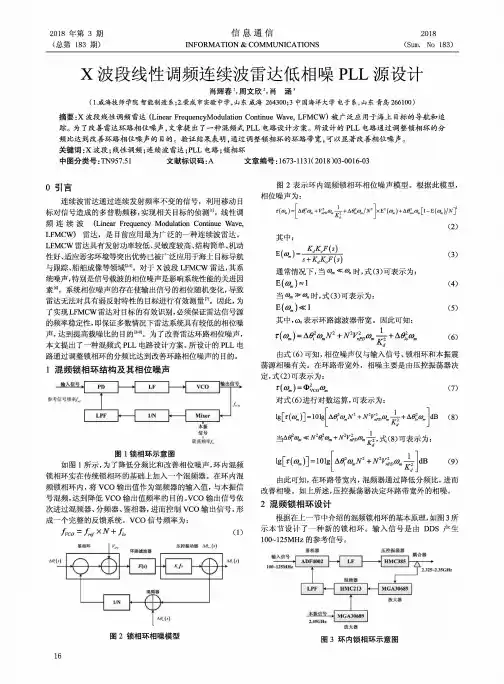
2018年第3期 (总第183期)f e息通信INFORMATION&COMMUNICATIONS2018(Sum. N o 183)X波段线性调频连续波雷达低相噪P L L源设计肖辉春S周文欣2,肖涵3(1.威海技师学院智能制造系;2.荣成市实验中学,山东威海264300;3中国海洋大学电子系,山东青岛266100)摘要:X波段线性调频雷达(Linear FrequencyModulation Continue Wave,LFMCW)被广泛应用于海上目标的导航和追踪。
为了改善雷达环路相位噪声,文章提出了一种混频式P L L电路设计方案。
所设计的P L L电路通过调整锁相环的分 频比达到改善环路相位嗓声的目的。
验证结果表明,通过调整锁相环的环路带宽,可以显著改善相位嗓声。
关键词:X波段;线性调频;连续波雷达;P L L电路;锁相环中图分类号:TN957.51 文献标识码:A文章编号:1673-1131(2018)03-0016-03〇引言连续波雷达通过连续发射频率不变的信号,利用移动目 标对信号造成的多普勒频移,实现相关目标的侦测[1]。
线性调 频连续波(Linear Frequency Modulation Continue Wave, LFMCW)雷达,是目前应用最为广泛的一种连续波雷达。
LFM C W雷达具有发射功率较低、灵敏度较高、结构简单、机动 性好、适应恶劣环境等突出优势已被广泛应用于海上目标导航 与跟踪、船舶成像等领域[2_5]。
对于X波段LFM C W雷达,其系 统噪声,特别是信号载波的相位噪声是影响系统性能的关进因 素'系统相位噪声的存在使输出信号的相位随机变化,导致 雷达无法对具有弱反射特性的目标进行有效测量[7]。
因此,为 了实现LFM CW雷达对目标的有效识别,必须保证雷达信号源 的频率稳定性,即保证多数情况下雷达系统具有较低的相位噪 声,达到提高载噪比的目的[8_9]。
Robust Control and Estimation Robust control and estimation are crucial aspects of engineering and technology, particularly in the field of systems and control. These techniques are utilized to ensure that systems can operate effectively and accurately in the presence of uncertainties and disturbances. Robust control and estimation are essential for addressing real-world challenges, such as variations in operating conditions, environmental changes, and unexpected disturbances. In this response, we will explore the significance of robust control and estimation from various perspectives, including their applications, benefits, challenges, and future developments. From an engineering perspective, robust control and estimation play a vital role in ensuring the stability and performance of complex systems. These techniques enable engineers to design control systems that can effectively handle uncertainties and variations in the system dynamics. By incorporating robustcontrol and estimation methods, engineers can enhance the reliability and robustness of systems, leading to improved performance and safety. For example, in aerospace engineering, robust control techniques are utilized to design aircraft control systems that can withstand variations in aerodynamic conditions and external disturbances, ensuring safe and stable flight operations. Moreover, robust control and estimation techniques are also essential for addressing the challenges posed by modern technological advancements, such as autonomous vehicles, robotics, and smart manufacturing systems. These advanced systems often operate in dynamic and uncertain environments, where traditional control methods may not be sufficient. Robust control and estimation provide a framework for developing adaptive and resilient control systems that can effectively navigate uncertainties and variations, enabling the seamless integration of advanced technologies intoreal-world applications. In addition to their applications in engineering, robust control and estimation also offer significant benefits in various other domains, such as economics, finance, and healthcare. In economics and finance, these techniques are utilized for managing and controlling financial risks, optimizing investment portfolios, and stabilizing economic systems. In healthcare, robust control and estimation methods are applied to develop advanced medical devices, such as implantable insulin pumps and artificial organs, which require precise andreliable control in the presence of physiological variations and disturbances. Despite their numerous benefits, robust control and estimation also presentcertain challenges and limitations. One of the primary challenges is the complexity of designing and implementing robust control systems, especially for highly nonlinear and uncertain systems. The development of robust control and estimation algorithms requires a deep understanding of system dynamics, mathematical modeling, and computational techniques, which can be resource-intensive and time-consuming. Moreover, the validation and verification of robust control systems often require extensive testing and analysis, adding further complexity to the design process. Furthermore, the integration of robust control and estimation techniques into practical applications may also pose challenges in terms of cost, scalability, and compatibility with existing systems. The implementation of robust control algorithms in real-time systems, such as autonomous vehicles and industrial automation, requires careful consideration of computational resources, hardware constraints, and real-time performance requirements. Additionally, the scalability of robust control and estimation methods for large-scale systems and networks needs to be carefully addressed to ensure their practical feasibility and effectiveness. Looking ahead, the future developments in robust control and estimation are focused on addressing these challenges and advancing the capabilities of these techniques for emerging technological applications. The integration of machine learning and artificial intelligence into robust control and estimation is a promising direction, enabling the development of adaptive and self-learning control systems that can autonomously adapt to uncertainties and variations. Additionally, the advancements in sensor technologies, communication networks, and cyber-physical systems are expected to enhance the capabilities of robust control and estimation for managing complex and interconnected systems. In conclusion, robust control and estimation are indispensable tools for ensuring the stability, reliability, and performance of complex systems in the presence of uncertainties and disturbances. These techniques have widespread applications in engineering, technology, economics, and healthcare, offering significant benefits in terms of system robustness and resilience. However, the challenges associated with the complexity of design,implementation, and integration need to be carefully addressed to realize the full potential of robust control and estimation. The future developments in this field are focused on leveraging advanced technologies, such as machine learning and sensor networks, to enhance the capabilities of robust control and estimation for addressing the challenges of modern technological applications.。
Statistical mechanics of complex networksRe´ka Albert*and Albert-La´szlo´Baraba´siDepartment of Physics,University of Notre Dame,Notre Dame,Indiana46556(Published30January2002)Complex networks describe a wide range of systems in nature and society.Frequently cited examples include the cell,a network of chemicals linked by chemical reactions,and the Internet,a network of routers and computers connected by physical links.While traditionally these systems have been modeled as random graphs,it is increasingly recognized that the topology and evolution of real networks are governed by robust organizing principles.This article reviews the recent advances in the field of complex networks,focusing on the statistical mechanics of network topology and dynamics.After reviewing the empirical data that motivated the recent interest in networks,the authors discuss the main models and analytical tools,covering random graphs,small-world and scale-free networks, the emerging theory of evolving networks,and the interplay between topology and the network’s robustness against failures and attacks.CONTENTSI.Introduction48II.The Topology of Real Networks:Empirical Results49A.World Wide Web49B.Internet50C.Movie actor collaboration network52D.Science collaboration graph52E.The web of human sexual contacts52F.Cellular networks52G.Ecological networks53H.Phone call network53I.Citation networks53works in linguistics53 K.Power and neural networks54 L.Protein folding54 III.Random-Graph Theory54A.The Erdo˝s-Re´nyi model54B.Subgraphs55C.Graph evolution56D.Degree distribution57E.Connectedness and diameter58F.Clustering coefficient58G.Graph spectra59 IV.Percolation Theory59A.Quantities of interest in percolation theory60B.General results601.The subcritical phase(pϽp c)602.The supercritical phase(pϾp c)61C.Exact solutions:Percolation on a Cayley tree61D.Scaling in the critical region62E.Cluster structure62F.Infinite-dimensional percolation62G.Parallels between random-graph theory andpercolation63 V.Generalized Random Graphs63A.Thresholds in a scale-free random graph64B.Generating function formalism64ponent sizes and phase transitions652.Average path length65C.Random graphs with power-law degreedistribution66D.Bipartite graphs and the clustering coefficient66 VI.Small-World Networks67A.The Watts-Strogatz model67B.Properties of small-world networks681.Average path length682.Clustering coefficient693.Degree distribution704.Spectral properties70 VII.Scale-Free Networks71A.The Baraba´si-Albert model71B.Theoretical approaches71C.Limiting cases of the Baraba´si-Albert model73D.Properties of the Baraba´si-Albert model741.Average path length742.Node degree correlations753.Clustering coefficient754.Spectral properties75 VIII.The Theory of Evolving Networks76A.Preferential attachment⌸(k)761.Measuring⌸(k)for real networks762.Nonlinear preferential attachment773.Initial attractiveness77B.Growth781.Empirical results782.Analytical results78C.Local events791.Internal edges and rewiring792.Internal edges and edge removal79D.Growth constraints801.Aging and cost802.Gradual aging81petition in evolving networks811.Fitness model812.Edge inheritance82F.Alternative mechanisms for preferentialattachment821.Copying mechanism822.Edge redirection823.Walking on a network834.Attaching to edges83G.Connection to other problems in statisticalmechanics831.The Simon model832.Bose-Einstein condensation85*Present address:School of Mathematics,University of Min-nesota,Minneapolis,Minnesota55455.REVIEWS OF MODERN PHYSICS,VOLUME74,JANUARY20020034-6861/2002/74(1)/47(51)/$35.00©2002The American Physical Society47IX.Error and Attack Tolerance86A.Numerical results861.Random network,random node removal872.Scale-free network,random node removal873.Preferential node removal87B.Error tolerance:analytical results88C.Attack tolerance:Analytical results89D.The robustness of real networks90munication networks902.Cellular networks913.Ecological networks91X.Outlook91A.Dynamical processes on networks91B.Directed networks92C.Weighted networks,optimization,allometricscaling92D.Internet and World Wide Web93E.General questions93F.Conclusions94 Acknowledgments94 References94 I.INTRODUCTIONComplex weblike structures describe a wide variety of systems of high technological and intellectual impor-tance.For example,the cell is best described as a com-plex network of chemicals connected by chemical reac-tions;the Internet is a complex network of routers and computers linked by various physical or wireless links; fads and ideas spread on the social network,whose nodes are human beings and whose edges represent various social relationships;the World Wide Web is an enormous virtual network of Web pages connected by hyperlinks.These systems represent just a few of the many examples that have recently prompted the scien-tific community to investigate the mechanisms that de-termine the topology of complex networks.The desire to understand such interwoven systems has encountered significant challenges as well.Physics,a major benefi-ciary of reductionism,has developed an arsenal of suc-cessful tools for predicting the behavior of a system as a whole from the properties of its constituents.We now understand how magnetism emerges from the collective behavior of millions of spins,or how quantum particles lead to such spectacular phenomena as Bose-Einstein condensation or superfluidity.The success of these mod-eling efforts is based on the simplicity of the interactions between the elements:there is no ambiguity as to what interacts with what,and the interaction strength is uniquely determined by the physical distance.We are at a loss,however,to describe systems for which physical distance is irrelevant or for which there is ambiguity as to whether two components interact.While for many complex systems with nontrivial network topology such ambiguity is naturally present,in the past few years we have increasingly recognized that the tools of statistical mechanics offer an ideal framework for describing these interwoven systems as well.These developments have introduced new and challenging problems for statistical physics and unexpected links to major topics in condensed-matter physics,ranging from percolation to Bose-Einstein condensation.Traditionally the study of complex networks has been the territory of graph theory.While graph theory ini-tially focused on regular graphs,since the1950s large-scale networks with no apparent design principles have been described as random graphs,proposed as the sim-plest and most straightforward realization of a complex network.Random graphs werefirst studied by the Hun-garian mathematicians Paul Erdo˝s and Alfre´d Re´nyi. According to the Erdo˝s-Re´nyi model,we start with N nodes and connect every pair of nodes with probability p,creating a graph with approximately pN(NϪ1)/2 edges distributed randomly.This model has guided our thinking about complex networks for decades since its introduction.But the growing interest in complex sys-tems has prompted many scientists to reconsider this modeling paradigm and ask a simple question:are the real networks behind such diverse complex systems as the cell or the Internet fundamentally random?Our in-tuition clearly indicates that complex systems must dis-play some organizing principles,which should be at some level encoded in their topology.But if the topology of these networks indeed deviates from a random graph, we need to develop tools and measurements to capture in quantitative terms the underlying organizing prin-ciples.In the past few years we have witnessed dramatic ad-vances in this direction,prompted by several parallel de-velopments.First,the computerization of data acquisi-tion in allfields led to the emergence of large databases on the topology of various real networks.Second,the increased computing power allowed us to investigate networks containing millions of nodes,exploring ques-tions that could not be addressed before.Third,the slow but noticeable breakdown of boundaries between disci-plines offered researchers access to diverse databases, allowing them to uncover the generic properties of com-plex networks.Finally,there is an increasingly voiced need to move beyond reductionist approaches and try to understand the behavior of the system as a whole.Along this route,understanding the topology of the interac-tions between the components,i.e.,networks,is un-avoidable.Motivated by these converging developments and cir-cumstances,many new concepts and measures have been proposed and investigated in depth in the past few years.However,three concepts occupy a prominent place in contemporary thinking about complex net-works.Here we define and briefly discuss them,a discus-sion to be expanded in the coming sections.Small worlds:The small-world concept in simple terms describes the fact that despite their often large size,in most networks there is a relatively short path between any two nodes.The distance between two nodes is defined as the number of edges along the short-est path connecting them.The most popular manifesta-tion of small worlds is the‘‘six degrees of separation’’concept,uncovered by the social psychologist Stanley Milgram(1967),who concluded that there was a path of48R.Albert and A.-L.Baraba´si:Statistical mechanics of complex networks Rev.Mod.Phys.,Vol.74,No.1,January2002acquaintances with a typical length of about six betweenmost pairs of people in the United States(Kochen,1989).The small-world property appears to characterizemost complex networks:the actors in Hollywood are onaverage within three co-stars from each other,or thechemicals in a cell are typically separated by three reac-tions.The small-world concept,while intriguing,is notan indication of a particular organizing principle.In-deed,as Erdo˝s and Re´nyi have demonstrated,the typi-cal distance between any two nodes in a random graphscales as the logarithm of the number of nodes.Thusrandom graphs are small worlds as well.Clustering:A common property of social networks isthat cliques form,representing circles of friends or ac-quaintances in which every member knows every othermember.This inherent tendency to cluster is quantifiedby the clustering coefficient(Watts and Strogatz,1998),a concept that has its roots in sociology,appearing underthe name‘‘fraction of transitive triples’’(Wassermannand Faust,1994).Let us focusfirst on a selected node iin the network,having k i edges which connect it to k iother nodes.If the nearest neighbors of the originalnode were part of a clique,there would be k i(k iϪ1)/2 edges between them.The ratio between the number E iof edges that actually exist between these k i nodes andthe total number k i(k iϪ1)/2gives the value of the clus-tering coefficient of node i,C iϭ2E ik i͑k iϪ1͒.(1)The clustering coefficient of the whole network is the average of all individual C i’s.An alternative definition of C that is often used in the literature is discussed in Sec.VI.B.2(Barrat and Weigt,2000;Newman,Strogatz, and Watts,2000).In a random graph,since the edges are distributed randomly,the clustering coefficient is Cϭp(Sec.III.F). However,in most,if not all,real networks the clustering coefficient is typically much larger than it is in a compa-rable random network(i.e.,having the same number of nodes and edges as the real network).Degree distribution:Not all nodes in a network have the same number of edges(same node degree).The spread in the node degrees is characterized by a distri-bution function P(k),which gives the probability that a randomly selected node has exactly k edges.Since in a random graph the edges are placed randomly,the major-ity of nodes have approximately the same degree,close to the average degree͗k͘of the network.The degree distribution of a random graph is a Poisson distribution with a peak at P(͗k͘).One of the most interesting de-velopments in our understanding of complex networks was the discovery that for most large networks the de-gree distribution significantly deviates from a Poisson distribution.In particular,for a large number of net-works,including the World Wide Web(Albert,Jeong, and Baraba´si,1999),the Internet(Faloutsos et al.,1999), or metabolic networks(Jeong et al.,2000),the degree distribution has a power-law tail,P͑k͒ϳkϪ␥.(2) Such networks are called scale free(Baraba´si and Al-bert,1999).While some networks display an exponential tail,often the functional form of P(k)still deviates sig-nificantly from the Poisson distribution expected for a random graph.These discoveries have initiated a revival of network modeling in the past few years,resulting in the introduc-tion and study of three main classes of modeling para-digms.First,random graphs,which are variants of the Erdo˝s-Re´nyi model,are still widely used in manyfields and serve as a benchmark for many modeling and em-pirical studies.Second,motivated by clustering,a class of models,collectively called small-world models,has been proposed.These models interpolate between the highly clustered regular lattices and random graphs.Fi-nally,the discovery of the power-law degree distribution has led to the construction of various scale-free models that,by focusing on the network dynamics,aim to offer a universal theory of network evolution.The purpose of this article is to review each of these modeling efforts,focusing on the statistical mechanics of complex networks.Our main goal is to present the the-oretical developments in parallel with the empirical data that initiated and support the various models and theo-retical tools.To achieve this,we start with a brief de-scription of the real networks and databases that repre-sent the testing ground for most current modeling efforts.II.THE TOPOLOGY OF REAL NETWORKS:EMPIRICAL RESULTSThe study of most complex networks has been initi-ated by a desire to understand various real systems, ranging from communication networks to ecological webs.Thus the databases available for study span sev-eral disciplines.In this section we review briefly those that have been studied by researchers aiming to uncover the general features of complex networks.Beyond a de-scription of the databases,we shall focus on three robust measures of a network’s topology:average path length, clustering coefficient,and degree distribution.Other quantities,as discussed in the following sections,will again be tested on these databases.The properties of the investigated databases,as well as the obtained expo-nents,are summarized in Tables I and II.A.World Wide WebThe World Wide Web represents the largest network for which topological information is currently available. The nodes of the network are the documents(web pages)and the edges are the hyperlinks(URL’s)that point from one document to another(see Fig.1).The size of this network was close to one billion nodes at the end of1999(Lawrence and Giles,1998,1999).The in-terest in the World Wide Web as a network boomed after it was discovered that the degree distribution of the web pages follows a power law over several orders of magnitude(Albert,Jeong,and Baraba´si,1999;Kumar49R.Albert and A.-L.Baraba´si:Statistical mechanics of complex networks Rev.Mod.Phys.,Vol.74,No.1,January2002et al.,1999).Since the edges of the World Wide Web aredirected,the network is characterized by two degree dis-tributions:the distribution of outgoing edges,P out(k), signifies the probability that a document has k outgoinghyperlinks,and the distribution of incoming edges, P in(k),is the probability that k hyperlinks point to acertain document.Several studies have established that both P out(k)and P in(k)have power-law tails: P out͑k͒ϳkϪ␥out and P in͑k͒ϳkϪ␥in.(3) Albert,Jeong,and Baraba´si(1999)have studied asubset of the World Wide Web containing325729nodes and have found␥outϭ2.45and␥inϭ2.1.Kumar et al. (1999)used a40-million-document crawl by Alexa Inc., obtaining␥outϭ2.38and␥inϭ2.1(see also Kleinberg et al.,1999).A later survey of the World Wide Web to-pology by Broder et al.(2000)used two1999Altavistacrawls containing in total200million documents,obtain-ing␥outϭ2.72and␥inϭ2.1with scaling holding close to five orders of magnitude(Fig.2).Adamic and Huber-man(2000)used a somewhat different representation of the World Wide Web,with each node representing a separate domain name and two nodes being connected if any of the pages in one domain linked to any page in the other.While this method lumped together pages that were on the same domain,representing a nontrivial ag-gregation of the nodes,the distribution of incoming edges still followed a power law with␥in domϭ1.94.Note that␥in is the same for all measurements at the document level despite the two-years’time delay be-tween thefirst and last web crawl,during which the World Wide Web had grown at leastfive times larger. However,␥out has a tendency to increase with the sample size or time(see Table II).Despite the large number of nodes,the World Wide Web displays the small-world property.This wasfirst re-ported by Albert,Jeong,and Baraba´si(1999),who found that the average path length for a sample of 325729nodes was11.2and predicted,usingfinite size scaling,that for the full World Wide Web of800million nodes that would be a path length of around19.Subse-quent measurements by Broder et al.(2000)found that the average path length between nodes in a50-million-node sample of the World Wide Web is16,in agreement with thefinite size prediction for a sample of this size. Finally,the domain-level network displays an average path length of3.1(Adamic,1999).The directed nature of the World Wide Web does not allow us to measure the clustering coefficient using Eq.(1).One way to avoid this difficulty is to make the net-work undirected,making each edge bidirectional.This was the path followed by Adamic(1999),who studied the World Wide Web at the domain level using a1997 Alexa crawl of50million web pages distributed among 259794sites.Adamic removed the nodes that had have only one edge,focusing on a network of153127sites. While these modifications are expected to increase the clustering coefficient somewhat,she found Cϭ0.1078, orders of magnitude higher than C randϭ0.00023corre-sponding to a random graph of the same size and aver-age degree.B.InternetThe Internet is a network of physical links between computers and other telecommunication devices(Fig.TABLE I.The general characteristics of several real networks.For each network we have indicated the number of nodes,the average degree͗k͘,the average path length l,and the clustering coefficient C.For a comparison we have included the average path length l rand and clustering coefficient C rand of a random graph of the same size and average degree.The numbers in the last column are keyed to the symbols in Figs.8and9.Network Size͗k͘l l rand C C rand Reference Nr. WWW,site level,undir.15312735.21 3.1 3.350.10780.00023Adamic,19991 Internet,domain level3015–6209 3.52–4.11 3.7–3.76 6.36–6.180.18–0.30.001Yook et al.,2001a,Pastor-Satorras et al.,20012 Movie actors22522661 3.65 2.990.790.00027Watts and Strogatz,19983 LANL co-authorship529099.7 5.9 4.790.43 1.8ϫ10Ϫ4Newman,2001a,2001b,2001c4 MEDLINE co-authorship152025118.1 4.6 4.910.066 1.1ϫ10Ϫ5Newman,2001a,2001b,2001c5 SPIRES co-authorship56627173 4.0 2.120.7260.003Newman,2001a,2001b,2001c6 NCSTRL co-authorship11994 3.599.77.340.4963ϫ10Ϫ4Newman,2001a,2001b,2001c7 Math.co-authorship70975 3.99.58.20.59 5.4ϫ10Ϫ5Baraba´si et al.,20018 Neurosci.co-authorship20929311.56 5.010.76 5.5ϫ10Ϫ5Baraba´si et al.,20019 E.coli,substrate graph2827.35 2.9 3.040.320.026Wagner and Fell,200010 E.coli,reaction graph31528.3 2.62 1.980.590.09Wagner and Fell,200011 Ythan estuary food web1348.7 2.43 2.260.220.06Montoya and Sole´,200012 Silwood Park food web154 4.75 3.40 3.230.150.03Montoya and Sole´,200013 Words,co-occurrence460.90270.13 2.67 3.030.4370.0001Ferrer i Cancho and Sole´,200114 Words,synonyms2231113.48 4.5 3.840.70.0006Yook et al.,2001b15 Power grid4941 2.6718.712.40.080.005Watts and Strogatz,199816C.Elegans28214 2.65 2.250.280.05Watts and Strogatz,199817 50R.Albert and A.-L.Baraba´si:Statistical mechanics of complex networksRev.Mod.Phys.,Vol.74,No.1,January20021).The topology of the Internet is studied at two differ-ent levels.At the router level,the nodes are the routers,and edges are the physical connections between them.At the interdomain (or autonomous system)level,eachwork structure of the World Wide Web and the Internet.Upper panel:the nodes of the World Wide Web are web documents,connected with directed hyperlinks (URL’s).Lower panel:on the Internet the nodes are the routers and computers,and the edges are the wires and cables that physi-cally connect them.Figure courtesy of Istva´n Albert.TABLE II.The scaling exponents characterizing the degree distribution of several scale-free networks,for which P (k )follows apower law (2).We indicate the size of the network,its average degree ͗k ͘,and the cutoff for the power-law scaling.For directed networks we list separately the indegree (␥in )and outdegree (␥out )exponents,while for the undirected networks,marked with an asterisk (*),these values are identical.The columns l real ,l rand ,and l pow compare the average path lengths of real networks with power-law degree distribution and the predictions of random-graph theory (17)and of Newman,Strogatz,and Watts (2001)[also see Eq.(63)above],as discussed in Sec.V .The numbers in the last column are keyed to the symbols in Figs.8and workSize͗k ͘␥out ␥in lreallrandlpowReference Nr.WWW 325729 4.51900 2.45 2.111.28.32 4.77Albert,Jeong,and Baraba´si 19991WWW 4ϫ1077 2.38 2.1Kumar et al.,19992WWW 2ϫ1087.54000 2.72 2.1168.857.61Broder et al.,20003WWW,site 260000 1.94Huberman and Adamic,20004Internet,domain *3015–4389 3.42–3.7630–40 2.1–2.2 2.1–2.246.3 5.2Faloutsos,19995Internet,router *3888 2.5730 2.48 2.4812.158.757.67Faloutsos,19996Internet,router *150000 2.6660 2.4 2.41112.87.47Govindan,20007Movie actors *21225028.78900 2.3 2.3 4.54 3.65 4.01Baraba´si and Albert,19998Co-authors,SPIRES *566271731100 1.2 1.24 2.12 1.95Newman,2001b9Co-authors,neuro.*20929311.54400 2.1 2.16 5.01 3.86Baraba´si et al.,200110Co-authors,math.*70975 3.9120 2.5 2.59.58.2 6.53Baraba´si et al.,200111Sexual contacts *2810 3.4 3.4Liljeros et al.,200112Metabolic,E.coli 7787.4110 2.2 2.2 3.2 3.32 2.89Jeong et al.,200013Protein,S.cerev.*1870 2.39 2.4 2.4Jeong,Mason,et al.,200114Ythan estuary *1348.735 1.05 1.052.43 2.26 1.71Montoya and Sole´,200014Silwood Park *154 4.7527 1.13 1.13 3.43.232Montoya and Sole´,200016Citation 7833398.573Redner,199817Phone call 53ϫ1063.16 2.1 2.1Aiello et al.,200018Words,co-occurrence *46090270.13 2.7 2.7Ferrer i Cancho and Sole´,200119Words,synonyms *2231113.48 2.8 2.8Yook et al.,2001b20FIG.2.Degree distribution of the World Wide Web from twodifferent measurements:ᮀ,the 325729-node sample of Albert et al.(1999);᭺,the measurements of over 200million pages by Broder et al.(2000);(a)degree distribution of the outgoing edges;(b)degree distribution of the incoming edges.The data have been binned logarithmically to reduce noise.Courtesy of Altavista and Andrew Tomkins.The authors wish to thank Luis Amaral for correcting a mistake in a previous version of this figure (see Mossa et al.,2001).51R.Albert and A.-L.Baraba´si:Statistical mechanics of complex networks Rev.Mod.Phys.,Vol.74,No.1,January 2002domain,composed of hundreds of routers and comput-ers,is represented by a single node,and an edge is drawn between two domains if there is at least one route that connects them.Faloutsos et al.(1999)have studied the Internet at both levels,concluding that in each case the degree distribution follows a power law.The inter-domain topology of the Internet,captured at three dif-ferent dates between 1997and the end of 1998,resultedin degree exponents between ␥I as ϭ2.15and ␥I asϭ2.2.The 1995survey of Internet topology at the router level,containing 3888nodes,found ␥I rϭ2.48(Faloutsos et al.,1999).Recently Govindan and Tangmunarunkit (2000)mapped the connectivity of nearly 150000router inter-faces and nearly 200000router adjacencies,confirmingthe power-law scaling with ␥I rӍ2.3[see Fig.3(a)].The Internet as a network does display clustering and small path length as well.Yook et al.(2001a)and Pastor-Satorras et al.(2001),studying the Internet at the do-main level between 1997and 1999,found that its clus-tering coefficient ranged between 0.18and 0.3,to be compared with C rand Ӎ0.001for random networks with similar parameters.The average path length of the In-ternet at the domain level ranged between 3.70and 3.77(Pastor-Satorras et al.,2001;Yook et al.2001a)and at the router level it was around 9(Yook et al.,2001a),indicating its small-world character.C.Movie actor collaboration networkA much-studied database is the movie actor collabo-ration network,based on the Internet Movie Database,which contains all movies and their casts since the 1890s.In this network the nodes are the actors,and two nodes have a common edge if the corresponding actors have acted in a movie together.This is a continuously expand-ing network,with 225226nodes in 1998(Watts and Stro-gatz,1998),which grew to 449913nodes by May 2000(Newman,Strogatz,and Watts,2000).The average path length of the actor network is close to that of a random graph with the same size and average degree,3.65com-pared with 2.9,but its clustering coefficient is more than 100times higher than a random graph (Watts and Stro-gatz,1998).The degree distribution of the movie actor network has a power-law tail for large k [see Fig.3(b)],following P (k )ϳk Ϫ␥actor ,where ␥actor ϭ2.3Ϯ0.1(Bara-ba´si and Albert,1999;Albert and Baraba ´si,2000;Ama-ral et al.,2000).D.Science collaboration graphA collaboration network similar to that of the movie actors can be constructed for scientists,where the nodes are the scientists and two nodes are connected if the two scientists have written an article together.To uncover the topology of this complex graph,Newman (2001a,2001b,2001c)studied four databases spanning physics,biomedical research,high-energy physics,and computer science over a five-year window (1995–1999).All these networks show a small average path length but a high clustering coefficient,as summarized in Table I.The de-gree distribution of the collaboration network of high-energy physicists is an almost perfect power law with an exponent of 1.2[Fig.3(c)],while the other databases display power laws with a larger exponent in the tail.Baraba´si et al.(2001)investigated the collaboration graph of mathematicians and neuroscientists publishing between 1991and 1998.The average path length of these networks is around l math ϭ9.5and l nsci ϭ6,their clustering coefficient being C math ϭ0.59and C nsci ϭ0.76.The degree distributions of these collaboration networks are consistent with power laws with degree ex-ponents 2.1and 2.5,respectively [see Fig.3(d)].E.The web of human sexual contactsMany sexually transmitted diseases,including AIDS,spread on a network of sexual relationships.Liljeros et al.(2001)have studied the web constructed from the sexual relations of 2810individuals,based on an exten-sive survey conducted in Sweden in 1996.Since the edges in this network are relatively short lived,they ana-lyzed the distribution of partners over a single year,ob-taining for both females and males a power-law degree distribution with an exponent ␥f ϭ3.5Ϯ0.2and ␥m ϭ3.3Ϯ0.2,respectively.F .Cellular networksJeong et al.(2000)studied the metabolism of 43or-ganisms representing all three domains of life,recon-structing them in networks in which the nodes aretheFIG.3.The degree distribution of several real networks:(a)Internet at the router level.Data courtesy of Ramesh Govin-dan;(b)movie actor collaboration network.After Baraba´si and Albert 1999.Note that if TV series are included as well,which aggregate a large number of actors,an exponential cut-off emerges for large k (Amaral et al.,2000);(c)co-authorship network of high-energy physicists.After Newman (2001a,2001b);(d)co-authorship network of neuroscientists.AfterBaraba´si et al.(2001).52R.Albert and A.-L.Baraba´si:Statistical mechanics of complex networks Rev.Mod.Phys.,Vol.74,No.1,January 2002。
基于深度学习的蔬菜识别研究中文摘要随着食品安全追溯、无人超市、自主购物的兴起,蔬菜等农产品在流通和销售等环节的自动识别技术已成为急需解决的问题。
在图像识别技术的研究过程中,蔬菜图像识别技术的研究主要经历了基于传统图像处理与深度学习技术的两个阶段,基于传统图像处理的蔬菜识别方法依靠人为定义蔬菜特征,如颜色特征、纹理特征、形状特征等,存在对蔬菜不同流通环节的图像采集与处理过程复杂、识别算法及平台要求高,蔬菜识别和分级率低,功能扩展困难等缺点;基于深度学习的蔬菜识别技术多采用卷积神经网络及其改进算法,该技术可以提取高维抽象的图像特征,大大提高了蔬菜识别的准确度和鲁棒性,因此本文基于深度学习卷积神经网络模型对蔬菜识别技术进行相关研究并进行以下工作。
(1)构建基于色彩及纹理特征的蔬菜数据集。
首先以国家蔬菜分类标准为基本分类依据,在本文的研究背景下,构建基于色彩与纹理特征蔬菜数据集;然后根据图像建立过程中图像预处理的基本步骤,对图像进行视觉质量优化与图像样本数量扩增,最后为方便图像识别过程中的读取与加载,对图像的标签进行设计,主要考虑包装、蔬菜新鲜程度等因素。
(2)基于卷积神经网络的蔬菜识别研究。
首先介绍卷积神经网络各层的工作原理及参数训练方法;然后对卷积神经网络数据输入的差异性研究,提出一种浅层卷积参数迁移为初始化数据进行训练,深层卷积参数重新初始化进行训练的参数迁移机制,最后对AlexNet、VGG-16模型及其参数迁移模型进行蔬菜识别的仿真,对识别错误结果的蔬菜进行统计并绘制混淆矩阵。
(3)基于双线性卷积神经网络的易误识别蔬菜识别研究。
本章节首先介绍了双线性卷积神经网络的模型架构及学习机制,然后针对双线性卷积神经网络的输入,提出一种基于谱聚类的簇约束算法,该算法对混淆矩阵中的蔬菜类别聚类的簇的上下限进行约束,利用轮廓曲线确定最优簇值,加载簇内的蔬菜样本输入到双线性卷积神经网络模型进一步训练识别,最后针对提出方法进行实验仿真,实验结果表明,该方法能够有效提高易误识别蔬菜的识别率。
群体研究的英语作文Title: The Significance of Group Studies in Research。
Group studies in research play a pivotal role in advancing scientific knowledge and understanding across various disciplines. Through collaborative efforts, researchers can synergize their expertise, share resources, and collectively tackle complex problems. This essay explores the importance of group studies in research and highlights the benefits they offer.Firstly, group studies foster interdisciplinary collaboration, allowing experts from different fields to come together and pool their knowledge and skills. This interdisciplinary approach is particularly valuable in addressing multifaceted issues that require diverse perspectives. For example, in the field of environmental science, a research team comprising ecologists, chemists, and engineers can work together to develop innovative solutions for mitigating pollution or conservingbiodiversity.Moreover, group studies promote creativity and innovation by fostering a culture of brainstorming and idea generation. In a collaborative setting, researchers can freely exchange ideas, challenge assumptions, and explore unconventional approaches. This collaborative environment stimulates creativity and often leads to breakthrough discoveries that might not have been possible through individual efforts alone. For instance, the development of new medical treatments or technologies often involves interdisciplinary teams working collaboratively to push the boundaries of knowledge.Furthermore, group studies enhance the quality and reliability of research findings through peer review and collective scrutiny. When multiple researchers examine and critique each other's work, they can identify errors, biases, and limitations more effectively. This rigorous peer review process helps ensure the accuracy and validity of research outcomes, thereby enhancing the credibility of the scientific community. Additionally, collaborativeresearch projects often involve replication studies conducted by independent teams, which further validate the robustness of the findings.In addition to advancing scientific knowledge, group studies also provide valuable learning opportunities for researchers, especially early-career scientists and students. By participating in collaborative research projects, individuals can gain hands-on experience, develop critical thinking skills, and expand their professional networks. Moreover, working in a team environment fosters interpersonal skills such as communication, teamwork, and leadership, which are essential for success in both academia and industry.Furthermore, group studies facilitate the efficient use of resources by leveraging shared infrastructure, equipment, and funding. By pooling resources, research teams canaccess specialized facilities and technologies that mightbe beyond the reach of individual researchers. This collaborative approach not only maximizes the impact of limited resources but also promotes cost-effectiveness andsustainability in research endeavors.In conclusion, group studies play a crucial role in advancing scientific research by promotinginterdisciplinary collaboration, fostering creativity and innovation, enhancing the quality and reliability of research findings, providing learning opportunities, and maximizing the efficient use of resources. By working together in collaborative teams, researchers can address complex challenges more effectively and accelerate the pace of discovery and innovation across various fields. As we continue to tackle global issues and pursue new frontiers of knowledge, the importance of group studies in research will only continue to grow.。
基于复杂网络理论的地铁网络鲁棒性研究作者:时柏营程远丁东玥杨宇雷崔博伟来源:《物流科技》2024年第14期摘要:地鐵网络作为现代城市交通的重要组成部分,其运行的可靠性和稳定性对于城市的正常运转至关重要。
然而,地铁网络可能面临各种干扰和故障,如设备故障、自然灾害、人为破坏等,可能导致线路中断、列车延误和乘客服务中断。
因此,研究地铁网络的鲁棒性,即系统在面对这些干扰时的恢复能力,对于提高地铁网络的可靠性和抗干扰性具有重要意义。
文章基于复杂网络理论,综合考虑地铁网络的拓扑结构、节点重要性和客流分布等因素,对地铁网络的鲁棒性进行定量分析。
研究采用Space-L方法对杭州市地铁网络拓扑结构特性进行分析,并分析了网络的度、介数、聚类系数和最短路径长度等网络特性指标。
针对鲁棒性分析,文章采用了随机攻击和蓄意攻击的9种不同攻击策略,并对杭州市地铁网络进行实例分析。
研究结果表明,关键指标的变化对地铁网络的鲁棒性产生显著影响。
通过分析不同攻击策略下的网络性能指标,可以揭示系统中的脆弱节点和脆弱路径。
这些分析结果对于提高杭州市地铁网络的鲁棒性,增强其对干扰和攻击的抵抗能力具有重要意义。
关键词:Space-L方法;复杂网络;鲁棒性;聚类系数;介数中图分类号:F532;U231 文献标志码:A DOI:10.13714/ki.1002-3100.2024.14.012文章编号:1002-3100(2024)14-0059-05Robustness Analysis of Subway Network Based on Complex Network TheorySHI Baiying,CHENG Yuan,DING Dongyue,YANG Yulei,CUI Bowei(Department of Transportation Engineering, Shandong Jianzhu University, Jinan 250101,China)Abstract: As an important part of modern urban transportation, the reliability and stability of the metro network is crucial for the normal functioning of the city. However, metro networks may face a variety of disturbances and failures, such as equipment failures, natural disasters, and human damages, which may lead to line interruptions, train delays, and disruptions in passenger services. Therefore, it is important to study the robustness of metro networks, i.e. the ability of the system to recover in the face of these disturbances, to improve the reliability and anti-interference of metro networks. The paper quantitatively analyzes the robustness of the subway network based on complex network theory, taking into account the topology of the subway network, the importance of the nodes, and the distribution of passenger flow. This study uses the Space-L method to construct a passenger flow-weighted North Hangzhou metro network model, and analyzes the network characteristic indexes such as the degree, median, clustering coefficient, and shortest path length of the network. For robustness analysis, the article adopts nine different attack strategies of random attack and deliberate attack, and takes a case study of Hangzhou metro network . The results of the study show that the changes of the key indicators have a significant impact on therobustness of the subway network. By analyzing the network performance metrics under different attack strategies, vulnerable nodes and vulnerable paths in the system can be revealed. These analysis results are important for improving the robustness of Hangzhou metro network and enhancing its resistance to interference and attacks.Key words: Space-L method; complex networks; robustness; clustering coefficient; median0 引言地铁网络作为城市交通系统的核心组成部分,其可靠性和稳定性对于城市居民的出行和城市的正常运转至关重要。
a r X i v :1010.5829v 1 [p h y s i c s .d a t a -a n ] 28 O c t 2010Robustness of a Network of NetworksJianxi Gao,1,2Sergey V.Buldyrev,3Shlomo Havlin,4and H.Eugene Stanley 11Center for Polymer Studies and Department of Physics,Boston University,Boston,MA 02215USA2Department of Automation,Shanghai Jiao Tong University,800Dongchuan Road,Shanghai 200240,PR China3Department of Physics,Yeshiva University,New York,NY 10033USA4Minerva Center and Department of Physics,Bar-Ilan University,52900Ramat-Gan,Israel(Dated:25October 2010—gbhs25oct.tex)AbstractAlmost all network research has been focused on the properties of a single network that does not interact and depends on other networks.In reality,many real-world networks interact with other networks.Here we develop an analytical framework for studying interacting networks and present an exact percolation law for a network of n interdependent networks.In particular,we find that for n Erd˝o s-R´e nyi networks each of average degree k ,the giant component,P ∞,is given by P ∞=p [1−exp(−kP ∞)]n where 1−p is the initial fraction of removed nodes.Our general result coincides for n =1with the known Erd˝o s-R´e nyi second-order phase transition for a single network.For any n ≥2cascading failures occur and the transition becomes a first-order percolation transition.The new law for P ∞shows that percolation theory that is extensively studied in physics and mathematics is a limiting case (n =1)of a more general general and different percolation law for interdependent networks.In recent years dramatic advances in the field of com-plex networks have occurred [1–13].The internet,airline routes,and electric power grids are all examples of net-works whose function relies crucially on the connectivity between the network components.An important prop-erty of such systems is their robustness to node failures.Almost all research has been concentrated on the case of a single or isolated network which does not interact with other networks.Recently,based on the motivation that modern infrastructures are becoming significantly more dependent on each other,a system of two coupled interdependent networks has been studied [14].A funda-mental property of interdependent networks is that when nodes in one network fail,they may lead to the failure of dependent nodes in other networks which may cause further damage in the first network and so on,leading to a global cascade of failures.Buldyrev et al.[14]devel-oped a framework for analyzing robustness of two inter-acting networks subject to such cascading failures.They found that interdependent networks become significantly more vulnerable compared to their noninteracting coun-terparts.For many important examples,more than two net-works depend on each other.For example,diverse infras-tructures are coupled together,such as water and food supply,communications,fuel,financial transactions,and power stations [15–18].For further examples see Section I in the Supplementary Information (SI).Understanding the robustness due to such interdependencies is one of the major challenges for designing resilient infrastructures.We introduce here a model system,comprising a net-work of n coupled networks,where each network con-sists of N nodes (See Fig.1).The N nodes in each network are connected to nodes in neighboring networks by bidirectional dependency links,thereby establishing a one-to-one correspondence as illustrated in Fig.2in SI.We develop a mathematical framework to study the ro-bustness of this “network of networks”(NON).We find an exact analytical law for percolation of a NON system composed of n coupled randomly connected networks.Our result generalizes the known Erd˝o s-R´e nyi (ER)[19–21]result for the giant component of a single network and the n =2result found recently [14],and shows that while for n =1the percolation transition is a second or-der transition,for n >1cascading failures occur and the transition becomes a first order transition.Our results for n interdependent networks suggest that the classi-cal percolation theory extensively studied in physics and mathematics is a limiting case of a general theory of per-colation in NONs,or networks with multiple types of connectivity links.This general theory has many novel features which are not present in classical percolation.Additionally,we find:(i)the robustness of NON significantly decreases with n ,and(ii)for a network of n ER networks all with the same average degree k ,there exists a minimum degree k min (n )increasing with n ,below which p c =1,i.e.,for k <k min the NON will collapse once any finite number of nodes fail.We find an analytical expression for k min (n ),which generalizes the known result k min (1)=1for ER below which the network collapses.We also discuss the critical effect of loops in the NON structure.Real-world interacting networks (See SI for more de-tails)are characterized by complex correlations and a va-riety of organizational principles governing their internal structures and interdependencies.Once these correla-tions are quantified from the statistical analysis of actual data bases and the organizational principles are specified from the engineering literature,real world networks can be studied by computer simulations.These simulations will have many parameters and therefore their outcome will also require complex interpretation.It is therefore very important to develop simple analytically tractablemodels for the robustness of interdependent networks against which such simulations can be tested.Well-known examples of simplified models that both demon-strate a fundamental phenomenon and significantly ad-vance our knowledge are the Ising model in statistical mechanics and the Erd˝o s-R´e nyi model in graph theory. This paper presents a simple model that can serve as a benchmark for further studies of NONs.We assume that a network m(m=1,2,...,n)in the NON is a randomly connected network with a degree dis-tribution P m(k).We call a pair of networks A and B a fully interdependent pair if it satisfies the following con-dition:each node A i of network A is connected to one and only one node B i in network B by a bidirectional de-pendency link such that if node A i fails,B i also fails and vice versa.Since the number of nodes in each network is the same,these bidirectional links establish a one-to-one correspondence between the nodes in the networks belonging to an interdependent pair.Each node of the NON represents a network and each edge represents a fully interdependent pair of networks.First,we will dis-cuss the case when the NON is a loopless tree of n net-works(Fig.1).The dependency edges in such a NON es-tablish a unique one-to-one correspondence between the nodes of any two networks not necessarily belonging to the same fully interdependent pair.This one-to-one cor-respondence established by the interdependency links be-tween the nodes of different networks in the loopless NON uniquely maps any set of nodes in one of the networks to a set of nodes(which we will call an image of the original set)in any other network of the NON(See SI for more details).In principle,the assumption of full interdepen-dence allows one to collapse all the networks of the NON onto a single network with multiple types of links.We assume that in order to remain functional a node must belong to a sufficiently large mutually connected cluster[14](See detailed definition in SI).We will show that a large mutually connected cluster which includes a finite fraction of the nodes in each network exists only in networks of sufficiently high mean degree.We call this large mutually connected cluster a mutual giant compo-nent,and we postulate that only nodes in the mutual giant component remain functional.We assume that due to an attack or random failure only a fraction of nodes p in one particular network which we will call the root of the NON.We can now observe a cascade of failures caused by the failure of the dependent nodes in the networks connected directly to the root by the edges of the NON.The damage will further spread to more distant networks.Moreover,fragmentation of each network caused by the removal of certain nodes will cause malfunction of other nodes which will now belong to small isolated clusters.This malfunction will cause dependent nodes in neighboring networks to malfunction as well.Depending on the time scales of these processes, the damage can spread across the NON back and forth, which we can visualize as cascades of failures,as shown in Fig.3of the SI section.At the end of this process only the mutual giant component of the NON,if it exists,will remain functional.We now introduce generating functions[14,22–25] of each network,G m0(z)= P m(k)z k,and the gen-erating function of the associated branching process, G m1(z)=G′m0(z)/G′m0(1).It is known[22,23]that the generating functions of a randomly connected net-work once a fraction1−p of nodes has been ran-domly removed are the same as the generating func-tions of the original network with the new argument 1−p(1−z).Furthermore it is known[24,25]that the fraction of nodes in the giant component of a single randomly connected network isµ∞,1=pg m(p),where g m(p)=1−G m0(1−p(1−f m))and f m satisfies a tran-scendental equation f m(p)=G m1(1−p(1−f m(p))). We next prove that the fraction of nodes,µ∞,n,in the mutual giant component of a NON composed of n networks is the product:µ∞,n=pnm=1g m(x m),(1) where each x m satisfies the equationx m=µ∞,n/g m(x m).(2) The system of n+1equations(1)and(2)defines n+1 unknowns:µ∞,n,x1,x2,...,x n as functions of p and the degree distributions P m(k).We derive Eqs.(1)and(2)by mathematical induc-tion.(An alternative proof is given in the SI).Indeed,for n=1,Eqs.(1)and(2)follow directly from the definition ofµ∞,1.Assuming that the formulas are valid for a NON of n−1networks we will prove that they are valid also for a NON of n networks.A loopless NON of n networks can be always represented as one of its networks connected by a single edge to the other n−1networks in the NON.All the nodes in the n-th network,which do not belong to the image of the mutual giant componentµ∞,n−1of the NON of n−1networks will stop to function.The fraction of the nodes in the image of this mutual giant component onto the n-th network satisfies the equation x1,n=µ∞,n−1(p). The fraction of nodes belonging to the giant component of this dependency image isµ1,n=x1,n g n(x1,n).Only the nodes in the NON of n−1networks which belong to the dependency image of the giant component of the n-th network will remain functional.Due to the random-ness of the connectivity links in different networks,this dependency image can be represented as a random se-lection of the fraction g n(x1,n)out of the originally sur-vived nodes,or as random selection of p1=pg n(x1,n) fraction of nodes in one of the networks comprising the NON of n−1networks.The fraction of nodes in the new mutual giant component of the NON of n−1net-works corresponding to this new random selection will be µ∞,n−1(p1).The image of this mutual giant component in the n-th network is equivalent to a random selection of x2,n=µ∞,n−1(p1)/g n(x1,n)fraction of nodes out of theentire n-th network.As we continue this process,the se-quence of giant componentsµj,n in the n-th network,ran-domly selected sets x n in the n-th network and randomlyselected sets p j in the NON of n−1networks will satisfy the recursion relations x j+1,n=µ∞,n−1(p j)/g n(x j,n),µj+1,n=x j+1,n g n(x j+1,n),p j+1=pg n(x j+1,n).In the limit j→∞,this process will converge,i.e.allthe parameters in the two successive steps will coincide: x j+1,n→x j,n≡x n,p j→pg n(x n)andµ∞,n−1(p j)→µ∞,n.Then x n=µ∞,n/g n(x n)which is identical to the last equation in Eqs.(2)andµ∞,n−1(p j)→pg n(x n) n−1m=1g m(x m)=p n m=1g m(x m)≡µ∞,n which is identical to Eq.(1).By the assumption of induction x m=µ∞,n−1(p j)/g m(x m)=µ∞,n/g m(x m)which com-pletes the set of Eqs.(2).Finallyµj+1,n→x n g n(x n)=µ∞,n/g n(x n)and thus the fraction of nodes in the giant n-th network coincides with the mutual giant component in the NON of n−1networks.The SI presents an al-ternative analytical derivation of Eqs.(1)and(2),which represent a certain type of cascading failures.The SI also presents simulation results which agree well with the the-ory(Figs.5and6in SI).For the case of a NON with loops,the closed path of fully interdependent pairs starting form a network A and ending at the same network A will establish a dependenceof nodes A i on node A ji ,where j i is a transposition of i.Then the failure of single node i will cause an entire cycle in the transposition to fail.The average size of a cycle in the transposition of N elements grows as N/ln N,so the initial failure of ln N nodes will cause almost all the nodes of the NON to fail without taking into account any connectivity links which will cause additional dam-age.So the NON with loops is unstable against removal of an infinitely small fraction of nodes unless the transpo-sition j i is not random.In case when the transposition j i is trivial,j i=i,we have the same one-to-one cor-respondence between the nodes as intheloopless NONand then Eq.(1)and(2)are valid.This is since in our proof we did not use any other property of a NON ex-cept the unique one-to-one correspondence of the nodes in different networks.The case of NON of n Erd˝o s-R´e nyi(ER)[19–21] networks with average degrees k1,k2,...k i,...,k n can be solved explicitly.In this case,we have G1,i(x)= G0,i(x)=exp[k i(x−1)][23].Accordingly g i(x i)= 1−exp[k i x i(f i−1)],where f i=exp[k i x i(f i−1)]and thus g i(x i)=1−f ing Eq.(2)for x i we getf i=exp[−pk inj=1(1−f j)],i=1,2,...,n.(3)These equations can be solved analytically,as shown in detail in the SI section.They have only a trivial solution (f i=1)if p<p c,where p c is the mutual percolation threshold.When the n networks have the same average degree k,k i=k(i=1,2,...,n),we obtain from Eq.(3) that f c≡f i(p c)satisfiesf c=e f c−1ne−1nkf c..(5)For n=1we obtain the known result p c=1/k of Erd˝o s-R´e nyi[19–21].Substituting n=2in Eqs.(4)and(5) one obtains the exact results of[14].To analyze p c as a function of n,wefind f c from Eq.(4)and substitute it into Eq.(5),and we obtain p c as a function of n for different k values,as shown in Fig.2(a). It is seen that the NON becomes more vulnerable with in-creasing n or decreasing k(p c increases when n increases or k decreases).Furthermore,for afixed n,when k is smaller than a critical number k min(n),p c≥1meaning that for k<k min(n),the NON will collapse even if a single node fails.Fig.2(b)shows the minimum average degree k min as a function of the number of networks n. From Eq.(5)we get the minimum of k as a function of nk min(n)=[nf c(1−f c)(n−1)]−1,(6)Note that Eq.(6)together with Eq.(4)yield the value of k min(1)=1,reproducing the known ER result,that k =1is the minimum average degree needed to have a giant component.For n=2,Eq.(6)yields the result obtained in[14],i.e.,k min=2.4554.From Eqs.(1)-(3)we obtain the percolation law for the order parameter,the size of the mutual giant component for all p values and for all k and n,µ∞,n≡P∞=p[1−exp(−kP∞)]n.(7)The solutions of equation(7)are shown in Fig.3for several values of n.Results are in excellent agreement with simulations.The special case n=1is the known ER percolation law for a single network[19–21].Note that Eqs.(4)–(7)are based on the assumption that all n networks have the same average degree k.In summary,we have developed a framework,Eqs.(1) and(2),for studying percolation of NON from which we derived an exact analytical law,Eq.(7),for percola-tion in the case of a network of n coupled ER networks. Equation(7)represents a bound for the case of partially dependent networks[28],which will be more robust.In particular for any n≥2,cascades of failures naturally ap-pear and the phase transition becomesfirst order transi-tion compared to a second order transition in the classical percolation of a single network.Thesefindings show that the percolation theory of a single network is a limiting case of a more general case of percolation of interdepen-dent networks.Due to cascading failures which increase with n,vulnerability significantly increases with n.We alsofind that for any loopless network of networks the critical percolation threshold and the mutual giant com-ponent depend only on the number of networks and noton the topology(see Fig.1(a)).When the NON includesloops,and dependency links are random,p c=1and nomutual giant component exists.[1]Watts D.J.&Strogatz S.H.Nature393,440-442(1998).[2]Albert R.,Jeong H.&Barab´a si A.L.Nature406,378-382(2000).[3]Cohen R.et al.Phys.Rev.Lett.85,4626–4628(2000).[4]Callaway D.S.et al.Phys.Rev.Lett.85,5468-5471(2000).[5]Albert R.&Barab´a si A.L.Rev.Mod.Phys.74,47-97(2002).[6]Newman M.E.J.SIAM Review45,167-256(2003).[7]Dorogovtsev S.N.&Mendes J.F.F.Evolution of Net-works:From Biological Nets to the Internet and WWW (Physics)(Oxford Univ.Press,New York,2003).[8]Song C.et al.Nature433,392-395(2005).[9]Satorras R.P.&Vespignani A.Evolution and Structureof the Internet:A Statistical Physics Approach(Cam-bridge Univ.Press,England,2006).[10]Caldarelli G.&Vespignani rge scale Structure andDynamics of Complex Webs(World Scientific,2007). [11]Barr´a t A.,Barth´e lemy M.&Vespignani A.DynamicalProcesses on Complex Networks(Cambridge Univ.Press, England,2008).[12]Havlin S.&Cohen plex Networks:Structure,Ro-bustness and Function(Cambridge Univ.Press,England, 2010).[13]Newman works:An Introduction(OxfordUniv.Press,New York,2010).[14]Buldyrev S.V.et al.Nature464,1025-1028(2010).[15]Peerenboom J.,Fischer R.&Whitfield R.in Pro.CRIS/DRM/IIIT/NSF Workshop Mitigat.Vulnerab.Crit.Infrastruct.Catastr.Failures(2001).[16]Rinaldi S.,Peerenboom J.&Kelly T.IEEE Contr.Syst.Mag.21,11-25(2001).[17]Rosato V.et al.Int.J.Crit.Infrastruct.4,63-79(2008).[18]Vespignani A.Nature464,984-985(2010).[19]Erd˝o s P.&R´e nyi A.I.Publ.Math.6,290-297(1959).[20]Erd˝o s P.&R´e nyi A.Publ.Math.Inst.Hung.Acad.Sci.5,17-61(1960).[21]Bollob´a s B.Random Graphs(Academic,London,1985).[22]Newman M.E.J.Strogatz S.H.&Watts D.J.,Phys.Rev.E64,026118(2001).[23]Newman M.E.J.Phys.Rev.E66,016128(2002).[24]Shao J.et al.Europhys.Lett.84,48004(2008).[25]Shao J.et al.Phys.Rev.E80,036105(2009).[26]Lambert J.H.Acta Helveticae physico mathematicoanatomico botanico medica,Band III,128-168,(1758).[27]Corless R.M.et putational Maths.5,329-359(1996).[28]Parshani R.et al.Phys.Rev.Lett.105,048701(2010).FIG.1:(color online)Three types of loopless networks of networks composed offive coupled networks.All have same percolation threshold and same giant component. The darker green node is the origin network on whichfailures occur.FIG.2:(a)The critical fraction p c for different k and n and(b)minimum average degree k min as a function of the number of networks n.The results of(a)and(b)are obtained using Eqs.(5)and(6)respectively and are in good agreement with simulations.In simulations p c was calculated from the number of cascading failures which diverge at p c[28](see also Fig.7in SI).FIG.3:For loopless NON,P∞as a function of p for k=5and several values of n.The results obtained using Eq.(7)agree well with simulations.。
Robustness of complex networks with the local protection strategy against cascading failuresJianwei Wang ⇑School of Business Administration,Northeastern University,Shenyang 110819,PR Chinaa r t i c l e i n f o Article history:Received 22May 2012Received in revised form 21September 2012Accepted 21September 2012Available online 28November 2012Keywords:Cascading failure Complex network BA networkMitigation strategy Power grida b s t r a c tConsidering the role of the neighboring nodes of an overload node,we articulate a local protection strat-egy to address the problem of the optimal defense in the cascading propagation.From two aspects of the global robustness and the different attacks,we numerically demonstrate the effectiveness of this strategy on Barabási–Albert (BA)scale-free networks and the power grid,and show that the robustness of diverse networks against cascading failures can be improved dramatically.And we numerically find the optimal value of the parameter,at which two types of networks can reach the strongest robust level against cas-cading failures.Next,in BA networks we verify this finding by theoretical analysis.Our results may be very useful for constructing the optimal protection strategy in realistic networks and for leading to insights into the mitigation of cascading failures.Ó2012Elsevier Ltd.All rights reserved.1.IntroductionOver the past decade,there has been a lot of research related with the robustness and stability of networks (Albert et al.,2000;Wu et al.,2011;Schneider et al.,2011;Zhang et al.,2012).In par-ticular,great efforts have been dedicated to the research on cascad-ing failures,which has been one of the most central topics in the network safety.In real life,cascading failures induced by targeted attacks and random failures can occur in many natural and man-made systems,and frequently trigger many catastrophic events,e.g.,the largest blackout in US history took place on 14August 2003(Glanz and Perez-Pena,2003),the Western North American blackouts in July and August 1996(Sachtjen et al.,2000),Internet collapse (Pastor-Satorras et al.,2001)caused by congestion,and the large-scale bankruptcy (Wang et al.,2010)witnessed during the recent global economical recession.In fact,in many infrastructure networks,there exists the load on nodes,and the load can be redistributed from one node to other nodes,which may lead to the imbalance of the load on the entire network,and further trigger the cascading propagation.Cascading failures are generally induced by random failures or intentional at-tacks on a few nodes and take frequently place on the single and non-interacting networks.Therefore,earlier studies on cascading failures pay close attention to analyzing the evolving characteristics of cascading failures and mainly focus on the cascading modeling(Wang and Chen,2008;Wu et al.,2008;Chang and Wu,2011;Wang and Rong,2009;Wang et al.,2008),the cascade control and defense strategies (Motter,2004;Schäfer et al.,2006;Simonsen et al.,2008),the attack strategies (Motter and Lai,2002;Zhao et al.,2005;Wang and Rong,2009,2011),the cascading phenomena in the diverse networks (Bao et al.,2008;Gleeson,2008;Zheng et al.,2007),and so ter,many researchers find that catastrophic events induced by cascading failures can also occur in coupled networks,for instance,electrical blackouts in Italy on 28September 2003result from a cascade of failures between the power grid and computer network.Motivated by that fact,Buldyrev et al.(2010)developed a framework for understanding the robustness of interacting networks against cascading failures and present exact analytical solutions for the critical fraction of nodes.After that,cascading fail-ures on coupled networks have started to be studied actively and a number of important aspects of cascading failures in coupled net-works (Vespignani,2010;Parshani et al.,2010;Gao et al.,2012;Brummitt et al.,2012)have been discussed.In all cited studies above,most works on cascading failures from the single network to coupled networks have focused only on the modeling of cascad-ing failure,the cascade control and defense strategies,or a funda-mental property of coupled networks without considering the load.However,there are few works about investigating how by the extra protection strategies of the neighboring nodes of an over-load node to enhance the robustness of complex networks against cascading failures.In fact,in many infrastructure networks,when a node overloads,its neighboring nodes can provide some protec-tion resources to avoid its failure.Therefore we deserve a careful investigation.0925-7535/$-see front matter Ó2012Elsevier Ltd.All rights reserved./10.1016/j.ssci.2012.09.011Tel.:+8602483672631.E-mail address:jwwang@To this end,taking into account the protection strategy pro-vided by the neighboring nodes of an overload node,we propose a new mitigation method.Without changing the total protection capacities of the whole network,we numerically investigate its effectiveness on improving the robustness of BA scale-free net-works(Barabási and Albert,1999)against cascading failures and find that the simple local protection method can dramatically opti-mize the resilience of BA networks.In addition,adopting the mit-igation strategy,we numerically discuss how BA networks can reach the strongest robust level against cascading failures andfind, compared with previous results,the optimal value of the parame-ter decreases.We verify this result by the theoretical analysis.In addition,we examine the effectiveness of the mitigation strategy on improving the robustness of the power grid against cascading failures and give the optimal protection strategy to avoid potential cascading failures.The rest of this paper is organized as follows:in Section2we introduce the protection method.In Section3we numerically demonstrate the effectiveness of the mitigation strategy on improving the network robustness against cascading failures.In Section4the numerical simulations in BA networks are verified by theoretical analysis.Finally,some summaries and conclusions are shown in Section5.2.The mitigation strategyIn general,a simple network can be represented by an undi-rected and unweighted graph G=(V,E),where V is the set of nodes (for instance the stations in a railway transportation system,the substations in the power grid,or the routers in the Internet),and E is the set of undirected and unweighted edges(the lines connect-ing couples of stations,transmission lines connecting two substa-tions,or the cables connecting two routers).Next,we introduce our protection method in detail.In previous studies,the rule that the overload nodes are immediately removed from the network is widely adopted.However,few works discuss this problem:when the load on a node exceeds its capacity, whether there exist some strategies to maintain its normal and efficient functioning to avoid the cascading propagation or not? In fact,in realistic networks,for example in traffic networks,when a traffic intersection saturates,traffic police can ease the traffic flows.Motivated by this case,Wang and Rong(2009)constructed a cascading model of an overload node with the breakdown prob-ability.However,this mechanism with the breakdown probability increases the total price of the whole network.Therefore,without changing the total price of the whole network,how to protect the overload nodes has become one of the key issues in the control and the defense of cascading failures.To this end,considering that the neighboring nodes of an overload node may provide some protec-tion resources to this overload node to maintain its normal and efficient functioning,we propose a local protection method(see Fig.1).In Fig.1,when the load on node i exceeds its capacity,we define the extra capacity D C i;Cireceived by node i from its neigh-boring nodes toD C i;Ci ¼Xm2C ipðC mÀL mÞð1Þwhere C i,C m,and L m represent the set of the neighboring nodes of node i,the capacity of node m to handle the load,and the initial load of node m,respectively.The parameter p represents a random num-ber in0and1,which decides to the strength of the protection re-sources provided by the neighboring nodes.When p=0,the neighboring nodes of the overload node cannot provide the extra capacity,i.e.,without adopting the mitigation strategy.While when p=1,the strongest protection is provided by the neighboring nodes.The expression C mÀL m ensures that node m can handle the initial load on it after providing some protection resources to node i.In this mitigation strategy,we can see that the total price of the whole net-work is not changed.For simplicity,we apply this strategy to a sim-ple cascading model(Wang et al.,2008).In fact,our method can also be applied to other cascading models.Our purpose of this paper is to analyze to what extent this mitigation strategy can enhance the net-work robustness against cascading failures and what is the optimal strategy of the parameter selection after adopting this protection method.Next,we simply introduce the cascading model(Wang et al.,2008).The initial load L i on node i in a network is defined as L i¼k aiwith k i being the degree of node i(i.e.,the link number that node i connects other nodes),where a is a tunable parameter.The capacity C i of node i is defined as C i=(1+b)L i,where the constant b is an adjustable parameter characterizing the tolerance of the net-work against cascading failures.After node i fails,the additional load D L j received by node j,one of its neighboring nodes,is proportional to its initial load L j,i.e.,D L j¼L i L j=ðPm2C iL mÞ,where C i represents the set of the neighboring nodes of node i.According to the protection strategy,at t time,when the load on node i exceeds its capacity, the capacity C i,t of node i can dynamically be adjusted toC i;t¼C i;tÀ1þXm2C ipðC m;tÀ1ÀL mÞð2Þand the capacities of the neighboring nodes of node i can simulta-neously be adjusted toC m2Ci;t¼C m2Ci;tÀ1ÀpðC m2Ci;tÀ1ÀL m2CiÞð3ÞOur aim is to investigate the effect of the capacity adjustment on the network robustness.Here we only focus on the cascading prop-agation induced by removing a single node.A failed node can lead to the load redistribution,and then cascading failures may occur. This process will be repeated until the load of all nodes is less than their capacities,and at this moment,cascading failures can be con-sidered to be completed.We quantify the effectiveness of the mit-igation strategy on improving the network robustness against cascading failures by two measures:the avalanche size S and the proportion P(S).The avalanche size S is defined as:S¼Pi2Ns i=n, where N and n represent the set and the number of all nodes in the network,respectively,and s i represents the number of the breakdown nodes induced by removing node i.The measure P(S) represents the proportion between the number of the protected nodes after adopting the mitigation method and the number of the broken nodes induced before adopting the mitigationstrategy.220J.Wang/Safety Science53(2013)219–2253.Simulation analysis of the mitigation strategyTaking into account the role of the network structure in the cas-cading propagation and the ubiquity of scale-free networks in nat-ural and human-made systems,we firstly investigate the effectiveness of the mitigation strategy on improving the robust-ness of the scale-free networks against cascading failures.The de-gree distribution of the scale-free networks satisfies a power law form:P (k )$k Àc ,where k is the number of links of a randomly cho-sen node in the network and c is the scaling exponent.For simplic-ity,the scale-free network is generated by using the standard Barabási–Albert model (Barabási and Albert,1999).Starting from m 0fully connected nodes,a new node with m (m 6m 0)edges is added to the existing network at each time step according to the preferential attachment.In computer simulations,for all networks,the network size N is equal to 5000,and the parameters m 0and m are equal to 2.Therefore,the average degree h k i is approximately equal to 4.In Fig.2,we compare the average avalanche size S after and be-fore adopting the protection strategy in four cases of a =0.4,a =0.7,a =1.0,and a =1.3.Numerical results are obtained by averaging over 50experiments on 10independent networks.The mitigation areas marked show that the robustness of BA networks against cas-cading failures can be improved dramatically.By computer simula-tions,we observe that the parameter p plays an important role in the effective control of cascading failures,i.e.,the bigger the value p ,the stronger the robustness of BA networks.Therefore,by reason-ably increasing the value p ,we can more effectively protect BA net-works against cascading failures.In addition,we also find that the average avalanche size S after and before adopting the protection strategy shows the threshold-like behaviors marked by the critical threshold b c .The critical threshold b c is widely applied to many cas-cading models (Wang and Chen,2008;Wu et al.,2008;Wang and Rong,2009;Wang et al.,2008;Parshani et al.,2010;Gao et al.,2012)and can quantify the network robustness against cascading failures,that is,the smaller the value of b c ,the stronger the network robustness,and the lower the price of the whole network.There-fore,to maximize the robustness and minimize the cost,according to the role of the value b c ,the aim of many studies is to find the opti-mal value of the parameters in the cascading model,at which the value b c is smallest.In the left sub-figure in Fig.3,according the estimated b c obtained by the minimal value when S <0.002,in two cases of p =0.5and p =0.9,we can observe that BA networks can obtain the strongest robust level against cascading failures when a %0.8,which is different from the optimal value (a =1)without adopting the protection method (Wang et al.,2008)(While in the case of p =0.1,the optimal value a %1).We will verify the re-sults by the latter theoretical analysis.In addition,in the right-fig-ure in Fig.3,we can observe that,as the value a increases,accordingto the proportion P (S ),the improvement of the robustness of BA networks is bigger and bigger.And when b P 0.1(a =0.4),b P 0.088(a =0.7),b P 0.08(a =1.0),and b P 0.076(a =1.3),P (S )>0.99.Next,we focus on the role of the mitigation strategy on improv-ing the network robustness when the diverse types of nodes are at-tacked.We simply apply two attacks,i.e.,attacking the nodes with the highest load (HL)and attacking the ones with the lowest load (LL).In the HL,we attack the nodes in the descending order of their load (if some nodes happen to have the same highest load,we ran-domly choose one of them).While in the LL,we attack the nodes in the descending order of their load (if some nodes happen to have the same highest load,we randomly choose one of them).By the normalized average avalanche size S attack ,we quantify the network robustness after and before adopting the mitigation strategy,ofwhich S attack ¼Pi 2A s i =n A ðn À1Þ,where A ,n A ,and n represent the set and the number of nodes attacked and the number of all nodes in a network,respectively.In computer simulations,for both the HL and the LL,we choose 50nodes as the attacked objects and numerical results are obtained by averaging over 50experiments on 10independent networks.In Fig.4,for the HL and the LL,we ob-serve that the mitigation strategy can dramatically enhance the network robustness against cascading failures and also find that,the bigger the value p ,the stronger the network robustness.In Fig.5,by the proportion P (S ),surprisingly,we find that the effec-tiveness orders of the mitigation method in two attacks are differ-ent,i.e.,as the value a increases,in the LL the protection method is more and more effective,while in the HL,the case is the opposite.In fact,this phenomenon is mainly originated from the effect of the value a on the node capacity.Because the bigger the value a ,the stronger the increased capacity of the nodes with the higher degree than the ones with the lower degree,for the LL,the neighboring nodes (the degrees of these nodes are generally bigger than the node attacked)of the node with the smallest degree attacked can provide the more protection resources,which lead to the results observed in the right sub-figure in Fig.5.While for the HL,the case is on the contrary.Next,taking into account the important role of the infrastruc-ture networks,we apply the protection method to the power grid of the western United States (Watts and Strogatz,1998)with 4941nodes and 6594edges.From two aspects of the global removal and two attacks,we investigate the effectiveness of the mitigation strategy on enhancing the robustness of the power grid against cascading failures.In Fig.6,we also observe that the robustness level of the power grid against cascading failures can obtain the significant improvement and that and the effect of the value p on the cascading propagation.In the left sub-figure in Fig.7,after adopting the mitigation strategy,we examine the cor-relation between the proportion P (S )and the parameter bwhenJ.Wang /Safety Science 53(2013)219–225221222J.Wang/Safety Science53(2013)219–225a=0.4,a=0.7,a=1.0,and a=1.3andfind that as the value a in-creases,the protection method is more and more effective.Andwhen b P0.196(a=0.4),b P0.196(a=0.7),b P0.188(a=1.0), and b P0.18(a=1.3),P(S)>0.99.In the right sub-figure in Fig.7, according the estimated b c obtained by the minimal value whenS<0.002,after adopting the mitigation strategy,we compare thevalue b c in the different value a andfind that when a=0.4and a=0.7the power grid can obtain the stronger robust level against cascading failures.In Figs.8and9,for the HL and the LL,we inves-tigate the effect of the mitigation strategy on improving therobustness of the power grid against cascading failures andfindthe similar results with ones in BA networks.4.Theoretical analysis of cascading modelAfter adopting the mitigation strategy,we analyze the correla-tion between the parameter a and the critical threshold b c in BA networks.Our aim is to seek for the the minimal value b c.There-fore,after node i,we assume the load on its neighboring node j fails to exceed its capacity,thus the extra capacity D C j;Cjreceived bynode j can further protect node j.According to the capacity C jand the extra D C j;Cjof node j,to avoid the cascading propagationinduced by the load redistribution on node i,the neighboring nodej of node i should satisfyL jþD L j<C jþD C j;Cjð4ÞHere,D C j;Cj ¼Xn2C jpðC nÀL nÞ¼Xn2C jpðð1þbÞk anÀk anÞ¼p bXn2C jk anð5ÞSo,the above inequality(4)is represented ask ajþk aik ajXm2C ik am<ð1þbÞk ajþp bXn2C jk anð6ÞNext,by the probability theory and the network structure,wefocus on the mathematical expectations of the expressionsPm2C ik amandPn2C jk an.Taking into account the characteristic ofthe no degree–degree correlation in BA networks,we haveEXm2C ik am!¼X k maxk0¼k mink i Pðk0j k iÞk0a¼X k maxk0¼k mink ik0Pðk0Þk0a¼k i h k aþ1ið7Þwhere P(k0j k i)(In BA network,P(k0j k i)=k0P(k0)/h k i)is the conditionalprobability that node i with the degree k i has a neighbor node withthe degree k0.Similarly,we haveEðXn2C jk anÞ¼X k maxk0¼k mink j Pðk0j k iÞk0a¼X k maxk0¼k mink jk0Pðk0Þk0a¼k j h k aþ1ið8ÞSo,the above inequality(6)is simplified tok aÀ1ih k ih k a ik aÀ1jh k ik ajh k iþp h k a i<bð9ÞAnalyzing the above inequality(9),we can obtain the criticalthreshold b c in three ranges of a<1,a=1,and a>1.J.Wang/Safety Science53(2013)219–225223b c ¼k a À1max h k i h k a þ1i k a À1max h k ik a À1maxh k iþp h k a þ1i a >1h k i h k 2i h k ih k iþp h k 2i a ¼1k a À1minh k i h ka þ1i k a À1min h k ik a À1min h k iþp h k a þ1ia <18>>>><>>>>:ð10ÞHere,k max and k min represent the minimum and maximum de-gree of nodes in a network,respectively.When the value p is equalto 0,the equation has been verified by Wang et al.(2008).Next,for p –0,we first compare the value b c in two cases of a >1and a =1.When a >1,we havek a À1max h k ik a À1max h k i þp h k a þ1i¼h k i h k i þp h k a þ1ik a À1maxð11Þp h ka þ1ik a max¼p1NX N i ¼1k 2i ðk i k maxÞa À1<p h k 2ið12ÞTherefore,according the Eq.(10)and the inequality (12)and thecorrectness of the Eq.(12)when p =0,we can get b c (a >1)>b c (-a =1).Similarly,in the case of a <1,we can also obtain b c (a <1)>b c (a =1).However,in Fig.3,we observe that the optimal value a is about 0.8.The smaller deviation between computer simulations and the-oretical analysis mainly derives from the above approximation in the analytical predictions,i.e.,two nodes i and j connected by other other simultaneously have the minimum degree.In fact,in BA net-works generated by the BA model,according to the evolving mech-anism of the BA model,two nodes with the lowest degree can be not connected by each other.For example,for a BA network with 5000nodes and 9997edges,there is not a connection between two nodes with the minimum degree,which may lead to the differ-ence in comparison.By the Eq.(10),we further analyze the effect of the mitigation strategy on the critical threshold b c .We compare the value b cin224J.Wang /Safety Science 53(2013)219–225two cases of p=0and p–0,correspond to not adopting and adopt-ing the mitigation,respectively.We calculate the value b c,p–0/b c,p=0, i.e.,b c;p–0=b c;p¼0¼k aÀ1maxh k ik aÀ1maxh k iþp h k aþ1ia>1h k ih k iþp h k2ia¼1k aÀ1minh k ik aminh k iþp h k a ia<18>>>><>>>>:ð13ÞFor simplicity,we only calculate the value b c,p–0/b c,p=0in the case of a=1.Wefirst calculate the value h k2i.For a BA network with thefinite size,its degree distribution is P(k)=2m2kÀ3,wherem is equal to k min(here k min¼12h k i).Thus,h k2i in a BA network canbe calculated byh k2i¼Z k maxk min PðkÞk2dk¼Z k maxk min2k2minkÀ1dk¼2k2minðlnk maxÀlnk minÞð14ÞIn BA networks,k max can be calculated by R1k maxPðkÞdk¼1=N,i.e.,Z1 k max 2m2kÀ3dk¼1=N)k max¼ffiffiffiffiNpk minð15ÞSo,we haveh k2i¼k2min lnN¼h k i2lnN4ð16ÞTherefore,when a=1,we can getb c;p–0=b c;p¼0¼44þp h k i lnNð17ÞIn computer simulations,the parameter p,the average degree h k i,and the network size N is0.5,4,and5000,respectively.So,only in the case of p=0.5,we can obtain b c,p=0.5/b c,p=0%0.05545,which shows that the network robustness can dramatically be improved. In addition,we alsofind that the bigger the value p,the smaller the value b c,the stronger the network robustness.5.ConclusionIn summary,by the local dynamical adjustment of the capacity of an overload node,without changing the total price of the whole net-work,we propose a method to effectively protect the overload node to avoid its breakdown.Applying a simple cascading model,we numerically investigate the effectiveness of the mitigation strategy on improving the robustness against cascading failures in BA scale-free networks and the power grid.According to the average ava-lanche size and the proportion between the protected nodes by the mitigation strategy and the failed nodes before adopting the mitigation strategy,wefind that the mitigation strategy can effec-tively enhance the network robustness and obtain the correlation between the network robustness and some parameters.In addition, after applying the mitigation strategy,we obtain the optimal value a,at which both BA networks and the power grid can reach the strongest robust level against cascading failures.We also verify the result in BA networks by the latter theoretical analysis.Consid-ering that the mitigation strategy can be easily applied to many real-life networks,these results may be very useful for guiding the improvement robustness of infrastructure networks and avoiding various cascading-failure-induced disasters in the real world.AcknowledgementsThis work was supported by the National Natural Science Foun-dation of China under Grant Nos.71101022and70801011and the Fundamental Research Funds for the Central Universities under Grant No.N110406003.ReferencesAlbert,R.,Jeong,H.,Barabási,A.-L.,2000.Attack and error tolerance in complex networks.Nature406,378–382.Bao,Z.J.,Cao,Y.J.,Ding,L.J.,Han,Z.X.,Wang,G.Z.,2008.Dynamics of load entropy during cascading failure propagation in scale-free networks.Phys.Lett.A372(36),5778–5782.Barabási,A.-L.,Albert,R.,1999.Emergence of Scaling in Random Networks.Science 286,509–512.Brummitt,C.D.,D’souza,R.M.,Leicht,E.A.,2012.Suppressing cascades of load in interdependent A./10.1073/ pnas.1110586109.Buldyrev,S.V.,Parshani,R.,Paul,G.,Stanley,H.E.,Havlin,S.,2010.Catastrophic cascade of failures in interdependent networks.Nature464,1025–1028. Chang,L.,Wu,Z.G.,2011.Performance and reliability of electrical power grids under cascading failures.Int.J.Elec.Power33(8),1410–1419.Gao,J.,Buldyrev,S.V.,Stanley,H.E.,Havlin,S.,works formed from interdependent networks.Nature Phys.8,40–48.Glanz,J.,Perez-Pena,R.,2003.90s That Left Tens of Millions of People in the Dark, vol.26,New York Times,2003.Gleeson,J.P.,2008.Cascades on correlated and modular random networks.Phys.Rev.E77(4),046117.Motter,A.E.,2004.Cascade control and defense in complex networks.Phys.Rev.Lett.93(9),098701.Motter,A.E.,Lai,Y.C.,2002.Cascade-based attacks on complex networks.Phys.Rev.E66(6),065102,R.Parshani,R.,Buldyrev,S.V.,Havlin,S.,2010.Interdependent networks:reducing the coupling strength leads to a change from afirst to second order percolation transition.Phys.Rev.Lett.105(4),048701.Pastor-Satorras,R.,Vázquez,A.,Vespignani,A.,2001.Dynamical and correlation properties of the Internet.Phys.Rev.Lett.87,258701.Sachtjen,M.L.,Carreras, B.A.,Lynch,V.E.,2000.Disturbances in a power transmission system.Phys.Rev.E61(5),4877–4882.Schäfer,M.,Scholz,J.,Greiner,M.,2006.Proactive robustness control of heterogeneously loaded networks.Phys.Rev.Lett.96(10),108701. Schneider,C.M.,Moreira,A.A.,Andrade Jr.,J.S.,Havlin,S.,Herrmann,H.J.,2011.Mitigation of malicious attacks on A.http:// /10.1073/pnas.1009440108.Simonsen,I.,Buzna,L.,Peters,K.,Bornholdt,S.,Helbing, D.,2008.Transient dynamics increasing network vulnerability to cascading failures.Phys.Rev.Lett.100(21),218701.Watts,D.J.,Strogatz,S.H.,1998.The raw data used in‘‘Collective dynamics of’small-world’networks’’:describing the US power grid.Nature393(6684),440. Vespignani,A.,2010.The fragility of interdependency.Nature464,984–985. Wang,W.X.,Chen,G.R.,2008.Universal robustness characteristic of weighted networks against cascading failure.Phys.Rev.E77,026101.Wang,J.W.,Rong,L.L.,2009.A model for cascading failures in scale-free networks with a breakdown probability.Physica A388(7),1289–1298.Wang,J.W.,Rong,L.L.,2009.Cascade-based attack vulnerability on the US power grid.Safety Sci.47(10),1332–1336.Wang,J.W.,Rong,L.L.,2011.Robustness of the western United States power grid under edge attack strategies due to cascading failures.Safety Sci.49(6),807–812.Wang,J.W.,Rong,L.L.,Zhang,L.,Zhang,Z.Z.,2008.Attack vulnerability of scale-free networks due to cascading failures.Physica A387(26),6671–6678.Wang,W.X.,Yang,R.,Lai,Y.C.,2010.Cascade of elimination and emergence of pure cooperation in coevolutionary games on networks.Phys.Rev.E81,035102,R. Wu,Z.X.,Peng,G.,Wang,W.X.,Chan,S.,Wong,E.E.M.,2008.Cascading failure spreading on weighted heterogeneous networks.J.Stat.Mech.P05013.Wu,J.,Barahona,M.,Tan,Y.J.,Deng,H.Z.,2011.Spectral measure of structural robustness in complex networks.IEEE Trans.Syst.,Man,Cybern.A,Syst., Humans41(6),1244–1252.Zhang,J.H.,Xu,X.M.,Hong,L.,Wang,S.L.,Fei,Q.,2012.Attack vulneralility of self-organizing networks.Safety Sci.50,443–447.Zhao,L.,Park,K.,Lai,Y.C.,Ye,N.,2005.Tolerance of scale-free networks against attack-induced cascades.Phys.Rev.E72(2),025104.Zheng,J.F.,Gao,Z.Y.,Zhao,X.M.,2007.Clustering and congestion effects on cascading failures of scale-free networks.Europhys.Lett.79(5),58002.J.Wang/Safety Science53(2013)219–225225。